paper fast edge-based stereo matching algorithms through ... · ieice trans. inf. & syst.,...
TRANSCRIPT

IEICE TRANS. INF. & SYST., VOL.E85–D, NO.11 NOVEMBER 20021859
PAPER
Fast Edge-Based Stereo Matching Algorithms through
Search Space Reduction
Payman MOALLEM†, Student Member, Karim FAEZ†, Regular Member,and Javad HADDADNIA†, Nonmember
SUMMARY Finding corresponding edges is considered be-ing the most difficult part of edge-based stereo matching al-gorithms. Usually, correspondence for a feature point in thefirst image is obtained by searching in a predefined region ofthe second image, based on epipolar line and maximum dispar-ity. Reduction of search region can increase performances of thematching process, in the context of execution time and accu-racy. Traditionally, hierarchical multiresolution techniques, asthe fastest methods are used to decrease the search space andtherefore increase the processing speed. Considering maximumof directional derivative of disparity in real scenes, we formulatedsome relations between maximum search space in the second im-ages with respect to relative displacement of connected edges (asthe feature points), in successive scan lines of the first images.Then we proposed a new matching strategy to reduce the searchspace for edge-based stereo matching algorithms. Afterward, wedeveloped some fast stereo matching algorithms based on theproposed matching strategy and the hierarchical multiresolutiontechniques. The proposed algorithms have two stages: feature ex-traction and feature matching. We applied these new algorithmson some stereo images and compared their results with those ofsome hierarchical multiresolution ones. The execution times ofour proposed methods are decreased between 30% to 55%, in thefeature matching stage. Moreover, the execution time of the over-all algorithms (including the feature extraction and the featurematching) is decreased between 15% to 40% in real scenes. Mean-while in some cases, the accuracy is increased too. Theoreticalinvestigation and experimental results show that our algorithmshave a very good performance with real complex scenes, thereforethese new algorithms are very suitable for fast edge-based stereoapplications in real scenes like robotic applications.key words: fast edge-based stereo, search spaces reduction, di-rectional derivative of disparity, hierarchical multiresolution
1. Introduction
Stereo vision refers to the ability to infer informationon 3D structures and distances of a scene from at leasttwo images (left and right), taken from different view-points. A stereo system must solve two essential prob-lems: correspondence and reconstruction [1]. The cor-respondence consists of determining which item in leftimage corresponds to which item in right image. It isusually not a good practice to try to find correspondingpoints for all pixels. For example, a point in a uniformregion in one image may correspond to many points ina corresponding region in other image. Thus, feature
Manuscript received September 11, 2001.Manuscript revised February 25, 2002.
†The authors are with the Faculty of Electrical Engi-neering, Amirkabir University of Technology, Tehran 15914,Iran.
points or matching primitives are selected so that anunambiguous match could be resulted [2]. Depth in astereo system is inversely related to disparity, which isthe difference between position of corresponding pointsin left and right image. Disparity of image points formsso-called disparity map, which can be displayed as animage. If geometry of stereo system is known, the dis-parity map can be converted to a depth map of viewedscene. This process is called the reconstruction step inthe stereo algorithms.
The correspondence, which is the most complexstage in stereo algorithms, is classified into three cat-egories: area-based (or correlation based), feature-based, and pixel-based methods [3]. In the area-basedmethods, the elements to be matched are image win-dows of fixed or variable sizes, and similarity crite-rion can be a measure of correlation between the win-dows in two images. This process consists of extract-ing feature points in one image (for instance left one)and finding their corresponding points in other image.Feature-based methods match feature points in left im-age to those in right image, so these methods restrictsearch for the correspondence to a sparse set of featurepoints. Instead of using image windows in area-basedapproaches, they use numerical and symbolic propertiesof features, available from feature descriptors. Feature-based methods use a measure of distance between fea-ture descriptors. In these methods, interpolation isa necessity for computing the depth for non-featurepoints. Pixel-based methods perform the matching ateach pixel, using the measurements at a single pixel. Inthese methods, a dense disparity map can be obtained.
In some stereo vision applications, computationalfast stereo techniques are required, especially for mobilerobots [4], [5], autonomous vehicle [6], [7], virtual real-ity [8] and stereo image coding in 3D-TV [9]. Parallelalgorithms [10], [11], multiprocessors [4], [11] and spe-cial purpose hardware [12] are posed to speed up theprocessing time, but in this paper we are going to dis-cuss about fast algorithms and techniques. Dense depthmap is not often required for many of the fast stereoapplications because its computation is time consum-ing. Often, computation of distance between camerasystem and objects in scene is exclusive goal of thestereo systems. Thus, correspondence search in stereoimages can be reduced to matching of the most fea-

1860IEICE TRANS. INF. & SYST., VOL.E85–D, NO.11 NOVEMBER 2002
ture points or matching primitives [11]. Therefore thecorrespondence includes two stages that are executedsequentially: primitive extraction and matching. Gen-erally, processing time in the matching stage is morethan the primitive extraction, but in fast applicationstwo stages are important, especially when the computa-tions in the matching stage are reduced. Thinned edgepoints as primitives are used most often in fast stereovision [11]–[15] and these stereo techniques are usuallycalled edge-based stereo algorithms. In this paper, wesuggested some fast edge-based stereo algorithms.
After edge extraction and thinning, the matchingis established. Generally to find the matching of eachedge in one image, all pixels in other image must beexamined as the search region. The execution time ofthe matching can be reduced by two approaches: reduc-ing examined points and reducing search space. If allpixels in other image are examined, the execution timeis increased but the accuracy is high too, this methodacts like as area-based [16]. If only the edge pixels areexamined, the execution time is reduced very much andthe accuracy is also reduced [15]. Generally in fast ap-plications, the second method is chosen. The reductionof the search region can reduce complexity of matchingand increase the accuracy. Most stereo matching al-gorithms narrow down number of possible matches foreach feature by enforcing suitable constraints on feasi-ble matches and proper matching strategies, which arediscussed in the next subsections.
1.1 Matching Constraints
In the stereo correspondence, some matching con-straints are generated based on underlying physicalprinciples of world imaging and stereopsis. Some of thecommon constraints incorporated in stereo algorithmsinclude:• Epipolar constraint: Corresponding points must lie oncorresponding epipolar lines. Epipolar lines are definedby intersection of epipolar planes and image plane. Foreach point in a 3D scene, the corresponding epipolarplane is a plane that contains the point and the stereobase line, which is the line connecting the two opticalcenters of the cameras [1].• Disparity limit constraint: Regarding to maximumand minimum of depth and geometry of a stereo system,the maximum disparity range can be estimated [10].• Ordering constraint: A left-right ordering relation-ship between two pixels in left image should have thesame ordering correspondence pixels as in right image.In other words, matched primitives must occur in thesame left to right orders along epipolar lines [17].• Uniqueness constraint: Correspondence should beunique. In other words, each feature can have at mostone match [17].• Figural continuity constraint: Disparity along an edgecontour changes smoothly, so there should be no dispar-
ity discontinuities along a contour. Moreover disparityallowed to abruptly changing across the contours [18].• Limit of directional derivative of disparity: Maximumof directional derivative of disparity is limited, so thisvalue between matched primitives is restricted [19]. Thedirectional derivative of disparity is often incorrectlycalled the disparity gradient [20].
The epipolar constraints reduce the search regionfrom the whole of the second image (two-dimensionalspace) to the epipolar line (one-dimensional space) [1].Moreover, the disparity limit narrows down the one-dimensional search from the full search to a limitedspace [10]. In some special case, ordering constraintcan also reduce the search region [17]. Moreover, prob-ability density function of directional derivative of dis-parity can be used to reduce the search space in a dis-parity surface search technique [21] and edge matching[22], considering some geometric parameters of stereosystems. The uniqueness constraint [1], the figural con-tinuity constraint [18] and the limit of the directionalderivative of disparity are used to detect false matchesand to correct them [23].
1.2 Matching Strategy
Besides the constraints and consistency checks, severalcontrol strategies have been proposed by many to fur-ther reduce the search region and the ambiguity, andto enhance stereo matching performances. Some of thecommon and popular ones are:• Coarse to fine strategy: In a coarse to fine strategy,information obtained at a coarse scale is used to guideand limit the search for the matching of finer scale prim-itives or feature points. In this approach, an initialmatching begins at a coarse scale where feature den-sity is low due to scale change. This reduction in thefeature density reduces the search space, which in turnmakes the matching easier and faster, but not necessar-ily more accurate, because localization at coarse scaleis less accurate. Such multistage strategy can be usedwith scale specific primitive representation and can beincorporated into the area-based, the feature based,and the pixel based correspondence techniques. Thesetechniques are classified into two categories: Initial esti-mation at lowest scale called multiresolution and initialestimation at finest scale. In the multiresolution strate-gies, the initial matching begins at the lowest scale andthen extended to finer ones [2]. This approach can beapplied in both temporal space [24], [25] (gray level) andfrequency space. Usage of the hierarchical Gaussian ba-sis functions [3] (in temporal space) and complex mul-tiwavelets [26] (in both temporal and frequency space)are common techniques in stereo vision. In the finestscale method, the disparity estimation of large blocksin the fine level is used as initial estimation of dispar-ity for the entirety of blocks, and then the disparity iscalculated within each block accurately [27], [28].
MOALLEM et al.: FAST EDGE-BASED STEREO MATCHING ALGORITHMS THROUGH SEARCH SPACE REDUCTION1861
• Structural and hierarchical multi primitives: In hi-erarchical and structural stereo approaches, semanti-cally rich primitive representations like regions, linesand edge segments are derived from an image andmatched. Relational properties are used besides spec-tral properties in the structural methods to reduce thesearch space and to disambiguate the stereo matching[2]. In hierarchical systems, the matching takes placebetween more than one level of image descriptions. Inthese methods, the reduction in feature density and soin search space is achieved through an abstraction ofhigher level structures without a scale change [17], [29].
None of these strategies uses the stereo constraintsto reduce the search region, but we will introduce uti-lization of a threshold on the directional derivative ofdisparity to do so. Hereinafter, we use sometimes theDDD for the directional derivative of disparity. In nextsection, we briefly discuss DDD, its concept and appli-cation in some stereo methods. Then we will formulatea reduction of the search region in the stereo matchingof connected non-horizontal edge points in successivescan lines. Then we will develop a very fast stereo cor-respondence strategy based on this new formulation forthe connected non-horizontal edge points as primitives.This strategy can be used with other primitives andmethods. Finally, we will propose some very fast edge-based stereo algorithms and discuss about their results.
2. Basics of DDD
2.1 Definitions
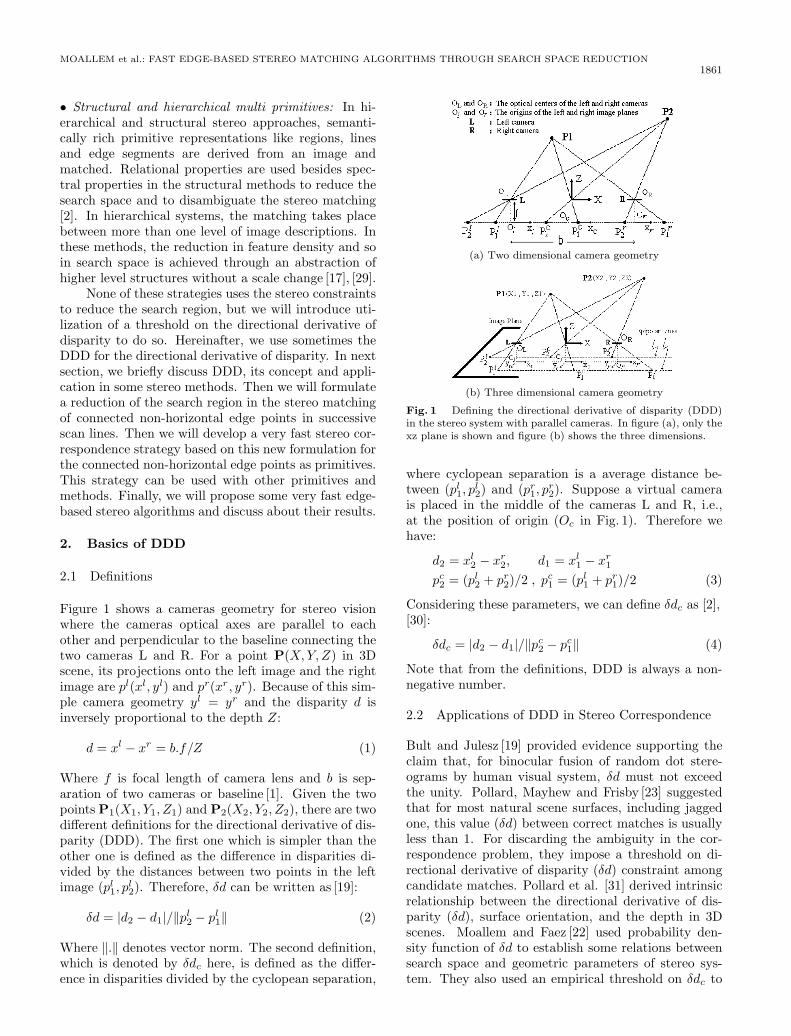
Figure 1 shows a cameras geometry for stereo visionwhere the cameras optical axes are parallel to eachother and perpendicular to the baseline connecting thetwo cameras L and R. For a point P(X,Y, Z) in 3Dscene, its projections onto the left image and the rightimage are pl(xl, yl) and pr(xr , yr). Because of this sim-ple camera geometry yl = yr and the disparity d isinversely proportional to the depth Z:
d = xl − xr = b.f/Z (1)
Where f is focal length of camera lens and b is sep-aration of two cameras or baseline [1]. Given the twopoints P1(X1, Y1, Z1) and P2(X2, Y2, Z2), there are twodifferent definitions for the directional derivative of dis-parity (DDD). The first one which is simpler than theother one is defined as the difference in disparities di-vided by the distances between two points in the leftimage (pl
1, pl2). Therefore, δd can be written as [19]:
δd = |d2 − d1|/‖pl2 − pl
1‖ (2)
Where ‖.‖ denotes vector norm. The second definition,which is denoted by δdc here, is defined as the differ-ence in disparities divided by the cyclopean separation,
(a) Two dimensional camera geometry
(b) Three dimensional camera geometry
Fig. 1 Defining the directional derivative of disparity (DDD)in the stereo system with parallel cameras. In figure (a), only thexz plane is shown and figure (b) shows the three dimensions.
where cyclopean separation is a average distance be-tween (pl
1, pl2) and (p
r1, p
r2). Suppose a virtual camera
is placed in the middle of the cameras L and R, i.e.,at the position of origin (Oc in Fig. 1). Therefore wehave:
d2 = xl2 − xr
2, d1 = xl1 − xr
1
pc2 = (p
l2 + p
r2)/2 , p
c1 = (p
l1 + p
r1)/2 (3)
Considering these parameters, we can define δdc as [2],[30]:
δdc = |d2 − d1|/‖pc2 − pc
1‖ (4)
Note that from the definitions, DDD is always a non-negative number.
2.2 Applications of DDD in Stereo Correspondence
Bult and Julesz [19] provided evidence supporting theclaim that, for binocular fusion of random dot stere-ograms by human visual system, δd must not exceedthe unity. Pollard, Mayhew and Frisby [23] suggestedthat for most natural scene surfaces, including jaggedone, this value (δd) between correct matches is usuallyless than 1. For discarding the ambiguity in the cor-respondence problem, they impose a threshold on di-rectional derivative of disparity (δd) constraint amongcandidate matches. Pollard et al. [31] derived intrinsicrelationship between the directional derivative of dis-parity (δd), surface orientation, and the depth in 3Dscenes. Moallem and Faez [22] used probability den-sity function of δd to establish some relations betweensearch space and geometric parameters of stereo sys-tem. They also used an empirical threshold on δdc to

1862IEICE TRANS. INF. & SYST., VOL.E85–D, NO.11 NOVEMBER 2002
restrict the search region for matching edge points [32]–[34]. Li and Hu [30] used δdc as a basis for a unified co-operative stereo matching. They selected some familiesof neighborhood support functions based on δdc.
2.3 Some Properties of DDD
In the previous subsection, there was some discussionabout the empirical threshold on DDD. The empiricalinvestigation showed that the threshold on DDD couldbe considered to be less than 2, admitting a little error.The threshold value of 1.0 [19], [23] for δd and 1.1 [30]and 1.2 [33] for δdc were already reported. We want torestrict the search region for matching the edge points,based on the DDD threshold. The definition of δd issimpler but it has no upper limit. In fact δd can bevaried theoretically between 0 to ∞. Considering theordering constraint in stereo vision, it can be shownthat δdc has a bounded value. In fact, δdc > 2 can beinterpreted as a violation of ordering constraint [30],[33]. We like to show that in a normal condition of astereo system like human vision (in which the baselineis about 5.5 cm and the depth is varied between 20 cmto 450 cm), the condition of δdc < 1.2 results in ac-cepting an error less than 2%. Therefore we used thiscondition to restrict the search region. On the otherhand, the upper limit of 2 for δdc is sometimes used inour suggestion to guarantee a valid full search region.
Now, we are looking for a 3D surfaces whichyield δdc = 1.2. Given two points P1(X1, Y1, Z1) andP2(X2, Y2, Z2) in the 3D coordinates, the value of δdc
can be described as [30]:
δdc =b.|Z2 − Z1|√
(Z1X2 − Z2X1)2 − (Z1Y2 − Z2Y1)2(5)
When Y1 = Y2 = 0, Eq. (5) reduces to:
δdc =b.|Z2 − Z1|
|Z1X2 − Z2X1| ≈b
Z1| tan θc| (6)
Where θc is the slope with respect to X-axis and tan θc
is the slope of the small surface patch connecting P1
and P2. In fact, tan θc can be varied between −∞ to+∞, thus |θc| is between 0◦ and 90◦. We shall examinea simple situation in which Y1 = Y2 = 0. If δdc = 1.2,b = 5.5 cm and Z1=55 cm, then | tan θc| = 12.0, whichindicate that the small surface patch or |θc| is 85.2◦, asurface almost along the line of sight. Now, supposethat Z1 is varied between 20 cm to 450 cm, by integrat-ing θc over Z1, the condition δdc = 1.2 causes the meanof |θc| become 88.1◦. Consider |θc| has a uniform dis-tribution between 0◦ and 90◦, so in this example theerror is less than 2% according to δdc ≤ 1.2. Increasingthe maximum of Z1 means that |θc| approaches to 90◦therefore the error reduces. On the other hand, in ourcomputations the limit on δdc is considered between 1.2and 2, so the corresponding error becomes less.
The value of δdc can be used to define various
stereo matching constraints, which were explained inSect. 1.1. A brief summary follows [30], [32], [33]:• δdc > 2 - Violation of non-reversal order constraint.• δdc = 2 - Violation of uniqueness constraint.• δdc < 1.1 or 1.2 - Empirical limit of DDD, the direc-tional derivative of disparity.• δdc � 1 - Figural continuity constraint.
In the next subsection, we discuss the restrictionof the search region for matching edge points, basedon δdc empirical limit (δdc < 1.2) and its upper reallimit (δdc < 2) [32], [33], and then propose a fast stereomatching strategy [33], [34]. Then we combine thisstrategy with hierarchical multiresolution techniques toimprove the performances and obtain some fast stereomatching algorithms.
3. Restriction on the Search Region throughthe DDD Limit
In this subsection, we are going to restrict the searchregion based on the δdc limit, for edge based stereomatching. Therefore, we obtain the relationship be-tween δdc and the search space in stereo correspon-dence. If we substitute the relation 3 into Eq. (4), wehave:
δdc =2|(xl
2 − xr2)− (xl
1 − xr1)|
‖ (pl2 + p
r2)− (pl
1 + pr1) ‖
(7)
We can define ∆xl and ∆xr as the difference betweenthe x position of p2 and p1 in left and right images. Onthe other hand, we obtain:
∆xl = xl2 − xl
1 , ∆xr = xr2 − xr
1 (8)
So δdc can be changed to:
δdc =2|∆xl −∆xr |√
(∆xl +∆xr)2 + (∆yl +∆yr)2(9)
Suppose we want to find the correspondence of twopoints in successive scan lines, therefore we have ∆yl =∆yr = 1, so we have:
δdc =2|∆xl −∆xr |√
(∆xl +∆xr)2 + (2)2(10)
As we discussed before, in a typical stereo systemlike human vision, a reasonable limit of δdc is about1.2, so we assume that δdc < 1.2. By substituting inEq. (10), we can solve the resulting non-equality:
0.64∆x2l + 0.64∆x
2r − 2.72∆xl∆xr − 1.44 ≤ 0 (11)
Suppose the feature points in left image are connectednon-horizontal edge points in subsequent scan lines. Ifwe know the value of ∆xl in the left image, we canrestrict ∆xr in the right image. Five cases are investi-gated: ∆xl = 0, ∆xl = ±1 and ∆xl = ±2. For examplein case of ∆xl = 0 we have, −1.5 ≤ ∆xr1.5 ≤. Thismeans that for two connected edge points in the sub-sequent scan lines of left image which have the same

MOALLEM et al.: FAST EDGE-BASED STEREO MATCHING ALGORITHMS THROUGH SEARCH SPACE REDUCTION1863
Table 1 Relation between ∆xl,∆xr and extended range of δdc.
∆xl Rounded range of ∆xr extended range of δdc
−2 −9,−8,−7,−6,−5,−4,−3,−2,−1, 0 −1.41 < δdc < 1.25−1 −5,−4,−3,−2,−1, 0, 1 −2 < δdc < 1.260 −2,−1, 0, 1, 2 −1.41 < δdc < 1.411 −1, 0, 1, 2, 3, 4, 5 −1.26 < δdc < 22 0,1,2,3,4,5,6,7,8,9 −1.25 < δdc < 1.41
position in x direction, by context of δdc < 1.2, themaximum allowable range of ∆xr will be 1.5 pixels inthe right image.
Table 1 shows the relationship between ∆xl and∆xr for the above five cases. Since the number of pix-els can not have fractional part, we rounded ∆xr andthen we have extended the range of δdc. Third columnof Table 1 shows the extended value of δdc in both neg-ative and positive limits. In all cases, the conditionof δdc < 1.2 is met and even in some cases (negativelimit for ∆xl = −1 and positive limit for ∆xl = +1),the maximum allowable range of δdc for non-reversalordering constraint is achieved. In the next section,we propose a new fast matching strategy based on thisrestriction in the search region.
4. Fast Edge-Based Stereo Matching Strategy
In a calibrated stereo system with parallel optical axes,the area-based or the feature-based algorithms consistof two stages: feature point (or primitives) extractionand stereo matching [1]. Most of fast stereo algorithmsuse low-level primitives like edges, those that do notrequire sophisticated semantic analysis in their extrac-tion [35]. Matching the horizontal edges in a stereo sys-tem with parallel optical axes is a problem [36], so someauthors suggested non-horizontal edge points as featurepoints [14], [21], [32]–[34], [37]. In a correlation basedframework, stereo matching for a pixel in a referenceimage (left) is obtained by searching in a predefinedregion of the second image (right).
Our stereo algorithms have two stages, feature ex-traction and feature matching. In the feature extractionstage, non-horizontal thinned edge points are extractedfrom the both of left and right image. The extractededge points are first classified into two groups, posi-tive and negative, depending on the graylevel differ-ence between the two side of the edge point in x di-rection. The feature extraction stage will be explainedaccurately later. To explain the matching strategy ofthe extracted edge points, we would define a temporaryconcept which, is related to the extracted edge points.We call it successive connected edge points set or ab-breviately SCE.
4.1 Successive Connected Edge Points
Some connected edge points in a left image can begrouped together as some sets that we call successive
connected edges points (SCE) sets. Each SCE set ψconsists of n successive edge points:
ψ = {pl1, p
l2, . . . , p
ln} (12)
Its coordinates and type identify each edge point likepl
k
plk = (x
lk, y
lk, type) (13)
The set ψ is said a successive connected edges set ifthese three conditions are met:(1) The types of all pl
k are the same.(2) The successive pl
k’s are in successive scans lines. Onthe other hand we have:
ylk+1 − yl
k = 1 (14)
(3) The absolute difference between x values of twosuccessive points is less than 3 pixels, so we have:
xlk+1 − xl
k = {−2,−1, 0,+1,+2} (15)
Two samples of successive connected edges with 38points are shown in Figs. 3 (a) and 3 (b).
4.2 Search Space in the Edge Matching
Suppose that we want to find correspondences of edgepoints of a sample SCE set in a left image. Consideringthe limit of δdc and the connectivity of the edge pointsin a SCE set, if a value of ∆xl is known, ∆xr range canbe computed directly by Table 1.
For example consider pli−1 and p
li are two succes-
sive edge points in a sample SCE set and AR is the cor-respondence of pl
i−1 in the right image (see Figs. 2 (a)and 2 (b)). Considering Eq. (8), ∆xl is the differ-ence between the x position of pl
i and pli−1 in the left
(∆xl = xli −xl
i−1). For finding BR (the correspondenceof pl
i) in the right image, the search space region or ∆xr
range can be computed by Table 1. This search regionin the right image (Xr
Range) is shown in Fig. 2 (b). Con-sidering d = xl
i−1−xrA and ∆xr = xr
A−XrRange, X
rRange
as the search space in the right image coordinate sys-tem, can be computed as:
XrRange = ∆xr + xl
i−1 − d (16)
In Fig. 2, ∆xl is considered to be −1 so the ∆xr range is{−5,−4,−3,−2,−1, 0,+1}, therefore the search regionis restricted to 7 pixels only. The search region is alsoshown in Fig. 2 (b).
4.3 SCE Set Construction and Matching
In a process of the edge matching, the edge points ofthe left image are divided into two groups, checked andunchecked edge points. The checked edges are thoseedge points that were already examined in the processand the unchecked edges are those that are not exam-ined yet. In the following edge matching strategy, the

1864IEICE TRANS. INF. & SYST., VOL.E85–D, NO.11 NOVEMBER 2002
(a) A part of SCE (b) Search region for BR
Fig. 2 An example for the search space in the edge matching.Figure (a) is part of a sample SCE set in the left image, pl
i−1
and pli are two successive edge points and ∆xl is the difference
between their x positions. In figure (b), the search region forfinding BR is shown as the ∆xr range, and the epipolar line forBR is also shown with dotted line.
(a) Left (b) Right (c) Restricted region
Fig. 3 An example of search space in the proposed matchingstrategy, the edge points are shown black. Figure (a) is the SCEset in the left image, (b) is the correspondences of the left edgepoints in the right image based on the epipolar line and finally(c) is the restricted search region in the right image. The searchregion is also marked gray.
SCE set constructing for edge points of left image andestablishing correspondence are implemented concur-rently. At first, all of edge points in a left image aremarked as unchecked. The proposed matching strategycan be expressed briefly in two phases as follows:• Phase I: Find the next unchecked edge in the left im-age by systematic scan, from the left to right and fromthe top to bottom. The found edge is considered as pl
1,the first point of the corresponding SCE set. ConsiderXr
Range in the right image coordinate as a full searchregion based on epipolar line and other constraints. Seti = 1 and go to phase II.• Phase II:(1) Find the correspondence of pl
i in the right image,BR (see Fig. 2 (b)) based on Xr
Range and mark pli as
checked edges. If BR is not found, go to phase I.(2) Compute d = xl
i − xrB (Eq. (3)).
(3) Find pli+1, the next point of p
li in the corresponding
SCE set based on the three conditions of SCE sets inSect. 4.1 and go to next step. If pl
i+1 is not found, goto phase I.(4) Compute ∆xl = xl
i+1 − xli (Eq. (8)).
(5) Compute ∆xr range based on Table 1.(6) Compute Xr
Range = ∆xr + xli−1 − d (Eq. (16)).
(7) Set i = i+ 1 and got to the first step.
4.4 An Example
One sample SCE set with 38 points in a 40 × 36 im-
age is shown in Fig. 3 (a) as the left image. Consideringthe epipolar line, Fig. 3 (b) (as the right image) showsthe correspondence of each edge points of Fig. 3 (a).Considering the proposed matching strategy, the searchspace in the right image for the matching of the leftSCE set is also shown in Fig. 3 (c). For the first pointin the SCE set, the full search space is considered onthe epipolar line, but for other points, the search spacesare restricted based on the above discussion. Effect ofreduction in a search space is more evident for largerimage dimensions.
In the next section, we propose some fast edge-based stereo matching algorithms based on this newand fast matching strategy and compare the resultsfrom point of view of the execution time and accuracywith those of other fast edge-based stereo matching al-gorithms.
5. Fast Edge-Based Stereo Matching Algo-rithms
The matching primitives, the strategy and the match-ing criterion are three essential parameters in the fastedge-based stereo matching algorithms. We considerthese parameters in our proposed algorithms. Most offast stereo algorithms use non-horizontal edge pointsas features or matching primitives. As we mentionedbefore, we use SCE sets in our fast stereo algorithms.
5.1 Detection of Thinned Non-horizontal Edge Points
At the first, non-horizontal edge extraction is per-formed and thinned edge points are classified intotwo groups, positive and negative, depending on thegraylevel difference between the two sides of the edgepoints in x direction. Left and right images are con-volved with a proper gradient mask. To detect non-horizontal edge points, we use a gradient of two-dimensional Gussian function with σ = 1 in x directionas the gradient mask. This mask is truncated to 5× 5.A non-horizontal thinned positive edge in a left image,is localized to a pixel that the filter response or ρl(x, y)has to exceed a positive threshold ρ+◦ and has to obtaina local maximum in x direction, therefore [35]:
ρl(x, y) > ρ+◦ ←Threshold
ρl(x, y) > ρl(x− 1, y) ρl(x, y) > ρl(x+ 1, y) � ←LocalMaximum
(17)
The positive threshold ρ+◦ is considered pre-defined orcan be selected based on the filter response dynamically.Consider ρ+
mean is the mean of positive values of thefilter response, we choose ρ+
◦ = 1.5ρ+mean, the coefficient
of 1.5 is selected empirically.The extraction of non-horizontal negative thinned
edge points is similar to positive one. Consider ρ−mean
is the mean of negative values of the filter response,

MOALLEM et al.: FAST EDGE-BASED STEREO MATCHING ALGORITHMS THROUGH SEARCH SPACE REDUCTION1865
the negative threshold value is ρ−◦ = 1.5ρ−mean. Non-horizontal thinned negative edge points in a left imagecan be defined as points with these properties:
ρl(x, y) < ρ−◦ ←Threshold
ρl(x, y) < ρl(x− 1, y) ρl(x, y) < ρl(x+ 1, y) � ←LocalMinimum (18)
5.2 The Matching Strategy
Search space reduction is very important to decreaseprocessing time of matching. In the proposed SCE setsconstruction and matching strategy, from the secondpoint up to end point of SEC sets, we could effectivelyreduce the search space for establishing the correspon-dence. On the other hand, considering a SEC set ina left image as ψ = {pl
1, pl2, . . . , p
ln}, the search space
can be reduced for the points of pli (i = 2, 3, . . . , n)
but for the first point that is found in the first phaseof proposed matching strategy, i.e. pl
1, we use the hi-erarchical multiresolution matching one to reduce thesearch space.
The hierarchical multiresolution matching strategyis a powerful tool to reduce the search space. Thismatching strategy belongs to a coarse to fine strategy.In this approach, several levels of image pyramid aremade. This technique can be used to reduce a fullsearch space to a limited region. Generally, stereo im-ages are reduced by a convolution with a proper Gus-sian filter and subsampled by factor of two along eachaxis, to form a pyramid. Each pair of slices from thisstereo pyramid is separately processed starting with thecoarsest (most reduced) pair and produced the dispar-ity maps. At each level, the disparity map of previouslevel is used to reduce the search space [24].
In the edge-based stereo, edge extraction is usuallydone at the finest level only. Then a series of coarserresolution edge’s images is generated by series of re-duction in size of finest edge images by factor of two.To establish the correspondence at the coarsest level,the full search space is usually selected. To decreasethe processing time of matching in the fast edge-basedstereo, for one edge point in the first image, only sim-ilar edge points in the other image are usually tested.However, non-edge points can be examined after testingthe edge point. In this case, the matching rate increasesbut the execution time is decreased too.
In our stereo matching algorithms, the searchspaces are reduced by both of the hierarchical multires-olution algorithm (for the first point of SCE sets) andour restricted search region one (for other points of SCEsets). We claim that our proposed restricted search re-gion algorithm is more powerful than hierarchical mul-tiresolution one. Therefore we should try to use ourproposed restricted search region algorithm more of-tenly than the hierarchical multiresolution one. In theedge-based stereo, as we mentioned before, usually the
edge pixels are examined in the search space, but inour proposed edge-based algorithms, we use a differentstrategy. At first, we examine only the similar edgepixels, but if we can not find the correspondence in thesearch space, we try other non-edge pixels in the searchspace. Therefore, we increase probability of the match-ing for the second point, up to end points of SCE sets.For each edge that the correspondence is established,we update the disparity map in coarse and mediumlevel, beside the fine level. This can help us to estab-lish correspondence of the first point of SCE set faster.
5.3 The Matching Criteria
Most currently used fast stereo methods belong to thecategory of linear correlation methods, which includethose based on sum of squared differences (SSD) andnormalized cross correlation (NCC) [38]. In a realstereo system in which left and right cameras are dif-ferent, NCC is preferable since it is invariant to lin-ear brightness and contrast variations between perfectmatching windows. The value of NCC is between −1and +1, and a larger value indicates more similarity be-tween windows [16]. The window size in the correlation-based methods is very important. As a window size de-creases, discriminatory power of window based criterionis decreased and some local maximums in NCC couldhave been found in search region. Moreover, continu-ally increasing the window size causes the performanceto be degraded because of the occlusion regions andsmoothing of disparity values across the depth bound-ary [16]. If a disparity search range could be automat-ically reduced to an effective range (about 10 pixels)then several local maximums in NCC would be elimi-nated form the selection process and therefore, the dis-parities found would be correct, even if the size of thematching block is small [27].
In our proposed algorithms, for the first pointof SCE sets, the hierarchical multiresolution matchingstrategy is used. Therefore the window sizes of NCCare selected corresponding to the image size of the pyra-mid level. Since we could effectively reduce the searchspace for other points of SCE sets, we use NCC withwindow size of 3× 3 as similarity measure.
6. Implementation and Results
For the first point of a SCE set, we use hierarchicalmultiresolution algorithm and for other points of thatSCE set, the restricted search region method based onour matching strategy is used. For the first point, weexamine the two approaches that we called HMEO andHMNE (HM means hierarchical multiresolution). InHMEO, only edge points are examined in each pyramidlevel but in HMNE, if the correspondence can not befound by examining the edge pixels, non-edge pointsare also tried. For the non-first points of SCE sets, as

1866IEICE TRANS. INF. & SYST., VOL.E85–D, NO.11 NOVEMBER 2002
we mentioned before, we use NCC with window size of3×3 and, the threshold value of 0.7. Therefore we havea method for the non-first points that we called it RS(RS means restricted search region). Hence we haveproposed two algorithms: RS-MHEO and RS-HMNE.
We compare results of our algorithms with thoseof fast edge-based, hierarchical multiresolution meth-ods, HMEO and HMNE. To reduce the execution timein these methods, NCC with window size of 5 × 5 areused for the coarsest level and 3 × 3 for the other lev-els. Moreover, the NCC threshold value of 0.7 is se-lected for all pyramid levels. For comparing the resultsof the execution time, we chose a reference methodthat we called FSEO (Full Search, Edge only). Thisfeature-based method finds the correspondence of non-horizontal edge points of left image by examining all ofthe similar edge points in the epipolar line of right im-age. As the similarity criterion, NCC with window sizeof 11× 11 and the threshold value of 0.8 were selected.
These algorithms were tested on four differentstereo scenes, House, Renault, Ball and Pentagon [39].All the scenes used are gray levels 256 × 256 and theirdisparity ranges are shown in Table 2. To determine theerror in the matching stage of the algorithms, we com-pute the accurate disparity map for the non-horizontaledge points of the left images by searching in the pre-defined region of the right images based on Table 2 andNCC with window size of 15× 15. The errors in thesecomputed disparity maps are corrected manually.
The codes of the algorithms were written by Wat-com C and implemented by a PC under Windows op-erating system, with a Pentium II 450MHz processor.As we mentioned before, our stereo algorithms have twostages, feature extraction and feature matching. There-fore at first the results of implementation of these twostages are investigated separately and then the execu-tion times of the whole algorithms are introduced.
6.1 Feature Extraction
The edge point extraction stage of all algorithms is thesame. Table 3 shows the results of the edge point ex-traction stage on the stereo scenes. In this table, thenumber of extracted edge points including positive andnegative type (p for positive and n for negative) in theleft and right images and the corresponding executiontimes (in milliseconds) are also shown.
The extracted edge points for House, Renault, Balland Pentagon stereo scenes are shown in Figs. 4 to 8respectively (part (c) and (d)). In these figures thered and blue colors are used to show the positive andnegative edge points respectively.
6.2 Feature Matching
For House scene, the results of the investigated algo-rithms are shown in Table 4. Considering the total
Table 2 Disparity ranges of the tested scenes.
Disparity House Renault Ball PentagonMinimum +35 0 −30 −10Maximum +60 +10 0 +10
Table 3 Implementation results of the edge point extractionon the stereo scenes, in last column, ET means execution time.
Scene Left Edges(p,n) Right Edges(p,n) ET(msec.)House 734(385,349) 731(343,388) 81.6Ren. 3012(1466,1546) 3058(1462,1596) 84.4Ball 3925(1903,2022) 4005(1939,2066) 84.6Pent. 6459(3321,3138) 6690(3482,3208) 87.6
Table 4 Implementation results on House scene. 734 non-horizontal edge points are extracted from the left image. ETcolumn shows execution time in milliseconds.
Algorithm Matched(%) Failed(%) Error(%) ETFSEO 729(99.3%) 5(0.7%) 47(6.4%) 35.4HMEO 696(94.8%) 38(5.2%) 46(6.3%) 10.2HMNE 728(99.2%) 6(0.8%) 48(6.5%) 11.0
RS-HMEO 726(98.9%) 8(1.1%) 0(0.0%) 5.5RS-HMNE 732(99.7%) 2(0.3%) 1 (0.2%) 5.8
number of extracted features from the left image thatare shown in Table 3, the number of the matched edges,failed edges and error in matching are shown in thematched, failed and error columns respectively. Thematched and failed columns in Table 4 show the num-ber of features which are matched and failed in theedge matching process. Therefore, the sum of these twocolumns should be the total number of extracted fea-tures from the left image. The percentages of matchedand failed features, with respects to the total numberof the left features are also shown in the parentheses.Considering the accurate disparity map for the featurepoints, the error of the matching stage can be com-puted. The error column shows this error and, the per-centages of the error with respect to the total extractedleft features are shown in the parenthesis too. ET (orexecution time) column is in millisecond scale. Tables 5through 7 show the results of the matching and the ex-ecution times of the algorithms on Renault, Ball andPentagon stereo scenes, respectively.
Figure 4 shows the implementation results onHouse stereo scene. This figure shows the left and rightimages ((a) and (b)), the extracted features includingnon-horizontal edge points((c) and (d)), negative andpositive type edges and the disparity maps obtained bythe algorithms ((e) through (i)). In the disparity mapfigures ((e) through (i)), the failed edges and the er-ror in the matching are shown with magenta and blackcolor respectively. Figures 5 through 7 show the corre-sponding disparity maps and other results those com-puted by the algorithms, on Renault, Ball and Pen-tagon stereo scenes respectively.

MOALLEM et al.: FAST EDGE-BASED STEREO MATCHING ALGORITHMS THROUGH SEARCH SPACE REDUCTION1867
6.3 Execution Time of the Algorithms
In a complete matching algorithm, processing time in-cludes feature extraction time plus matching time. Ta-ble 8 shows the execution time of the algorithms in-
Table 5 The implementation results on Renault scene. 3012non-horizontal edge points are extracted from the left image.
Algorithm Matched(%) Failed(%) Error(%) ETFSEO 2729(90.6%) 283(9.4%) 60(2.0%) 424.4HMEO 2537(84.2%) 475(15.8%) 155(5.2%) 60.4HMNE 2844(94.4%) 168(5.6%) 172(5.7%) 79.2
RS-HMEO 2573(85.4%) 439(14.6%) 118(3.9%) 33.0RS-HMNE 2903(96.4%) 109(4.6%) 158(5.3%) 36.2
Table 6 The implementation results on Ball scene. 3925 non-horizontal edge points are extracted from the left image.
Algorithm Matched(%) Failed(%) Error(%) ETFSEO 2879(72.6%) 1046(26.6%) 721(18.4%) 587.6HMEO 2725(69.4%) 1200(30.6%) 743(18.9%) 99.0HMNE 3041(77.5%) 884(22.5%) 800(20.4%) 146.0
RS-HMEO 2575(65.6%) 1351(34.4%) 627(16.0%) 71.4RS-HMNE 3061(78.0%) 867(22.0%) 786(20.0%) 100.2
Table 7 The implementation results on Pentagon scene. 6459non-horizontal edge points are extracted from the left image.
Algorithm Matched (%) Failed (%) Error (%) ETFSEO 3250(50.3%) 3209(49.7%) 48(0.7%) 1177.6HMEO 4379(67.8%) 2080(32.2%) 156(2.4%) 161.6HMNE 5646(87.4%) 814(12.6%) 255(3.9%) 288.8
RS-HMEO 4310(66.7%) 2149(33.3%) 233(3.6%) 95.6RS-HMNE 5575(86.3%) 884(13.7%) 314(4.9%) 140.6
Fig. 8 The execution times of five considered algorithms onthe tested stereo scenes are shown, the edge extraction and edgematching time are distinguished by gray and black columns re-spectively. The edge extraction time is nearly independent ofthe scenes, but the edge matching time is very dependent to thescenes. For FSEO algorithm, this time is varied between 117.0to 1264.2 milliseconds. In all cases, execution time of RS-HMEOand RS-HMNE are less than HMEO and HMNE.
Table 8 Execution time of the algorithms in milliseconds, the first item in parenthesesis the edge matching time and the second one is the edge extraction time.
Algorithm House Renault Ball PentagonFSEO 117.0 (35.4 + 81.6) 508.8 (424.4 + 84.4) 672.2 (587.6 + 84.6) 1264.2 (1176.6 + 87.6)HMEO 91.8 (10.2 + 81.6) 144.8 (60.4 + 84.4) 183.6 (99.0 + 84.6) 249.2 (161.6 + 87.6)
RS-HMEO 87.1 (5.5 + 81.6) 117.4 (33.0 + 84.4) 156.0 (71.4 + 84.6) 183.2 (95.6 + 87.6)HMNE 92.6 (11.0 + 81.6) 163.3 (79.2 + 84.4) 230.6 (146.0 + 84.6) 376.4 (288.8 + 87.6)
RS-HMNE 87.4 (5.8 + 81.6) 120.6 (36.2 + 84.4) 184.8 (100.2 + 84.6) 228.2 (140.6 + 87.6)
cluding the execution time of the edge extraction andedge matching shown separately in the parentheses.
Figure 8 shows the execution time of each algo-rithm on the tested stereo scenes. In this chart, theexecution time of edge extraction and matching areseparately shown with the same scale. Therefore wecan compare the execution time of these stages to eachother. It can be seen that the edge extraction timeis nearly constant but the edge matching time is verymuch dependent on the scene. This phenomenon has agreat effect on the performances of our proposed algo-rithms. On the other hand, the execution time of theedge matching in the proposed algorithms is highly re-duced with respect to the others (see Table 8 for moredetails).
7. Discussion
The execution time and the failed rate are two essentialparameters in the proposed algorithms. Therefore wefirst discuss these parameters and then investigate someeffective factors in decreasing the processing time.
7.1 Speed Up and Failed Rate
Considering FSEO algorithm as a reference one for themeasuring execution time, speed up of the other al-gorithms could be computed and it is shown in Ta-ble 9. For all stereo scenes, RS-HMNE and RS-HMEOare faster than HMNE and HMEO. In this table, thespeed up increasing of RS-HMEO and RS-HMNE withrespect to HMNE and HMEO are also shown in RS-HMEO and RS-HMNE columns respectively. In thetested cases, the speed up is increased between 5.5%to 64.9%. The minimum increasing of the speed up is5.5% for RS-HMEO in House scene, whiles the maxi-mum one is 64.9% for RS-HMNE in Pentagon scene. Inall cases, the speed up increasing in RS-HMNE is morethan RS-HMEO.
Table 9 Comparing the speed up of the algorithms, the val-ues in parentheses in RS-HMEO and RS-HMNE columns are theincreasing of speed up respect to HMEO and HMNE respectively.
Scene HMEO RS-HMEO HMNE RS-HMNEHouse 1.27 1.34(5.5%) 1.26 1.34(6.4%)Renault 3.51 4.33(23.4%) 3.11 4.21(35.4%)Ball 3.66 4.31(17.8%) 2.92 3.64(24.6%)
Pentagon 5.07 6.90(36.1%) 3.36 5.54(64.9%)

1868IEICE TRANS. INF. & SYST., VOL.E85–D, NO.11 NOVEMBER 2002
(a) Left image (b) Right image (c) Left features (d) Right features
(e) FSOE (f) HMEO (g) RS-HMEO (h) HMNE (i) RS-HMNE
Fig. 4 Left image disparity maps obtained by the proposed algorithms on House stereoscene. (a) And (b) show left and right image, (c) and (d) show the non-horizontal edgepoints extracted as features for the left and right image. (e) through (i) show disparitymaps computed by the algorithms, and failed edges and error in the matching are alsoshown with magenta and black color respectively. The disparity range is between +35 to+60 pixels.
(a) Left image (b) Right image (c) Left features (d) Right features
(e) FSOE (f) HMEO (g) RS-HMEO (h) HMNE (i) RS-HMNE
Fig. 5 The implementation results on Renault stereo scene. The disparity range isbetween 0 to +10 pixels. See figure 4 for more details.
(a) Left image (b) Right image (c) Left features (d) Right features
(e) FSOE (f) HMEO (g) RS-HMEO (h) HMNE (i) RS-HMNE
Fig. 6 The implementation results on Ball stereo scene. The disparity range is between−30 to 0 pixels. See figure 4 for more details.
(a) Left image (b) Right image (c) Left features (d) Right features
(e) FSOE (f) HMEO (g) RS-HMEO (h) HMNE (i) RS-HMNE
Fig. 7 The implementation results on Pentagon stereo scene. The disparity range isbetween −10 to +10 pixels. See Fig. 4 for more details.

MOALLEM et al.: FAST EDGE-BASED STEREO MATCHING ALGORITHMS THROUGH SEARCH SPACE REDUCTION1869
Table 11 Some details of RS-HMNE algorithm results. The first point and non-firstpoints columns mean the number of first point and non-first points in the SCE sets. N/Fcolumn means the ratio of non-first points to first point of SCE sets which matched.
Scene Total Edge Total First Point Non-first Points N/F that Decreasing ofEdges Density Matched Total (Matched - Failed) Total (Matched - Failed) Matched Matching Time
House 734 1.1% 732 39 (37 - 2) 695 (695 - 0) 18.8 47.3%Renault 3012 4.6% 2903 696 (626 - 70) 2316 (2277 - 39) 3.64 54.3%Ball 3925 6.0% 3061 1632 (931 - 701) 2293 (2130 - 163) 2.29 31.4%
Pentagon 6459 9.9% 5575 1855 (1000 - 855) 4606 (4508 - 96) 4.51 51.3%
Table 10 Comparing the failed rate of the algorithms.
Scene HMEO RS-HMEO HMNE RS-HMNEHouse 5.2% 0.3% 0.8% 0.8%Renault 15.8% 14.6% 5.6% 4.6%Ball 30.6% 34.4% 22.5% 22.0%
Pentagon 32.2% 33.3% 12.6% 13.7%
Table 10 shows the failed rate of the algorithms.The failed rates in Ball and Pentagon scenes are morethan others. In Ball scene, a large number of featuresin the left image are in a uniform region. On the otherhand, the occlusion is nearly high in Pentagon scene. Inour proposed algorithms, the failed rate are occasion-ally increased or decreased. Our algorithms decreasethe failed rates in House and Renault and nearly in Ballscenes, but the failed rate is increased a little in Pen-tagon. House scene is a simple case while Pentagon isvery complex one and the occlusions are more than theothers. Renault and Ball scenes are nearly in the mid-dle of these two scenes. Therefore in moderate complexscenes, our algorithms can decrease both the process-ing time and the failed rate, while the processing timeis certainly decreased even in complex scenes in whichthe failed rate is nearly remains constant.
7.2 Important Factors in the Processing Time
In a complete matching algorithm, the processing timeincludes the feature extraction time plus the matchingtime. As we mentioned before, conventionally, for thenon-first points of SCE sets, our proposed matchingstrategy works faster than for the first point. There-fore, when the number of first point of SCE sets are de-creased relative to non-first points, we expect that theprocessing time should be lower relatively. Table 11shows some details of matching stage for RS-HMNEalgorithm. In this table, the results of matching forthe first and non-first point are shown separately. N/Fcolumn is the ratio of non-first points to first point ofSCE sets which are matched. Moreover the percent-age of decreasing in the processing time (relative toHMNE) are also shown in the last column. In Housescene, in which the matching is established more than18 times for non-first points, the decreasing in the pro-cessing time is not very high (47.3%). The density ofedge points is a very important factor in the match-ing time. HMEO and HMNE works very well whenthe density of edge points is low, but our algorithms
have a different behavior. In our algorithms, the com-plexity of the matching for non-first point of SEC setsis nearly independent of the density of edge points, be-cause the search space is narrowly restricted. Thereforethe difference between the matching time of hierarchi-cal multiresolution algorithms and ours will be higher,when the density of edge points is increased. Henceour algorithms work better in real scenes relative tosynthetic scenes, for example comparing the results ofHMNE and RS-HMNE in Pentagon, Renault and Ballscenes.
Considering the results of RS-HMNE for Renaultand Ball scenes in Table 11, RS-HMNE in Renaultscene decreases the matching time more than in Ballscene. In Renault scene N/F ratio is more than Ball,hence non-first points are relatively more than firstpoint. Therefore, it can be concluded that the matchingtime is dependent mostly on N/F ratio. On the otherhand, the connectivity of edge points is an importantfactor. If the number of edge points in each SCE setis increased, the matching time will be decreased, espe-cially in complex scenes. In Ball scene, the connectivityof edge points is less than Renault (see Figs. 4 (c) and5 (c)), therefore the decreasing of the matching time inBall scene is less than Renault.
The other important parameter in the processingtime is the feature extraction time. Generally, the fea-ture extraction time is nearly independent of the den-sity of edge points, because the main computation ofthis stage is the convolution of the images with a pre-defined proper mask. Table 3 shows that the maximumdifference in the execution time is between House andPentagon scene, which is only 6 milliseconds (less than8%). Therefore it is clear that the execution time of fea-ture extraction is nearly constant. On the other hand,the execution time of matching is mostly dependent onparameters like density of edge points and connectiv-ity of edge points. Considering RS-HMNE algorithm,this time is varied between 5.8 milliseconds (House) to140.6 milliseconds (Pentagon). Therefore in the sceneslike House in which the density of edge points is verylow, the execution time of the algorithms are dominantwith feature extraction and not with matching. Hence,the privilege of the proposed algorithms is not evidentin these cases. On the other hand, when the density ofedge points is high, like Pentagon scene, the executiontime of matching is high enough to dominate to fea-

1870IEICE TRANS. INF. & SYST., VOL.E85–D, NO.11 NOVEMBER 2002
ture extraction. Therefore in these cases, the decreas-ing times of our proposed algorithms are completelyhigh light.
8. Conclusion
Edge-based stereo matching is a popular method insome fast stereo vision applications. Reducing thesearch space in the matching can increase the executionspeed and accuracy. In this paper we introduced theconcept of search space reduction in edge-based stereoby limiting the directional derivative of disparity, δdc.Afterward, we formulated a search space region in thematching of the successive connected edge points, SCEsets. We could accurately restrict the search regionin the matching of SCE sets. Then we posed a fastmatching strategy for SCE sets in two phases, basedon that restriction. We used the hierarchical multires-olution scheme to reduce further the search space andfinally developed two fast edge-based stereo matchingalgorithms, RS-HMEO and RS-HMNE. The first oneis very fast, but its fault rate is a little higher. Thesecond one is both fast and accurate.
Most fast algorithms work better in simple andmoderate scenes, but our algorithms have a better per-formance when the complexity of a real scene is in-creased. Connectivity of edge points are very importantfactor to decrease the execution time of our algorithms,so our methods might not work well in a scene likerandom dot stereogram, but work well in a real scene.In conventional hierarchical multiresolution methods,when the density of edge points is increased, the ex-ecution time is increased too, but the execution timeof our proposed algorithms are not increased highly,since the search space is independent of the density ofedge points for non-first point of SCE sets. Therefore,our proposed algorithms have very good performancein complex real scene where the connectivity of edgepoints is guaranteed as well as having high density ofedge points. Since the proposed algorithms work verywell in real scenes, these algorithms are very suitablefor real time applications like robotics.
The execution time of edge extraction stage whichis implemented separately for a left and right image,is nearly independent of scene complexity. Thereforeto decrease the execution time, we suggest using twoseparate processors for implementation of edge extrac-tion in the left and right image. Another processor canbe used in pipeline manner to the others to implementthe matching stage. Therefore the mentioned parallelarchitecture can be used to implement the proposededge-based stereo algorithms in real time applications.
References
[1] E. Trucco and A. Verri, Introductory Techniques for 3DComputer Vision, Prentice Hall, 1998.
[2] U.R. Dhond and J.K. Aggarwal, “Structure from stereo —A review,” IEEE Trans. Syst., Man. & Cybern., vol.19,no.6, pp.1489–1510, Nov.-Dec. 1989.
[3] G.Q. Wei, W.Brauer, and G.Hirzinger, “Intensity- andgradient-based stereo matching using hierarchical Gaussianbasis functions,” IEEE Trans. Pattern Anal. & Mach. In-tell., vol.20, no.11, pp.1143–1151, Nov. 1998.
[4] D. Murry and C. Jennings, “Stereo vision based mappingand navigation for mobile robots,” Proc. IEEE Int. Conf. onRobotics and Automation (ICRA’97), vol.3, pp.1694–1699,1997.
[5] Y. Matsumoto, T. Shibata, K. Sakai, M. Inaba, and H.Inoue, “Real-time color stereo vision system for mobilerobot based on field multiplexing,” Proc. IEEE Int. Conf.on Robotics and Automation (ICRA’97), vol.3, pp.1934–1939, 1997.
[6] L. Robert, M. Buffa, and M. Hebert, “Weakly-calibratedstereo perception for rover navigation,” Proc. IEEE Int.Conf. on Computer Vision, pp.46–51, 1995.
[7] C. Innocenti, G. Mondino, P. Regis, and G. Sandini, “Tra-jectory planning and real-time control of an autonomousmobile robot equipped with vision and ultrasonic sensors,”Proc. IEEE/RSJ Int. Conf. on Intelligent Robots and Sys-tems (IROS’94), vol.3, pp.1861–1866, 1994.
[8] S.W. Chan and A.F. Clark, “Periscopic stereo for virtualworld creation,” Proc. IEE Int. Conf. on Image Processingand Its Applications (IPA’97), vol.1, pp.419–422, 1997.
[9] W.H. Kim and S.W. Ra, “Fast disparity estimation usinggeometric properties and selective sample decimation forstereoscopic image coding,” IEEE Trans. Consumer Elec-tronic, vol.45, no.1, pp.203–209, Feb. 1999.
[10] H. Jahn, “Parallel epipolar stereo matching,” Proc. IEEEInt. Conf. on Pattern Recognition (ICPR2000), pp.402-405,2000.
[11] A. Koschan and V. Rodehorst, “Towards real-tim1e stereoemploying parallel algorithms for edge-based and densestereo matching,” Proc. IEEE Int. Workshop on ComputerArchitectures for Machine Perception, CAMP’95, pp.234–241, 1995.
[12] H.K. Nishihara, “Real-time stereo- and motion-basedfigure-ground discrimination and tracking using LOG sign-correlation,” Proc. IEEE Int. Conf. on Pattern Recognition(ICPR96), pp.95–100, 1996.
[13] I. Masaki, “Three dimensional vision system for intelligentvehicles,” Proc. IEEE Int. Conf. on Industrial Electronics(IECON’93), vol.3, pp.1712–1717, 1993.
[14] M. Adjouadi, F. Candocia, and J. Riley, “Exploiting Walsh-based attributes to stereo vision,” IEEE Trans. Signal Pro-cessing, vol.44, no.2, pp.409–420, Feb. 1996.
[15] Y. Ruicheck and J.G. Postaire, “A neural implementa-tion for high speed processing in linear stereo vision,”Proc. IEEE Int. Conf. on Systems, Men and Cybernetics(SMC’95), vol.5, pp.3902–3907, 1995.
[16] D.N. Bhat and S.K. Nayar, “Ordinal measure for image cor-respondence,” IEEE Trans. Pattern Anal. & Mach. Intell.,vol.20, no.4, pp.415–423, April 1998.
[17] S.B. Marapane and M.M. Trivedi, “Multi-primitive hierar-chical (MPH) stereo analysis,” IEEE Trans. Pattern Anal.& Mach. Intell., vol.16, no.3, pp.227–240, March 1994.
[18] R. Mohan, G. Medioni, and R. Nevatia, “Stereo error detec-tion, correction and evaluation,” IEEE Tans. Pattern Anal.& Mach. Intell., vol.11, no.2, pp.113–120, Feb. 1989.
[19] P. Burt and B. Julesz, “A disparity gradient limit for binoc-ular fusion,” Science, vol.208, pp.615–617, 1980.
[20] C.V. Stewart, “On the derivation of geometric constraintsin stereo,” Proc. IEEE Int. Conf. on Computer Vision andPattern Recognition (CVPR92), pp.769–772, 1992.

MOALLEM et al.: FAST EDGE-BASED STEREO MATCHING ALGORITHMS THROUGH SEARCH SPACE REDUCTION1871
[21] C. Stewart, R. Flatland, and K. Bubna, “Geometric con-straints and stereo disparity computation,” Int. Jour. ofComputer Vision, vol.20, no.4, pp.143–168, Kluwer Aca-demic Publisher, 1996.
[22] P. Moallem, K. Faez, and J. Haddadnia, “Reduction ofthe search space region in the edge based stereo corre-spondence,” Proc. IEEE Int. Conf. on Image Processing(ICIP2001), pp.149–152, Greece, 2001.
[23] S.B. Pollard, J.E.W. Mayhew, and J.P. Frisby, “PMF: Astereo correspondence algorithm using disparity gradientlimit,” Perception, vol.14, pp.449–470, 1981.
[24] S.D Cohran and G. Medioni, “3D surface description frombinocular stereo,” IEEE Trans. Pattern Anal. & Mach. In-tell., vol.14, no.10, pp.981–994, Oct. 1992.
[25] W. Haff and N. Ahuja, “Surface from stereo, integratingfeature matching, disparity estimation and contour detec-tion,” IEEE Trans. Pattern Anal. & Mach. Intell., vol.11,no.2, pp.121–135, Feb. 1989.
[26] J. Magarely and A. Dick, “Multiresolution stereo imagematching using complex wavelet,” Proc. IEEE Int. Conf.on Pattern Recognition (ICPR98), vol.1, pp.4–7, 1998.
[27] M.A. Torres and A.R. Guesalga, “Confidence factor andadaptive disparity range for reliable 3D reconstruction,” inComputer Intelligence for Modeling, Control and Automa-tion, ed. M. Mohammadian, pp.83–91, IOS Press, 1999.
[28] M. Accame, F.G.B. Natale, and D.D. Giusto, “Hierarchicalblock matching for disparity estimation in stereo sequence,”Proc. IEEE Int. Conf. on Image Processing (ICIP95), vol.2,pp.374–377, 1995.
[29] Y. Hung, C. Chen, K. Hung, and Y. Chen, “Multipass hi-erarchical stereo matching for generation of digital terrainmodels from aerial images,” Journal of Machine Vision andApplications, vol.10, pp.280–291, 1998.
[30] Z. Li and G. Hu, “Analysis of disparity gradient based coop-erative stereo,” IEEE Trans. Image Processing, vol.5, no.11,pp.1493–1506, Nov. 1996.
[31] S.B. Pollard, J. Porril, J.E.W. Mayhew, and J.P. Frisby,“Disparity gradient, Lipschitz continuity and computingbinocular correspondence,” Proc. 3rd Int. Symp. on RobotResearch, ed. O.D. Faugeras and G. Giralt, pp.19–26, 1986.
[32] P. Moallem and K. Faez, “Reduction of the search spacein stereo correspondence by context of disparity gradientlimit,” Proc. IEEE 2nd Int. Symp. on Image and SignalProcessing and Analysis (ISPA’01), pp.164–169, Croatia,2001.
[33] P. Moallem and K. Faez, “Search space reduction in theedge based stereo correspondence,” Proc. Int. Workshopon Vision, Modeling, and Visualization 2001 (VMV’01),pp.423–429, Germany, 2001.
[34] P. Moallem and K. Faez, “Fast stereo matching algorithmsbased on reduction in the search space region by new anal-ysis in the disparity gradient” (in Farsi), Proc. 9th IranianConf. on Electrical Engineering (ICEE2001), vol.2, pp.17.1-17.8, Iran, 2001.
[35] T. Frohlinghaus and J.M Buhmann, “Real-time phase-based stereo for mobile robot,” Proc. EUROBOT96,pp.178–185, 1996.
[36] S. Tanaka and A.C. Kak, “Rule-based approach to binoc-ular stereopsis,” in Analysis and Interpretation of RangeImage, ed. R.C Jain, A. K Jain, Springer Verlag, 1990.
[37] Y. Shirai, Three dimensional Computer Vision, SpringerVerlag, 1987.
[38] R. Jain, R. Kasturi, and B.G. Schunk, Machine Vision,McGraw-Hill, 1995.
[39] CMU Stereo Images Database at http://www.vasc.ri.cmu.edu/idb/html/stereo/index.html.
Payman Moallem was born in1970 in Tehran, Iran. He received hisB.S. and M.S. degrees both in Electron-ics Engineering from Esfehan Universityof Technology and Amirkabir Universityof Technology (Tehran Polytechnic), Iran,in 1992 and 1995 respectively. Since1994, he has researched in Iranian Re-search Organization, Science and Tech-nology (IROST) on the topics like, paral-lel algorithms and hardware used in image
processing, DSP based systems, visual target tracking and robotstereo vision. Meanwhile, he has joined to Iranian Aerospace In-dustrial Organization (AIO) since 1999. He has been a Ph.D.candidate at the Electrical Department of Amirkabir Universityof Technology since 1996. His interests include fast stereo vision,robot vision, target tracking, real-time video processing, imagerecognition and neural networks. He has published many pa-pers in the mentioned areas. He is a member of SPIE. Email:[email protected]
Karim Faez was born in Semnan,Iran. He received his B.S. degree in Elec-trical Engineering from Tehran Polytech-nic University as the first rank in June1973, and his M.S. and Ph.D. degrees inComputer Science from University of Cal-ifornia at Los Angeles (UCLA) in 1977and 1980 respectively. Prof. Faez waswith Iran Telecommunication ResearchCenter (1981–1983) before joining Amirk-abir University of Technology (Tehran
Polytechnic) in Iran, where he is now a professor of ElectricalEngineering. He was the founder of the Computer EngineeringDepartment of Amirkabir University in 1989 and he has servedas the first chairman during April 1989-Sept. 1992. ProfessorFaez was the chairman of planning committee for Computer En-gineering and Computer Science of Ministry of Science, researchand Technology (during 1988–1996). His research interests arein Pattern Recognition, Image Processing, Neural Networks, Sig-nal Processing, Farsi Handwritten Processing, Earthquake SignalProcessing, Fault Tolerant System Design, Computer Networks,and Hardware Design. He is a member of IEEE, and ACM.Email: [email protected]
Javad Haddadnia received the BS.Cdegree in Electrical and Electronic Engi-neering with the first rank in 1993 andMS.c in Electronic Engineering in 1995,respectively, all from Amirkabir Univer-sity of Technology, Tehran, Iran. He isnow a Ph.D. candidate in the Electri-cal Engineering Department of AmirkabirUniversity of Technology, Tehran, Iran.His research interests include digital im-age processing, computer vision and face
detection and recognition. He has published many papers in thearea of image processinhg. He served as a visiting research atthe University of Windsor, Canada. He is a member of SPIE andCIPPR.