paper 5duhilhgjdvhohfwurmhw 5*(- plfur
TRANSCRIPT

Journal of Physics D: Applied Physics
PAPER
Rarefied gas electro jet (RGEJ) micro-thruster for space propulsionTo cite this article: Ariel Blanco and Subrata Roy 2017 J. Phys. D: Appl. Phys. 50 455201
View the article online for updates and enhancements.
This content was downloaded from IP address 128.227.6.67 on 13/10/2017 at 20:49

1 © 2017 IOP Publishing Ltd Printed in the UK
1. Introduction
The use of small satellites has gained interest in recent years due to their smaller overall life cycle cost [1]. Micro-propulsion systems for small satellites face several issues: contamination, passage clogging, less reliability, less durability, and excessive complexity. Micro-thrusters must produce minimum impulse bits, O(µN s), determined by attitude control requirements [1]. In contrast, the thrust requirements for slew manoeuvres extends into the O(mN) range, very large when compared to the impulse bits requirements. Micro-propulsion systems must overcome these issues while being lightweight, compact, low power, efficient, and inexpensive. Cold gas thrusters (CGT) have desirable advantages for micro-propulsion applications [1]. However, valve leakage or low specific impulse (Isp) for
desirable propellants, eliminate CGT from consideration for primary propulsion tasks unless the required ∆− v is small (<100 m s−1) [1]. Their Isp is typically low unless very light gases are used (e.g. H2 or He), which produce experimentally measurable specific impulses of 272 and 165 (s), respectively [1]. Very light gases are commonly not used due to storage problems. For argon propellant, the Isp of a highly optimized CGT is 52 (s) [1].
In order to increase the Isp of CGT, the free molecule micro-resistojet (FMMR) was proposed [1]. FMMR oper-ates at low stagnation pressures (50–500 Pa) and large exit Knudsen numbers (Kn ~ 1) [1]. Due to the low pressures, gas heating occurs primarily by conduction [2]. FMMR operating with a heating element temperature of 600 K can produce an Isp of 68 (s) for water and 45 (s) for argon propellant [1]. These
Journal of Physics D: Applied Physics
Rarefied gas electro jet (RGEJ) micro-thruster for space propulsion
Ariel Blanco and Subrata Roy
Applied Physics Research Group, Mechanical and Aerospace Engineering Department, University of Florida, Gainesville, FL 32611, United States of America
E-mail: [email protected]
Received 21 July 2017, revised 11 September 2017Accepted for publication 13 September 2017Published 13 October 2017
AbstractThis article numerically investigates a micro-thruster for small satellites which utilizes plasma actuators to heat and accelerate the flow in a micro-channel with rarefied gas in the slip flow regime. The inlet plenum condition is considered at 1 Torr with flow discharging to near vacuum conditions (<0.05 Torr). The Knudsen numbers at the inlet and exit planes are ~0.01 and ~0.1, respectively. Although several studies have been performed in micro-hallow cathode discharges at constant pressure, to our knowledge, an integrated study of the glow discharge physics and resulting fluid flow of a plasma thruster under these low pressure and low Knudsen number conditions is yet to be reported. Numerical simulations of the charge distribution due to gas ionization processes and the resulting rarefied gas flow are performed using an in-house code. The mass flow rate, thrust, specific impulse, power consumption and the thrust effectiveness of the thruster are predicted based on these results. The ionized gas is modelled using local mean energy approximation. An electrically induced body force and a thermal heating source are calculated based on the space separated charge distribution and the ion Joule heating, respectively. The rarefied gas flow with these electric force and heating source is modelled using density-based compressible flow equations with slip flow boundary conditions. The results show that a significant improvement of specific impulse can be achieved over highly optimized cold gas thrusters using the same propellant.
Keywords: micro thruster, mixed numerical formulation, multispecies plasma model, rarified gas dynamics, plasma discharge, localized heating, high altitude application
(Some figures may appear in colour only in the online journal)
A Blanco and S Roy
Printed in the UK
455201
JPAPBE
© 2017 IOP Publishing Ltd
50
J. Phys. D: Appl. Phys.
JPD
10.1088/1361-6463/aa8c47
Paper
45
Journal of Physics D: Applied Physics
IOP
2017
1361-6463
1361-6463/17/455201+15$33.00
https://doi.org/10.1088/1361-6463/aa8c47J. Phys. D: Appl. Phys. 50 (2017) 455201 (15pp)

A Blanco and S Roy
2
values may not look like an improvement, but due to the low stagnation pressure, liquid propellant could be vaporized on demand, thus avoiding heavy storage tanks and valve leakage [1]. Unfortunately, FMMR suffers from significant thermal energy losses due to thermal dissipation [3]. An estimate by Micci and Ketsdever [1] predicts a heat loss of 6800 (mW) for a device operating with 40 expansion slots that requires 6000–8000 (mW) to heat the propellant gas [1]. The pro-posed rarefied gas electro jet (RGEJ [4]) micro-thruster aims to improve the heat loss of microelectromechanical (MEMS) based microresistojet thruster designs.
Other designs improving the Isp of CGT using plasma aided technologies are the micro-plasma thruster (MPT [5]), the radio-frequency electrothermal thruster (RFET [6]), and the microwave electrothermal thruster (MET [7]). The MPT consists of a cylindrical geometry comprising a constant area section, 500 µm long and 100 µm in diameter, and a diverging nozzle. The MPT uses a direct-current micro-discharge in the abnormal glow regime. It operates with argon at a stagnation pressure of 100 (Torr), two orders of magnitude higher than the RGEJ, in the slip flow regime with Kn ~ 0.01 at the inlet and Kn ~ 0.08 at the exit plane [8]. In the MPT, the expan-sion and heating of the flow occur predominantly in the diverging nozzle. The thrust difference between no-slip and slip boundary condition cases is 2–3% since the majority of the thruster, the constant area section, experiences low Kn num-bers (0.01 < Kn < 0.03) [8]. Due to a small volume-to-surface (V/S) ratio (39.2 µm) the thermal losses, caused by conduction to the walls, are expected to be significant. For comparison, the RGEJ has a V/S ratio of 1.5 (mm) and operates in the slip flow regime with Kn ~ 0.01 at the inlet and Kn ~ 0.1 at the exit plane with more than 50% of the device experiencing (Kn > 0.05). Using no-slip boundary conditions would produce a drastically different solution in the RGEJ. The MPT’s Isp is 74 (s) for the 750 (V) and 650 (mW) case, an improvement over CGT by a factor of (~1.5) [8]. However, the MPT’s thrust effective-ness, the difference in thrust with and without plasma heating divided by the total electrical power, is very low (50 µN W−1) due to thermal losses through the isothermal walls [5, 8].
The RFET consist of a cylindrical geometry, 18 mm in length and 4.2 mm in diameter, composed of alumina with copper electrodes operating at a frequency of 13.56 MHz and an electric potential difference of 240 V. For an argon gas plenum pressure of 1.5 (Torr), the power consumption is 10 W, causing an ionization degree of 0.44% and a maximum elec-tron number density of 2 × 10¹⁸ (m−3) [6]. The predicted mass flow rate and thrust are 100 SCCM and 2.619 mN [9]. The MET has a cylindrical dielectric chamber, 10 mm long and 1.5 mm in diameter, with a metal rod antenna on the axis to produce microwave signals at 4 GHz that generate the plasma and heat the gas. The heated argon gas in the chamber at high pressure (10–50 kPa) is expanded through a Laval nozzle. An experiment performed with 31 kPa plenum pres-sure produced a 60 SCCM mass flow rate and a 1.4 (mN) thrust. Both of these thrusters operate with higher power consumption than the target power budget of RGEJ (<5 W), but they produce higher specific impulse (Isp > 80 s) than the RGEJ and the MPT. These designs help illustrate the many
different examples of plasma aided technology thrusters cur-rently under investigation.
The RGEJ design aims to increase the efficiency of the energy exchange from the electrical source to the propel-lant. It operates in the slip flow regime, which decreases vis-cous losses and heat transfer to the walls. The RGEJ concept involves localized embedding of electrodes with either a DC or an RF applied potential difference, along the dielectric walls to produce a glow discharge plasma [3]. The charged particles in the plasma are accelerated by the electric field, heating the propellant. The presence of charged particles implies that both electric and magnetic fields could be used to produce thrust. In this study, magnetic fields are not used and the thruster operates with a DC discharge. A finite element and a finite difference based numerical analysis of the rarefied gas and the ionized gas are implemented, respectively, to model the RGEJ. The cases presented, display a non-optimized design with adiabatic walls and a low plenum pressure (1 Torr), operating at different DC voltages. It is important to emphasize that adiabatic walls, instead of isothermal, requires a more robust iterative proce-dure between the loosely coupled code modules.
2. Methodology
In order to simulate the RGEJ, an existing, previously described in literature, in-house modular multi-scale ionized gas (MIG) flow solver platform developed by Balagangadhar and Roy [10, 11] was used. The MIG code consists of two modules: a finite element based rarefied gas module (RGM) and a finite difference based ionized gas module (IGM), which was recently developed. They are loosely coupled in the fol-lowing sequence. The RGM runs until convergence, pro-ducing the gas density (ρ), components of velocity (u, v), and temperature (T). These variables from the RGM are passed to the IGM. Then, the IGM runs until convergence, producing the plasma induced electrostatic force components (Fx, Fy) and the electro-thermal heating source (Q) needed by the new run of the RGM. The information obtained by each module is exchanged in this fashion until the steady-state solution is obtained. The following figure shows the process.
In figure 1, the first step initializes the variables of both modules, including the initial voltage (Vi) value, based on the plasma breakdown voltage of the gas (~150 V for argon). Each module uses the L2-norm of the solution to test for conv-ergence. After both modules have reached convergence at a given voltage, the voltage is increased by a voltage difference (∆V ) and the process is repeated, until the maximum voltage (Vmax) desired is achieved. For all cases in this study, (∆V ) is 50 V. After reaching the maximum voltage (Vmax), a test for global convergence is performed. The RGM and the IGM are run for 5 time steps even if their L2-norms are less than their tolerances. If the L2-norm of each module is less than its tolerance for all five consecutive time steps for three con-secutive iterative loops between the RGM and the IGM, then global convergence conditions are satisfied. The L2-norms for the RGM and the IGM, using the given non-dimension-alization explained in the following sections, are 10−4 and
J. Phys. D: Appl. Phys. 50 (2017) 455201

A Blanco and S Roy
3
10−10 for time steps of 10−8 and 5 × 10⁻¹³ s for each module, respectively.
2.1. Ionized gas module (IGM)
2.1.1. Plasma governing equations and argon chemistry. The numerical model for the argon plasma assumes a weakly ion-ized gas composed of positive ions, three types of metastable atoms, and electrons. In fluid models of glow discharges, all plasma species are treated as a continuum. Momentum equa-tions are usually reduced to the drift-diffusion equation. In the local mean energy approximation (LMEA) model, the spatial distribution of the electron temperature is obtained from the solution of the energy balance equation for electrons [12]. The calculation of the electron transport coefficients (mobility and diffusion) and the kinetic coefficients (electron-impact reac-tion rates for excitation and ionization processes) are done by solving the kinetic Boltzmann equation as functions of the electron energy [12]. The continuity equation that is solved for each plasma species is given as [13]
∂nk
∂t+∇ · Γk = Sk, where Γk = sgn(qk)µknkE − Dk∇nk + nkV.
(1)The right-hand side of equation (1) contains the source and sink terms representing the argon chemistry, similar in nota-tion to Rafatov et al [14]. The subscript k is equal to: i, e, S-levels, P-levels, or D-levels, for ions, electrons, and three types of metastable atoms, respectively. V is the velocity vector of the bulk gas obtained from the rarefied gas module [15]. The electron energy equation is included in LMEA in order to incorporate the nonlocal transport of electrons written as recommended by Hagelaar and Pitchford [16]
∂nε∂t +∇ · Γε = −eΓe · E − 3
2 ne2memg
νeakb (Te − Tg)− e∑
j∆Ee
j rj,
where Γε = −µεnεE − Dε∇nε +53 nεV.
(2)
The first term on the right-hand-side of equation (2) describes the Joule heating, which is responsible for adding energy to
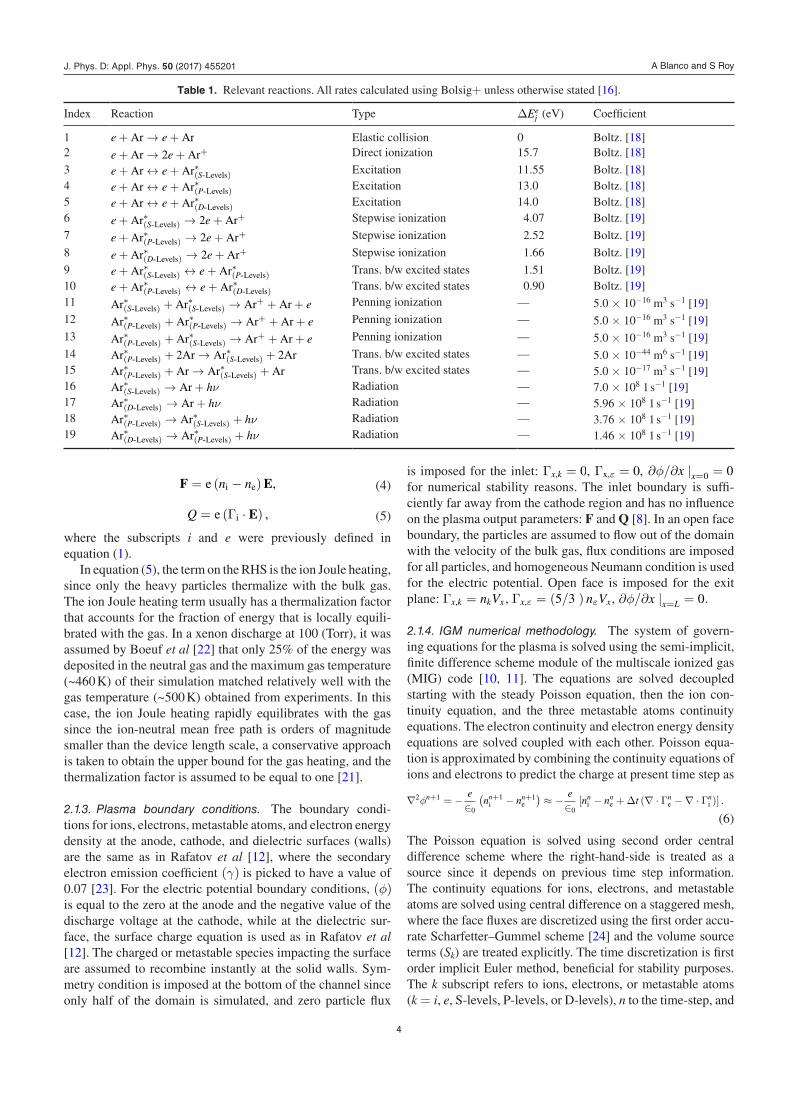
electrons. The second and third term describe the electron energy losses due to the inelastic and elastic collisional pro-cesses [17]. The notation has been previously explained by Rafatov et al [12]. The elementary reactions considered for low-pressure, argon chemistry are given in table 1.
The cross-sections for these reactions were obtained from [18] and the kinetic model section of Petrov and Ferreira [19]. Detailed balancing was used for the reverse reaction of all ‘excitation’ and ‘transition between excited states’ reactions. The electron transport coefficients (µe and De) are calculated using an electron Boltzmann equation solver, Bolsig+ [16], as functions of the mean electron energy (ε) and the energy trans-port coefficients are related to the particle transport coefficients via µε = (5/3 )µe and Dε = (5/3 )De . The ion mobility and diffusion coefficients are obtained from equation (17) in Rafatov et al [20], and Einstein relation, (Di = kbTiµi/e ), respectively. The metastable mobility is zero for all the meta-stable species in this model and the metastable diffusion is the same as in Deconinck [8]. All heavy, metastable and ion species are assumed to be in thermal equilibrium with the gas. The volume source terms (Sk) in equation (1) are determined by the reactions occurring within the discharge, where the source terms (Si, Se) for ions and electrons are identical due to particle conservation. The neutral species number density (nn) is solved using the ideal gas law.
The system of equations is closed with the solution of the electrostatic Poisson equation in order to calculate the electric field (12)
∈0∇ · E =∑
k
qknk, where E = −∇φ. (3)
The governing equations are written in the non-dimensional form using reference number density of 1016 (m−3), an electric potential of 100 (V), a length scale of 0.01 (m), an electron temperature of 10 (eV) and a time scale of 10−10 (s).
2.1.2. Plasma electrostatic force and electro-thermal heating source. The plasma induced electrostatic force and plasma electro-thermal heating source are calculated as [8, 21]
Figure 1. Schematic of the new MIG code with rarefied gas and IGMs.
J. Phys. D: Appl. Phys. 50 (2017) 455201
A Blanco and S Roy
4
F = e (ni − ne)E, (4)
Q = e (Γi · E) , (5)
where the subscripts i and e were previously defined in equation (1).
In equation (5), the term on the RHS is the ion Joule heating, since only the heavy particles thermalize with the bulk gas. The ion Joule heating term usually has a thermalization factor that accounts for the fraction of energy that is locally equili-brated with the gas. In a xenon discharge at 100 (Torr), it was assumed by Boeuf et al [22] that only 25% of the energy was deposited in the neutral gas and the maximum gas temperature (~460 K) of their simulation matched relatively well with the gas temperature (~500 K) obtained from experiments. In this case, the ion Joule heating rapidly equilibrates with the gas since the ion-neutral mean free path is orders of magnitude smaller than the device length scale, a conservative approach is taken to obtain the upper bound for the gas heating, and the thermalization factor is assumed to be equal to one [21].
2.1.3. Plasma boundary conditions. The boundary condi-tions for ions, electrons, metastable atoms, and electron energy density at the anode, cathode, and dielectric surfaces (walls) are the same as in Rafatov et al [12], where the secondary electron emission coefficient (γ) is picked to have a value of 0.07 [23]. For the electric potential boundary conditions, (φ) is equal to the zero at the anode and the negative value of the discharge voltage at the cathode, while at the dielectric sur-face, the surface charge equation is used as in Rafatov et al [12]. The charged or metastable species impacting the surface are assumed to recombine instantly at the solid walls. Sym-metry condition is imposed at the bottom of the channel since only half of the domain is simulated, and zero particle flux
is imposed for the inlet: Γx,k = 0, Γx,ε = 0, ∂φ/∂x |x=0 = 0 for numerical stability reasons. The inlet boundary is suffi-ciently far away from the cathode region and has no influence on the plasma output parameters: F and Q [8]. In an open face boundary, the particles are assumed to flow out of the domain with the velocity of the bulk gas, flux conditions are imposed for all particles, and homogeneous Neumann condition is used for the electric potential. Open face is imposed for the exit plane: Γx,k = nkVx , Γx,ε = (5/3 ) nεVx , ∂φ/∂x |x=L = 0.
2.1.4. IGM numerical methodology. The system of govern-ing equations for the plasma is solved using the semi-implicit, finite difference scheme module of the multiscale ionized gas (MIG) code [10, 11]. The equations are solved decoupled starting with the steady Poisson equation, then the ion con-tinuity equation, and the three metastable atoms continuity equations. The electron continuity and electron energy density equations are solved coupled with each other. Poisson equa-tion is approximated by combining the continuity equations of ions and electrons to predict the charge at present time step as
∇2φn+1 = − e∈0
(nn+1
i − nn+1e
)≈ − e
∈0[nn
i − nne +∆t (∇ · Γn
e −∇ · Γni )] .
(6)
The Poisson equation is solved using second order central difference scheme where the right-hand-side is treated as a source since it depends on previous time step information. The continuity equations for ions, electrons, and metastable atoms are solved using central difference on a staggered mesh, where the face fluxes are discretized using the first order accu-rate Scharfetter–Gummel scheme [24] and the volume source terms (Sk) are treated explicitly. The time discretization is first order implicit Euler method, beneficial for stability purposes. The k subscript refers to ions, electrons, or metastable atoms (k = i, e, S-levels, P-levels, or D-levels), n to the time-step, and
Table 1. Relevant reactions. All rates calculated using Bolsig+ unless otherwise stated [16].
Index Reaction Type ∆Eej (eV) Coefficient
1 e + Ar → e + Ar Elastic collision 0 Boltz. [18]2 e + Ar → 2e + Ar+ Direct ionization 15.7 Boltz. [18]
3 e + Ar ↔ e + Ar∗(S-Levels) Excitation 11.55 Boltz. [18]4 e + Ar ↔ e + Ar∗(P-Levels) Excitation 13.0 Boltz. [18]5 e + Ar ↔ e + Ar∗(D-Levels) Excitation 14.0 Boltz. [18]6 e + Ar∗(S-Levels) → 2e + Ar+ Stepwise ionization 4.07 Boltz. [19]
7 e + Ar∗(P-Levels) → 2e + Ar+ Stepwise ionization 2.52 Boltz. [19]
8 e + Ar∗(D-Levels) → 2e + Ar+ Stepwise ionization 1.66 Boltz. [19]
9 e + Ar∗(S-Levels) ↔ e + Ar∗(P-Levels) Trans. b/w excited states 1.51 Boltz. [19]10 e + Ar∗(P-Levels) ↔ e + Ar∗(D-Levels) Trans. b/w excited states 0.90 Boltz. [19]11 Ar∗(S-Levels) + Ar∗(S-Levels) → Ar+ + Ar + e Penning ionization — 5.0 × 10⁻¹⁶ m3 s−1 [19]12 Ar∗(P-Levels) + Ar∗(P-Levels) → Ar+ + Ar + e Penning ionization — 5.0 × 10⁻¹⁶ m3 s−1 [19]13 Ar∗(P-Levels) + Ar∗(S-Levels) → Ar+ + Ar + e Penning ionization — 5.0 × 10⁻¹⁶ m3 s−1 [19]14 Ar∗(P-Levels) + 2Ar → Ar∗(S-Levels) + 2Ar Trans. b/w excited states — 5.0 × 10−44 m6 s−1 [19]15 Ar∗(P-Levels) + Ar → Ar∗(S-Levels) + Ar Trans. b/w excited states — 5.0 × 10⁻¹⁷ m3 s−1 [19]16 Ar∗(S-Levels) → Ar + hν Radiation — 7.0 × 10⁸ 1 s−1 [19]17 Ar∗(D-Levels) → Ar + hν Radiation — 5.96 × 10⁸ 1 s−1 [19]18 Ar∗(P-Levels) → Ar∗(S-Levels) + hν Radiation — 3.76 × 10⁸ 1 s−1 [19]19 Ar∗(D-Levels) → Ar∗(P-Levels) + hν Radiation — 1.46 × 10⁸ 1 s−1 [19]
J. Phys. D: Appl. Phys. 50 (2017) 455201

A Blanco and S Roy
5
j to the node number. The electron energy density is solved in a similar manner, simultaneously with the electron continuity equation using a Newton–Raphson non-linear solver.
Each equation imposes a different restriction on the time step. The electric potential is updated based on the Maxwell time [17], while the heavy species fluxes restriction depends on the Courant–Friedrichs–Lewy (CFL) condition. The time step restrictions imposed by the electrons and the argon chemistry are stricter than the heavy species transport restrictions. The elec-tron and the chemical source terms time step restrictions depend on the CFL condition imposed by the electron energy transport. In all our simulations, all of the equations are advance at the most restrictive time step value from uniform initial conditions.
2.2. Rarefied gas module (RGM)
2.2.1. Rarefied gas governing equations. In the rarefied gas simulation, density-based compressible flow equations were used with the assumption of ideal gas using argon as the working fluid [25]. The continuity, momentum, and energy equations are given by equations (2)–(5) in Raju [25], with the additions of the terms (Fx, Fy, Q) in the right-hand-side of equations (3)–(5) in Raju [25], respectively. The ideal gas constant (R) and the specific heat at constant pressure (cp) are considered constants, while the thermal conductivity (κ) and the viscosity (µ) are functions of the gas temperature [26]
µ = −4.688 268 × 10−18T4 + 2.608 773 × 10−14T3 − 5.761 201 × 10−11T2 + 9.224 244 × 10−8T − 3.936 359 × 10−7,κ = −3.591 506 × 10−15T4 + 2.006 139 × 10−11T3 − 4.456 168 × 10−8T2 + 7.199 751 × 10−5T − 3.170 661 × 10−4,
whereµ is in (Pa · s) , κ is in( W
m·K)
, and [80 (K) � T � 2000 (K)] .
(7)
The governing equations are written in the non-dimensional form using a velocity of 100 (m s−1), a length scale of 0.01 (m), a pressure of 100 (Pa), a temperature of 300 K, and den-sity from the ideal gas law.
2.2.2. Slip flow boundary conditions. The Knudsen number (Kn) and mean free path (λ) are defined as [27, 28]
Kn =λ
Hand λ =
1√2nπd2
∼=16µ5ρ
√2πRT , (8)
where d, n and H, are the atomic diameter, gas number den-sity, and channel height, which is much smaller than the channel length. Kn is used to determine which numerical modelling approach is more appropriate: statistical mechanics or continuum mechanics. As Kn > 0, the flow is assumed suf-ficiently continuous, while for Kn > 10, the flow is assumed free-molecule. For 10−3 < Kn < 10 the flow is neither suf-ficiently continuum nor completely molecular [25]. For this range, the flow is further divided into two subcategories: slip flow regime 10−3 < Kn < 10−1 and transitional regime for 10−1 < Kn < 10 as explained by Raju [25]. In our cases, Kn is in the slip regime by design.
zero flux normal to the edges of the domain [∂ (...)/∂x = 0 or ∂ (...)/∂y = 0].
2.2.3. RGM numerical methodology. The plasma numer-ical simulation is performed using the IGM described in section 2.1 using equations (1)–(3), while the rarefied gas numerical simulation is performed using the rarefied gas mod-ule described in section 2.2.1. The rarefied gas simulations are modelled using finite element methods and loosely coupled with the IGM as shown in figure 1. The numerical simulation of the rarefied gas code is performed using an existing, finite element based module in the MIG [10, 11]. This module of MIG utilizes the Galerkin weak statement combined with the Newton–Raphson nonlinear solver. Bilinear elements are used in the RGC module for the numerical analysis of the RGEJ thruster. In order to provide stability to the solution, the incon-sistent streamline up-winding (SU) artificial diffusion method in 2D is used [33]. The MIG flow solver platform had been utilized for many different applications, including electric propulsion, micro-flows, nanoscale flows, fluid dynamics, and plasma physics [34–37]. Most recently, the finite difference IGM has been added to extend MIG’s capabilities.
The boundary conditions for the rarefied gas simula-tion are fixed stagnation density and temperature at the inlet (ρ0 = P0/RT0, T0 = 300 K, where P0 = 133.3 Pa). Isentropic flow assumption is used to calculate the static density and temperature at the inlet plane. At the walls there is no penetration, the normal velocity is equal to zero. At the outlet, static pressure is assumed to be (POut = 0.05 Torr) if Mach number is subsonic and (ρOut = POut/RTOut), else ρ is extrapolated from internal nodes. Boundary conditions for a rarefied gas are used for tangential velocity and temper-ature at the wall face, as described by Maxwell [29] and Smoluchowski [30], similar to Raju [25]. For example, for the top wall face inside the channel, the tangential velocity boundary condition is
−µ
ρ
(∂u∂y
)∣∣∣∣y=H/2
=5√
2πRT16
σv
(2 − σv)
[u − 3
4µ
ρT
(∂T∂x
)∣∣∣∣y=H/2
].
(9)
If a case is adiabatic, ∂T/∂x = 0 or ∂T/∂y = 0 is used as a temperature boundary condition at the wall. The tangential momentum accommodation coefficient (σv = 0.89 [31]) and the thermal accommodation coefficient (σT = 0.87 [32]) found in the formulas of slip flow boundary conditions are selected based on average values for argon interacting with different materials. The rest of the boundary conditions needed are
J. Phys. D: Appl. Phys. 50 (2017) 455201

A Blanco and S Roy
6
2.3. Geometry and grid
The micro-thruster was designed with a long (20 mm), narrow (3 mm) slot to prevent the possibility of catastrophically plug-ging the thruster’s throat. The absence of an expansion nozzle at the exit of the channel is due to predicted low Reynolds numbers (<100). In the limit of continuum isentropic flow through a large pressure drop, the nozzle’s thrust is propor-tional to the operating pressure and the throat area [1], where W and H are width and height,
FThrust ∝ P0At ∝ P0WH. (10)
The Reynolds number gives a measure of nozzle efficiency in terms of viscous flow losses. The nozzle’s Reynolds number at the throat is given by [1]
Re =ρaHµ
∝ P0H
Tβ0
, where (1.2 < β < 1.5) and a =√
γRT .
(11)For the nozzle’s viscous losses to scale favourably, the Reynolds number must remain constant or increase as the device is miniaturized [1]. Since microsatellites require lower thrust and cannot operate at high enough plenum pressures, the operational Reynolds number for micro-nozzles may decrease to values as low as 100, and as heat is added, the flow experiences a further decrease in Reynolds number. Micro-thrusters with low throat Reynolds number (~100) do not experience any gains from an expansion nozzle [38]. The low plenum-pressure operation condition is chosen to scale the thrust and for the additional benefit of reduced propellant storage pressure, therefore easing the propellant tank mass and valve leakage requirements [1].
Figure 2 shows the domain region numerically simulated (light blue). The IGM module models only the region inside the channel, (0 mm < x <20 mm), since the charged particle number densities are negligible at the exit plane. The mesh inside the channel has 401 × 31 nodes. For the cases tested, the anode is between (1 mm < x < 2 mm) and the cathode (8 mm < x < 19 mm). The RGM module models the channel region and the plume. The plume has 201 × 201 nodes and is 10 × 10 (mm). All cells are rectangular and have constant ∆x and ∆y. It is only necessary to solve one-half of the domain due to symmetry.
3. Results and discussion
3.1. Rarefied gas module benchmarking
In this section, a benchmarking of the rarefied gas module is done for subsonic gas flows through a micro-channels using results from Chen et al [39], which were validated within 1.15% accuracy with experimental results of Pong et al [40]. The model assumes the gas flows through two parallel plates of length L and width W separated by a distance H. The end effects are neglected and only the 2D geometry stretching in the x and y directions is considered.
In table 2 Tin is the inlet gas temperature and Tw is the iso-thermal wall temperature. Pin/Pout is the ratio of inlet pres-sure versus outlet pressure, all other parameters and boundary
conditions are given by Chen et al [39]. The inlet and outlet pressures produce Knudsen numbers of 0.0217 and 0.0585, respectively. The flow in the microchannel is in the slip flow regime, which is the regime of interest for this study.
The maximum discrepancy between Chen et al [39], see table 3, and our results, see table 4, in the u-velocity at the cen-treline, occurs at x = 2500 (µm). This maximum discrepancy of 1.6% can be attributed to using different values of thermal conductivity and different numerical schemes. Chen et al [39] did not provide the thermal conductivity and explicit finite dif-ference method was used to solve the governing equations. The pressure discrepancy along the centreline is similar to the u-velocity discrepancy. Exact values for the pressure along the centreline are not given in Chen et al [39], only a figure is provided, therefore an exact comparison of the pressure is not performed. The temperature remains near constant throughout the domain (~Tw = 314 K), and the v-velocity is close to zero. Overall, the rarefied gas module matched closely with results in literature.
3.2. Plasma module validation
In order to validate the plasma code, the veracity of the model was tested using the method of manufactured solutions with the same procedure as Houba [41]. Additionally, a simulation in 1D of a parallel-plate, capacitively coupled, low-pressure, symmetric RF discharge driven at 13.56 MHz was performed and compared with Godyak et al [42]. Although the RGEJ cases in this study use a DC applied potential difference, the RF discharge experiment of Godyak et al [42] is employed for this validation since the numerical models used for RF and DC glow discharges are almost identical except for the applied alternating voltage in RF discharges. In previous studies, Sitaraman and Raja [21] and Deconinck [8] have successfully used the LMEA model to investigate an RF discharge thruster and a DC discharge thruster, respectively.
Godyak et al [42] measured the discharge electrical char-acteristics (voltage, current, etc) using argon (99.998% purity) at low pressure inside a glass cylinder with inner diameter of 14.3 (cm), cross-section area = 160 (cm2), and a discharge gap formed by the two parallel-plate aluminium electrodes of 6.7 (cm). The discharge separation was chosen to be large enough that ‘collisionless’ discharges at pressures as low as 3.0 (mTorr) could be studied without overlapping electrode sheaths, and small enough that it could be considered as a 1D discharge. For the cases shown, the pressure was 1.0 (Torr) and temperature of 300 K was assumed. The computational grid for all cases tested was composed of 671 nodes equally spaced.
Figure 2. Geometry and design of cases tested.
J. Phys. D: Appl. Phys. 50 (2017) 455201

A Blanco and S Roy
7
The secondary electron emission (γ) depends sensitively on surface conditions, morphology, impurities, and contam-ination; the commonly assumed value for (γ) for pure alu-minium in a DC discharge is 0.1 [43]. Since in Godyak et al [42], the purity of the aluminium or its surface condition are not given and the discharge is not DC, several values of (γ) were tested to validate the code.
The discharge voltage amplitude is applied to each elec-trode with equal magnitude but opposite phase. The peak-to-peak voltage is the total voltage of the simulation at peak value. Figure 3 shows the comparison between the exper-imental values and three different numerical simulations per-formed with different (γ). The cases with (γ) equal to 0.01 matched the experimental results with the least error.
A linear interpolation was used to interpolate between the experimental data points and to calculate the voltage amplitude at the given current amplitude obtained from the numerical model. The maximum percent error of the voltage amplitude in the range of interest for the peak-to-peak voltage (300–800 V) is 5.53% for (γ) equal to 0.01, a reasonable error by drift-diffusion model standards. Drift-diffusion models typically have relatively large errors due to inaccuracies in the input coefficients as well as the model’s inherent approximation of the Boltzmann equation. For example, the variation in the reduced mobility (µnn) when using different collision cross-section libraries, in a Boltzmann solver such as Bolsig+, for the electron mean energy (7–10 eV) region is of ~5% [44].
3.3. CGT and constant thermal heating source thrusters results and comparison
In order to understand the effect of gas heating in the RGEJ, results for adiabatic wall condition cases with different con-stant thermal heating source values (Q) were obtained and compared with a CGT of the same design. The CGT simula-tion is called the base case. Figure 4 shows the four regions where Q is applied.
The performance parameters shown in this study are calcu-lated at the exit plane of the thruster as
m = 2∫ H/2
0 (ρu)Wdy,
FThrust = 2∫ H/2
0
(ρu2 + P
)Wdy,
Isp = FThrustmg0
, where g0 = 9.81(m s−2
)and W = 1 (cm) ,
FτWall = 2∫ L
0 (τWall)Wdx, where τWall = µ ∂u∂y
∣∣∣y=−H/2
.
(12)
All other parameters are either defined in literature or previ-ously defined. The following table shows the performance parameters of the different cases studied.
Adding thermal energy to the gas increases the Isp for all cases. A decrease in the mass flow rate requirement occurs for all cases as Q is increased. In the cases where the thermal heating source is applied away from the exit plane, with regions of applied Q labelled 1, 2, or 3, the thrust also decreases due to an increase in the overall shear stress at the wall. Only in the cases where the heat source is placed near the exit plane, at region 4, do we see a gradual increase in thrust with increasing Q.
When the heat source is located near the exit plane, in region 4, we observe a linear decrease of mass flow rate
Figure 3. Comparison between experiment and numerical model.
Table 2. Microchannel dimensions and properties of fluid for subsonic gas flows.
FluidL (µm)
W (µm)
H (µm)
Pin/Pout —
Pout (kPa)
Tin (K)
Tw (K)
µ (N s m−2)
κ (W m−1 K−1)
k —
R (J kg−1 K−1)
N2 3000 40 1.2 2.701 100.8 314 314 1.85 × 10⁻⁵ 0.0259 1.4 296.7
Table 3. Grid dependence test done by Chen et al [39] of the centreline u-velocity (m s−1) at different x-locations.
Grid x = 500 (µm) x = 1000 (µm) x = 1500 (µm) x = 2000 (µm) x = 2500 (µm)
1500 × 7 0.476 5853 0.522 5323 0.584 5432 0.674 5498 0.821 69153000 × 13 0.476 0927 0.522 2115 0.584 5377 0.674 9501 0.822 94706000 × 23 0.475 9963 0.522 2144 0.584 5423 0.674 9584 0.822 9740
Table 4. Grid dependence test done using MIG of the centreline u-velocity (m s−1) at different x-locations.
Grid x = 500 (µm) x = 1000 (µm) x = 1500 (µm) x = 2000 (µm) x = 2500 (µm)
1500 × 7 0.476 01 0.521 27 0.581 27 0.667 94 0.809 823000 × 13 0.476 06 0.521 27 0.581 26 0.667 98 0.809 846000 × 23 0.476 20 0.521 11 0.581 24 0.667 94 0.809 88
J. Phys. D: Appl. Phys. 50 (2017) 455201

A Blanco and S Roy
8
requirement with a negative slope of 68.6 (SCCM W−1) and a near linear increase in thrust with positive slope of 0.37 (mN W−1), due to an inversely proportional decrease in the shear force at the wall. When the heat source is located closer to the inlet, in region 2, we observe a decrease in the mass flow rate requirement with a slope of 179.7 (SCCM W−1), and a decrease in thrust with a slope of 1.19 (mN W−1). The Isp for all cases increases linearly while Q is less than or equal to 300 (mW), independently of the location where Q is applied. For greater values of Q, with Q applied in regions 1 and 2, the Isp increases with a quadratic trend and the thruster is no longer choked (M < 1), for all other cases the linear positive trend is maintained. For the cases with Q equal to 600 (mW), the Isp increases the closer Q is applied to the inlet, with the excep-tion of case Q1-600 due to the interaction between the applied Q and the inlet boundary condition. Case Q1-600 characteris-tics is most likely due to numerical effects.
The following figure shows a comparison between the base case, case Q2-600, and case Q4-600.
If the thermal creep term is neglected in the slip flow boundary condition (for simplicity of the analysis), the shear stress is proportional to ρ , u, and T0.5 at the wall. Since the mass flow rate requirement is smaller for cases with added thermal energy than for the base case, the mass flux (ρu) is smaller in most of the domain along the wall for cases with added Q. Alternatively, the shear stress increases with temper-ature. These two competing contributions, (ρu) and (s), cause the shear stress to decrease before the region where Q is added and increase right after. The thermal creep plays a minor role that increases this effect since molecules creep from cold towards hot regions [45]. The thermal creep contribution to the shear stress is negative while T is increasing and positive while T is decreasing along the tangential direction at the wall. The shear force in case Q2-600 at the wall increased by about ~30% when compared to the base case. For case Q4-600, the shear force is ~10% lower than the base case. For both cases, the shear force causes an inversely proportional change in the thrust of similar percentage. The total shear force experienced
Figure 4. Only half of the domain is shown. Four regions in the domain where Q is applied are shown and labelled 1–4. The value of Q is evenly distributed in each of these regions.
Figure 5. Comparison of base case, case Q2-600, and case Q4-600 of (a) density, (b) temperature, (c) tangential velocity, and (d) pressure at the centreline, (e) shear stress at the wall, and (h) Mach number at the centreline. Cases Q2-600 and Q4-600 have a thermal heating source with a constant value of 4 × 10⁶ (W m−3) distributed over region 2 and 4, respectively.
J. Phys. D: Appl. Phys. 50 (2017) 455201

A Blanco and S Roy
9
by the fluid and the thrust produced by the device depends on the fraction of the wall area that is exposed to the higher temperatures. This observation shows that if maximizing the thrust in the device was the most desirable objective, the Q should be applied closer to the exit plane to minimize viscous losses.
For case Q2-600, the most drastic change in comparison to the base case due to the addition of thermal energy in figure 5 occurs in (a) density and (b) temperature. At the exit plane, (T) increases by a factor of (~3) and (ρ) decreases inversely pro-portional. The increase in (s) at the exit plane, as observed in figure 5(b), increases the speed of sound. The Mach number at the exit plane, figure 5(f), decreases from 1.0 for the base case to 0.75 for case Q2-600, despite (u) increasing by 13%. The addition of thermal energy has caused the flow to change from choked flow (MThroat ~ 1) to subsonic (MThroat < 1), meaning that viscous losses play an important role in this particular pressure regime for this channel design and prevent the exit tangential velocity from increasing with (T0.5) in a directly proportional manner. The pressure profile, figure 5(d), has a gradual slope until heat is added at (x = 6 mm) and decreases with a steeper slope from this point on. Exit plane (P) is vir-tually unaffected, only 4% higher. At the exit plane, (P) and (u) change only a small amount in comparison to (ρ) for case Q2-600. Given that m ∼ (ρeue), FThrust ∼
(ρeu2
e + Pe) and
Isp ∼ ue + Pe/m, the mass flow rate and thrust decrease as (ρ) decreases while the Isp increases due to the (Pe/m) term increase, since Pe/m ∝ 1/ρe ∝ Te if Pe remains unchanged when compared to the base case.
For case Q4-600, at the exit plane (T) increases by a factor of (~2), (ρ) decreases by 40%, (P) and (u) increase by 33% and 23%, respectively, in comparison to the base case. Although the increase in (P) and (u) are beneficial to increase the Isp, the Isp percent increase for this case is not as significant as for case Q2-600. The decrease in (ρ) at the exit plane plays the most important role in increasing the Isp and it is inversely proportional to the increase in (T).
The base case has an exit Reynolds number of ~33, proving our initial assumption that an expansion nozzle would be counterproductive to increase the specific impulse since (Re < 100). All other cases have smaller exit Reynolds number due to heat addition. Increasing the tangential momentum accommodation coefficient in the slip flow boundary condi-tions from 0.89 to 1.0 increased the Isp for case Q2-450 by 4%. The thermal creep (transpiration) effects can affect the variation of pressure caused by tangential temperature gradi-ents [45]. The thermal creep was only significant for cases with very high temperatures (~900 K), such as case Q2-600, where the shear stress changes by ~2 (N m−2) (20% the max. value) in the region between (5 mm < x < 10 mm) due to the thermal creep. The higher-order slip flow boundary condi-tion presented by Xue et al [46] were tested for cases with low temperature, e.g. Q2-450, and compared with cases using equation (9) and no effect in the Isp was detected.
The Kn at the centreline for the base case is 1.9 × 10⁻² at the inlet and 4.5 × 10⁻² at the exit plane, while for case Q2-600 the Kn is 1.8 × 10⁻² at the inlet, and as high as 2.0
× 10−1 at the exit plane. The KnExit for case Q2-600 is the highest of all cases and higher than the recommended range of values for slip flow regime (0.001 < Kn < 0.1). Maurer et al [47] estimated the upper limit of the slip flow regime as Kn = 0.3 ± 0.1 [45], where Kn is based on the channel height as in their study. For RGEJ, only the cases with (Kn < 0.1 or Kn ~ 0.1) will be presented and studied.
Based on this study, region 2 was picked as the best loca-tion to apply the thermal heating source in order to increase the Isp. The closer Q is applied to the inlet, the higher the exit (T), see case Q2-600 versus case Q4-600 in figure 5(b), which proportionally relates to the Isp. Region 1 was not picked due to its interaction with the inlet boundary condition. The decrease in thrust experience by the cases with Q applied in region 2 could be counteracted by using a greater number of slots or a wider slot in the device if a given thrust is necessary.
3.4. RGEJ thruster performance
The following table shows the performance parameters of sev-eral cases with plasma-aided technology at different voltages with geometry, mesh, and boundary conditions as defined in figure 2.
In general, the plots of m , FThrust, FτWall, and Isp as func-tions of Q follow similar trends as the previous cases with constant thermal heating source applied in region 2. The cur-rent, thermal heating source and power versus voltage are discussed in the subsequent section. The thrust effectiveness was calculated by adjusting the width of the device for each case to match the mass flow rate of the base case, subtracting the thrust of the base case from the adjusted thrust of each case and dividing this difference by the power consumption (PW). The effectiveness of the device increases linearly with increasing voltage with a slope of 1.8 (mN W−1 V−1). The highest effectiveness is obtained for case 750 V with an effec-tiveness of 2.106 (N W−1), by comparison, the MPT has an effectiveness of 50
(µN W−1
) for the 750 (V) and 650 (mW)
case with Isp of 74 (s) [5, 8].In table 5, the Q versus Isp have positive slopes, 31.5
(s W−1), approximately linear for the range of Q between 0–300 (mW) and independent of the location where Q is applied. The plasma-aided cases of RGEJ, shown in table 6, have a significantly higher Q versus Isp positive slope, 54.8 (s W−1), which indicates that concentrating the total value of Q in a smaller region of the domain is beneficial to increase the Isp for adiabatic cases. Case 750 V has an Isp of 60.7 (s), a 37.6% improvement over the base case. The Isp of RGEJ, (60.7 s), operating at 750 (V) is 16% higher than the Isp of a highly optimized argon propellant CGT, (52 s), and 35% higher than the Isp of the argon propellant FMMR, (45 s) [1]. The increase in Isp for case 750 V over CGTs is achieved with only 406 (mW) per centimetre of width of the device and 98.5% of the total electrical power is converted to heating of the neutral gas, which is higher than the range (81–95%) predicted by Houba and Roy [17] for a device operating at assumed constant temperature (300 K) and pressure (0.6 Torr) using air as the working fluid. The remainder of the discharge power goes into the electrons, which lose energy in inelastic
J. Phys. D: Appl. Phys. 50 (2017) 455201

A Blanco and S Roy
10
collisions due to the various ionization, attachment, and exci-tation reactions [17].
The following figures show a comparison of the results of the rarefied gas simulations.
Figure 6(c) shows how the plasma electro-thermal heating source locally heats the gas in case 750 V to temperatures as high as (~640 K) near the corner of the cathode electrode where high electric field causes the heating source to increase sharply. By comparison, the base case has a temperature pro-file that decreases along the x-axis direction as we approach the exit plane due to the flow expansion. In figure 6(g), the exit temperature at the centreline is higher for higher voltage cases with case 750 V having a temperature of (~400 K), twice the value of the base case (~200 K). The speed of sound doubles for case 750 V.
The pressure profile, see figures 6(d) and (h), is affected by the addition of thermal energy to the flow. The base case shows a near linear decrease in pressure for (x < 11 mm) with (−∂P/∂x ) ~3.5 (Pa mm−1), followed by a parabolic decrease. Four important effects are encountered in micro-flows: rar-efaction, compressibility, viscous heating, and thermal creep [45]. Out of those, compressibility and rarefaction are com-peting effects. The curvature in the pressure distribution in compressible flows is due to compressibility effects, the higher the Mach number the greater this effect becomes, the curvature increases with increased inlet to outlet pressure ratios [45]. Rarefaction decreases the curvature in the pressure distribu-tion, which becomes increasingly linear as the free-molecular flow regime is approached with increasing Kn numbers [45]. In the pressure profile in figure 6(h), rarefaction is dominant in the base case for (x < 11 mm) and the compressibility effects become increasingly important in the rest of the domain due to increasing Mach number. For all the plasma-aided cases,
case 450 V–750 V, the pressure profile is very similar inde-pendent of voltage (thermal energy input), but the pressure profile has two distinct linear regions, one before and one after the area where thermal energy is deposited. The effect of rarefaction dominates for (x < 16 mm) due to the higher Kn numbers found in the plasma-aided cases in comparison to the base case. For case 750 V, the two distinct linear regions have (−∂P/∂x ) ~ 1.5 (Pa mm−1) for (x < 7 mm) and 5.5 (Pa mm−1) for (7 mm < x < 16 mm), respectively. These two dif-ferent regions are caused by the difference in temperature which affects the shear stress at the wall in the same manner as the cases in table 5.
The tangential velocity plots, in figure 6(b), show the effect of having two distinct (−∂P/∂x ) regions in case 750 V. The base case has a constant acceleration of the flow along the channel, but case 750 V has approximately constant velocity before thermal energy is added due to the low (−∂P/∂x ) for (x < 7 mm) follow by an acceleration region where (−∂P/∂x ) is higher. The acceleration region is similar to a shorter channel operating with the same inlet to outlet pres-sure ratio at a higher inlet temperature. This observation may be useful to modify the geometry of the thruster’s design in the future for optimization purposes.
The addition of thermal energy increases the tangential velocity at the exit plane centreline from 311 (m s−1) in the base case to 362 (m s−1) in case 750 V and decreases the density from 0.73 (mg m−3) to 0.36 (mg m−3), increasing the Isp of the thruster. Due to low Reynolds numbers (<30) in all cases and dominant viscous terms, no shock disconti-nuities are found. As the Reynolds number decreases with increasing temperature (thermal energy input), the viscous losses increase causing a degradation of the thrust, which could be counteracted by extending the width of the device.
Table 5. Values of total thermal heating source (Q), mass flow rate (m), thrust (FThrust), shear force (FτWall), specific impulse (Isp), specific impulse increase (Isp Inc.) compared to the base case, exit plane Mach number (MExit) at the centreline, and exit Knudsen number (KnExit) at the centreline are displayed. Q, m , FThrust, and FτWall are per centimetre of width (W = 1 cm) of the device. For mass flow rate, SCCM means cubic centimetre per minute at STP.a
CaseRegion of applied Q as shown in figure 4
Q m FThrust FτWall Isp Isp Inc. MExit KnExit
(mW) (SCCM) (mN) (mN) (s) (%) — —
Base case None 0 178.0 2.288 1.955 44.11 — 1.192 0.046Case Q1-150 1 150 147.9 2.069 2.112 48.00 8.82 1.138 0.063Case Q1-300 1 300 118.7 1.841 2.298 53.21 20.64 1.056 0.089Case Q1-450 1 450 89.8 1.600 2.516 61.15 38.65 0.924 0.133Case Q1-600 1 600 61.3 1.370 2.746 76.65 73.79 0.722 0.208Case Q2-150 2 150 152.6 2.145 2.046 48.24 9.38 1.143 0.061Case Q2-300 2 300 127.7 1.991 2.167 53.50 21.29 1.074 0.085Case Q2-450 2 450 102.3 1.816 2.323 60.89 38.05 0.969 0.121Case Q2-600 2 600 68.3 1.563 2.566 78.45 77.87 0.750 0.203Case Q3-150 3 150 159.5 2.243 1.966 48.28 9.45 1.152 0.059Case Q3-300 3 300 141.6 2.189 1.998 53.06 20.30 1.102 0.077Case Q3-450 3 450 124.1 2.125 2.050 58.74 33.18 1.039 0.100Case Q3-600 3 600 106.4 2.047 2.124 66.03 49.71 0.954 0.131Case Q4-150 4 150 167.3 2.360 1.885 48.41 9.76 1.119 0.056Case Q4-300 4 300 156.9 2.421 1.830 52.96 20.06 1.071 0.068Case Q4-450 4 450 146.7 2.472 1.789 57.80 31.05 1.030 0.082Case Q4-600 4 600 136.7 2.512 1.756 63.04 42.93 0.991 0.098
a The values shown were obtained using adiabatic conditions, not taking into account the heat loss through the walls due to conduction and radiation.
J. Phys. D: Appl. Phys. 50 (2017) 455201

A Blanco and S Roy
11
The thermal creep, a rarefaction effect, plays a significant role close to the cathode electrode corner at (~8 mm) where the magnitude of (∂T/∂x ) is the highest, causing a sharp discontinuity in the profile of shear stress at the wall. In this location, the shear stress abruptly increases due to the thermal creep, but the thermal creep effect is negligible in the rest of the domain. In the cases presented, the viscous heating effect is not apparent since for pressure-driven compressible flows the expansion cooling negates it [45].
The following figures show a comparison of the results of the ionized gas simulations for the given DC voltages. The applied voltage was varied from 450 to 750 (V), this range is within the operating conditions of the validation cases.
Figures 7(a)–(c) and (g)–(i) display a comparison of the contours for the electrons number density, positive ions number density, and electron energy density with their higher values right before the cathode fall region. For case 750 V the maximum values reach 4.03 × 10¹⁶ (m−3), 4.23 × 10¹⁶ (m−3), and 0.045 (J m−3), respectively. The metastable atoms number densities, not shown, are approximately two orders of magnitude lower than the charged particles and their contrib-ution to ionization is very small for the given pressure opera-tion regime. The electron temperature (Te), calculated using
the electron energy and number densities, is (~4 eV) in the plasma column for all cases. In the cathode fall, where elec-tron number density decreases to very small values (<1013 m−3) by comparison to the peak value (~1016 m−3), the (Te) is over-predicted and can increase exponentially in this region of vanishing electron densities due to a numerical artefact of the fluid model [5]. This behaviour of (Te) does not affect the accuracy of the simulations for the other variables since the electron energy content is negligible in this part of the domain [5]. Figures 7(f) and (l) show the thermal heating source, con-centrated in the cathode fall, reaching a maximum value of 4 × 10⁸ (W m−3) near the corner of the cathode for case 750 V. Although this value looks large, it is concentrated in a small region of the domain and the net value of the thermal heating source is orders of (~100s mW).
An interesting finding in this comparison of cases at dif-ferent voltages is that the cathode fall region is increased with increasing voltage while compressing the region of the plasma column. When case 450 V and case 750 V are compared in figures 7(a)–(f), we can observe a shift towards the inlet of the charged particle number densities and electric potential peaks. The peak values of the number densities of charged particles remain relatively constant, ~4 × 10¹⁶ (m−3) for cases
Table 6. Values of: voltage (V), mass flow rate (m), thrust (FThrust), shear force (FτWall), specific impulse (Isp), specific impulse percent increase (Isp Inc.), current (I), total thermal heating source (Q), total electrical power (PW), fraction of the total electrical power converted into thermal heating source (Q/PW), and effectiveness of the thrust (ζThrust) at the same mass flow rate as the base case. (m), (sThrust), (FτWall), (I), (Q), and (sW) are per centimetre of width (i = 1 cm) of the device.a
CaseV (V)
m (SCCM)
FThrust (mN)
FτWall (mN)
Isp (s)
Isp Inc. (%)
I (mA)
Q (mW)
sW (mW)
s/PW (%)
ζThrust (N W−1)
Base case 0 178.0 2.288 1.955 44.1 — 0.000 0 0 — —Case 450 V 450 134.7 2.039 2.113 51.9 17.7 0.538 240 242 99.4 1.557Case 550 V 550 122.1 1.964 2.187 55.2 25.1 0.570 308 313 98.3 1.770Case 650 V 650 112.1 1.898 2.253 58.1 31.7 0.565 360 367 98.0 1.963Case 750 V 750 104.2 1.843 2.308 60.7 37.6 0.541 400 406 98.5 2.106
a The values shown were obtained using adiabatic conditions, not taking into account the heat loss through the walls due to conduction and radiation.
Figure 6. (a)–(d) Comparison of rarefied gas results between the base case on the bottom half and case 750 V on the top half, and (e)–(f) comparison of rarefied gas centreline results for the base case and all plasma cases. Variables compared are ((a) and (e)) density (ρ), (b) and (f) tangential velocity (u), (c) and (g) temperature (T), and ((d) and (h)) pressure (P).
J. Phys. D: Appl. Phys. 50 (2017) 455201

A Blanco and S Roy
12
with 550–750 (V), as the voltage is increased. The peak value for case 450 V is ~3 × 10¹⁶ (m−3). For constant gas pressure and temperature cases, the number density of charged parti-cles would drastically increase with increasing voltage, for a pressure-driven compressible flow in a channel the discharge seems to be self-limiting for the given operational param-eters. This phenomenon is related to the decrease in number density of neutrals as the gas temperature increases, both due to the localized heating. In the ion flux (Γi), the main con-tributor of current at the cathode, the ion mobility increases with increasing voltage due to an increase in electric field and a decrease in neutral number density which increases the reduced electric field (|E|/n). The ion diffusion, as established in the Einstein relation (Di = kbTiµi/e ), is further increased by the increase in ion temperature which is assumed to be the temperature of the gas due to rapid thermalization of the ions with other heavy particles. Since the ion diffusion is more sen-sitive to the effects of thermal energy addition to the gas than the mobility, the diffusion term of the ion flux causes the ion number density to decrease close to the cathode as voltage and thermal heating increase.
Most of the ionization happens close to edge of the plasma column before reaching the cathode fall and it is concentrated around the centreline, similar to the RFET when it is working at low pressures (1.5 Torr) [9]. The ions flow from this region of high electric potential, but low electric field, to the walls
where they recombined. In contrast, the electrons flow from the cathode to the rest of the walls, most of them flow into the anode and the rest into the dielectric sections of the walls to balance the ion current. The number of ions leaving the thruster through the exit plane is negligible; therefore their contribution to the thrust is neglected. Some power is always lost through inelastic collisions to solid walls and the outflow, but the heating of the walls due to neutralization is not taken into account since our assumption of adiabatic walls is just an approximation to simplify the numerical simulation of a well-insulated thruster.
3.5. RGEJ thruster discharge characteristics
The performance plasma-discharge characteristics of RGEJ are presented in this section. The discharge current is obtained by integrating the species current over the length of the elec-trode [17]
I = 2e∫
LElectrode
(∑k
Γk · n
)Wdx. (13)
The total electrical power (PW), shown in table 6 is calculated from the relation PW = VI. The net tangential plasma induced electrostatic force and the net thermal heating source are obtained by integrating equations (4) and (5) over the channel volume
Figure 7. (a)–(f) Comparison of plasma discharge results for case 450 V and case 750 V, and (g)–(l) comparison of plasma-discharge centreline results for all cases. (a), (g) Electron number density (m−3), (b) and (h) ion number density (m−3), (c) and (i) electron energy density (J m−3), (d) and (j) electric potential (V), (e) and (k) electric field tangential component (V mm−1), and (f) and (l) electro-thermal heating source (W cm−3).
J. Phys. D: Appl. Phys. 50 (2017) 455201

A Blanco and S Roy
13
assuming one centimetre of width. The tangential component of the plasma force effectiveness is defined as ζFx = Fx/PW.
In figure 8(a), the power consumed by the thruster varies from 242 to 406 (mW) over the range of voltages studied following a near linear trend, increasing with voltage. The current–voltage distribution shows a peak at 550 (V), the current decreases for higher voltages. Deconinck et al [5] showed that current decreases in a thruster with constant gas wall temperatures when the wall temperature is increased at the cathode. This phenomenon is due to the decrease in ion flux at the cathode caused by the increase in gas temperature with increasing voltage as explained previously in section 3.4. This decrease in current may be beneficial to decrease ero-sion of the cathode electrode permitting the thruster to operate at higher voltage and power. From 450 to 550 (V), the posi-tive differential resistivity in the I–V characteristics indicates that the thruster operates in the abnormal glow regime, for higher voltages the thruster is transitioning to the normal glow regime, where only a portion of the cathode is covered by the plasma.
The Isp increases linearly with increasing voltage with slope of 0.0292 (s V−1). For the voltage regime tested, the Isp has not saturated, meaning that it could be further improved by increasing the voltage. The tangential component of the plasma-induced force (Fx) and the plasma thermal heating source (Q) increase almost linearly with increasing voltage.
Although the direct contribution of the force to the total thrust is negligible, the force term near the cathode corner is about a tenth of the pressure gradient term in the Navier–Stokes equations. Fx and Fy locally affect the flow by creating a low-pressure region that pulls to flow towards the wall upstream of the corner of the cathode and accelerates the flow right after in the tangential direction. The highest force produced in the tangential direction is 38 (µN cm−1), by comparison the force produced by Houba and Roy [41] is 5 (µN cm−1) at 600 (V) and 0.6 (Torr) using air as the working fluid. The effective-ness of the plasma force increases with increasing voltage approaching a saturation point.
3.6. Thermal analysis
A simple thermal analysis of the thruster was performed by taking the temperature distribution at the channel walls and exit walls for case 750 V to calculate the hypothetical heat loss through conduction and radiation.
In figure 9(a), 8.5 mm thick, insulating walls made of silica aerogel with a thermal conductivity of 4.2 (mW m−1 K−1) for pressures (<10 Torr) and an internal microsatellite temperature of 260 K are assumed [1]. Neglecting the thermal resistivity of the electrode and dielectric materials due to their thinness, and neglecting any heat loss due to radiation through the external walls at T = f( y ), due to their assumed low emissivity, the
Figure 8. (a)Thermal heating source, power and discharge current as functions of the applied voltage. (b) Specific impulse versus voltage. (c) Tangential component of the induced force and its effectiveness as functions of the applied voltage, assuming a width of 1 cm for the thruster.
Figure 9. (a) Conduction heat loss analysis, and (b) radiation heat loss analysis for Case 750 V assuming 1 cm of width, with the temperature distribution of Case 750 V given along the wall as T = f(x).
J. Phys. D: Appl. Phys. 50 (2017) 455201

A Blanco and S Roy
14
heat loss through conduction of the internal walls at T = f(x) is 36.6 (mW) per centimetre of width of the thruster. For a well-insulated satellite, a MEMS thruster system external average temperature is 285 K [48]. At this new Tsurr, leaving a small gap in the right hand side of the domain between the thruster insulation layer and the wall of the microsatellite at T = f( y ), with an additional aluminium foil layer, the RGEJ heat loss through conduction would decrease to 7.4 (mW) per centi-metre of width of the thruster. A further reduction of heat loss via conduction could be achieved by stacking many thruster’s slots next to each other, similarly to FMMR.
In figure 9(b), the radiation analysis was performed using 400 plates in each internal wall, assuming each is a diffuse-grey surface. The inlet plane is considered a diffuse-grey sur-face with the emissivity of tungsten since the plenum chamber will contain micro-machined pillars or a porous metal mat-erial to heat the propellant. The background radiation temper-ature of outer space is assumed to be 0.0 K. The emissivities of the dielectric and electrodes were assumed to be 0.85 (boron nitrate) and 0.04 (tungsten), respectively. The heat loss due to radiation is 48.6 (mW). If materials with lower emissivities are used, such as aluminium oxide on fused silica (εAl2O3 = 0.24) and aluminium (εAl = 0.02) [49], the radia-tion heat loss decreases to 30.1 (mW). The radiation heat loss depends strongly on the emissivity of the internal walls.
The adiabatic assumption in the cases presented is intended to provide an upper limit for the thruster’s performance for the given operational parameters. The overall heat losses of a thruster working in outer space would be 37.5–85.26 (mW), which is 9–21% of the input power in Case 750 V, depending on the internal temperature of the micro-satellite, the insula-tion layer of the thruster, and the emissivity of the internal walls. In laboratory conditions, with an environment temper-ature of 300 K, the heat loss through conduction would be neg-ligible in a well-insulated thruster and the heat loss through radiation would be 23. 9 (mW), which is 5.9% of the input power, making the assumption of adiabatic walls a reasonable approximation for a comparisons with experiments.
4. Conclusion
The RGEJ device shows encouraging results with an improve-ment in Isp of 37.6% over CGTs with the same geometry and working parameters, an improvement in Isp of 16% over optim ized argon propellant CGTs, and an improvement in Isp of 35% over argon propellant FMMR. Based on the Isp versus voltage characteristics, the thruster could operate at an even higher voltage to further increase the Isp. For the configuration of electrodes studied and range of voltages, the majority of the energy is converted into gas heating (~98%); the plasma force plays a negligible role in the injection of momentum. High heat loss is typical in MEMS-scale micro-nozzles [1]. For example, FMMR required twice (200% of) the power use to heat the gas to operate due to heat losses. In contrast, a simple thermal analysis estimated that the proposed RGEJ thruster would require between 9% to 21% more input power
to maintain the same performance due to heat loss in outer space, this number could be decreased by reducing heat loss through conduction and radiation by stacking many thruster’s slots and using a dielectric material with lower emissivity.
Loosely coupling the finite element based rarefied gas module and the finite difference based IGM in the MIG frame-work resulted in a stable approach to solve internal, slip flow problems with glow discharges. These type of problems are highly unstable since the plasma and gas interact strongly with each other, but their time scales are widely different by O (10−5 s). The approach used in this study circumnavigates this problem by increasing the voltage in small increments and by having several conversion criteria as explained in the introduction of section 2. Using finite difference to solve the ionized gas is faster than using finite volume for rectangular geometries. While using the finite element based rarefied gas module will allow the analysis of more complex geometries in the future.
Argon was selected as the working fluid because it is the noble gas of choice for benchmarking plasma numerical codes due to the few reactions necessary to model the glow dis-charge at low pressure. However, thermal thruster developers prefer to use gases with lower molecular weight and higher gas constant. Our goal is to eventually develop a phase-change thruster concept that uses liquid or solid propellant, instead of argon, to avoid heavy storage tank and valve leakage prob-lems, vaporizing the propellant on demand to generate thrust. The low minimum required operating pressure (1 Torr) is selected by design to eventually develop this class of thruster. In future simulations, a different gas with better-suited prop-erties for the RGEJ thruster should be use and the geometry of the thruster should be optimized. Future simulations will focus on the effect of varying the operational parameters.
Acknowledgments
This work was supported by the Space Research Initiative (SRI) program, a joint program between the NASA Kennedy Space Center, University of Central Florida and the University of Florida. The authors would like to thank all members of the SRI project that collaborated to its success and both universi-ties for their support.
ORCID iDs
Subrata Roy https://orcid.org/0000-0002-2316-0854
References
[1] Patric Micci M M and Ketsdever A D 2000 Micropropulsion For Small Spacecraft (Progress in Astronautics and Aeronautics vol 187) (Reston, VA: AIAA) (https://doi.org/10.2514/4.866586)
[2] Ketsdever A et al 2000 Fabrication and testing of the free molecule micro-reistojet: initial results 36th AIAA/ASME/SAE/ASEE Joint Propulsion Conf. and Exhibit (Huntsville, AL) (https://doi.org/10.2514/6.2000-3672)
J. Phys. D: Appl. Phys. 50 (2017) 455201

A Blanco and S Roy
15
[3] Soni J 2014 Characterization of plasma actuator based microthruster concepts for high altitude aircrafts and cubsats PhD Thesis Department of Aerospace and Mechanical Engineering, University of Florida, Gainesville
[4] Roy S 2016 Method and apparatus of small satellite propulsion US Patent No. 9228570
[5] Deconinck T 2008 Simulation studies of direct-current microdischarges for electric propulsion PhD Thesis Department of Aerospace Engineering and Engineering Mechanics, The University of Texas, Austin, TX
[6] Greig A et al 2015 Front. Phys. 2 1–9 [7] Takahashi T et al 2009 Phys. Plasmas 16 1–14 [8] Deconinck T et al 2009 J. Appl. Phys. 106 063305 [9] Charles C and Boswell R 2012 Plasma Sources Sci. 21 1–4[10] Balagangadhar D and Roy S 2001 Comput. Methods Appl.
Mech. Eng. 190 5465–79[11] Roy S 2000 Comput. Methods Appl. Mech. Eng. 184 87–98[12] Rafatov I 2012 Phys. Plasmas 19 033502[13] Boeuf J P and Pitchford L C 1995 Phys. Rev. 51 1376[14] Rafatov I et al 2012 Phys. Plasmas 19 093503[15] Mahadevan S and Raja L L 2010 Simulation of direct-current
surface plasma discharges in air for supersonic flow control AIAA J. 50 325–37
[16] Hagelar G J M and Pitchford L C 2005 Plasma Sources Sci. Technol. 14 722–33
[17] Houba T and Roy S 2015 J. Appl. Phys. 118 1–9[18] Biagi-v7.1 database www.lxcat.net (Accessed: 30 January 2015)[19] Petrov G M and Ferreira C M 1998 Phys. Rev. E
59 3571–82[20] Rafatov I et al 2007 Phys. Lett. A 367 114–9[21] Sitaraman H and Raja L L 2012 J. Phys. D: Appl. Phys.
45 1–11[22] Boeuf J P et al 2005 Appl. Phys. Lett. 86 1–3[23] Phelps A V and Petrovic A L 1999 Plasma Sources Sci.
Technol. 8 R21–44[24] Scharfetter D and Gummel H 1969 IEEE Trans. Electron
Devices 16 64–77[25] Raju R 2003 Hydrodynamic model for investigation of gas
flows through micro-geometries and nanopores MS Thesis Mechanical Engineer Department, Kettering University, Flint, MI
[26] Hanley H 1973 J. Phys. Chem. Ref. Data 2 619–42
[27] Goldston R J and Rutherford P H 1995 Introduction to Plasma Phyiscs (Bristol: CRC Press)
[28] Choudhuri A R 1998 The Physics of Fluids and Plasmas: an Introduction for Astrophysicists (Cambridge: Cambridge University Press) (https://doi.org/10.1017/CBO9781139171069)
[29] Maxwell J C 1879 Phil. Trans. R. Soc. A 170 231–56[30] Smoluchowski V M 1898 Ann. Phys. Chem. 64 101–30[31] Agrawal A and Prabhu S V 2008 J. Vac. Sci. Technol. A
26 634–45[32] Trott W M et al 2007 Experimental measurement of
thermal accommodation coefficients for microscale gas-phase heat transfer AIAA Paper 2007-4039 (https://doi.org/10.2514/6.2007-4039)
[33] Donea J and Huerta A 2003 Finite Element Methods for Flow Problems (New York: Wiley)
[34] Roy S and Pandey B P 2003 J. Propul. Power 19 964–71[35] Roy S et al 2003 J. Appl. Phys. 93 4870–9[36] Roy S and Gaintonde D 2006 Phys. Plasmas 13 023503[37] Kumar H and Roy S 2005 Phys. Plasmas 12 093508[38] Ketsdever A D et al 2005 AIAA J. 43 633–41[39] Chen C S et al 1998 Numer. Heat Trans. A 33 749–62[40] Pong K C et al 1994 ASME-Publications-FED 197 51[41] Houba T 2016 Parallel 3D numerical simulation of dielectric
barrier discharge plasma actuators PhD Thesis Department of Aerospace and Mechanical Engineering, University of Florida, Gainesville, FL
[42] Godyak V A et al 1991 IEEE Trans. Plasma Sci. 19 660–76[43] Lieberman M A and Lichtenberg A J 2005 Principles of
Plasma Discharges and Materials Processing (Hoboken, NJ: Wiley) (https://doi.org/10.1002/0471724254)
[44] Pancheshnyi S et al 2012 Chem. Phys. 398 148–53[45] Karniadakis G E et al 2006 Microflows and Nanoflows:
Fundamentals and Simulation vol 29 (New York: Springer) (https://doi.org/10.1007/0-387-28676-4)
[46] Zhang W M et al 2012 Microfluid Nanofluidics 13 845–82[47] Maurer J et al 2003 Phys. Fluids 15 2613–21[48] Kang S and Oh H 2016 Int. J. Aerosp. Eng. 2016 1–17[49] Henninger J 1984 Solar Absorptance and Thermal Emittance
of Some Common Spacecraft Thermal-Control Coatings (Washington, DC: NASA) (http://www.dtic.mil/docs/citations/ADA305864)
J. Phys. D: Appl. Phys. 50 (2017) 455201