panel discussion on opportunities in asia presented by mr. bijay murmuria president-anmi,india...
TRANSCRIPT

Panel Discussion on
Opportunities in Asia Presented by
Mr. Bijay MurmuriaPresident-ANMI ,India
E-Mail : [email protected]

World Economic Outlook

High Income vs. Developing Nations
The slowdown in the United States
and in much of Europe appears to
have intensified since the end of
2007, and GDP for the high-income
members of the Organization for
Economic Co-operation and
Development (OECD) is now
projected to grow 1.5 percent in 2008,
down a full percentage point from
2007.
Growth in developing countries is
projected to slow down by 1.3
percentage points in 2008, but at an
expected 6.5 percent, growth will
remain well above the average gains
of the 1980s (2.9 percent), the 1990s
(3.8 percent), and even the more
recent period 2000–05 (5.3 percent).
vs.
Turmoil in financial markets ,slower growth in high income countries and rising inflation have all adversely affected
growth prospects for World Economy over the near term
World Economy
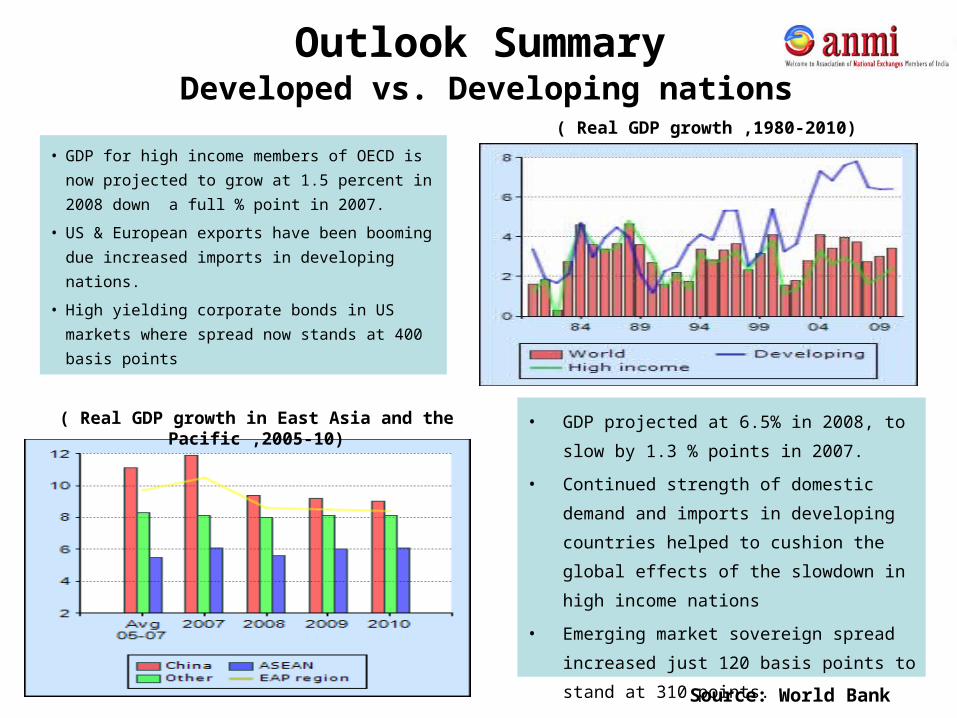
Outlook Summary
• GDP for high income members of OECD is now
projected to grow at 1.5 percent in 2008 down a
full % point in 2007.
• US & European exports have been booming
due increased imports in developing nations.
• High yielding corporate bonds in US markets
where spread now stands at 400 basis points
• GDP projected at 6.5% in 2008, to slow by 1.3
% points in 2007.
• Continued strength of domestic demand and
imports in developing countries helped to
cushion the global effects of the slowdown in
high income nations
• Emerging market sovereign spread increased
just 120 basis points to stand at 310 points.
Developed vs. Developing nations( Real GDP growth ,1980-2010)
( Real GDP growth in East Asia and the Pacific ,2005-10)
Source: World Bank

Growth Rates (y-o-y percent)
Parameter Current Period Previous Period
Real GDP 2.5 1Q08 2.5 4Q07
Unemployment 5.5 Jun-08 5.5 May-08
CPI Headline Inflation 5.0 Jun-08 4.2 May-08
CPI Core Inflation 2.4 Jun-08 2.3 May-08
Trade Deficit (US$ billion) 59.8 May-08 60.5 Apr-08
Growth Rates (y-o-y percent)
Parameter Current Period Previous Period
Real GDP 2.5 1Q08 2.7 4Q07
Unemployment 5.2 May-08 5.2 Apr-08
CPI Inflation 3.8 Jun-08 3.3 May-08
Trade Deficit (£billion) 4.2 May-08 4.1 Apr-08
• The ISM non manufacturing index posted a
bigger than expected fall 48.2 in June from
51.7
• Exports grew further by 17.8 percent in May
to reach US$ 157.7 billion .
• Oil prices pushed up the import bill to US$
217.3 up 12.5 percent.
• Inflation emerged as a major risk as it surged
to a 17 year high of 5 percent owing to
escalating oil casts & high food and
commodity prices.• GDP growth was revised marginally
upwards to reflect surprisingly strong
consumption growth ( 1.4 %) and weak
business environment (-1.4 %).
• Consumer Confidence surveys remain
at extremely low levels
• Exports remaining flat
• Consumer price inflation shot further to
3.8 percent owing to sharp rise in food
and oil prices.
US ECONOMY
UK ECONOMY
Source:BEA,BLS
Source: National Statistics

Emerging Asian Economies

Emerging markets: Engine of growth for the
World Economy
• Emerging markets China, India are for first time largest drivers of world growth
• Strong emerging markets growth due to sound policies & benign external conditions
Source:IMF

Chinese Economy
Economic Highlights:
• The world bank revised China’s economic growth from 9.4 percent to 9.8 percent in 2008.
• The GDP forecast showing strong service sector growth
• As per the Institute of Industrial Economics China , the nation is expected to spend 12 trillion Yuan
(US$ 1.75 trillion) on fixed assets investment. The investment is forecast to grow an average of 20
percent annually.
• Red hot economy continues to expand on account of booming exports and massive investments on
Infrastructure.
• In the first half of 2008, retail sales in China rose by 21.6 percent to US$ 126 billion ,one of the fastest
increase in 9 years.
• In May Exports shot up by 28.1 percent y-o-y export revenue to a monthly record of US$ 120 billion
• Booming Domestic Private Consumption ,retail sales rose by 21.6 % to US$ 126 billion ,one of the
fastest increase in 9 years.
Growth Rates (y-o-y percent)
Parameter Current Period Previous Period
Real GDP 10.1 2Q08 10.6 1Q08
CPI Inflation 7.1 Jun-08 7.7 May-08
Trade Surplus (US$ billion) 20.2 May-08 22.3 Apr-08
Source: National statistics Centre

SWOTStrengths:
• 4th largest in the world
• Continued growth overtake the US GDP around 2040.
• S&P forecasts growth rate at 8 % next two years
• Banking Industry the second largest by 2014.
• Shanghai has the top financial infrastructure
• Robust community of non locals it an attractive place for foreigners
Weaknesses:
• Scarce Talent
• Legal set up
• Lack of English speaking
Workforce
Opportunities:
• A turnaround for the stock market index which earlier had a index rise of 460%
• Largest untapped Insurance market.
• More FDI gives a room for new entrepreneurs
Threats:
• Surging wage costs
• High material costs
• Currency appreciation
• Reduced tax rebates

Indian Economy
• Overall GDP during 2007-08 has been estimated at 9% (as per Advance estimate of CSO)
• Food grain stocks were 30.55 million as on May 1,2008.
• Forex reserves stood at (excluding gold & SDRs) stood at US$ 302.34 billion at the end of June 2008.
• FDI has surged to over US$ 25 billion in 2007-08,FDI flows in India stood at $ 10.07 billion for the
Q1FY09,compared to $4.9 billion for the same in FY08.
• Headline inflation at 13 year high in June 2008 at 11.5 percent.
• According to CMIE ,India is expected to record a 10 percent growth in industrial production during the current
Fiscal (2008-09) ,as against 8.3 percent in the previous fiscal.
• McKinsey Global Institute (MGI) ranks India as the fifth largest consumer market in the world by 2025.
• According to Assocham India’s Real Estate sector is expected to receive US$ 25 billion as FDI in the next 10
years. Presently the market is worth US$ 15 billion of which FDI is estimated at US$ 4 billion.
• CRISIL expects exports to grow at 19 percent and imports to grow at 28.2 percent in FY09.
Growth(%)
Parameter Forecast
Agriculture 3.0
Industry 7.5
Services 9.5
Total GDP 7.8
Private Consumption 7.6
Inflation WPI Average 8.5-9.0
Interest rate 10-Year G-Sec (Year end) 8.5-8.7
Exchange rate Re/US$ (Year End) 41.0-41.5
Fiscal Deficit As a % of GDP 41.0-41.5
Source:CRISIL
Outlook Financial Year 2008-09

SWOTStrengths:
• Positive demographics with huge Indian
workforce
• High savings and investment rate over 35 % of
the GDP.
• Domestic Demand and investment are the key
drivers of growth
• PE Investments in India remain buoyant
• Positive Interest rate differential
• India's total trade to GDP has doubled over the
past seven years to almost 50% in 2007.
Opportunity:
• Growth potential of the services sector in
India is enormous at US$ 200 offering
employment to 40 million people.
• A large Indian middle class of more than 300
million provides a large consumer base for a
variety of products and services.
• The USIBC Survey (US India Business
Council) rates future economic growth as
highly sustainable.
• Role of Private sector in Infrastructure
funding gaining prominence.
Threats:
• Slowdown in foreign Institutional fund
flows to emerging markets.
• Poor health and Hygiene conditions
• Failed to capitalize fully on
manufacturing ,agribusiness and
Tourism.
Weaknesses:
• Curbing inflation remains a major concern
• Foreign currency risk
• Lack of capital funding to the SME segment
• High cost of debt and equity capital which hinders financial development.
• Underdeveloped corporate bond market

Target Country Q2 2007 Q3 2007 Q4 2007 Q1 2008 Q2 2008
Republic of Korea 825 548 138 555 549
Japan 480 391 592 721 524
China 883 1036 977 999 510
Australia 1577 968 721 411 412
Taiwan 673 302 191 125 179
Singapore 130 166 213 197 176
Hong Kong 72 110 87 70 157
Malaysia 189 325 365 215 119
India 392 494 681 550 65
Thailand 51 115 106 86 54
Target Country Q2 2007 Q3 2007 Q4 2007 Q1 2008 Q2 2008
Australia 97,818 47,931 36,045 78,684 52,197
China 55,108 68,555 79,262 64,520 46,033
Hong Kong 5,408 10,161 18,047 4,671 29,733
Japan 24,672 30,677 37,923 23,285 17,795
India 14,581 13,735 28,396 24,938 12,347
Republic of Korea 26,923 23,786 10,995 16,729 12,149
Taiwan 14,871 13,216 8,364 5,146 10,804
Singapore 6,904 4,888 7,595 12,367 10,229
Indonesia 3,951 2,204 6,710 6,797 3,038
British Virgin Islands 1,885 18 568 154 2,972
Mergers & Acquisitions Activity
Top 10 countries by Deal Volume
Top 10 countries by Deal Value
Source: Zephyr Deal Database
Amount: Million (USD)

Sovereign Wealth FundsSovereign wealth funds likely to turn to Asia: A move to push the dollar lower against Asian currencies. Sovereign wealth funds opting to raise investments in stock ,bonds and real
estate in China, India and Japan.
Country FundAssets
$ bnInception
YearOrigin
UAE ADIA 875 1976 Oil
Singapore GIC 330 1981 Non Commodity
Norway Government Pension Fund Global 396.5 1990 Oil
China State Foreign Exchange Investment Corp 311.6 2007 Non Commodity
Singapore Temasek Holdings 159 1974 Non Commodity
Kuwait Kuwait Investment Opportunity 264.4 1953 Oil
Australia Australian Future Fund 58.5 2004 Non Commodity
US (Alaska) Permanent Fund Corporation 39.8 1976 Oil
Russia National Welfare Fund 162.5 2008 Oil
Brunei Brunei Investment Agency 30 1983 Oil
South Korea Korea Investment Corporation 30 2005 Non Commodity
Source: Sovereign Wealth Fund Institute
Largest funds by assets under management

• JP Morgan Projects that SWFs will grow to reach between $5 trillion - $9.3 trillion AUM by 2012.
• SWF can afford to hold illiquid assets during Financial crisis.
• Potential to promote financial market stability
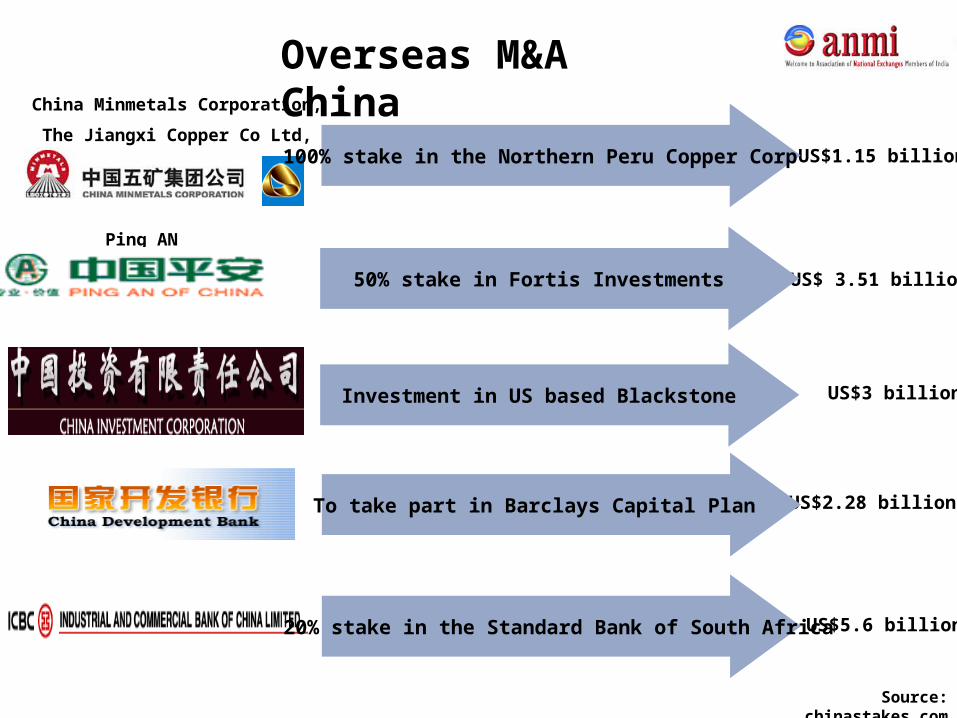
Overseas M&A ChinaChina Minmetals Corporation,
The Jiangxi Copper Co Ltd, US$1.15 billion
Ping AN
US$ 3.51 billion
US$3 billion
US$2.28 billion
US$5.6 billion
Source: chinastakes.com
100% stake in the Northern Peru Copper Corp
50% stake in Fortis Investments
Investment in US based Blackstone
To take part in Barclays Capital Plan
20% stake in the Standard Bank of South Africa

Overseas M&A India
Tata buys Jaguar and Land Rover
Essar Steel acquired Algoma Steel
Tata Steel buys Corus Plc
Hindalco acquired Novelis Inc.
Suzlon Energy Ltd acquires RE power
US$ 12.1 Billion
US$ 6 Billion
US$ 2.3 Billion
US$ 1.58 Billion
US$ 1.6 Billion
Source:IBEF

Future Outlook

The shift of power to Emerging Economies
The Global economy is in transition• High rates of Investment in Asian countries exceeding 20% of GDP
• Superior productivity performance
• Significant rise in wholesale financial services cross Asia
• Liberalization
• Digitalization
• Standardization
• Cross capital flows reached a new high with a CAGR of 10.7% between 1990 to 2005.
• Asian central banks are among the most significant new players in the Global Financial System
• More pronounced IT services in Asia, led by India which accounts for 26 percent of the Global market.
• Highly educated labour ad strong work ethics
China will move ahead of the US by 2027
India will catch up with the US by 2050
BRICs as a group will surpass the G7 by 2032.

IBR Emerging Markets Index 2008
% of Business Imports Top & Bottom Six
Source: Grant Thornton
Change in % of Business Exports 2007-08
International Business Review Emerging markets Index 2008 based on:
• Weighted calculation of Key Indicators such as GDP,Poulation size, international trade and growth projection.
• Each of the variables in the model was averaged as an index calculated using this average (mean) as 100.

Common Parameters for Emerging Economies and Booming Global
Economy
• Accelerating GDP Growth rate and Employment Benefits
• Increasing Domestic market competitiveness and Efficiency
• Enables financial Institutions to prosper in a conducive growth
environment.
• More resilient to Financial Crisis.
• Enhances Diplomatic positioning regionally & Internationally.

• Easy availability of Cheap credit
• Consumption boom leading to
consumer pessimism & fall in
spending habits.
• Poor economic policies disturbing
the balance between money supply,
interest rates and inflation.
• Low savings
• Negative Demographics
• Costly Manufacturing facilities
Critical Success factors for Asia
Weak fundamentals Strong Underlying Assets
• Positive Demographics
• Low manufacturing costs
• High savings pattern
• Development of Human Capital
• Internationalism
• Robust Financial system
• Public Private Partnership
• Accumulation of large Financial
Reserves.
• High cut on domestic spending.
• High Foreign Reserves.
