pan-canadian assessment program (2013) - eqao … 2014 pan-canadian assessment program (2013) ......
TRANSCRIPT
October 2014
Pan-Canadian Assessment Program (2013)
Ontario Report
Pan-Canadian Assessment Program (2013)
Ontario Report
October 2014
Education Quality and Accountability Office I Pan-Canadian Assessment Program (2013), Ontario Report
Contents
Introduction . . . . . . . . . . . . . . . . . . . . . . . . . . . . . . . . . . . . . . . . . . . . . . . . . . . . . . . . . . . . . . . . . . . . . . . . . . . . . . . . . . 1
Achievement Results . . . . . . . . . . . . . . . . . . . . . . . . . . . . . . . . . . . . . . . . . . . . . . . . . . . . . . . . . . . . . . . . . . . . . . . . . . 2
Figure 1: Science Results by Jurisdiction . . . . . . . . . . . . . . . . . . . . . . . . . . . . . . . . . . . . . . . . . . . . . . . . . . . . . . . . . . . . . . . . . . . . . . . . . 2
Figure 2: Reading Results by Jurisdiction . . . . . . . . . . . . . . . . . . . . . . . . . . . . . . . . . . . . . . . . . . . . . . . . . . . . . . . . . . . . . . . . . . . . . . . . . 3
Figure 3: Mathematics Results by Jurisdiction . . . . . . . . . . . . . . . . . . . . . . . . . . . . . . . . . . . . . . . . . . . . . . . . . . . . . . . . . . . . . . . . . . . . . . 3
Table 1: Science Results by Jurisdiction—English-Language . . . . . . . . . . . . . . . . . . . . . . . . . . . . . . . . . . . . . . . . . . . . . . . . . . . . . . . . . . . 4
Table 2: Science Results by Jurisdiction—French-Language . . . . . . . . . . . . . . . . . . . . . . . . . . . . . . . . . . . . . . . . . . . . . . . . . . . . . . . . . . . 4
Table 3: Reading Results by Jurisdiction—English-Language . . . . . . . . . . . . . . . . . . . . . . . . . . . . . . . . . . . . . . . . . . . . . . . . . . . . . . . . . . 5
Table 4: Reading Results by Jurisdiction—French-Language . . . . . . . . . . . . . . . . . . . . . . . . . . . . . . . . . . . . . . . . . . . . . . . . . . . . . . . . . . . 5
Table 5: Mathematics Results by Jurisdiction—English-Language . . . . . . . . . . . . . . . . . . . . . . . . . . . . . . . . . . . . . . . . . . . . . . . . . . . . . . . 6
Table 6: Mathematics Results by Jurisdiction—French-Language . . . . . . . . . . . . . . . . . . . . . . . . . . . . . . . . . . . . . . . . . . . . . . . . . . . . . . . 6
Figure 4: Percentage of Students at Each Level of Performance in Science by Jurisdiction . . . . . . . . . . . . . . . . . . . . . . . . . . . . . . . . . . . . 7
Figure 5: Results for Science Subdomains by Jurisdiction . . . . . . . . . . . . . . . . . . . . . . . . . . . . . . . . . . . . . . . . . . . . . . . . . . . . . . . . . . . . . 8
Discussion of Results . . . . . . . . . . . . . . . . . . . . . . . . . . . . . . . . . . . . . . . . . . . . . . . . . . . . . . . . . . . . . . . . . . . . . . . . . 9
Background . . . . . . . . . . . . . . . . . . . . . . . . . . . . . . . . . . . . . . . . . . . . . . . . . . . . . . . . . . . . . . . . . . . . . . . . . . . . . . . . . 10
The Development Process . . . . . . . . . . . . . . . . . . . . . . . . . . . . . . . . . . . . . . . . . . . . . . . . . . . . . . . . . . . . . . . . . . . . . 11
The Reading Component . . . . . . . . . . . . . . . . . . . . . . . . . . . . . . . . . . . . . . . . . . . . . . . . . . . . . . . . . . . . . . . . . . . . . . . . . . . . . . . . . . . . 11
The Mathematics Component . . . . . . . . . . . . . . . . . . . . . . . . . . . . . . . . . . . . . . . . . . . . . . . . . . . . . . . . . . . . . . . . . . . . . . . . . . . . . . . . . 11
The Science Component . . . . . . . . . . . . . . . . . . . . . . . . . . . . . . . . . . . . . . . . . . . . . . . . . . . . . . . . . . . . . . . . . . . . . . . . . . . . . . . . . . . . 11
Scoring the Student Booklets . . . . . . . . . . . . . . . . . . . . . . . . . . . . . . . . . . . . . . . . . . . . . . . . . . . . . . . . . . . . . . . . . . 12
Guidelines for Interpreting Results . . . . . . . . . . . . . . . . . . . . . . . . . . . . . . . . . . . . . . . . . . . . . . . . . . . . . . . . . . . . . . 12
National Assessments in Previous Years . . . . . . . . . . . . . . . . . . . . . . . . . . . . . . . . . . . . . . . . . . . . . . . . . . . . . . . . . 14

Education Quality and Accountability Office 1 Pan-Canadian Assessment Program (2013), Ontario Report
Introduction
The Pan-Canadian Assessment Program (PCAP) is a national assessment program that
measures the reading, mathematics and science achievement of Grade 8 students in the
Canadian provinces and territories . It has been administered in 2007, 2010 and 2013; in
2013 all 10 provinces (referred to as jurisdictions in this report) participated .
For each administration of PCAP, one domain is designated major and the other two are minor . The major domain has a larger number of
assessment items, which enables the reporting of results for subdomains; only overall results are reported for the minor domains . In addition,
a standard setting process is conducted to determine cut points for reporting results at four performance levels for the major domain . In 2013,
science was the major domain .
Each student responded to questions in all three domains, but subsamples of students answered different questions . Most students were
expected to complete the assessment in 90 minutes . Additional time, up to 30 minutes, was permitted for students who required it .

Pan-Canadian Assessment Program (2013), Ontario Report 2 Education Quality and Accountability Office
Achievement Results
Results for PCAP are reported on a scale with a mean of 500 and a standard deviation of
100 . In addition, results for science are reported according to four performance levels .
Descriptions of the assessment instruments and the reporting categories are presented later
in this report . The following are key findings:
■ Ontario was the only jurisdiction whose students achieved
at or above the Canadian average in all three of the domains
studied—science, reading and mathematics .
■ Ontario and Alberta were the only jurisdictions with results
above the Canadian average in science .
■ Ontario was the only jurisdiction with results above the
Canadian average in reading, and the Ontario average in
reading was higher than those for all other jurisdictions .
Ontario student performance in reading has improved since
the last PCAP administration, in 2010 .
■ Ontario and Alberta had results at the Canadian average in
mathematics . Only Quebec had results above the Canadian
average . Ontario student performance has remained the same
since the last PCAP administration, in 2010 .
■ In science, the major domain, 94% of Ontario Grade 8 students
achieved the expected level of performance—Level 2, baseline
proficiency—or above .
See Figures 1 to 3, which show which jurisdictions are above, at and below the Canadian average scale score, as well as the confidence
interval for each jurisdiction . *
Figure 1: Science Results by Jurisdiction
440 460 480 500 520 540
95% Con�dence Interval
Alberta (521 ± 4.9)
Prince Edward Island (491 ± 5.0)
British Columbia (501 ± 4.2)
Ontario (511 ± 4.5)
Canada (500 ± 1.9)
Saskatchewan (486 ± 4.2)
Manitoba (465 ± 3.1)
New Brunswick (469 ± 3.7)
Newfoundland and Labrador (500 ± 4.3)
Quebec (485 ± 3.6)
Nova Scotia (492 ± 3.6)
Mean Score and Condence Interval
Above the Canadian average
At the Canadian average
Below the Canadian average
* If the confidence intervals for two jurisdictions overlap, the difference between the average scores for the jurisdictions is not statistically significant .

Education Quality and Accountability Office 3 Pan-Canadian Assessment Program (2013), Ontario Report
Achievement Results, cont’d
Figure 2: Reading Results by Jurisdiction
440 460 480 500 520 540
95% Con�dence Interval
Ontario (524 ± 3.6)
Newfoundland and Labrador (495 ± 3.8)
Canada (508 ± 2.0)
Quebec (503 ± 2.5)
Alberta (502 ± 3.7)
Prince Edward Island (494 ± 4.4)
Manitoba (469 ± 2.9)
New Brunswick (471 ± 3.0)
Nova Scotia (488 ± 3.2)
Saskatchewan (487 ± 3.1)
British Columbia (502 ± 3.4)
Mean Score and Con�dence Interval
Above the Canadian averageAt the Canadian average
Below the Canadian average
Figure 3: Mathematics Results by Jurisdiction
440 460 480 500 520 540
95% Con�dence Interval
Quebec (527 ± 2.9)
New Brunswick (480 ± 3.5)
Canada (507 ± 2.0)
Ontario (512 ± 3.5)
Alberta (502 ± 3.9)
Saskatchewan (488 ± 3.9)
Manitoba (471 ± 3.3)
Nova Scotia (488 ± 3.3)
Newfoundland and Labrador (487 ± 4.7)
Prince Edward Island (492 ± 3.7)
British Columbia (489 ± 3.2)
Mean Score and Condence Interval
Above the Canadian average
At the Canadian average
Below the Canadian average
Pan-Canadian Assessment Program (2013), Ontario Report 4 Education Quality and Accountability Office
Achievement Results, cont’d
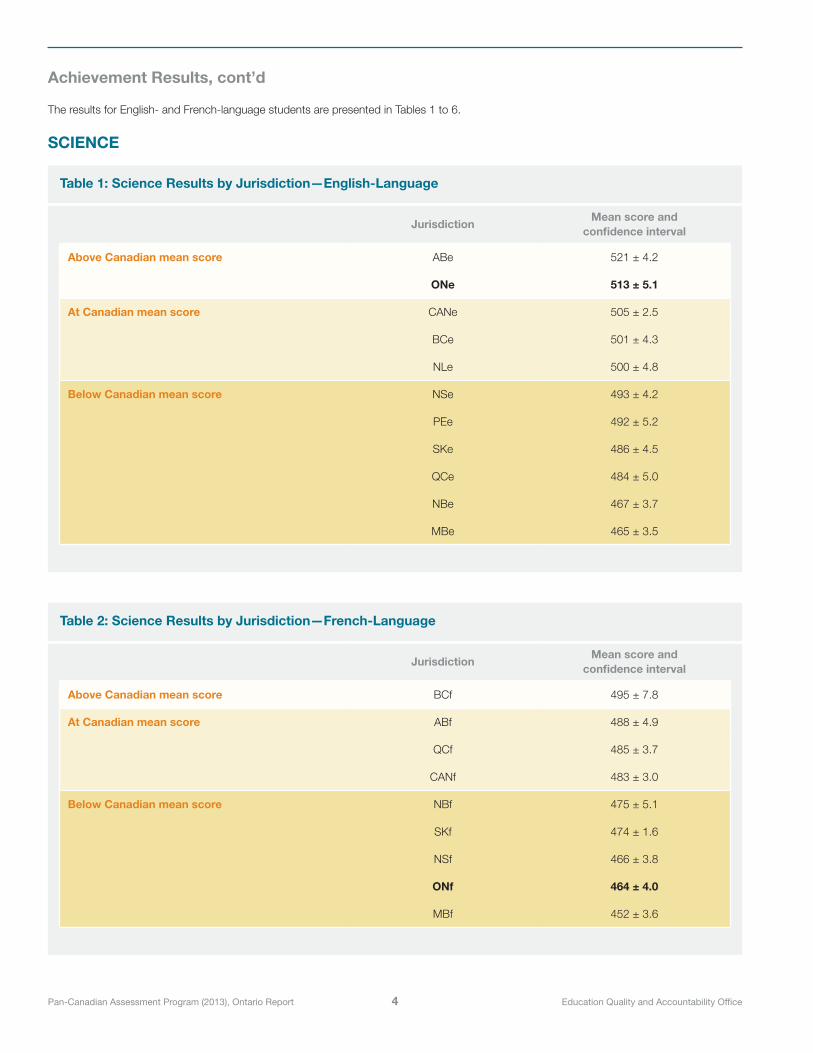
The results for English- and French-language students are presented in Tables 1 to 6.
SCIENCE
Table 1: Science Results by Jurisdiction—English-Language
JurisdictionMean score and
confidence interval
Above Canadian mean score ABe 521 ± 4.2
ONe 513 ± 5.1
At Canadian mean score CANe 505 ± 2.5
BCe 501 ± 4.3
NLe 500 ± 4.8
Below Canadian mean score NSe 493 ± 4.2
PEe 492 ± 5.2
SKe 486 ± 4.5
QCe 484 ± 5.0
NBe 467 ± 3.7
MBe 465 ± 3.5
Table 2: Science Results by Jurisdiction—French-Language
JurisdictionMean score and
confidence interval
Above Canadian mean score BCf 495 ± 7.8
At Canadian mean score ABf 488 ± 4.9
QCf 485 ± 3.7
CANf 483 ± 3.0
Below Canadian mean score NBf 475 ± 5.1
SKf 474 ± 1.6
NSf 466 ± 3.8
ONf 464 ± 4.0
MBf 452 ± 3.6

Education Quality and Accountability Office 5 Pan-Canadian Assessment Program (2013), Ontario Report
Achievement Results, cont’d
READING
Table 3: Reading Results by Jurisdiction—English-Language
JurisdictionMean score and
confidence interval
Above Canadian mean score ONe 526 ± 3 .5
At Canadian mean score CANe 510 ± 2 .1
Below Canadian mean score ABe 503 ± 4 .0
BCe 502 ± 3 .3
QCe 497 ± 3 .9
PEe 496 ± 5 .5
NLe 495 ± 4 .5
NSe 489 ± 4 .0
SKe 487 ± 2 .5
MBe 469 ± 2 .8
NBe 466 ± 3 .7
Table 4: Reading Results by Jurisdiction—French-Language
JurisdictionMean score and
confidence interval
At Canadian mean score QCf 504 ± 3 .3
CANf 501 ± 2 .2
BCf 499 ± 8 .3
Below Canadian mean score NBf 485 ± 4 .6
ONf 481 ± 3 .2
SKf 478 ± 2 .4
ABf 473 ± 4 .0
MBf 471 ± 3 .1
NSf 468 ± 3 .9
Pan-Canadian Assessment Program (2013), Ontario Report 6 Education Quality and Accountability Office
Achievement Results, cont’d
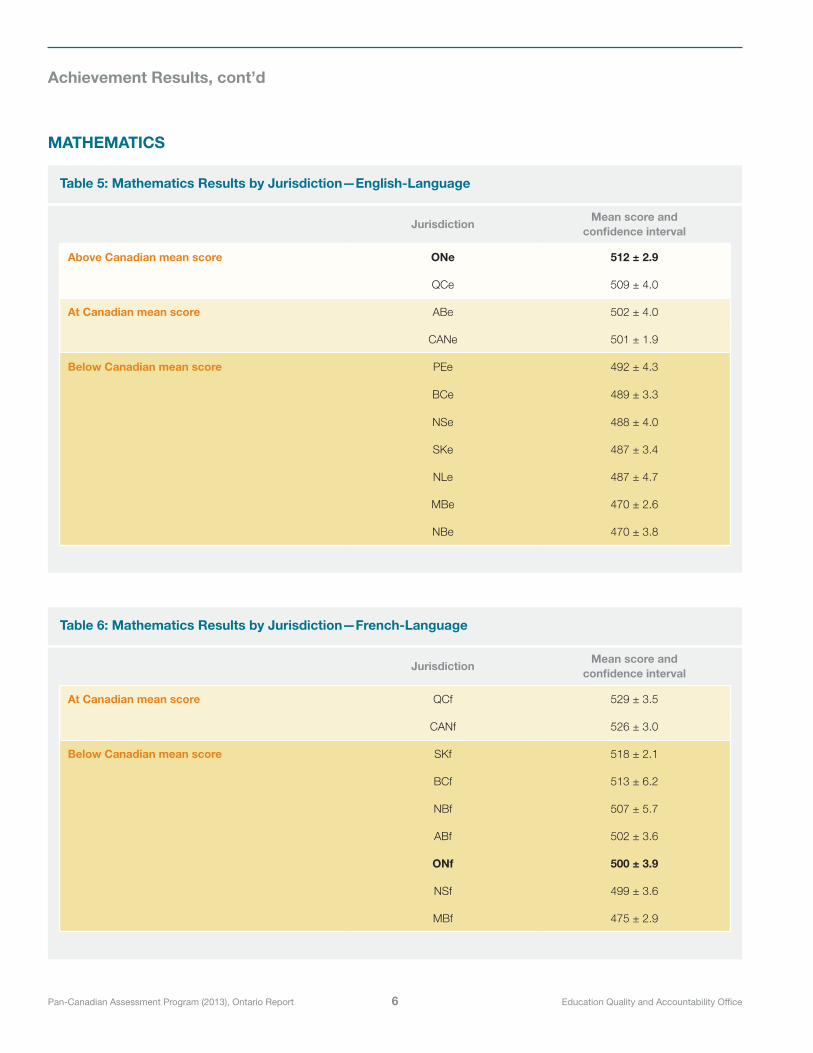
MATHEMATICS
Table 5: Mathematics Results by Jurisdiction—English-Language
JurisdictionMean score and
confidence interval
Above Canadian mean score ONe 512 ± 2 .9
QCe 509 ± 4 .0
At Canadian mean score ABe 502 ± 4 .0
CANe 501 ± 1 .9
Below Canadian mean score PEe 492 ± 4 .3
BCe 489 ± 3 .3
NSe 488 ± 4 .0
SKe 487 ± 3 .4
NLe 487 ± 4 .7
MBe 470 ± 2 .6
NBe 470 ± 3 .8
Table 6: Mathematics Results by Jurisdiction—French-Language
JurisdictionMean score and
confidence interval
At Canadian mean score QCf 529 ± 3 .5
CANf 526 ± 3 .0
Below Canadian mean score SKf 518 ± 2 .1
BCf 513 ± 6 .2
NBf 507 ± 5 .7
ABf 502 ± 3 .6
ONf 500 ± 3 .9
NSf 499 ± 3 .6
MBf 475 ± 2 .9
Education Quality and Accountability Office 7 Pan-Canadian Assessment Program (2013), Ontario Report
Achievement Results, cont’d
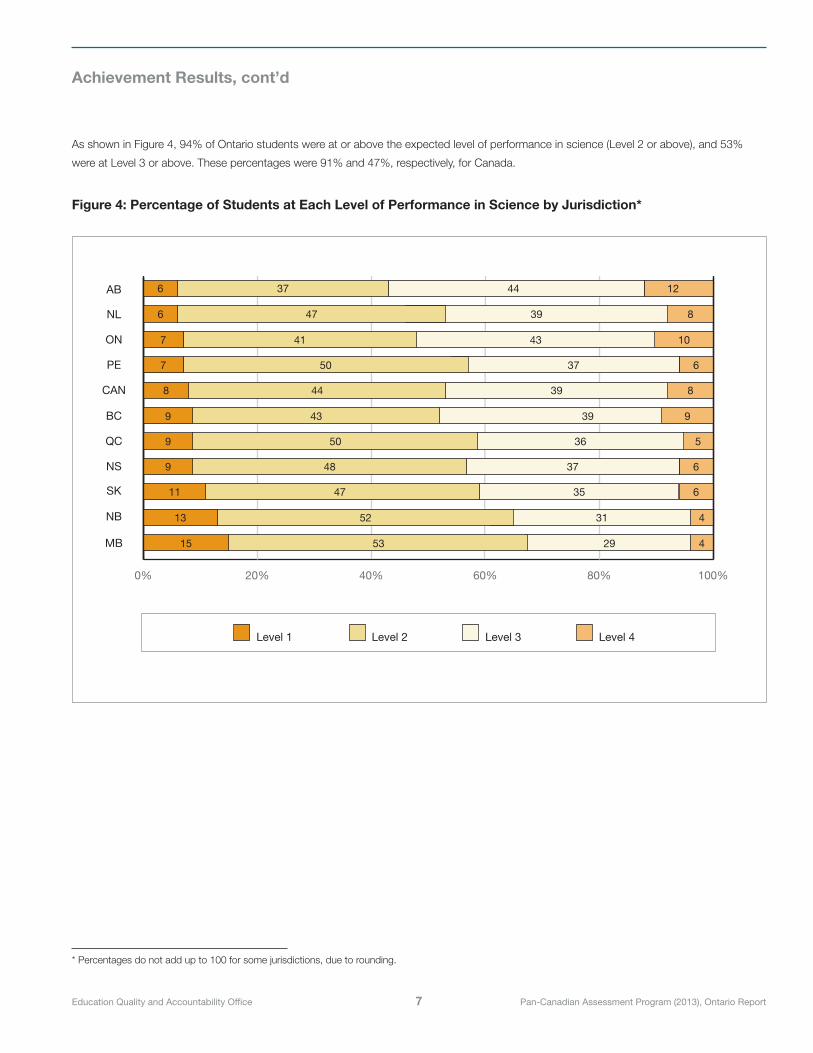
As shown in Figure 4, 94% of Ontario students were at or above the expected level of performance in science (Level 2 or above), and 53%
were at Level 3 or above . These percentages were 91% and 47%, respectively, for Canada .
Figure 4: Percentage of Students at Each Level of Performance in Science by Jurisdiction*
* Percentages do not add up to 100 for some jurisdictions, due to rounding .
0% 20% 40% 60% 80% 100%
6 1237 44
6 847 39
7 1041 43
7 650 37
8 844 39
9 943 39
9 550 36
9 648 37
11 647 35
13 452 31
15 453 29
Level 1 Level 2 Level 3 Level 4
AB
NL
ON
PE
CAN
BC
QC
NS
SK
NB
MB
Pan-Canadian Assessment Program (2013), Ontario Report 8 Education Quality and Accountability Office
Achievement Results, cont’d
Gender
There were no statistical differences between the mean scores of male and female Ontario students for science (both were 511) or for
mathematics (females, 511; males, 514) . However, female students in Ontario continue to perform better than male students in reading (mean
scores of 538 compared to 510, respectively) . These trends for gender achievement were the same at the national level .
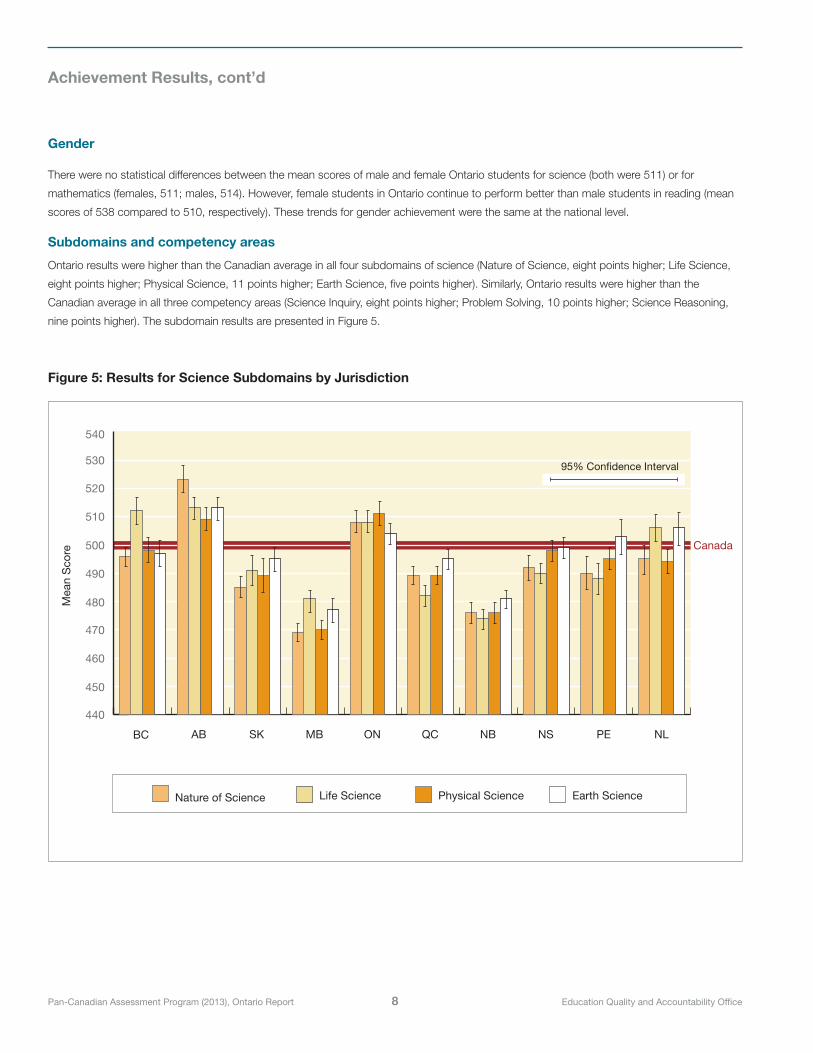
Subdomains and competency areas
Ontario results were higher than the Canadian average in all four subdomains of science (Nature of Science, eight points higher; Life Science,
eight points higher; Physical Science, 11 points higher; Earth Science, five points higher) . Similarly, Ontario results were higher than the
Canadian average in all three competency areas (Science Inquiry, eight points higher; Problem Solving, 10 points higher; Science Reasoning,
nine points higher) . The subdomain results are presented in Figure 5 .
Figure 5: Results for Science Subdomains by Jurisdiction
440
450
460
470
480
490
500
510
520
530
540
BC AB SK MB ON QC NB NS PE NL
Nature of Science Life Science Physical Science Earth Science
Canada
Mea
n S
core
95% Con�dence Interval
Education Quality and Accountability Office 9 Pan-Canadian Assessment Program (2013), Ontario Report
Discussion of Results1 . Ontario students remained top of class in the third
administration of the Pan-Canadian Assessment Program
(PCAP), in 2013 . Ontario is the only jurisdiction whose students
achieved at or above the Canadian average in all three of the
domains studied—science, reading and math . PCAP results
over time show that Ontario students are consistently among
the top performing students in Canada .
2 . Ontario student performance has improved notably in reading
and remained constant in math since the last administration of
PCAP, in 2010 . Science achievement results on PCAP cannot
yet be compared over time, because 2013 was the first time
science was the major domain studied .
3 . In all domains, Ontario’s English-language students achieved
above the Canadian average for English-language students .
4 . In all domains, Ontario’s French-language students achieved
below the Canadian average for French-language students .
5 . In Ontario, female students continued to outperform male
students in reading . There was no statistical gender gap
in science or math . These trends were the same at the
national level .
6 . Science learning reinforces global competencies such as
critical and creative thinking, the application of technology and
collaborative work . Significant science skills will be required for
many jobs in the future .
The results of PCAP 2013 and recent international assessments
suggest that Ontario students are well-positioned among their
national peers in the development of science skills . These
results should reinforce a collective resolve to ensure our
students acquire the science skills to succeed in the world and
workforce of the 21st century .
7 . Reading skills are critical for success in the 21st century .
Results on PCAP 2013 and on recent international assessments
point to a high and sustained level of reading achievement
in Ontario relative to other jurisdictions . EQAO’s provincial
assessment results also show strong reading achievement as
well as improvement in some areas .
The Ontario school system’s focus on reading has positioned its
students as national and international leaders in this area .
8 . Mathematics is integral to multiple aspects of everyday life in the
21st century—from the use of technology to the paying of bills .
In addition, mathematics skills will be an important prerequisite
for job success in the future—particularly those focused on
technology development and implementation . The results of
PCAP 2013 indicate that Ontario students are among the top
performers in math, relative to their national peers .
Recent provincial and international assessment results reinforce
the need to continue to focus attention on ensuring students
have the global competencies they need in math .
9 . While national and international tests provide important global
indications of Ontario student achievement, EQAO’s provincial
assessments provide detailed information about students’
achievement of Ontario Curriculum expectations in order to
facilitate local accountability and improvement planning .
■ A random sample of 3208 students in 150 English-language
schools (approximately 2% of the total population of students
enrolled in Grade 8 in 2012–2013) and 2180 students in
125 French-language schools across Ontario (approximately
34% of the total population of students enrolled in Grade 8
in 2012–2013) participated in PCAP 2013 .
■ Random-sample national or international tests, which are
based on national or international standards and in which
a small percentage of students participate, cannot provide
detailed information for improvement planning at the
local level .
■ In order to evaluate student learning and inform decisions
about how best to support Ontario students, more specific
information about student achievement is needed .
■ Since all students participate in Ontario’s province-wide
tests, and the tests are based entirely on the learning
expectations in The Ontario Curriculum, they provide school
boards and schools with detailed information about their own
students’ achievement .
■ EQAO data are one important source of evidence that school
boards and schools use to inform their improvement planning .
Pan-Canadian Assessment Program (2013), Ontario Report 10 Education Quality and Accountability Office
Background
The Pan-Canadian Assessment Program (PCAP), an initiative of the Council of Ministers
of Education, Canada (CMEC), was designed to inform Canadians about how well their
education systems are meeting the needs of students and society . The information gained
through the program gives ministers of education a basis for examining the curriculum and
other aspects of their school systems . PCAP also complements existing assessments in
each province and territory .
School programs differ from one part of the country to another, making comparisons of results from this assessment program a complex task .
However, young Canadians in different provinces and territories learn many similar skills in reading, mathematics and science . PCAP provides
data on the achievement levels attained by Grade 8 students across the country and is designed to determine whether students across
Canada are reaching similar levels of performance .
PCAP is scheduled to be administered every three years and was first administered in 2007 . Reading, mathematics and science tests were
administered for the third time in the spring of 2013 in randomly selected Grade 8 classes in randomly selected schools . These sampling
procedures allow jurisdictions to interpret and attribute the performance data and the distribution of scores to their population as a whole
with confidence .
Approximately 32 000 students (24 000 English-language students and 8000 French-language students) across Canada wrote the tests in 2013 .
In Ontario, the tests were administered to 3208 students in 150 English-language schools and 2180 students in 125 French-language schools .

Education Quality and Accountability Office 11 Pan-Canadian Assessment Program (2013), Ontario Report
The Development Process
For each subject area, a thorough review of curricula, current assessment practices and
research literature was undertaken to identify the expectations common to all jurisdictions .
Frameworks were developed by representatives from English- and French-language education systems, and these were reviewed and
accepted by all participating jurisdictions as the basis for developing test items . Test items were developed by bilingual teams composed
of subject-area educators from all jurisdictions, with a subject assessment expert to supervise . Questions were developed in both official
languages and cross-translated to be equivalent in meaning and difficulty . The jurisdictions reviewed and confirmed the validity of the
French-English translations to ensure fair and equitable testing in both languages .
Items were field tested in both languages and the final test booklets were then reviewed and approved by all jurisdictions . Both multiple-choice
and open-response items for all three subject areas are included in the assessments .
The Reading Component
According to the curricula delivered in the provinces and territories,
reading is a dynamic, interactive process whereby the reader
constructs meaning from texts . The process of reading involves
the interaction of reader, text, purpose and context before, during
and after reading . In order to make meaning of a text, readers must
make a connection between what is in the text and what they know
or bring to it . Students’ knowledge and skills determine their degree
of access to particular types and forms of texts . Knowledge of
language, facility with language strategies and knowledge of the way
language works in print affect the student’s construction of meaning .
In light of the interactive process of reader, text, purpose and
context, the PCAP reading component considers the reader’s
engagement with text and response to it . The assessment included
a range and variety of text types and forms, of varying levels of
difficulty, to assess comprehension, interpretation and response
to text . The texts were broadly identified as fiction and non-fiction,
recognizing that texts frequently mix forms or types for a variety of
purposes . The texts selected for PCAP were consistent with a
broad range of student reading .
The Mathematics Component
The PCAP mathematics component is aligned with the curricula of
the participating jurisdictions as well as the standards of the National
Council of Teachers of Mathematics (NCTM) . For the purposes of
this assessment, mathematics was broadly defined as a
conceptual tool that students can use to increase their capability
to calculate, describe and solve problems . The subject area was
divided into four strands (Number and Operations; Geometry and
Measurement; Patterns and Relationships; and Data Management and
Probability) and five processes (Problem Solving; Communication;
Representations; Reasoning and Proof; and Connections) .
The Science Component
The concept of scientific literacy is generally accepted as the
overarching goal of science curricula across Canada . The PCAP
science component is founded on a definition of scientific literacy
that advocates the development of evolving competencies of
using science-related attitudes, skills and knowledge as well as
an understanding of the nature of science that enables students
to conduct inquiries, solve problems and make evidence-based
decisions about science-related issues . Embedded in this definition
of scientific literacy is the supposition that students have knowledge
of the life sciences, physical sciences (chemistry and physics) and
earth and space sciences, as well as an understanding of the nature
of science as a human endeavour . The science items cover four
subdomains (Nature of Science, Life Science, Physical Science,
Earth Science) and three competencies (Science Inquiry, Problem
Solving and Scientific Reasoning) .
Pan-Canadian Assessment Program (2013), Ontario Report 12 Education Quality and Accountability Office
Scoring the Student BookletsThe scoring was conducted concurrently in both languages in one location over three weeks . The scoring administration team, the table
leaders and the scorers themselves came from a range of jurisdictions . The process included
■ a team of scorer leaders for each subject area with
responsibility for reviewing all instruments and selecting
exemplar and training papers to ensure comparability at
every level;
■ parallel training of both table leaders and scorers in each
subject area;
■ twice-daily rater-reliability checks in which all scorers
marked the same student work in order to track the
consistency of scoring on an immediate basis;
■ double scoring in which approximately 300 of each of the
four booklets were re-scored, providing an overall inter-
rater reliability score; and
■ re-scoring of anchor items in which approximately 300 of
each item administered in a previous assessment were
re-scored in order to track the consistency of scoring
between test administrations .
Guidelines for Interpreting Results The results of student performance on the 2013 PCAP science component are presented in this report in two ways: as average overall scores
on a scale with a mean of 500 and a standard deviation of 100 and as the percentages of students achieving four performance levels . For the
reading and mathematics components, results are reported only as average scale scores . Performance levels were established only for the
science component, as it was the major domain for the 2013 PCAP assessment .
The four performance levels represent how performances measured up to the expected level of achievement according to two factors:
cognitive demand and degree of difficulty . The cognitive demands are defined by the level of reasoning required by the student to answer an
item correctly, from low demand to high demand, while the levels of difficulty are determined statistically based on the collective performance of
the students on the assessment . To accomplish this, a standard-setting exercise involving a group of selected educators from each jurisdiction
set the “cut scores” for each level using the “bookmark” method: that is, determining the relative difficulty of the full set of assessment
items and setting the point along a scale that defines the achievement at each level of success . Once suitable cut scores are set, student
performance within the range of cut scores can be described . These descriptors of achievement-level results indicate the degree to which
performance meets expectations of what students should know and be able to do at each level .
Education Quality and Accountability Office 13 Pan-Canadian Assessment Program (2013), Ontario Report
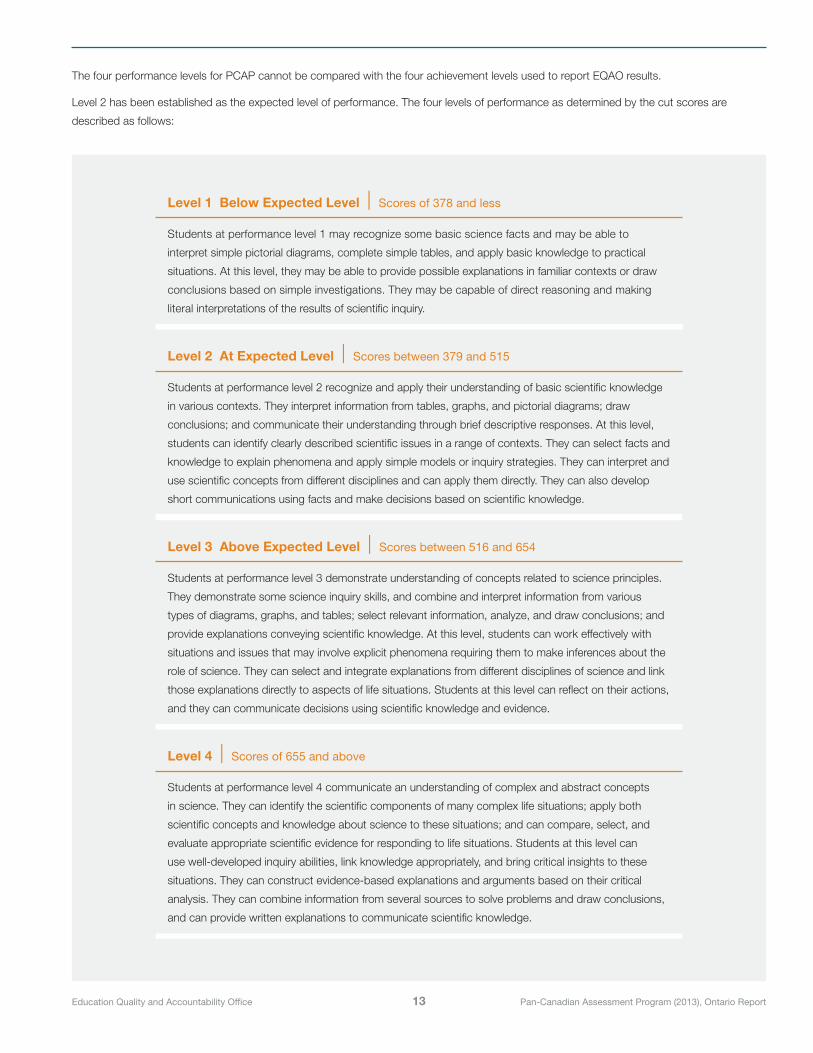
The four performance levels for PCAP cannot be compared with the four achievement levels used to report EQAO results .
Level 2 has been established as the expected level of performance . The four levels of performance as determined by the cut scores are
described as follows:
Level 1 Below Expected Level I Scores of 378 and less
Students at performance level 1 may recognize some basic science facts and may be able to
interpret simple pictorial diagrams, complete simple tables, and apply basic knowledge to practical
situations . At this level, they may be able to provide possible explanations in familiar contexts or draw
conclusions based on simple investigations . They may be capable of direct reasoning and making
literal interpretations of the results of scientific inquiry .
Level 2 At Expected Level I Scores between 379 and 515
Students at performance level 2 recognize and apply their understanding of basic scientific knowledge
in various contexts . They interpret information from tables, graphs, and pictorial diagrams; draw
conclusions; and communicate their understanding through brief descriptive responses . At this level,
students can identify clearly described scientific issues in a range of contexts . They can select facts and
knowledge to explain phenomena and apply simple models or inquiry strategies . They can interpret and
use scientific concepts from different disciplines and can apply them directly . They can also develop
short communications using facts and make decisions based on scientific knowledge .
Level 3 Above Expected Level I Scores between 516 and 654
Students at performance level 3 demonstrate understanding of concepts related to science principles .
They demonstrate some science inquiry skills, and combine and interpret information from various
types of diagrams, graphs, and tables; select relevant information, analyze, and draw conclusions; and
provide explanations conveying scientific knowledge . At this level, students can work effectively with
situations and issues that may involve explicit phenomena requiring them to make inferences about the
role of science . They can select and integrate explanations from different disciplines of science and link
those explanations directly to aspects of life situations . Students at this level can reflect on their actions,
and they can communicate decisions using scientific knowledge and evidence .
Level 4 I Scores of 655 and above
Students at performance level 4 communicate an understanding of complex and abstract concepts
in science . They can identify the scientific components of many complex life situations; apply both
scientific concepts and knowledge about science to these situations; and can compare, select, and
evaluate appropriate scientific evidence for responding to life situations . Students at this level can
use well-developed inquiry abilities, link knowledge appropriately, and bring critical insights to these
situations . They can construct evidence-based explanations and arguments based on their critical
analysis . They can combine information from several sources to solve problems and draw conclusions,
and can provide written explanations to communicate scientific knowledge .

Pan-Canadian Assessment Program (2013), Ontario Report 14 Education Quality and Accountability Office
In this assessment, the reported average scores are estimates of the achievement results students would have demonstrated had all students
in the population participated in the assessment . Because an estimate based on a sample is rarely exact, it is common practice to provide a
range of scores for each jurisdiction within which the actual achievement level might fall . The range of scores expressed for each average score
is called a confidence interval . It represents the high- and low-end points between which the actual average should fall 95% of the time . In
other words, one can be confident that the actual achievement level of all students would fall somewhere in the established range 19 times out
of 20 if the assessment were repeated with different samples from the same student population .
A difference between jurisdiction or group means is statistically different when there is no overlap of confidence intervals from the two
jurisdictions or groups being compared .
Caution is advised when comparing achievement results based on assessment instruments prepared collaboratively in both languages, despite
the extensive efforts to ensure equivalence for the sake of equity and fairness for all students . Every language has unique features that are not
readily equivalent . While the reading items, performance descriptors, scoring scripts and processes in English and French were equivalent,
pedagogical and cultural differences related to differences in language structure and use render comparisons between languages inherently
difficult . Comparisons should therefore be made with extreme caution .
National Assessments in Previous Years
Prior to PCAP, the last national assessment administered in Canada was a science
assessment administered in 2004 as part of the School Achievement Indicators Program
(SAIP), which has now been replaced by PCAP .
SAIP was initiated in 1993 by CMEC and assessed 13-year-old and 15-year-old students in reading, writing, mathematics and science .
Mathematics was last assessed in 2001 and reading was last assessed in 1998 . Since the SAIP assessment results were reported at five
performance levels, it is not possible to draw comparisons between achievement levels on PCAP and SAIP . PCAP sets a new benchmark for
comparisons in future years .

2 Carlton Street, Suite 1200, Toronto ON M5B 2M9 Telephone: 1-888-327-7377 Web site: www.eqao.com
Ipcap_8e_1014
© 2014 Queen’s Printer for Ontario