pallot, marc a. (2011) collaborative distance...
TRANSCRIPT

Pallot, Marc A. (2011) Collaborative distance: investigating issues related to distance factors affecting collaboration performance. PhD thesis, University of Nottingham.
Access from the University of Nottingham repository: http://eprints.nottingham.ac.uk/11951/1/Marc_Pallot_PhD_July_2011_University_of_Nottingham_PhD_Thesis.pdf
Copyright and reuse:
The Nottingham ePrints service makes this work by researchers of the University of Nottingham available open access under the following conditions.
This article is made available under the University of Nottingham End User licence and may be reused according to the conditions of the licence. For more details see: http://eprints.nottingham.ac.uk/end_user_agreement.pdf
For more information, please contact [email protected]

COLLABORATIVE DISTANCE Investigating Issues Related to Distance Factors Affecting
Collaboration Performance.
MARC A. PALLOT
Nottingham University Business School
July 2011
Thesis submitted to the University of Nottingham for the degree of Doctor of Philosophy.

2
3
ABSTRACT
Both organisations and individuals are using more collaborative work, across geographic,
disciplinary and organisational boundaries, leading to increased demand for Information and
Communication Technologies (ICT) to support a more effective and efficient distributed
collaboration. This thesis presents an empirical study exploring various aspects related to
collaborative distance in the context of innovation projects. It focuses on the investigation of
issues related to distance factors that affect collaboration effectiveness and efficiency.
A total of 14 focus group interviews, undertaken with 75 participants in a comparative
study of 14 project cases, revealed sufficient evidence on distance factors in the context of mixed
(face-to-face and online or virtual) collocation modes. The results confirmed the positive role of
collaboration technology for compressing geographical and temporal types of distance; other
distance types were also bridged, however, other distance types were created.
This empirical study aims to enlarge the academic understanding of distance factors by
disambiguating their description and deciphering their role in the collaboration process, and
clarifying the reasons for the use and improvement of collaboration technology for overcoming
collaborative distances. It also confirms that distance factors raise collaboration barriers, and
reveals that they disturb the collaboration mechanics by hindering knowledge workers’ capacity
to reach a mutual understanding. Such findings have deep implications for the future
enhancement of collaboration technology to fill the current gaps in distributed collaboration, also
called e-Collaboration.
4
AKNOWLEDGEMENTS
First of all, I would like to thank Sir Timothy John Berners-Lee for the invention of the
Web, which was by far my most valuable support throughout the many years of my part-time
PhD. Without the Internet and Web, this thesis would not have been possible. I need to thank
colleagues from ISTIA Innovation, especially Dr. Henri Samier, who made possible the
experimentation with Innovation MSc students and all the participants of the project cases and
focus group interviews.
A dedicated thank you to Professor Wolfgang Prinz for the fascinating discussions we
had on Social Computing and Computer Support for Cooperative Work, as well as Shared
Workspaces (BSCW) and on the shared greens. Many thanks also to Rudolf Ruland, who kindly
and patiently supported me in the technical aspects of BSCW, especially the extraction of log
data on the shared workspace platform used for conducting the project cases. Thanks also to all
the colleagues of the Ecospace EU research project who contributed to the discussion on
collaborative distance. I also address special thanks to Dr. Peter Antoniac for the exchange of
views about the writing of a PhD thesis and Jeffrey Bracco for the proof reading, valuable
recommendations and encouragement in completing the thesis.
Last, but not least, I would like to thank my Supervisor, Professor Kulwant Pawar, who
coached me at the start of the process and has patiently guided me throughout. Thanks also to Dr.
Johann Riedel for taking care of me when I was in Nottingham and for his valuable
recommendations on the writing of a PhD thesis.
Finally, I would like to express my sincere gratitude to all my family members for their
unfailing love, continuous encouragement and constant support throughout this long and often
overloaded period of time.
5
GLOSSARY
Abbreviations Descriptions
AR Augmented Reality
BSCW Basic Support for Collaborative Work
CD Collaborative Distance
CDF Collaborative Distance Framework
CE Concurrent Engineering
CMC Computer Mediated Communication
CoI Community of Interest
CoP Community of Practice
CSCW Computer Support for Cooperative Work
CWE Collaborative Working Environment or Web Environment
DKM Distributed Knowledge Management
EA Expectation Awareness
EN Events Notification
FEI Front-End Innovation (also called Fuzzy Front End)
FFE Fuzzy Front End (also called Front-End Innovation)
FGI Focus Group Interview
GDSS Group Decision Support Systems
GDT Geographic Dispersion in Teams
HCI Human-Computer Interaction
ICT Information and Communication Technology
IDEF0 Integrated Definition for Functional Modelling, version 0
IEC Inter-Enterprise Collaboration
IM Instant Messaging
IOC Inter-Organisational Collaboration
IP Intellectual Property
IPO Input-Process-Output
IPR Intellectual Property Rights
IST Information Society Technology
ISTAG IST (Information Society Technology) Advisory Group
KM Knowledge Management
6
Abbreviations Descriptions
MR Mixed Reality
MWC Mobile Wearable Computing
NPD New Product Development
OBS Organisational Breakdown Structure
PBS Product Breakdown Structure
SADT Structured Analysis and Design Technique for system description
SG Serious Gaming
SN Social Networking
SNA Social Network Analysis
SW Shared Workspace (also called Collaborative Web Environment)
VR Virtual Reality
VT Virtual Team
WBS Work Breakdown Structure
7
PUBLICATIONS
Conference Papers
Main author
• Pallot, M., Bergmann, U., Kühnle, H., Pawar, K. S., Riedel, J. CKH (2010), Collaborative Working Environments: Distance Factors Affecting Collaboration. In: Proceedings of the 16th International Conference on Concurrent Enterprising, ICE'2010 "Collaborative Environments for Sustainable Innovation", Lugano, Switzerland, 21-23 June 2010, Centre for Concurrent Enterprise, University of Nottingham, Nottingham. ISBN 9780853582 700. www.ice-proceedings.org.
• Pallot, M., Richir, S., Samier H. (2008), Shared Workspace and Group Blogging Experimentation through a Living Lab approach. In: Thoben, K-D; Pawar, KS & Goncalves, R. (2008) Proceedings of the 14th International Conference on Concurrent Enterprising, ICE'2008 "A new wave of innovation in Collaborative Networks", Lisbon, Portugal, 23-25 June 2008, Centre for Concurrent Enterprise, University of Nottingham, ISBN 978 0 85358 244 1.
• Pallot, M., Ruland, R., Traykov, S., Kristensen, K. (2006), Integrating Shared Workspace, Wiki and Blog Technologies to Support Interpersonal Knowledge Connection. In: Thoben, K-D; Pawar, KS; Taisch, M; & Terzi, S. (2006) Proceedings of the 12th International Conference on Concurrent Enterprising, ICE'2006 Innovative Products and Services through Collaborative Networks – 26-28 June 2006, Milan, Italy, University of Nottingham, Nottingham. (ISBN 0 85358 228 9).
• Pallot, M., Prinz, W., Pawar K. (2006), Stimulating Creativity and Innovation through People-Concepts Connectivity within on-line Collaborative Workplaces. Proceedings of the IRMA 2006 conference, Washington, USA.
• Pallot, M., Prinz, W., Schaffers, H. (2005), Future Workplaces, towards the Collaborative Web. Proceedings of the AMI@Work Forum 2005 – Munich, June 2005.
• Pallot, M., Pawar, K., Salminen, V., Pillai, B. (2004), Business Semantics: The Magic Instrument Enabling Plug & Play Collaboration? In: Thoben, K-D; Pawar, K.S. & Weber, F. (Eds) (2004) Proceedings of the 10th International Conference on Concurrent Enterprising, ICE'2004 Adaptive Engineering for Sustainable Value Creation, 16-18 June 2003, Seville, Spain, University of Nottingham, Nottingham. (ISBN: 0 85358 128 2).
Co-author
• Prinz, W., Ruland, R., Peristeras, V., Pallot, M. (2008), Towards Shared Workspace Interoperability, ECOSPACE Newsletter Special Issue on Interoperability within Collaborative Environments, Published by the ECOSPACE Consortium.
• Martikainen, O., Pallot, M., Alasalmi, A. (2007), Collaboration Model based on Entity-Concepts Connectivity. In: Pawar, KS; Thoben, K-D & Pallot, M. (Eds) (2007) Proceedings of the 13th International Conference on Concurrent Enterprising, ICE'2007 Concurrent Innovation: an emerging paradigm for Collaboration & Competitiveness in the extended enterprise, 4-6 June 2007, Sophia-Antipolis, France, Centre for Concurrent Enterprise, University of Nottingham, ISBN 978 0 85358 2335.

8
• Antoniac, P., Pallot, M., Pulli P. (2006), Virtual and Augmented Reality Supporting Group Consciousness within Collaborative Working Environments. In: Thoben, K-D; Pawar, KS; Taisch, M; & Terzi, S. (2006) Proceedings of the 12th International Conference on Concurrent Enterprising, ICE'2006 Innovative Products and Services through Collaborative Networks – 26-28 June 2006, Milan, Italy, University of Nottingham, Nottingham. (ISBN 0 85358 228 9).
• Schaffers, H., Prinz, W., Pallot, M., Fernando, T. (2005) Mobile and collaborative workplaces: An agenda for innovation. Proceedings of the eChallenges conference e'2005 Innovation and the Knowledge Economy: issues, Applications, Case Studies - Ljubjana, Slovenia.
Newsletter Articles
• Pallot, M., Trousse, B., Senach, B., Richir, S., de Ruyter, B. Prinz, W. Rerolle, O., Katzy, B. (2008), Living Lab Research, ECOSPACE Newsletter Special Issue on Living Labs, Published by the ECOSPACE Consortium.
• Pallot, M. (2004), Towards Community based Collaborative Workplaces, article published in the MOSAIC Newsletter, July 2004.
Journal Articles
Main author
• Pallot, M. Martinez-Carerras, A., Prinz, W. (2010), Collaborative Distance: A Framework For Distance Factors Affecting The Performance Of Distributed Collaboration. The International Journal of eCollaboration, Special Issue on Collaborative Working Environments (CWE), 6(2), 1-32, April-June 2010.
Co-author
• Prinz, W., Martinez-Carerras, A., Pallot M. (2010), From Collaborative Tools To Collaborative Working Environments. The International Journal of eCollaboration, Special Issue on Collaborative Working Environments (CWE), 6(1), 1-13, January-March 2010.
Books & Chapters
Main author
• Pallot, M., Bergmann U. (2010), Collaborative Virtual Environments and Immersion in Distributed Engineering Contexts, Book Title: Distributed Manufacturing: Paradigm, Concepts, Solutions and Examples. Edited by H. Kühnle, Published by Springer-Verlag.
Co-author
• Schaffers, H., Brodt, T., Pallot, M., Prinz, W. (2006) The Future workspaces: perspectives on Mobile and Collaborative Working. The MOSAIC Consortium. Published by Telematica Instituut - The Netherlands - ISBN 90-75176-00-7.
9
TABLE OF CONTENTS
Chapter 1. Introduction ............................................................................................................. 15
1.1 Motivation, Research Scope and Objectives.................................................................. 16 1.2 Research Questions.......................................................................................................... 19 1.3 Research Goal, Significance and Strategy...................................................................... 21 1.4 Thesis Structure ............................................................................................................... 24 1.5 Summary .......................................................................................................................... 27
Chapter 2. Literature Review.................................................................................................... 31
2.1 Introduction...................................................................................................................... 32 2.2 Context ............................................................................................................................. 34 2.3 Discussion of Concepts ................................................................................................... 36 2.4 Factors affecting Collaboration....................................................................................... 42 2.5 Collaborative Distance .................................................................................................... 45 2.6 Structural Dimension....................................................................................................... 51 2.7 Social Dimension............................................................................................................. 54 2.8 Technical Dimension....................................................................................................... 58 2.9 Legal Dimension.............................................................................................................. 61 2.10 Mutual Understanding..................................................................................................... 63 2.11 Virtual Collocation with Collaboration Technology ..................................................... 68 2.12 Gaps in Existing Literature.............................................................................................. 78 2.13 A Holistic View and Model on Collaborative Distance ................................................ 79 2.14 A Social Interaction Model ............................................................................................. 83 2.15 Towards A Generic Collaboration Process .................................................................... 87 2.16 Propositions...................................................................................................................... 93 2.17 Summary .......................................................................................................................... 95
Chapter 3. Methodology ........................................................................................................... 97
3.1 Introduction...................................................................................................................... 98 3.2 Methodology Review .................................................................................................... 101 3.3 The Observation Model................................................................................................. 118 3.4 Comparative Cases ........................................................................................................ 119 3.5 Summary ........................................................................................................................ 124
Chapter 4. Research Findings ................................................................................................. 127
4.1 Survey Data.................................................................................................................... 128 4.2 Focus Group Data .......................................................................................................... 138 4.3 Log Data and Cases Overview...................................................................................... 153 4.4 Summary ........................................................................................................................ 168
Chapter 5. Data Analysis and Discussion .............................................................................. 169
5.1 Survey Analysis ............................................................................................................. 170 5.2 Concluding Remarks on the Survey ............................................................................. 181 5.3 Focus Group Analysis ................................................................................................... 182 5.4 Cases Comparison ......................................................................................................... 185 5.5 Introducing the Evaluation of Collaborative Distance................................................. 202
10
5.6 Structural Dimension..................................................................................................... 203 5.7 Social Dimension........................................................................................................... 209 5.8 Technical Dimension..................................................................................................... 214 5.9 Legal Dimension............................................................................................................ 218 5.10 Summary of Discussion on Distances .......................................................................... 219 5.11 Discussion on Project Teams’ Collaboration Performance ......................................... 224 5.12 Confronting Distance Factors with CWE..................................................................... 228 5.13 Comparison with other Surveys and Studies................................................................ 232 5.14 Summary ........................................................................................................................ 240
Chapter 6. Conclusion............................................................................................................. 243
6.1 Introduction.................................................................................................................... 244 6.2 Responding to the Research Questions......................................................................... 245 6.3 Propositions Revisited ................................................................................................... 247 6.4 Contribution to Knowledge........................................................................................... 252 6.5 Lessons Learned and Recommendations...................................................................... 256 6.6 Limitations and Future Research .................................................................................. 257
References…………………………………………………………………………………….263
Appendix A: Collaborative Distance: Detailed Table…………………………………………282
Appendix B: Focus Group Interviews: Synthesis Table………………………………………290

11
LIST OF FIGURES
Figure 1.1: Thesis Structure ............................................................................................................................ 26
Figure 1.2: Overall View of the Empirical Study on Collaborative Distance .............................................. 29
Figure 2.1: Scientific streams composing the e-Collaboration domain....................................................... 32
Figure 2.2: Cluster view of selected papers and related tagged distance types or factors ........................... 33
Figure 2.3: Design Performance E2 model..................................................................................................... 39
Figure 2.4: Tree Structure of Collaborative Distance.................................................................................... 49
Figure 2.5: Key functions of collaboration and communication infrastructure............................................ 75
Figure 2.6: The Holistic Model of Collaborative Distance ........................................................................... 80
Figure 2.7: Holistic View of Collaborative Distance and Factors ................................................................ 82
Figure 2.8: JOHARI Window Model............................................................................................................. 83
Figure 2.9: Extended JOHARI Window model............................................................................................. 84
Figure 2.10: Emerging concepts at the frontier of the unknown world ........................................................ 86
Figure 2.11: Layers of a generic collaboration process ................................................................................. 87
Figure 2.12: Logical view of the collaboration mechanics ........................................................................... 91
Figure 2.13: Integrating collaboration process and mechanics ..................................................................... 93
Figure 3.1: Triangulated Research Approach ................................................................................................ 99
Figure 3.2: Data Collection........................................................................................................................... 105
Figure 3.3: IPO Model .................................................................................................................................. 109
Figure 3.4: IPO Framework .......................................................................................................................... 110
Figure 3.5: Re-visited IPO Model as Virtual Team Life-cycle................................................................... 111
Figure 3.6: Re-visited IPO Model as ‘Focus of Early Virtual Team Research’......................................... 112
Figure 3.7: The Emotional Intelligence and Emotional Process................................................................. 114
Figure 3.8: The IPO Model for the Collaborative Distance Experiment.................................................... 116
Figure 3.9: A generic model of a Group Interaction Process based on the collaboration mechanics ....... 117
Figure 3.10: The Observation Model ........................................................................................................... 118
Figure 3.11: Cooperation activity-related data and relationships................................................................ 124

12
Figure 4.1: Level of Survey Respondents .................................................................................................... 129
Figure 4.2: Ratings for the Barriers belonging to the Structural Dimension.............................................. 133
Figure 4.3: Ratings for the Barriers belonging to the Social Dimension.................................................... 134
Figure 4.4: Ratings for the Barriers belonging to the Technical Dimension.............................................. 136
Figure 4.5: Ratings for the Barriers belonging to the Legal Dimension..................................................... 137
Figure 4.6: Previous Experiences ................................................................................................................. 140
Figure 4.7: Project Structuration Model with OBS and WBS .................................................................... 141
Figure 4.8: Project Case P01 Events per Type and per User....................................................................... 155
Figure 4.9: Project Case P02 Events per Type and per User....................................................................... 156
Figure 4.10: Project Case P03 Events per Type and per User..................................................................... 157
Figure 4.11: Project Case P04 Events per Type and per User..................................................................... 158
Figure 4.12: Project Case P05 Events per Type and per User..................................................................... 159
Figure 4.13: Project Case P06 Events per Type and per User..................................................................... 160
Figure 4.14: Project Case P07 Events per Type and per User..................................................................... 161
Figure 4.15: Project Case P08 Events per Type and per User..................................................................... 162
Figure 4.16: Project Case P09 Events per Type and per User..................................................................... 163
Figure 4.17: Project Case P10 Events per Type and per User..................................................................... 164
Figure 4.18: Project Case P11 Events per Type and per User..................................................................... 165
Figure 4.19: Project Case P12 Events per Type and per User..................................................................... 166
Figure 4.20: Project Case P13 Events per Type and per User..................................................................... 167
Figure 4.21: Project Case P14 Events per Type and per User..................................................................... 168
Figure 5.1: Major Impact Barriers ................................................................................................................ 170
Figure 5.2: Average Impact Barriers ............................................................................................................ 172
Figure 5.3: Minor Impact Barriers................................................................................................................ 173
Figure 5.4: Rating of Collaboration Barriers of the Structural Dimension................................................. 178
Figure 5.5: Rating of Collaboration Barriers of the Social Dimension....................................................... 179
Figure 5.6: Rating of Collaboration Barriers of the Technical Dimension................................................. 180
Figure 5.7: Rating of Collaboration Barriers of the Legal Dimension ....................................................... 181

13
Figure 5.8: Bar Graph of All Project Cases Production .............................................................................. 188
Figure 5.9: Bar Graph of All Project Cases Events ..................................................................................... 190
Figure 5.10: Bar Graph of All Project Cases Create, Update and Read Events......................................... 191
Figure 5.11: Comparison of Collaboration Barriers and Technologies...................................................... 221
Figure 5.12: Collaboration Effectiveness and Efficiency of Project Teams............................................... 226
Figure 5.13: Elements Contributing to Collaboration Success or Failure .................................................. 233
Figure 5.14– Most Important Advice for Effective Collaboration.............................................................. 235
Figure 5.15: Team Performance Depends on the Degree of Dispersion .................................................... 236
Figure 5.16: - Team Performance Depends on the Degree of Task-related Processes .............................. 237
Figure 5.17: – Collaboration Tools used for Productivity rather than Innovation ..................................... 239

14
LIST OF TABLES
Table 2.1: List of distance factors grouped by collaborative distance types and dimensions ..................... 50
Table 2.2: A comparison of the typical characteristics of physically or virtually collocated teams ........... 68
Table 2.3: Virtual Team System of Principles ............................................................................................... 70
Table 2.4: Collaboration Tools for Sharing Information across Distance and Time Boundaries ............... 76
Table 2.5: A proposed classification of collaboration tools .......................................................................... 77
Table 3.1: Distinctions between quantitative and qualitative research methods........................................ 100
Table 3.2: Different types of case studies..................................................................................................... 103
Table 4.1: Rating of Collaboration Barriers by the Survey Respondents................................................... 130
Table 4.2: List of Questions for the Focus Group Interviews ..................................................................... 142
Table 4.3: Collected Data for All Project Cases .......................................................................................... 154
Table 5.1: Collaboration Barriers and Corresponding Distance Types ...................................................... 175
Table 5.2: Rating of Collaboration Barriers by the Survey Respondents................................................... 177
Table 5.3: FGI ratings for the Use of Technology for Compressing Distances ......................................... 183
Table 5.4: Resulting Log Data for the 14 Project Cases.............................................................................. 187
Table 5.5: Level of Project Team Activity for Each Category.................................................................... 192
Table 5.6: Correlation of Distance Types with Activity Types .................................................................. 193
Table 5.7 : Estimated Values of Project Activity Level Corresponding to Each Distance Type .............. 201
Table 5.8: Collaboration Tools Mitigating the Impact of Distance Factors ............................................... 231
15
Chapter 1. Introduction
S o m e w h e r e , s o m e t h i n g i n c r e d i b l e i s w a i t i n g t o b e
k n o w n . - C a r l S a g a n
This chapter describes the background and distinctive features of distributed
collaboration. It also outlines the research scope and background, including motivation, research
goal, significance, strategy, objectives and questions. The chapter concludes with a description of
the thesis structure and an overall map of this empirical study on collaborative distance.
16
1.1 Motivation, Research Scope and Objectives
Increasing globalisation implies that more and more companies are outsourcing design
and production activities around the world. This in turn means that there is a high level of inter-
firm interaction within a multidisciplinary, multicultural, multilingual and multi-site context,
often involving different continents and time zones. Within this kind of networked environment,
a more effective collaboration amongst various stakeholders becomes essential, especially when
innovative capability is at the heart of a firm’s competitiveness. In parallel with this
development, there is a trend within society for employers and employees to adopt more flexible
working arrangements (Puybaraud, 2004, 2005).
The Internet is the prime driver for this ‘new’ way of working, alongside pressure from
the wider society (Schaffers et al., 2006). This flexible and mobile way of working is gaining
increased acceptability due to potential benefits for both parties (Vendramin & Valenduc, 1998).
The workers involved, often labelled knowledge-workers (Tapscott & Anthony, 2006) or
eProfessionals (Prinz et al., 2006), make extensive use of ICT and remain remotely in constant
touch with other people through Internet technologies. Increasingly they require and rely on
collaboration facilities or services such as on-line or virtual collaborative space. Arguably this
space is the ‘workplace’ of many such knowledge workers or eProfessionals, and the relevant
technology is currently undergoing considerable evolution and development (Schaffers et al.,
2006).
Open Innovation (Chesbrough, 2003), another current trend, attempts to gather
knowledge workers or eProfessionals within a ‘community of practice’ or ‘knowledge
community’. Organisations’ boundaries become more permeable as they need to collaborate in
17
adopting a widely distributed knowledge approach. Several organisations, such as InnoCentive1
and NineSigma2, already operate as open innovation intermediaries. Hence, New Product
Development (NPD) and Front End Innovation (FEI) (Poskela et al., 2005) practices have slowly
evolved from face-to-face collaboration towards online or distributed collaboration (also named
eCollaboration).
Sharifi and Pawar (2001), in a paper exploring physically and virtually collocated teams
in NPD, find that aspects such as trust, working relationship, integrity and common purpose are
pivotal to team effectiveness. They note that this point is supported by Coutu’s (1998) study of
29 virtual teams operating globally, which found that trust can and does exist in virtual teams but
that it develops in a very different way than in physically collocated teams. Coutu found that the
formation of trust in teams is similar to that in other social systems; the beginning is filled with
uncertainty, unfamiliarity and fear of the unknown. As shown in one of Sharifi & Pawar’s case
studies, the initial face-to-face meeting thus becomes crucial to the gelling of the team. In their
survey, respondents perceived physical collocation as a more appropriate context for building
relationships.
Sharifi and Pawar (2001) also note that collocation of teams is often adopted as an ad hoc
solution or means. This has implications for the performance of the team, and subsequently for
the ways experiences can be shared and disseminated across the enterprise. The authors observe
that a team matures and develops the coherence that is needed to fulfil its mission. They also find
that collaboration is vital to the success of concurrent engineering (CE).
Prasad (1998) argues that ‘traditional’ organisational forms can inhibit teamwork, and
suggests that integrative means such as technological and virtual concurrent teams can enhance
interactions. Similarly, Pawar et al. (1999) present the importance of establishing ‘concordance’
1 http://www.innocentive.com/ 2 http://www.ninesigma.com/
18
within teams during the design and development of new products. Pawar and Sharifi (1997)
argue that, in view of the existing diversity among team members in their understanding and
interpretations of the ‘design language’, both intra- and inter-team communication become even
more vital to the team performance. In their study, advanced telecommunication systems such as
electronic mail and engineering databases were considered to facilitate a kind of virtual team
collocation and to simulate face-to-face communication (Pawar & Sharifi, 1997).
However, Pawar and Sharifi (1997) also observed that distributed design teams (virtually
collocated) encountered problems related to language barriers, technology incompatibility,
different company practices, constraints in accessing information quickly, and geographical
distribution and different time zones. The lack of informal exchanges and proximity were
identified as leading to problems of motivation among team members, such as feelings of
isolation and frustration. Sharifi and Pawar’s study revealed that ‘out of sight out of mind’
syndrome may develop in the distributed design team context, which may cause low morale and
consequently lead to decreased cohesiveness. Sharifi and Pawar (2002) conclude that:
the advent of telecommunication innovations has shortened distances and time to
such an extent that geographic limits cease to exist and is truly seen as one of the
major forces enabling economic globalisation. The Internet, E-mail, video
conferencing, etc have changed the way business was done a decade earlier.
However, it should be noted that having the advanced technology alone would
not provide for an effective and efficient virtual co-location of design teams. On
the contrary, selection of the appropriate technology and defining its use with
relevance to the design needs to be seriously taken into consideration.
The above issues highlight the motivation of this empirical study, in which the main
objective is to provide a holistic model and increased understanding on the various distance
factors that impede a necessary level of proximity among distributed group members, as stated
19
by Sharifi and Pawar (2002). This empirical study further investigates the mechanics of
collaboration and explores issues surrounding the role of mutual understanding in distributed
collaboration through the use of online Shared Workspace technology. Hence, this is not another
comparative study between collocated and distributed team models, but rather a holistic
observation and exploration of distance factors affecting the collaboration mechanics and
performance, whatever the working mode (e.g. collocated, distributed, mixed) in which a group
uses collaboration technology.
In this context, project stakeholders, whatever their respective geographic location, need
a Collaborative Working Environment (CWE) for sharing knowledge and reaching a mutual
understanding that enables the creation of new knowledge (Pallot et al., 2005; Prinz et al., 2006).
The CWE promotes the use of specific collaboration tools such as online Shared Workspace for
sharing knowledge among project stakeholders. While there have been many studies related to
proximity and distance factors, as stated by Boschma and Knoben and Oerlemans (Boschma,
2005; Knoben & Oerlemans, 2006), there is little understanding about distance factors and the
role of mutual understanding within the collaboration mechanics. Unfortunately, the current
research body lacks a holistic view and framework that captures all the dimensions of distributed
collaboration and its related distance factors.
1.2 Research Questions
Main question: How do eProfessionals collaborate within an appropriate level of
performance regardless of their location (mixed mode of physical and virtual collocation)?
E-professionals are people who do not necessarily work from a single location or for one
single organisation, but rather as experts offering their experience to several organisations
according to project demand in terms of requested competences and experience. They are
members of at least one, but often several, communities of practice where they share and develop

20
visions, roadmaps, ideas and practices. E-professionals have the capacity to collaborate from
anywhere and at any time through the use of new Information and Communication Technologies
(e.g. laptop, wireless broadband connection, mobile terminal, and Web applications such as
Shared Workspace, wiki, and blogging).
Sub-questions:
1. What are the distance factors that affect collaboration performance?
(Identify within the literature and business cases a list of distance factors affecting
collaboration performance. Collaboration performance is composed of collaboration
effectiveness3, efficiency4 and efficacy5.)
a) Are there different dimensions holding distance factors?
b) Are there different types of distance factors?
c) In which (positive or negative) ways do distance factors affect collaboration
performance?
d) Are distance factors related to one another?
2. What is the role of the Shared Workspace technology within a collaborative
context?
a) Does ICT contribute to overcome collaboration barriers raised by distance
factors?
b) Does ICT create even more distance factors?
3 Effectiveness: ability to bring about the result intended (everything necessary is in place for a high quality output). 4 Efficiency: ability to perform duties well with a minimum resource level for a maximum output (high productivity level). 5 Efficacy: ability to get things done (fulfil a request in due time).
21
3. What are the issues surrounding mutual understanding and collaborative
performance?
a) Is a generic collaboration process an appropriate model for situating the role of
mutual understanding?
b) Do distance factors affect the reaching of a mutual understanding?
c) Is the extended Johari Window an appropriate model of social interaction for
explaining the important role of mutual understanding?
4. What are the elements comprising the mechanics of collaboration?
a) What are the generic activities comprising the mechanics of collaboration?
b) Do distance factors affect the mechanics of collaboration?
1.3 Research Goal, Significance and Strategy
Although the immense and diverse body of literature on collaboration and distance (or
proximity) factors continues to uncover an increasingly complex phenomenon of social
interaction, there is still little understanding of the generic process and mechanics of
collaboration, especially the role of mutual understanding. Despite its continuing growth,
research on distributed team performance is still in its infancy and there have been few attempts
to undertake robust academic research on the performance effectiveness of virtual teams
(Saunders, 2000; Powel et al., 2004; Egea, 2006; Gaudes et al., 2007). However, it should be
noted that group effectiveness performance has been investigated by prominent authors such as
Hackman and Morris (1975), who adapted the work of McGrath (1964) to develop the famous
‘Input-Process-Output’ model for evaluating the performance effectiveness of a group. This
model probably inspired Lipnack & Stamps’ (1997) description of ‘A System of Virtual Team
Principles’, illustrated by a matrix composed of ‘Inputs-Processes-Outputs’ on one side and
22
‘People-Purpose-Links’ on the other. According to Lipnack & Stamps (1997), ‘The principles of
people, purpose and links forms a simple systems model of inputs, processes and outputs.’
In addition to the investigation of various distance types and related issues, the main goal
of this empirical study is to develop a holistic model of collaborative distance that can be used to
categorise, disambiguate and disentangle distance factors. The categorisation scheme is later
used to classify, compare and make sense of recorded data from activities in comparative cases,
the findings of the focus group interviews, and the survey results.
The formulated research questions and propositions led to the design of a triangulated
research approach comprising both qualitative and quantitative methods as the best means to
investigate distance factors that raise barriers in complex tasks of project teams. These methods
comprise a survey on collaboration barriers, 14 comparative cases of corresponding collaboration
projects with their related log data, and 14 focus group interviews (FGI). The implemented
Shared Workspace platform (BSCW) acts as a Collaborative Working Environment (CWE)
supporting the 14 collaboration project teams. This ICT platform is also used as a log platform
for extracting data generated by the 14 project cases.
The major advantage of this approach is that it allows the researcher to study the
development of mutual understanding and exchange of knowledge during real tasks by
combining the advantages of all three methods outlined in the research method chapter. The
combination of the three methods provides insights, information and data contributing to a broad
understanding of the ‘sharedness’ of a CWE. Nevertheless, the main focus is on the analysis and
correlation of the observational data, as this shows how real contributions are made by project
team members, giving hints to the corresponding collaborative activities conducted. The
qualitative part is also intended to support the observation of distance factors affecting
collaboration performance with 14 comparative cases and the corresponding focus group
23
interviews. The quantitative part is intended to provide indications as to survey respondents’
perceptions of distance factors.
The 14 comparative cases implemented the SADT (Structured Analysis and Design
Technique) (Ross & Schoman, 1976) structured analysis approach and the IDEF0 (Integrated
Definition for Function Modelling) (Ross, 1985; 1989) functional activity modelling instrument,
used by project participants to define and agree to their respective project processes. This part of
the research included a team building (purpose, people, process and place), relationship and
leadership experiment throughout the project life-cycle of five consecutive months. In terms of
shared techniques and methods enforcing a shared understanding of their projects, in addition to
the already mentioned use of SADT and IDEF0, all project teams used WBS (Work Breakdown
Structure) and OBS (Organisation Breakdown Structure) techniques for the structuration of their
respective projects. The BSCW platform log data, together with the level of interaction and
usage, is also intended to provide insights on the various collaborative activities conducted by
each team, such as shared models, common classification, shared structuration, team
communication and shared spaces. In terms of team performance, log data is also intended to
provide figures on the level of team productivity compared to the level of interaction and number
of project stakeholders.
One of the main objectives of the research is to explore interrelated collaboration models.
First, a holistic model of collaborative distance (CD) illustrates and explains the relationships
between distance factors, collaboration barriers, distance types, collaboration tools and
distributed teams. This holistic model of CD is complemented by a holistic view of all CD types
and related factors within four dimensions, namely ‘Structural’, ‘Social’, ‘Technical’ and ‘Legal
& Ethical’. Second, a social interaction model, based on an extension of the Johari Window
Model (Luft & Ingham, 1955), explains how to enlarge the area of mutual understanding that
determines the level of interpersonal productivity, creativity and innovativeness. Third, a generic
24
collaboration process model is used to describe the interrelated layers of activities. Fourth, a
logical model of the collaboration mechanics is used to articulate the role of awareness,
responsiveness, sense-making and understanding. Fifth, there is a model integrating the generic
collaboration process activities with the mechanics of collaboration. Finally, a model introducing
distance factors into the knowledge creation process is used to decipher the role of mutual
understanding in collaboration performance, and the way this is impacted by distance factors.
1.4 Thesis Structure
This empirical study aims to improve understanding of factors related to collaborative
distance and the role of shared or mutual understanding in the collaboration performance among
knowledge workers or eProfessionals, especially during innovation and creativity activities (see
Figure 1.1 for an overall view of the thesis structure). To this end, a holistic literature review
surveys published papers that discuss either proximity or distance factors, in order to gather all
the factors identified so far. The literature review also surveys published papers discussing
shared, common or mutual understanding. Then, there is an analysis of gaps in the existing
literature, followed by a discussion and presentation of the selected research methodology. Next,
findings of the survey, comparative cases and focus group interviews are presented, followed by
three separate analyses and subsequent discussion using a triangulated interpretation of the
comparative cases, focus groups and survey. Finally, a conclusion is drawn and future research
plans are introduced.
Chapter 1 introduces the current trends in the domain of collaboration amongst
knowledge workers or eProfessionals and explores previously encountered problems within
distributed groups or virtual teams. It presents the main research question and related sub-
questions and objectives, gives a summary of the chapters and then addresses conclusions.
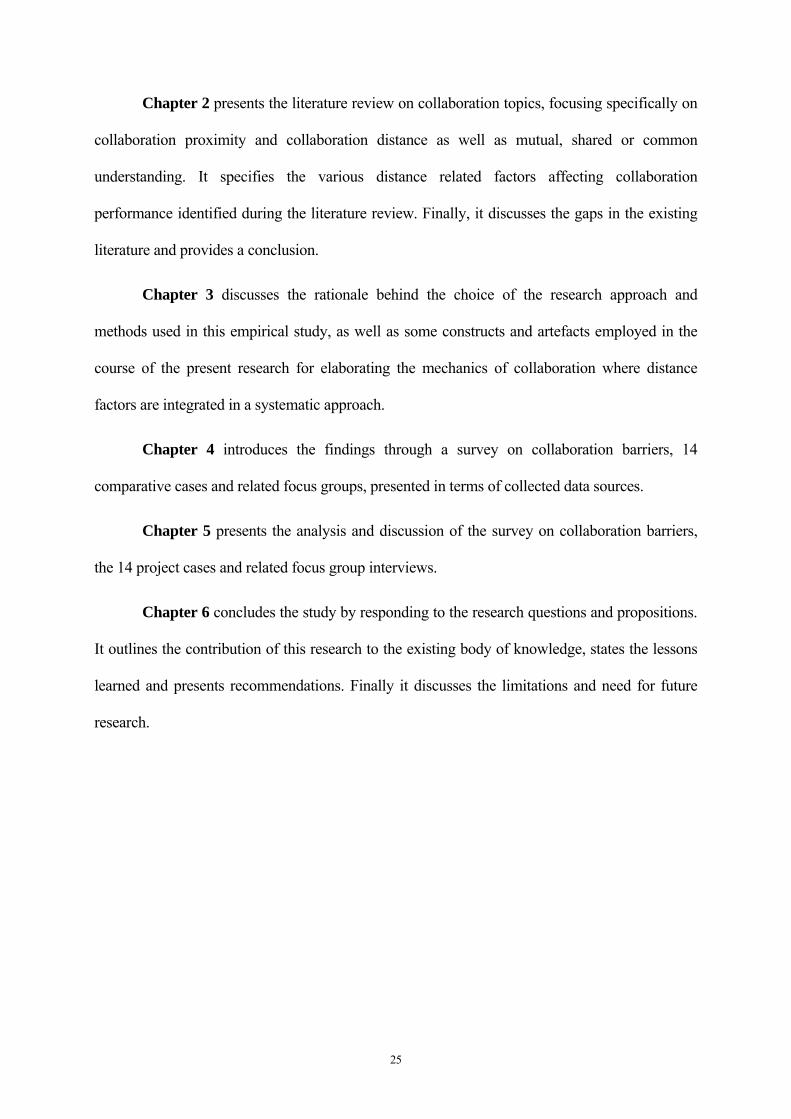
25
Chapter 2 presents the literature review on collaboration topics, focusing specifically on
collaboration proximity and collaboration distance as well as mutual, shared or common
understanding. It specifies the various distance related factors affecting collaboration
performance identified during the literature review. Finally, it discusses the gaps in the existing
literature and provides a conclusion.
Chapter 3 discusses the rationale behind the choice of the research approach and
methods used in this empirical study, as well as some constructs and artefacts employed in the
course of the present research for elaborating the mechanics of collaboration where distance
factors are integrated in a systematic approach.
Chapter 4 introduces the findings through a survey on collaboration barriers, 14
comparative cases and related focus groups, presented in terms of collected data sources.
Chapter 5 presents the analysis and discussion of the survey on collaboration barriers,
the 14 project cases and related focus group interviews.
Chapter 6 concludes the study by responding to the research questions and propositions.
It outlines the contribution of this research to the existing body of knowledge, states the lessons
learned and presents recommendations. Finally it discusses the limitations and need for future
research.
26
Figure 1.1: Thesis Structure
27
1.5 Summary
Today, Geographic Dispersion in Teams (GDT) appears to be only one of the problems
faced by knowledge workers or eProfessionals during collaboration activities. There are many
other distance or proximity factors affecting collaboration effectiveness and efficiency.
Enterprises are facing a sort of collaboration paradox. While they need to have a proper level of
diversity to ensure a high level of creativity and innovation, more distance factors affect the
overall collaboration performance.
One major and well-known factor is conceptual ambiguity, called ‘conceptual distance’
in this study, which affects interpersonal communication and mutual understanding among
collaborating stakeholders. According to Kock and Nosek (2005):
In spite of nearly 30 years of research, many phenomena related to e-
Collaboration still remain obscure and in need of clarification through empirical
and theoretical research.
They argue that this could be explained by the fragmentation of the e-Collaboration research
community and dispersion in particular collaboration issues, as well as the many different
publication streams. Their argument is confirmed in this study by the numerous research areas
considered during the literature review (see Chapter 2 for the list of research areas).
In order to reach a broader understanding of collaborative distance factors and the role of
mutual understanding in collaboration performance, this empirical study focuses on a
comparative analysis of 14 project cases, using an online Shared Workspace (SW) platform
operating over the Internet, named BSCW (Basic Services for Cooperative Work). An overall
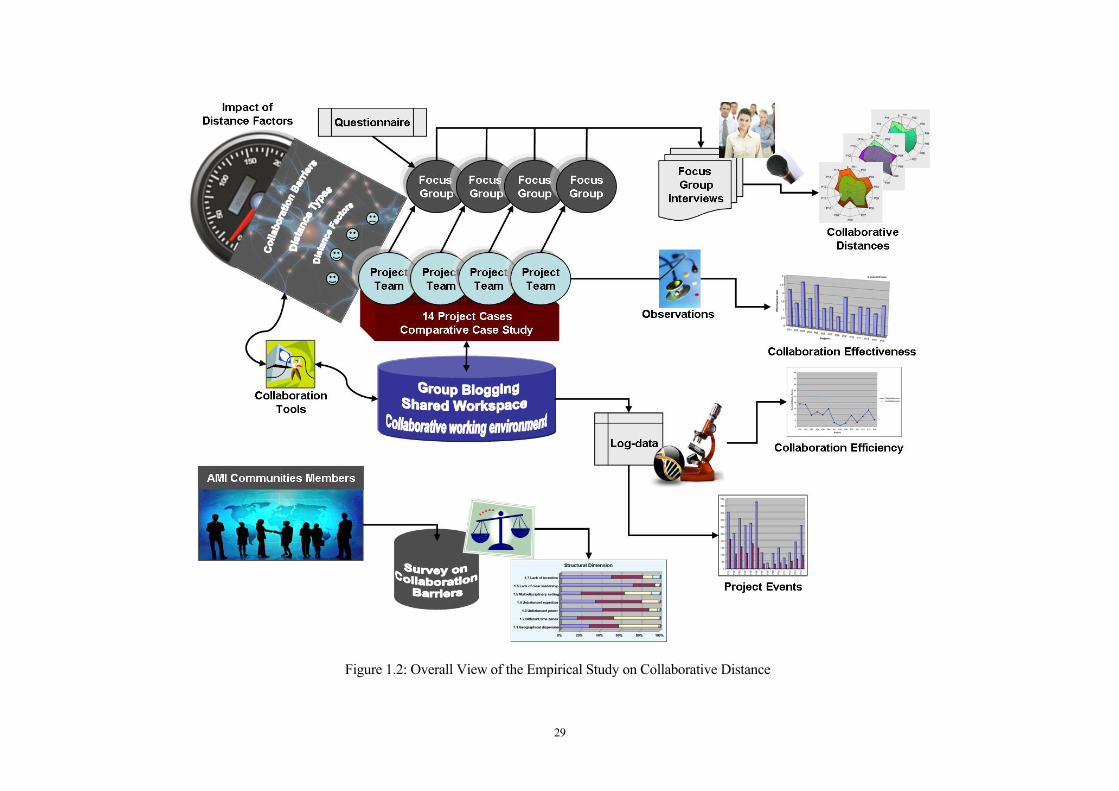
view of the empirical study on Collaborative distance is presented in the Figure 1.2, where
appear the instruments of the triangulated approach, namely: the survey on collaboration barriers,
the 14 project cases for the comparative case study, the related 14 focus group interviews and
28
finally, the collaboration technology that was used for carrying-out the 14 project cases, which
produces the log-data. Knowledge workers or e-Professionals express themselves through the
use of various concepts, and jointly develop artefacts in their collaborative or shared workspaces.
As a result of collective contributions, those concepts are constantly evolving, even while
potential new concepts emerge during creative sessions and other innovation activities. In this
study, it is believed that a mutual understanding, often called ‘common understanding’ or ‘shared
understanding’, among project stakeholders enables a more effective and efficient collaboration.
This assertion is supported by Luft and Ingham’s (1955) argument that the larger the arena
(space of interpersonal interaction conditioned by the level of mutual understanding), the more
productive the interpersonal relationship. There are several such issues related to collaborative
distance, mutual understanding and collaboration technology that deserve to be investigated
during this empirical study.
As stated earlier, there are diverse factors affecting collaboration, which we propose to
group into a holistic model (see Figure 2.6) and Collaborative Distance Framework (CDF). This
empirical study does not re-investigate the case where individuals collaborate only in the same
physical space, since numerous empirical studies have found that face-to-face collocation is
more suitable for team performance (Sakiroglu et al., 2002; Nardi & Whittaker, 2002). However,
it should be noted that face-to-face collocation no longer fits with the current business challenges
and requirements imposed by global competitiveness. While this empirical study attempts to
categorise, disambiguate and disentangle distance factors into a holistic view (see Figure 2.7) in
order to reach a broader understanding of their impact on collaboration performance, it
concurrently investigates the way in which distance factors are bridged or compressed by
collaboration technology and tools. This research is also intended to elaborate and explore
complementary models to foresee the impact of distance factors on reaching a mutual
understanding.
29
Figure 1.2: Overall View of the Empirical Study on Collaborative Distance

31
Chapter 2. Literature Review
E v e r y p a t h t o a n e w u n d e r s t a n d i n g b e g i n s i n
c o n f u s i o n . - M a s o n C o o l e y
This chapter presents the literature review conducted on collaboration issues such as
proximity and distance in collaboration, mutual understanding, social interaction model,
collaboration process and the mechanics of collaboration. It describes the different types of
distance mentioned in the literature and discusses the use of collaboration technology in virtual
collocation to bridge or compress the various types of distance. The chapter identifies existing
gaps in the literature, and points to several models that emerge as potential artefacts to fill these
gaps. Finally, a number of propositions are introduced.

32
2.1 Introduction
Despite several decades of continuous research effort on collaborative work, seeking to
understand the mechanics of collaboration and the role of sense-making, shared meanings and
mutual understanding, as well as the impact of distance factors, this remains an interesting field
of empirical study. Due to the fragmentation of the e-Collaboration research community and the
many different publication streams, as already stated by Kock and Nosek (2005), published
papers selected for the literature review belong to diverse research streams (see Figure 2.1) such
as Computer Mediated Communication (CMC), Computer Support for Collaborative Work
(CSCW), Front-End Innovation (FEI), Geographic Dispersion in Teams (GDT), Group Decision
Support Systems (GDSS), Groupware, Human Computer Interaction (HCI), Inter-Enterprise
Collaboration (IEC), Inter-Organisational Collaboration (IOC), Distributed Knowledge
Management (DKM), New Product Development (NPD) and Virtual Team (VT).
Figure 2.1: Scientific streams composing the e-Collaboration domain
33
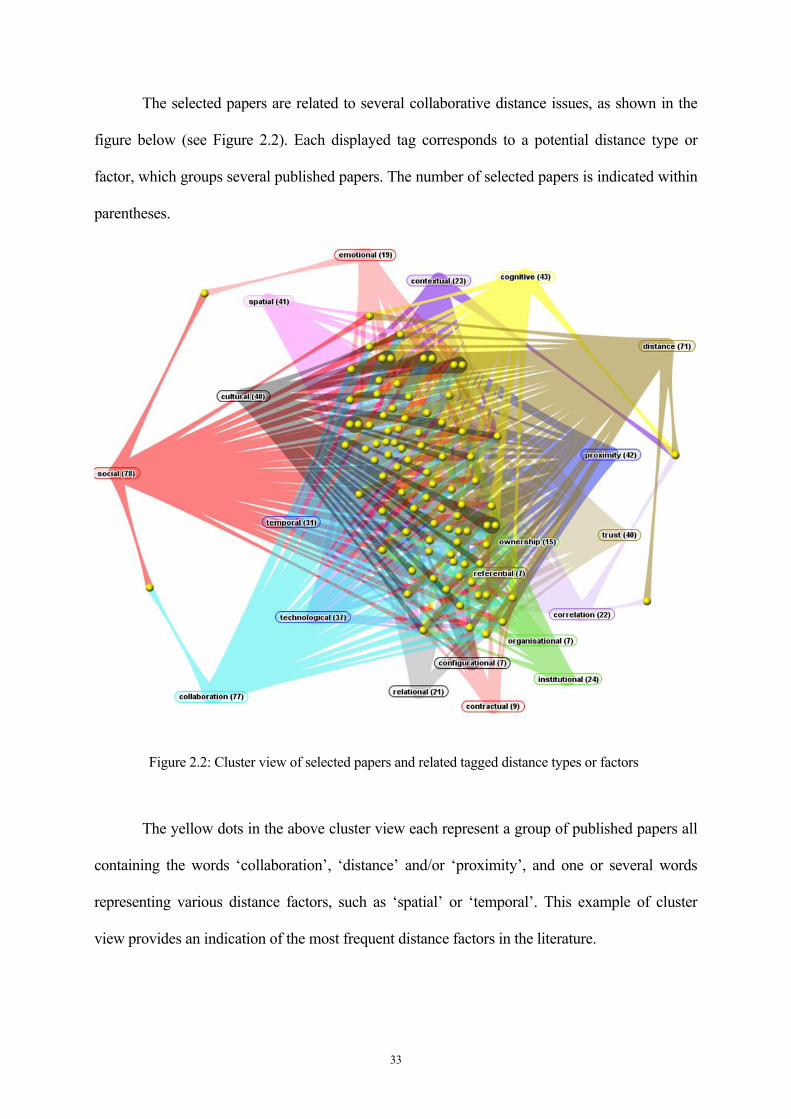
The selected papers are related to several collaborative distance issues, as shown in the
figure below (see Figure 2.2). Each displayed tag corresponds to a potential distance type or
factor, which groups several published papers. The number of selected papers is indicated within
parentheses.
Figure 2.2: Cluster view of selected papers and related tagged distance types or factors
The yellow dots in the above cluster view each represent a group of published papers all
containing the words ‘collaboration’, ‘distance’ and/or ‘proximity’, and one or several words
representing various distance factors, such as ‘spatial’ or ‘temporal’. This example of cluster
view provides an indication of the most frequent distance factors in the literature.

34
2.2 Context
Today, working patterns are extremely complex, due to the wide range of collaborative
activities and the large number of involved stakeholders, most of them having a specific
discipline and expertise, and also due to the virtualisation of the workplace (Pallot et al., 2005).
As business becomes more global and broadband connections more widely available, more and
more individuals are embracing flexible working and benefiting from its multiple advantages
(Puybaraud, 2004, 2005). A study on the future of work, carried out by Morello and Burton
(2006), highlights a clear trend towards a decrease in ‘working alone’ and team working within
‘same time and same place’ configurations. Simultaneously, there is an increase in team working
within ‘different place and different time’ and ‘same time and different place’ configurations.
Lu and colleagues state that both globalisation effect and the availability of advanced
information technologies foster the trend of globally organised work, which in turn promotes
geographically dispersed teams as the main configuration style within many organisations (Lu et
al., 2005). They argue that geographical distance implies differences in time, language, culture
and organisational processes which negatively impact team coherence and work practices. They
mention virtual work crossing space, time, organisation, culture and media as characterised by
the notion of discontinuity (Watson-Manheim et al., 2002).
When discussing collaborative activities, it appears that distance between collaborating
individuals is the most important aspect to be considered. While nearness or proximity can
facilitate communication and social interaction, greater distance can act as an impediment. This
is also confirmed by proxemics, the social use of space (Hall, 1966): when individuals operate
more than 30 meters away from each other they are not likely to collaborate as often (Kiesler &
Cummings, 2002; Kraut et al., 2002; Bradner & Mark, 2002; Armstrong & Cole, 2002; Olson &
Olson, 2001; Moon, 1999; Lipnack & Stamps, 1997; Allen, 1977; Latané et al., 1995).
Meanwhile, others claim that technologies compress geographical distance (Child et al., 2002);
35
that is, the perception of distance becomes more subjective as long as people stay connected. A
decade ago, the Information and Communication Technology (ICT) revolution was heralded as
bringing about the death of distance (Cairncross, 1997), while subsequently others have claimed
that distance still matters in international business (Ghemawat, 2001; Goodall & Roberts, 2003).
Although the persistence of distance has been openly questioned, as technology makes it possible
for firms to do business even from abroad (Nachum & Zaheer, 2005), a number of issues still
require additional attention in order to identify and overcome all distance factors.
International collaboration projects bring in positive effects, such as higher levels of
creativity and innovativeness due to a larger diversity of expertise, as well as reduced costs and
lead-time in optimising solutions based on partners’ specific knowledge and core competencies
(Pallot & Sandoval, 1998). In contrast, it is argued that increasing the number of partners
systematically leads to an exponential increase in management and integration overhead, which
impedes the global collaboration performance (Pallot & Hof, 1999), an effect described as a
collaboration paradox. Trade-off and decisions are often delayed because several partners are
involved in the same business process, while their infrastructures are neither compatible nor
interoperable (Pallot et al., 2000). Furthermore, critical factors such as security, confidentiality,
trust and confidence lead to the ‘black-box’ effect of operating solely within the group (Jones et
al., 1999).
In a study on multidisciplinary collaborations, Cummings and Kiesler (2003)
demonstrate that geographically distributed collaboration has a negative impact on both
effectiveness and efficiency, due to difficulties in communication and coordination. They raise
the interesting question: ‘What do we know about distance factors?’ This could be turned into:
‘What do we know about distributed collaboration performance affected by distance factors?’
The latter question is probably the right one to ask in order to understand the implications
for collaboration technology (Kraut et al., 2002) before exploring new ICT artefacts that could
36
help to achieve a higher performance during distributed, or online, collaboration. Unfortunately,
the current research body lacks a holistic view, and there is no universal Collaborative Distance
Framework (CDF) that captures all the dimensions of distributed collaboration and its related
distance factors. This kind of framework would prove useful for reducing conceptual ambiguity,
helping to disentangle relationships among distance factors and consolidating the results of
empirical studies to facilitate further research in this area and to develop a better understanding
of the implications of distance factors. In fact, new ICT artefacts might either create more
distance, or conversely help to bridge or compress distance factors, hence having a positive
impact on distributed collaboration performance.
2.3 Discussion of Concepts
Distributed Group versus Virtual Team
One could argue that the concepts of ‘distributed group’ and ‘virtual team’ are identical.
A virtual team is defined by Lipnack and Stamps (1997) as a group of people interacting through
interdependent tasks guided by a common purpose. They argue that virtual teams operate across
space, time and organisational boundaries, exactly like distributed teams and unlike collocated
teams, through the use of links augmented by webs of communication technologies.
Face-to-Face Collaboration versus eCollaboration
‘Collaboration’ is defined by Noble and Letsky (2003) as the mental aspects of joint
problem-solving for the purpose of achieving a shared understanding, making a decision, or
creating a product. Hurley and Hult (1998) describe collaboration as the degree to which team
members actively help one another in their work.
According to Marinez-Moyano (2006) collaboration is defined as a recursive and creative
process where two or more people work together through collective activities such as sharing
knowledge, learning and building consensus, toward the achievement of a common goal. In his
37
book Shared Minds, Schrage (1990) defines collaboration as a process of shared creation where
two or more individuals with complementary skills interact to create a shared or mutual
understanding that none had previously possessed. We can synthesise these definitions to say
that collaboration is a social interaction based process where stakeholders share knowledge and
progressively build a mutual understanding that enables the creation of new knowledge.
‘Electronic collaboration’ or ‘eCollaboration’ is described by Kock and D’Arcy (2002)
as collaboration amongst several individuals whose goal is to accomplish a task together using
electronic technologies. As Kock & Nosek (2005) point out, e-Collaboration is not limited to
Computer Mediated Communication (CMC) or Computer Supported Cooperative Work
(CSCW). Their study identifies ‘online collaboration’ among professionals in diverse types of
organisation, regardless of location or which electronic devices and networks they use. These
‘eProfessionals’ make extensive use of electronic means (fixed and mobile phones, Web devices,
Wifi) to support their collaborative activities. Where online collaboration is not restricted to Web
devices connected via the Internet, it is equivalent to eCollaboration. Fortunately, since 1996 the
term ‘online’ has had a standardised definition6 which encompasses telecommunication and
computer technology. One might anticipate a convergence among telecommunication, media,
computing and Web technologies whereby everything will be connected to the Internet and
online collaboration will encompass collaboration among agents both human and non-human
(e.g. robots).
Finally, ‘mass collaboration’ (Kriplean et al., 2007; Richardson & Domingos, 2003) or
‘massively distributed collaboration’ emerged with the extensive use of wiki, where content is
created by thousands of widely distributed individuals. This represents a radical new modality of
content creation (Kapor, 2005).
6 Telecommunications: Glossary of Telecommunication Terms, Federal Standard 1037C
38
Collaboration Styles
Collaboration involves groups of participants. These may be teams, often referred to in
the literature as small groups, or communities, referred to as large or very large groups. Teams
tend to be characterised by a structured collaboration with planned outcomes, while communities
resemble an unstructured collaboration with unplanned outcomes. One needs to be aware that
distance factors might have different impacts, depending on the nature of the observed
collaboration style. This could range from the well-known symbiotic collaboration style
(Birnholtz, 2005; Dana et al., 2001) to the more surprising stigmergic (Elliott, 2006) (e.g.
Wikipedia, Open Source Software, Second Life) and opportunistic collaboration (Chatzkel,
2003; Zhang et al., 2006) to the improbable webergic collaboration style (Pallot, 2007). The first
embeds a strategy in which participants bring their own specificities to obtain individual benefits.
The second has a strategy to benefit the community (e.g. ant colony, online community) while
the third, according to Jianwei Zhang, has an adaptive strategy where groups form, break up and
recombine for the benefit of an emerging process which leads to a higher level of collective
responsibility within more pervasive and flexible distributed collaborations (Zhang et al., 2006).
Finally, the fourth style is a Mother Nature strategy of open and self-organised sustainable
systems displaying emergent properties or behaviours which result in unplanned and
unpredictable outcomes (e.g. evolution, the Internet and the Web, virtual worlds). Stigmergic,
opportunistic and webergic collaboration styles are related to ‘mass collaboration’ or ‘massively
distributed collaboration’ (Tapscott & Anthony, 2006), and to the promise of Reed’s ‘Group
Forming Networks’ law, whereby ‘networks that support the construction of communicating
groups create value that scales exponentially with network size’ (Reed, 1999).
39
Effectiveness, Efficiency and Efficacy
According to Drucker (2006), a simple way to distinguish among effectiveness, efficacy,
and efficiency is to consider that: ‘Efficiency is about doing things right, efficacy is about getting
things done, while effectiveness is about doing right things.’
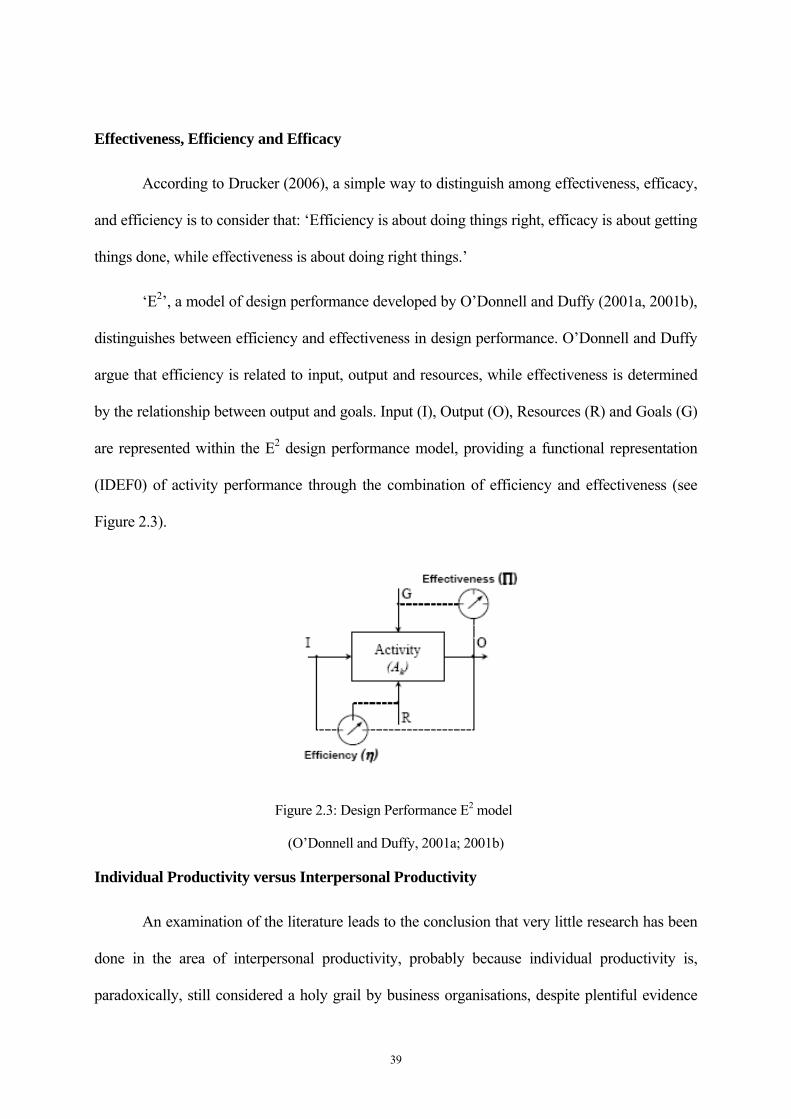
‘E2’, a model of design performance developed by O’Donnell and Duffy (2001a, 2001b),
distinguishes between efficiency and effectiveness in design performance. O’Donnell and Duffy
argue that efficiency is related to input, output and resources, while effectiveness is determined
by the relationship between output and goals. Input (I), Output (O), Resources (R) and Goals (G)
are represented within the E2 design performance model, providing a functional representation
(IDEF0) of activity performance through the combination of efficiency and effectiveness (see
Figure 2.3).
Figure 2.3: Design Performance E2 model
(O’Donnell and Duffy, 2001a; 2001b)
Individual Productivity versus Interpersonal Productivity
An examination of the literature leads to the conclusion that very little research has been
done in the area of interpersonal productivity, probably because individual productivity is,
paradoxically, still considered a holy grail by business organisations, despite plentiful evidence
40
that social interaction is the source of knowledge creation (Nonaka, 1994; Nonaka & Takeuchi,
1995; Nonaka & Konno, 1998). However, a number of research studies have been carried out on
factors affecting group, team and collective efficacy (Parker, 1994; Staples et al., 1999; Gibson,
1999; Gibson et al., 2000; Zellars et al., 2001; Baker, 2001; Pescosolido, 2001; Gully et al.,
2002; Jung & Sosik, 2003; Whiteoak et al., 2004; Carroll et al., 2005; Katz-Navon & Erez, 2005;
Fuller et al., 2006; Hardin et al., 2006, 2007) or effectiveness (Prussia & Kinicki, 1996; Furst et
al., 1999; Bal & Foster, 2000; Broom, 2002; Kayworth & Leidner, 2002; Noble & Letsky, 2003;
Piccoli et al., 2004; Maznevski & Chudoba, 2000). Noble and Letsky proposed an interesting
four categories of collaboration metrics, namely understandings, information interactions, task
performance and products, based on a combination of Cognition-Behaviour-Product and
Transactive Memory models. These models feature team cognitive behaviour and products. They
also provide the corresponding metrics for each category, from product up to understandings,
and claim that the cognitive-focused collaboration metrics not only measure team effectiveness,
but also provide insights into the reasons for this effectiveness.
Proximity versus Distance
As mentioned in previous literature reviews (Knoben & Oerlemans, 2006; Hyypiä &
Kautonen 2005; Cummings & Kiesler, 2003; Bradner & Mark, 2002; Kiesler & Cummings,
2002; Kraut et al., 2002, Nova, 2003; Olson & Olson, 2001; Torre & Gilly, 2000), there are
several research studies on distance or proximity factors affecting collaboration performance
within geographically distributed groups. In these literature reviews, proximity or nearness
represents collocated collaboration, while distance represents distributed collaboration. In an
empirical study, Kiesler and Cummings (2002) demonstrate the positive role of proximity on
relationships and group interaction, hence on collaboration performance. Torre and Gilly claim
that nearness or proximity provides a high level of information richness (Daft & Lengel, 1984,
1986, 1987) during interaction and therefore facilitates the sharing of both explicit and tacit
41
knowledge. Knoben and Oerlemans conclude that the greater the distance among group
members, the more difficult is the transfer of tacit knowledge. According to Nova, conversation
is much easier when individuals are in the same physical setting. Kock’s Media-Naturalness
theory argues that a decrease in the degree of naturalness of communication (where face-to-face
communication is the reference) decreases the quality of interaction, due to increased cognitive
effort and communication ambiguity, as well as decreased physiological arousal (Kock, 2005).
Nearness or proximity increases the frequency of communication and the likelihood of chance
encounters. It also facilitates transitions from encounters to communication, fosters informal
conversations and helps maintain task and group awareness (Nova, 2003), which Eriksson refers
to as social translucence (Eriksson & Kellogg, 2000; Eriksson et al., 2004, 2006; Eriksson 2008).
Howells argues that spatial proximity and tacit knowledge are also often necessary for
interpreting explicit knowledge (Howells, 2002).
Due to the antonymic relationship between the concepts of distance and proximity, one
might infer that distance necessarily has a negative impact on group interaction, hence on
collaboration performance. This is confirmed by Bradner and Mark (2002), who conclude that
CSCW should develop technologies for bridging social distance, not only geographic distance.
Distributed collaboration has its own specific advantages, such as creating emotional distance
during negotiation activities, which should not necessarily be removed through technologies
mimicking face-to-face situations (Schunn et al., 2002).
However, others have used proximity technology artefacts as a means to compress
distance factors; for example, social proxy tools provide a certain level of social translucence.
Due to the domain complexity of distributed collaboration, and to the impressive number of
studies published within different scientific fields, the full range of proximity or distance factors
and their inter-relationships is not immediately obvious. Therefore, it is difficult to foresee the
42
emergence of a holistic view and framework which would allow a sound classification of all
published studies and results in this area.
In addition to the frequently studied geographical or spatial distance, there are many
other types of distance affecting collaboration. Most, if not all, collaboration barriers generate
various distance types, including organisational, institutional and cultural obstacles to name just a
few.
2.4 Factors affecting Collaboration
Knoben and Oerlemans (2006), in their literature review on proximity and inter-
organisational collaboration, clearly illustrate the overlap and ambiguity of proximity concepts
used in the literature. They selected 80 papers collected within three different areas where
proximity is studied: innovation and organisation, proximity and regional economic
development, and proximity, network(s) and inter-firm collaboration. They condensed various
labels of proximity dimensions found during the literature review into seven dimensions:
geographical, organisational, cultural, technological, cognitive, institutional, and social. Finally,
they proposed grouping those seven dimensions into only three, in order to reduce conceptual
ambiguity, hence making the studies’ findings more comparable and allowing more cumulative
knowledge development. They recognised that proximity dimensions can interact over time,
strengthening or weakening their respective effects, as they are heavily correlated. They also
regretted the lack of published longitudinal research including several dimensions, instead of
looking at a single one in isolation.
Rather than focusing on a specific research area such as inter-organisational
collaboration, this study introduces a necessary holistic view and framework, clustering various
distance dimensions and related factors appearing in the course of distributed or distant
collaboration. The relevant research areas selected include Community of Practice (CoP),
43
Computer Mediated Communication (CMC), Computer Support for Collaborative Work
(CSCW), Front-End Innovation (FEI), Geographic Dispersion in Teams (GDT), Group Decision
Support Systems (GDSS), Groupware, Human Computer Interaction (HCI), Inter-Enterprise
Collaboration (IEC), Inter-Organisational Collaboration (IOC), Distributed Knowledge
Management (DKM), New Product Development (NPD) and Virtual Team (VT). This has
resulted in a broader set of published studies on distance or proximity factors, whatever the
studied field.
We have named the framework ‘Collaborative Distance’ rather than ‘Collaborative
Proximity’, because we look at the effect of distance factors that are generated during distributed
collaboration. These distance factors then need to be overcome by creating some sort of
proximity. This might be achieved by, for example, using temporary collocation to create
geographical proximity, enforcing identical project management structures to create
organisational proximity, involving project participants in social activities to create relational
proximity, or applying the same collaboration tools or standards to enable interoperability among
tools and applications to create technological proximity. These examples of creating proximity
and bridging various types of distance are not necessarily built from the use of ICT. Using a
Web-conferencing tool to create virtual proximity through online collocation is an example of
the use of ICT to compress geographical distance, while providing an element of face-to-face
interaction.
A holistic view and framework of distance factors would be useful for the scientific
community, allowing easy identification of previous relevant studies (i.e. benchmarking) once
they are properly categorised. This would allow a consolidation and comparison of the resulting
knowledge.
The concept of collaborative distance (CD) is a research area in which a universal
framework (CDF) is derived from observations on distance factors affecting collaboration

44
performance within distributed groups. This study does not use the concept of ‘collaboration
distance’ because it has previously been defined as the distance between two collaborating
individuals that are nodes in a collaboration graph (Odda, 1979; Harary, 1979). This is also
known as the Erdos number (Batagelj & Mrvar, 2000), which is the distance between
mathematicians collaborating with Erdos, or the Bacon number for actors collaborating with
Bacon. Another example of collaboration distance among individuals, explored during the
ECOSPACE project (Prinz et al., 2006), considers all events (e.g. create, read, edit) generated by
group members on all content objects uploaded within a shared workspace. The resulting figure
is a hyperGraph comprising individuals, content objects and relationships, which are valued to
measure the collaboration distance among group members (Pallot et al., 2006).
Distance is mentioned in the literature as having strong general effects and significant
implications for both collaborative work and supporting technologies (Kiesler & Cummings
2002; Olson & Olson 2001). In this context, distance or proximity (Kiesler & Cummings, 2002;
Knoben & Oerlemans, 2006; Oerlemans et al., 2000; O’Leary & Cummings, 2002; Torre &
Rallet, 2005; Watson-Manheim et al., 2002) appear in the literature either as the main factor (in
the context of this literature, ‘distance’ means implicitly ‘geographical distance’) or as a
composite concept grouping factors affecting collaboration performance among organisations or
individuals. Distance may also appear as geographically distant collaboration, often described as
distributed teams or groups (Kiesler & Cummings, 2002; Torre & Rallet, 2005), as physical
distance (Watson-Manheim et al., 2002) or even as distant linkages (Oerlemans et al., 2000).
However, in the context of distributed teams, distant collaboration simply means that
collaborating individuals are operating from geographically dispersed sites.
Distance is a complex concept, composed of several dimensions corresponding to diverse
‘aspects’ or ‘perspectives’. For example, Knoben & Oerlemans (2006) cite geographical,
organisational and technological dimensions, while Hyypiä & Kautonen (2005) mention
45
geographical, industrial, organisational, temporal, cultural, cognitive, social and institutional
dimensions. Having three or eight dimensions, as expressed in the latter two examples, may
appear quite incredible, but in fact depends on including distance classes or types in the model.
Knoben and Oerlemans identify, in their literature review, six non spatial dimensions, one spatial
dimension and nine dimensions that are synonyms. After interpreting proximity dimensions for
the specific field of Inter-Organisational Collaboration (IOC) they propose that only
organisational, technological and geographical dimensions are relevant, thus reducing the
existing conceptual ambiguity. Fischer (2005b), in his consideration of different cultures as a
source of diversity and not necessarily as a cultural distance, proposes four distance dimensions,
namely physical, temporal, technological and conceptual. Fischer also considers distance and
diversity factors as opportunities or sources of social creativity rather than exclusively as
collaboration barriers (Fischer, 2004). Bonifacio and Molani (2003) argue the key role or
richness of diversity in the process of knowledge creation.
A systematic literature review has revealed eighteen types of distances, after removing
those which appear to be synonymous (see Table 2.1). All the types of distance listed in the table
are mentioned in the literature as affecting collaboration among group members in various ways.
2.5 Collaborative Distance
Introduction
The idea of developing a framework that would provide a holistic view of factors to
collect, consolidate and share accumulated knowledge based on previous empirical studies in the
area of knowledge management has already been proposed (Vaidyanathan, 2006). According to
Schunn, Crowley and Okada, the main concern is to study distant or distributed collaboration
rather than physical proximity or collocated collaboration. They consider collaboration from a
geographical distance point of view (Schunn et al., 2002), as the trend is towards collaboration

46
within different places at the same or different times (Morello & Burton, 2006), implying the
extensive use of online or electronic collaboration. Hence, such a framework is named
‘Collaborative Distance’.
In this study, we use two types of factor to overcome distance barriers. These were
previously defined by Child and are termed ‘distance-compressing’ and ‘distance-bridging’
factors. Child et al. (2002) also named the type of factor creating barriers as ‘distance-creating’.
As pointed out by Damian (2002), in some specific cases creating distance might be
valuable (e.g. emotional distance). According to Schunn et al. (2002), this realisation raises the
second important practical implication of the findings for distant collaboration. In order to decide
when to bring in supporting technologies and which technologies to use, we need to know more
about why distance might help or hinder collaborative activities. Research has provided the first
clues that it might help, but further study is needed to determine why and under what
circumstances it might help.
It is also necessary to take note that collaboration does not occur only in collocated
situations (physical project workspaces) or in distant situations (virtual or online workspaces),
but may also occur in mixed or hybrid situations (partly distributed), where several individuals
are collocated and others are remotely engaged in collaborative activities. This kind of
distributed-collocated collaboration is termed ‘Physual Designing’ (Kristensen, 2003; Kristensen
& Røyrvik, 2004; Kristensen et al., 2005).
Various case studies illustrate the problems faced by individuals collaborating in a
specific domain when there are conceptual ambiguities which hinder collaboration performance
(Koen et al., 2001; Perttula & Sääskilahti, 2004). It is widely recognised that shared, mutual or
common understanding is the main ingredient of collaboration among individuals (Fischer,
2005a).
47
Dimensions of Collaborative Distance
Knoben and Oerlemans (2006) propose geographical, organisational and technological
dimensions to reduce the ambiguity of the proximity concept as used in the literature. However,
the geographical dimension includes only one factor, corresponding to physical distance. The
technological dimension also has only one factor, which is related to technology knowledge.
While there is no mention of the legal dimension, it plays a major role in enabling or disabling
collaboration and even more so in the case of distributed collaboration. The authors group
cultural and social factors into the organisational dimension, while geographical factors are
excluded.
Wilson et al. (2005) introduce the relativity notion, arguing that there are two categories
of distance factors. The first, ‘objective distance’, concerns spatial, temporal and configurational
elements (O’Leary & Cummings, 2002), which capture the pattern or arrangement of team
members across various sites independently of the spatial-temporal distances among them. The
second, ‘subjective distance’, mitigates physical distance or dispersion, and is driven by a wide
variety of factors. Subjectivity in distance is related to the effect perceived by people through
different sorts of feelings, such as the obvious example of emotional distance.
O’Leary and Cummings discuss the necessity of developing a dedicated framework and
measure to characterise the spatial, temporal, and configurational aspects of geographic
dispersion in teams. Watson-Manheim et al. (2005) argue that people in virtual work
environments encounter numerous boundaries in their work lives that may not be present to the
same extent in more conventional work settings. Others examine in depth five boundaries
observed in five separate research studies of field-based teams: geographical, functional,
temporal, organisational, and identity-team membership (Espinosa et al., 2003). They explain
that these boundaries are especially salient in examinations of virtual work. Orlikowski (2002)
48
found boundaries to be particularly important in understanding how work was conducted in a
geographically dispersed high tech organisation. He identified seven boundaries routinely met by
the organisation’s members in their daily activities: temporal, geographical, social, cultural,
historical, technical, and political.
These previous studies reveal that the conceptual ambiguity of proximity/distance and
the complexity of interlaced factors in the context of collaborative activities, virtual teams or
geographic dispersion in teams is even wider than previously demonstrated by Knoben and
Oerlemans (2006).
This study takes a different approach, in that the multi-disciplinary literature review,
surveying all existing types of distance and proximity previously studied, has allowed the
grouping of all types of distance into four logical dimensions of distributed collaboration among
knowledge workers or eProfessionals: structural, social, technical and legal & ethical (see Figure
2.4). This holistic research approach to distance factors in distributed collaboration is tentatively
named ‘Collaborative Distance’; it allows a balanced observation of any distributed collaboration
case along those four dimensions, providing a kind of reference framework, including a holistic
view of factors affecting collaboration performance. Categorising types of distance allows the
researcher to make various measurements that could eventually be combined into a single overall
indicator of collaborative distance.
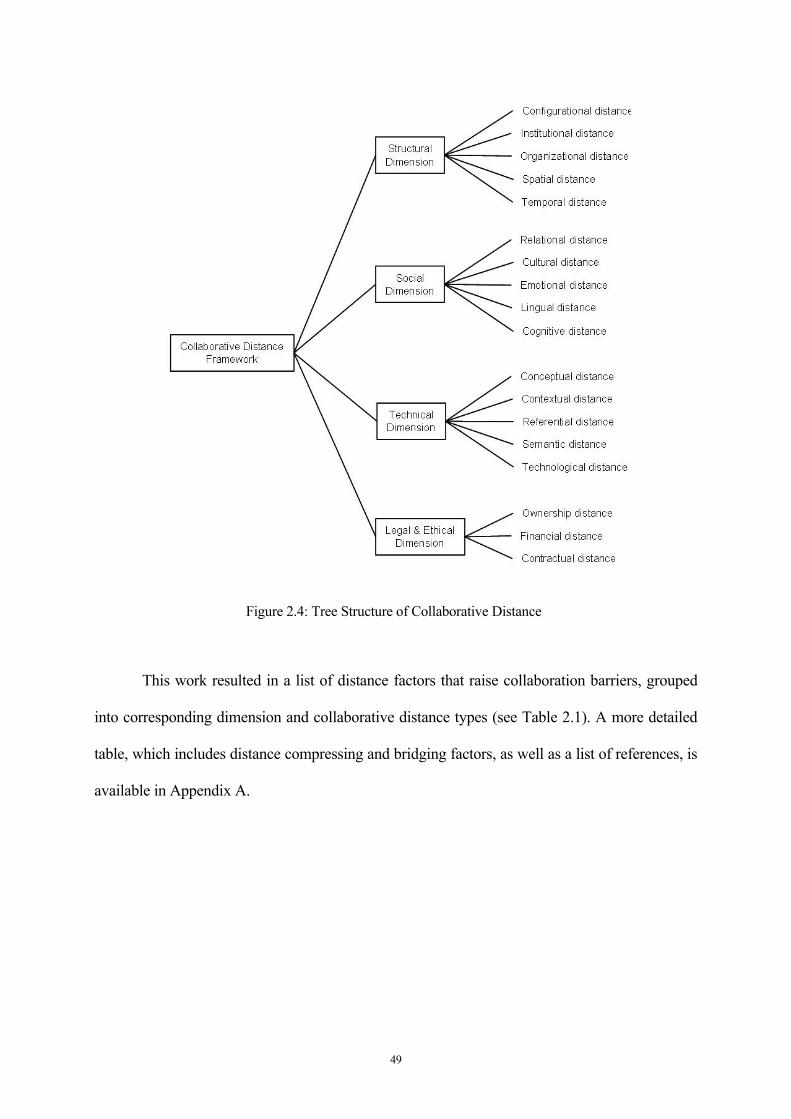
49
Figure 2.4: Tree Structure of Collaborative Distance
This work resulted in a list of distance factors that raise collaboration barriers, grouped
into corresponding dimension and collaborative distance types (see Table 2.1). A more detailed
table, which includes distance compressing and bridging factors, as well as a list of references, is
available in Appendix A.
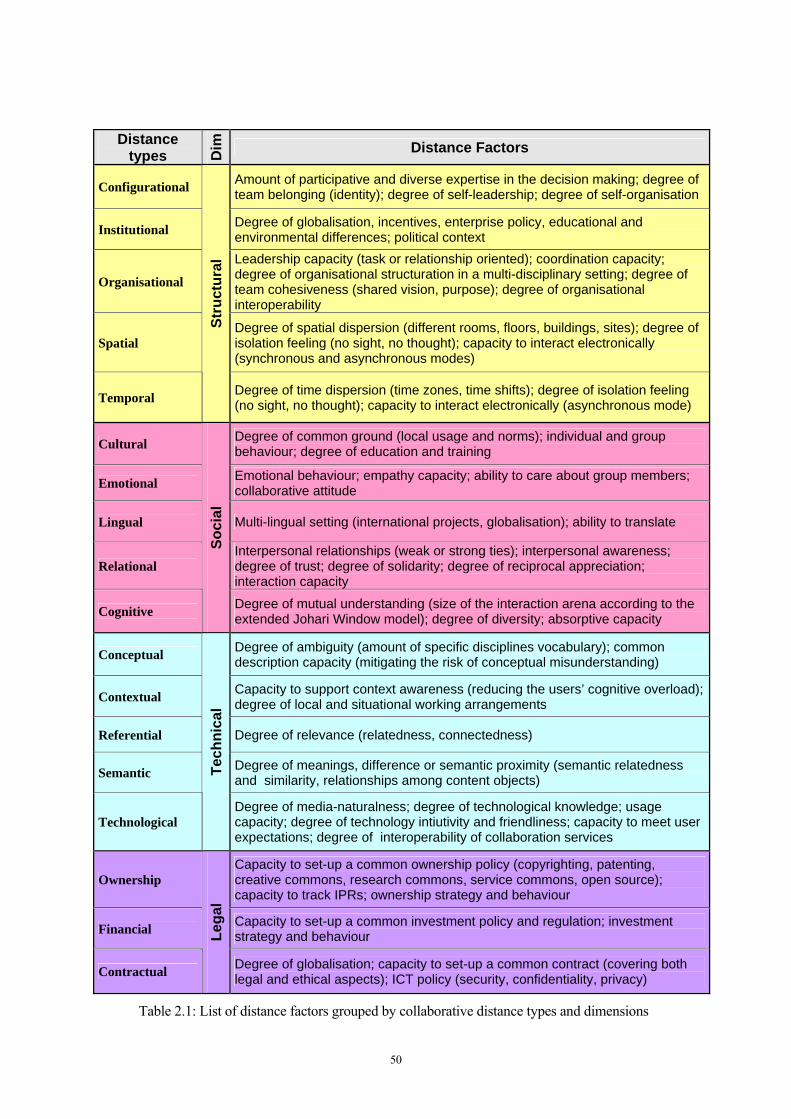
50
Distance types D
im
Distance Factors
Configurational Amount of participative and diverse expertise in the decision making; degree of team belonging (identity); degree of self-leadership; degree of self-organisation
Institutional Degree of globalisation, incentives, enterprise policy, educational and environmental differences; political context
Organisational
Leadership capacity (task or relationship oriented); coordination capacity; degree of organisational structuration in a multi-disciplinary setting; degree of team cohesiveness (shared vision, purpose); degree of organisational interoperability
Spatial Degree of spatial dispersion (different rooms, floors, buildings, sites); degree of isolation feeling (no sight, no thought); capacity to interact electronically (synchronous and asynchronous modes)
Temporal
Stru
ctur
al
Degree of time dispersion (time zones, time shifts); degree of isolation feeling (no sight, no thought); capacity to interact electronically (asynchronous mode)
Cultural Degree of common ground (local usage and norms); individual and group behaviour; degree of education and training
Emotional Emotional behaviour; empathy capacity; ability to care about group members; collaborative attitude
Lingual Multi-lingual setting (international projects, globalisation); ability to translate
Relational Interpersonal relationships (weak or strong ties); interpersonal awareness; degree of trust; degree of solidarity; degree of reciprocal appreciation; interaction capacity
Cognitive
Soci
al
Degree of mutual understanding (size of the interaction arena according to the extended Johari Window model); degree of diversity; absorptive capacity
Conceptual Degree of ambiguity (amount of specific disciplines vocabulary); common description capacity (mitigating the risk of conceptual misunderstanding)
Contextual Capacity to support context awareness (reducing the users’ cognitive overload); degree of local and situational working arrangements
Referential Degree of relevance (relatedness, connectedness)
Semantic Degree of meanings, difference or semantic proximity (semantic relatedness and similarity, relationships among content objects)
Technological
Tech
nica
l
Degree of media-naturalness; degree of technological knowledge; usage capacity; degree of technology intiutivity and friendliness; capacity to meet user expectations; degree of interoperability of collaboration services
Ownership Capacity to set-up a common ownership policy (copyrighting, patenting, creative commons, research commons, service commons, open source); capacity to track IPRs; ownership strategy and behaviour
Financial Capacity to set-up a common investment policy and regulation; investment strategy and behaviour
Contractual
Lega
l
Degree of globalisation; capacity to set-up a common contract (covering both legal and ethical aspects); ICT policy (security, confidentiality, privacy)
Table 2.1: List of distance factors grouped by collaborative distance types and dimensions
51
2.6 Structural Dimension
The structural dimension includes five distance types: configurational, institutional,
organisational, spatial and temporal. Collaboration activities are supported by different
arrangements in space and time. Both synchronous and asynchronous interactions are important
(Olson & Olson, 2001), and several research studies have already addressed the ways distributed
teams communicate synchronously and asynchronously (DeSanctis et al., 2001; Pauleen &
Yoong, 2001). However, it might be valuable to have some figures about the use of synchronous
and asynchronous communication. In mass collaboration style, people simply interact
asynchronously. Collocated team members use the synchronous interaction mode, while
distributed team members interact asynchronously. Occasionally, when absolutely necessary and
if a broadband connection is available, distributed team members turn to synchronous
interactions supported by ICT (telephony, web-conferencing, online chat, application sharing,
whiteboard). In online collaboration, access to information and resources is almost limitless on
the Internet, the Web and through multiple available digital libraries (Murray, 1999).
2.6.1 Configurational Distance
Configurational distance refers to the distribution of resources, expertise and R&D work
(Grinter et al., 1999; Miller, 1987) through the arrangement of group members across different
localisations (O’Leary & Cummings, 2002), and the way they are connected to each other
through work spaces and physical aspects of work environments (Oldham et al., 1995). Observed
factors are leadership, collaboration incentive, team membership (identity), group cohesion,
competition and conflict, as well as unbalanced power and expertise in decision making (Ancona
& Caldwell, 1992). While Meyer et al. (1993) experimented with different configurational
approaches for organisational analysis, others have studied the mutual knowledge aspect and its
52
consequence for distributed collaboration (Cramton, 2001), as well as organisational
configurations and induced performance (Ketchen et al., 1997).
2.6.2 Institutional Distance
Institutional distance is related to regional contextual developments and to country
specific regulations that impact collaboration performance (Filippi & Torre, 2003; Barkema et
al., 1997; Wilkof et al., 1995). Observed factors are historical and political particularities, as well
as economic, educational and technological development, and climatic differences (Child et al.,
2002). Institutional distance is also considered as learning about and understanding of a foreign
environment and its national or regional culture, often embedded in its language (Nordstrom &
Vahlne, 1992). It could also be related to regional and national standards such as the metric
system. It is believed that the globalisation effect drives an on-going institutional convergence of
life styles, consumption patterns, human rights standards, legal frameworks and business
practices (Child et al., 2002).
2.6.3 Organisational Distance
Organisational distance represents the degree to which explicit or implicit rules of
interaction and routines of behaviour that make coordination more effective are different and not
necessarily interoperable (Torre & Rallet, 2005). Weick (1979) explored the social psychology
of organising and later made observations on sense-making in organisations (1995). Traditional
factors encountered are management overhead and coordination burden, as well as different
communication channels, lack of interoperability, belonging and behavioural cohesion (Pallot et
al., 2000; Pallot & Hof, 1999). While Schein (1985) argued that organisational culture and
leadership work together in creating organisation distance, Smircich (1983), stated that
organisations provide a structure for shared meaning.
53
2.6.4 Spatial Distance
Spatial distance is an objective measurable distance among collaboration stakeholders
(Wilson et al., 2005). Physical, geographical, local and territorial distance types are considered as
being synonymous (Knoben & Oerlemans, 2006). Spatial barriers impede collaboration
interaction across distance (Fischer, 2005a; Raymond & Young, 2001; Scharff, 2002) and make
collaborative design difficult to support even if ICT enables new forms of collaboration (Olson
& Olson, 2001). Related factors are a notable difficulty in building trust among collaboration
stakeholders (Wilson, 2001) due to the lack of collocation and face-to-face communication, and
increased cognitive effort due to lower level of media naturalness (Kock, 2005). Antoniac and
Pulli (2000) studied the use of new technologies, such as the Internet, Mobile Communication,
Virtual Reality, Augmented Reality and Telepresence (Pulli et al., 1998), for enhancing the
information on stakeholders’ behaviour that helps to build trust. A temporary collocation of all
stakeholders in the same location at the start of a project and for later project meetings facilitates
interpersonal relationships and trust building through the use of social activities.
2.6.5 Temporal Distance
Temporal distance is measurable in order to qualify time distortion in the working
environment. This time distortion could be caused by collaboration across several time zones or
across several working shifts, or through redesign and evolution by people not necessarily
involved at the earlier stage of a design process (Finholt et al., 2001; Fischer, 2004; Shipman,
1993). A special case of collaboration called ‘reflexive Computer Supported Cooperative Work’
supports the same individual user who can be considered as two different persons at two
different points on a time scale (Thimbleby et al., 1990). Long term collaboration requires that
present day designers are aware of the rationale (Moran & Caroll, 1996) behind decisions that
shaped the artefact, and of information about possible alternatives that were considered but not
implemented.

54
2.7 Social Dimension
The social dimension comprises five distance types or classes: relational, cultural,
emotional, lingual and cognitive. If the cognitive distance does not include the absorptive
capacity factor then it is necessary to add a learning distance type. All these distance types are
related to social interaction factors that facilitate or impede knowledge sharing, mutual
understanding and knowledge creation (Schmidt, 1994). It is widely recognised that collocated
situations facilitate social activities among team members, helping everyone to know one another
better. This facilitates the building of trust, as well as common ground, hence mutual
understanding. Another very important aspect is social and team awareness (Prinz, 1999; Schäfer
et al., 2004), or social translucence (Erickson & Kellogg, 2000), the ability of every group
member to foresee what others will do in order to be able to contribute where it is most
appropriate. The use of virtual worlds to better support social translucence has already been
explored within a previous experimentation (Prinz et al., 2004). However, it might be worthwhile
to compare group awareness or social translucence with ‘social intelligence’ (Goleman, 2006),
combining social awareness (what we sense) with social facility (what we do) in order to clarify
the conceptual approach of group awareness.
2.7.1 Relational Distance
Relational distance refers to the way people build relationships with one another.
Different authors use various labels for the same concept, and Knoben and Oerlemans (2006)
found other sources of ambiguity. For example the concept named ‘personal proximity’
(Schamp et al., 2004) is identical to ‘relational proximity’ (Coenen et al., 2004), and these are in
turn the same as ‘social distance’ or ‘social proximity’ (Boschma, 2005; Rice & Aydin, 1991).
Building relationships with one another leads naturally to the notion of social networking
and the self-organising aspect of communities often called communities of practice or

55
communities of knowledge (Lave & Wenger, 1991; Brown & Duguid, 1991; 2000; Brown et al.,
1994; Wenger, 1998), where members share practical experiences within informal settings
(Wenger, 1998). Observed induced factors are cohesion and trust level, as well as motivation to
share knowledge (Jarvenpaa & Leidner, 1999; Wilson, 2001). It should be noted that weak
heterogeneous ties are more appropriate when there is a greater cognitive distance that could lead
to important stimuli for innovation (Nooteboom, 2000; Grabher, 2004). Luft and Ingham (1955)
argue that the larger the interaction arena (space of mutual understanding), the more productive
the interpersonal relationship will be. Interestingly, Wasserman and Galaskiewicz (1994)
introduce social network as channelling relational ties. They also state that social or interpersonal
influence, which does not require face-to-face interaction as the only precondition is information
about the attitudes or behaviours of group members, leads to behavioural contagion. Of course,
current social networking applications available on the Web allow individuals not only to
maintain relational ties and social proximity with previous project colleagues, but also to build
new ones with colleagues of colleagues. As such, social networking increases the ability to make
new friends at a distance and induces some entry trust level (Efimova, 2004; Pallot et al., 2006;
Walther, 2002).
2.7.2 Cultural Distance
Cultural distance represents the understanding and behavioural differences among people
living and working in various regions of the world and involved in distributed work (Moon &
Sproull, 2002; Malone, Yates & Benjamin, 1987; Hofstede, 1980, 1994). These people do not
communicate information, interpret it or react in the same way (Zheng et al., 2006). For example,
a lack of interaction could lead to non-collaborative behaviour (Biggs, 1996).
Previous studies have introduced different elements to the discussion about the effect of
cultural distance in the context of international diversification (Morosini et al., 1998; Shenkar,
2001; West & Graham, 2004; Tihanyi et al., 2005; Gasson, 2004; Gertler, 1995). Theoretical and
56
empirical evidence has been used to explain diverging findings in order to help resolve the
national cultural distance paradox (Brouthers & Brouthers, 2001). It has been found that
observed cultural distance factors impede mutual understanding and agreement on organisational
structures during decision processes or communication procedures (Shane, 1994; Alexander,
2000; Pawar et al., 1994). However, cultural differences contribute largely to the richness of
diversity, which supports a higher level of creativity (Nooteboom, 2000; Bonifacio & Molani,
2003; Fischer, 2005c). Therefore, there is an interesting paradox between a homogeneous group,
where it is easier to reach a mutual understanding but there are fewer creative stimuli, and a
heterogeneous group, where it takes longer to reach a mutual understanding but there are more
creative stimuli (Boland & Tenkasi, 1995). Levina and Vaast (2005) studied a case of Intranet
use for turning collaboration into transaction in boundary-spanning practices.
2.7.3 Emotional Distance
Emotional distance represents the way individuals or groups can perceive one another’s
feelings or emotional state or socio-emotional exchange (Halliday & Hasan, 1976; Goleman,
1998; Piwek et al., 1995); this could be disturbing, slowing-down or even impeding a specific
collaboration process such as the confrontation of arguments or the negotiation of requirements
(Glover, 2000). On the other hand, a case study about distant negotiation reveals that a
requirement for negotiation meetings to take place within computer-mediated distributed settings
did not result in decreased performance. The ability to better sense emotional states (Goleman,
1998) within face-to-face meetings brings the risk of impeding the negotiation process (Damian,
2002). A recent field study on the use of shared workspace and group blogging reveals that
emotional and social distances provide a chance to start remotely a relationship with someone
who is too shy or emotional to interact directly (Pallot et al., 2008; Efimova, 2004).
57
2.7.4 Lingual Distance
Lingual distance determines the level of difficulty for a heterogeneous group of people to
share meanings and understanding, while at the same time it brings diversity. Languages are very
much based on history, culture and tradition (Wong & Trinidad, 2004), and therefore play a key
role in cultural and cognitive behaviours. A greater lingual distance slows down or even blocks
interactions among collaboration stakeholders. However, while there are encountered factors
such as feelings of isolation, discouragement from collaborating, or difficulty in establishing
relationships and mutual understanding, there could also be more creative ideas present due to
the higher level of diversity.
2.7.5 Cognitive Distance
Cognitive distance refers to the way an individual or specific group interprets,
understands and evaluates things differently than others (Gundel et al., 1993; Nooteboom, 1992,
2000). In this context, Nooteboom, who introduced this concept, defines cognition as a broad
range of mental activity, including proprioception, perception, sense making, categorisation,
inference, value judgments, emotions and feelings, all of which build on one another. As for the
relation between cognitive distance and innovation performance, Nooteboom proposes that there
is an inverted-U shaped curve relationship whereby cognitive distance has a positive effect on
innovation capacity until learning by interaction can occur (Nooteboom, 1992, 1999). If
cognitive distance is too large, then it impedes learning by interaction and makes mutual
understanding difficult or impossible.
It is often said that innovation resides at the frontier of disciplines. Absorptive capacity is
recognised as an important factor in this context (Nooteboom, 2000). The innovation
performance is also strongly related to the novelty effect which originates from making new
58
combinations. The positive effect for firms is much higher when engaging in more radical,
exploratory alliances than in more exploitative ones.
Another interesting aspect is to look at the way communities interact and to try to better
understand the meaning, role and importance of cognitive distance (Cohendet, 2005).
Furthermore, Hollan et al. (2001) envision distributed cognition as a new foundation for Human-
Computer Interaction (HIC) research.
2.8 Technical Dimension
The technical dimension includes five distance types or classes: conceptual, contextual,
referential, semantic and technological.
2.8.1 Conceptual Distance
The greater the number of disciplines involved in a distributed collaboration, regardless
of what is induced by other distance factors, the greater the difficulty to synthesise all
perspectives and to collide concepts issued by different specialists (Fischer, 2001). Conceptual
barriers, mentioned as being an expertise gap, appear systematically during communication
between domain experts and novices, while a conceptual gap appears during communication
between stakeholders from different disciplines or practices (Fischer, 2004). The latter is seen as
a conceptual dimension between different domains (Liu & Singh, 2004). Fischer argues that
collaboration can be spatially, temporally, technologically and conceptually distributed (Fischer,
2005b).
In fact, conceptual distance represents the differences among concepts expressed in a
value of the semantic network connecting those concepts (Hofstadter & Mitchell, 1995). For
example, proximity expresses nearness while distance expresses farness. As farness is the
antonym of nearness, one may conclude that distance is also the antonym of proximity. Distance
is a concept in which value ranges from nearness (proximity) to farness (distance). In conclusion,
59
the greater the proximity, the smaller the distance, and vice-versa. Collaborative learning and
working require a shared understanding environment in which the meanings of terms or labels,
concepts and related objects can be debated and resolved (Resnick et al., 1991).
2.8.2 Contextual Distance
Contextual issues affect knowledge application in various situations that lead to
improving problem-solving in the workplace (Finke et al., 1992; Hymes & Olson, 1992). For
example, a context menu provides the user with a set of specific contextualised actions according
to the nature of the selected object. Knowing about the context of specific activities allows the
connection of various pieces of information and the creation of possible paths for the user. This
also provides functionality for updating and extending content, allowing people from the
workplace to become content providers (Prante et al., 2002). Thus, it is argued that ICT can help
bridge contextual distance (Demetriadis et al., 2005) in designing context awareness (Gross &
Prinz, 2003). Context awareness, within computer science, refers to the idea that computers can
both sense and react based on their environment. In this area Dey, Salber, and Abowd define
context as ‘any information that can be used to characterise the situation of an entity. An entity is
a person, a place or an object that is considered relevant to the interaction between a user and an
application’ (Dey et al., 2001).
2.8.3 Referential Distance
Referential distance corresponds to the distance between the point of origin and the
correlating document measured by the number of necessary references. In this way, it is possible
to describe the potential relevance of a document compared to the origin of referencing. If the
referential distance increases, the relevance can be expected to decrease (Fuchs-Kittowski &
Köhler, 2005). Bowker and Star (2000) carried out a specific study on classification and its
consequences.
60
2.8.4 Semantic Distance
Semantic distance, like semantic relatedness (Budanitsky & Hirst, 2001) and semantic
similarity (the inverse of distance, also known as semantic proximity), represents the level of
relationship of one term to another (Suchman, 1987). It can be expressed by a number from -1 to
1, or between 0 and 1, where 1 represents high relatedness and 0 represents none. Ontologies
help to define a distance between terms or words by tracking nodes and edges in graph
representations (Norman & Hutchins, 1988). Statistical tools, such as a vector space model, are
used to correlate words and textual contexts from a suitable text corpus (co-occurrence).
Semantic differential is another way of looking at semantic distance, through a potential rating
scale used to measure the connotative meaning of terms or concepts (Bowers, 1993).
2.8.5 Technological Distance
Technological distance is the result of the differences between the use of various
technologies, which could be either ICT or production technologies, or even a combination of
other technology types (e.g. biology). Collaboration activities are potentially enhanced, as
collaborative technologies enable individuals to contribute with their own specificities to the
collective work (DeSanctis et al., 2001). However, distributed group members should have a
mutual understanding about the collaborative technologies (Mulder, 2002) and their availability
at their own location (Mayben et al., 2003). Moreover, it can be argued that often individuals do
not feel comfortable with using ICT to support distant collaboration (Pauleen & Yoong, 2001),
hence the high usage rate of both telephone and electronic mailing technologies, as nowadays
almost everyone is able to use them properly.
Synonymous with technological distance is industrial distance, as it is often related to
organisations using similar or close production technologies (Hyypiä & Kautonen, 2005). In
addition, Boix Miralles (2001) argues that there is a technological distance resulting from the
61
differences between the product and production technologies involved in a purchase. This is
confirmed by Winroth and Danilovic (2002) in another empirical study on distance in IOC.
Technological distance is generated by the gap of technological knowledge that
individuals can learn from one another. A lower technological distance (nearness) among
collaboration stakeholders facilitates the acquisition and development of technological
knowledge and technologies (Knoben & Oerlemans, 2006). Hence, technological distance is
linked to the concept of absorptive capacity as the ability to assimilate and apply external
knowledge (Nooteboom, 2000; Cohen & Levinthal, 1990).
2.9 Legal Dimension
Legal and ethical aspects should not be neglected, since there are demonstrated
relationships with social implications, exploitation objectives, security and confidentiality
agreements, as well as privacy and inclusion concerns, which often lead to situations of conflict
among collaboration stakeholders. On the one hand, social implications are related to trust
building and mutual confidence among stakeholders. On the other hand, social implications are
related to public and management recognition, such as reward mechanisms, as well as learning,
pre-emptive protection, control, and enabling commercial production of the outcome, as
demonstrated by Sawhney (2002). Legal and ethical distance factors, when wrongly addressed,
could easily turn any collaboration into a very low performance. Despite their importance,
however, they have often been ignored within previous empirical studies.
2.9.1 Ownership Distance
Ownership distance is related to Intellectual Property Rights (IPR), patenting and
copyrighting as well as ‘open source design’ or ‘creative commons’ (Gupta and Landry, 2000).
Sawhney (2002) argues that IPR play an important role in making design innovations accessible
to target communities and producers in developing countries. Property rights in scientific
62
research and academic settings have caused passionate debate as to whether they should have a
public or commercial nature. Currently, there are two opposite trends: a willingness to promote
greater commercialisation of research through formal IPR mechanisms such as patents and
copyrights; and a growing support for greater openness towards academic programs and research
through Open Source initiatives (Sawhney, 2002) and for open mass collaboration (e.g. wikis)
through creative commons (Pallot et al., 2006). Ristau Baca states that while the creative
commons licensing system has achieved major recognition and use, its application to scientific
transactions presents major challenges, as it involves copyrighted works based on individual
licensing of creative works for use on the Internet, while a science commons license implies a
transfer of physical goods or information not subject to copyright (Ristau Baca, 2006).
According to Ristau Baca, science commons involve significantly more complex and
sophisticated parties, though a properly implemented science commons license could bridge
ownership distance (Ristau Baca, 2006).
2.9.2 Financial Distance
Hart and Moore make the case that the value of a business relationship depends on the
participation of the parties in the relationship and the investments made (Hart & Moore, 1990). A
player’s participation may be indispensable to an asset. If he does not participate in the venture
then the asset may not be productive at all. Financial investment behaviour is often related to past
collaboration experiences and confidence, in that there is no financial investment gap or distance
with other partners. Some investments are relationship or asset specific, meaning that their value
outside the relationship is very low (Hart & Moore, 1990).
2.9.3 Contractual Distance
Contractual distance is related to the aspect of specifying participants’ rights and
obligations within different conceivable circumstances which may occur during a collaboration
63
project (Grossman & Hart, 1986). Many contingencies may not be possible to foresee, or even if
they were, it might be prohibitively expensive to draft contracts encompassing all conceivable
contingencies, as argued by Hart and Moore (1990) in a theory of property rights based on
incentives. Hence, many contingencies, often related to IPR, security and confidentiality, as well
as ethical aspects such as privacy and inclusion (Silverston, 2004), are not properly addressed in
contracts. Therefore, they create contractual distance among parties that may impact
collaboration performance. The security aspect is often neglected, yet wrongly, as it appears to
be one of the necessary conditions for enabling trust building among distributed collaboration
stakeholders, especially in the context of the Internet and the Web (Appelt et al., 2007).
Furthermore, national regulations regarding the use of ICT might differ from one country
to another, which would create contractual distance regarding the protection of ownership,
security and privacy. Where a group of partners do not share certain concerns, virtual mediation
will not create proximity even if ICT appears to compress spatial distance (Introna, 2005).
2.10 Mutual Understanding
In the context of open innovation, project teams are multidisciplinary, where team
members operate collaboratively in a social process (Bucciarelli, 1994). Kleinsmann (2006)
provides the following definition of collaborative design:
The process in which actors from different disciplines share their knowledge
about both the design process and the design content. They do that in order to
create shared understanding on both aspects, to be able to integrate and explore
their knowledge and to achieve the larger common objective: the new product to
be designed.
Valkenburg (1998) stated that team members create mutual understanding when the
interpersonal communication is efficient. Other authors, such as Dong (2005), Kleinsmann and
64
Valkenburg (2005) and Kleinsmann et al. (2007), have conducted research on factors influencing
the building of mutual understanding. Kleinsmann and Dong (2007) investigated the impact of
the affective force on building mutual understanding. Valkenburg (2000) developed a graphical
method for representing the process of mutual understanding, in which he introduced the concept
of ‘shared frames’. Shared frames are created by a team during a reflective practice (Schön,
1983). The reflective practice comprises four activities: framing (describe the solution space),
naming (make explicit all that needs attention), moving (create ideas, explore problems, assess
the impact of decision) and reflecting (look at themselves and reframe the problem). In this
reflective approach the building of mutual understanding is presumed to be decoupled.
There are a number of published papers which compare physically and virtually
collocated teams, and demonstrate a higher effectiveness and efficiency of the collocated form.
This is partly due to there being an easier and faster way to reach a shared understanding among
team members. In fact, ‘shared understanding’ in this context means mutual understanding,
because a mind is not a sharable device. Shared understanding is also referred to as common
understanding (Büchel & Denison, 2003) or mutual understanding (Vaidyanathan, 2006), and is
promoted by shared vision, goals and culture.
Sakiroglu compares virtual teams and collocated teams in using situational awareness.
He acknowledges that the two conditions achieved in the experiment represent two extremes
(Sakiroglu et al., 2002). The fully collocated case is rare, because experts in all aspects of the
product lifecycle do not usually work in a collocated manner; while conversely, dispersed teams
usually have some face-to-face meetings throughout the project. He also explains that the results
highlight statically significant differences between the two conditions, with virtual teams
manifesting less situation awareness and higher frustration. As for shared understanding, he
writes:
Understanding – that is, how easy it was to make sense of the information being

65
provided. The results were not significant here, but there was a clear trend
indicating that the collocated team found it easier and increasingly easier to
make sense of the task as the game progressed. This was not so evident for the
virtual team.
According to Hill, shared understanding is a critical element in successful collaborative
design (Hill et al., 2001). Toye argues that within a multi-disciplinary collaborative product
development environment, design occurs as a social process of reaching a shared understanding
of the design problem, requirements and process itself (Toye et al., 1993). Furthermore, Hill
(2001) citing Kilker (1999) found that “engineers bring their own language, jargon and
perspectives, resulting in incompatible viewpoints among design team members which may lead
to ineffective collaborative, sub-optimal decision-making and impaired projects”.
Büchel and Denison (2003) state that creating a common understanding among the NPD
team stakeholders enables the different functions to contribute to the success of the team. Dense
networks foster shared understanding, leading to the creation of knowledge necessary to mobilise
innovative action. They found that terminology such as ‘shared understanding’, ‘shared
cognition’ or ‘collective sense making’ are similar to the concept of mental models, with each
concept postulating that common perceptions at the team level have a positive impact on team
outcome. Furthermore, Neumann et al. (2006) propose a framework for shared mental models
in design; the framework includes four models: task model, process model, team model and
finally, competence model.
According to Donnellan and Fitzgerald (2003), the dependence on tacit knowledge,
which is situated in individuals’ minds, combined with temporary involvement in project teams,
leads to a lack of shared understanding among NPD team members.
66
Kleinsmann and Valkenburg (2005) argue that previous research shows that shared
understanding is important for the ability to manage the integration of different knowledge
domains. In their study, they describe learning opportunities as being enablers or disablers for the
achievement of shared understanding. They recommend the explicit use of storytelling during an
NPD project to create a learning organisation with shared understanding between the actors.
Based on some prevailing theories of interpersonal communication, Wertsch (1991)
states that a shared understanding between communicators comprises both design objects and
design vocabulary. He also refers to the popular expression of a team being ‘on the same page’,
meaning that a true collective understanding occurs. For Wertsch, when a design team is ‘on the
same page’, this implies group acceptance of a common set of design vocabulary, especially
when team designers come from different disciplines or backgrounds. Fischer also points out that
similarity in voice collaboration path (Fischer, 2005a) between designers is a critical element to
progressing through the design process (Arias et al., 2000).
According to Cooper and Kleinschmidt (1995), Griffin (1996) and Citera et al. (1995),
high-performance teams excel in developing shared understanding through cooperative
exchanges of information and mutual agreements. Communication in a social setting is often
characterised as the creation of shared understanding through interaction among people. For
Robinson and Bannon (1991), groups of people form ‘semantic communities’ with their own
conventions of meaning, especially when they communicate often and over long periods of time.
Bodker and Pedersen (1991) defined the term ‘workplace culture’ as a common ‘code of
conduct’ shared among group members. Others argue that teams must be able to synthesise
shared knowledge into a shared understanding in order to ensure successful outcomes (Baird et
al., 2000; Lloyd, 2000).
Gerhard Fischer (2005a) mentions shared understanding as one of the most fundamental
challenges facing Communities of Interest (CoI). He states that combining different and often
67
controversial points of view to create a shared understanding among these stakeholders can lead
to new insights, new ideas, and new artefacts. Fischer also highlights a way of creating shared
understanding. He argues that the traditional model for collaboration, the ‘division of labour’, is
inadequate to address the critical issues of social creativity.
Communities of Practice (CoP) (Wenger, 1998) consist of field experts operating in
specific domains, while Communities of Interest (CoI) are composed of experts from different
fields, who collectively solve particular issues. Wenger argues that communication within CoI is
difficult because the stakeholders, coming from different fields of practice, use different
languages, different conceptual knowledge systems, and sometimes even different notational
systems. Fischer (2005a) cites Wenger’s work (1998) for explaining that CoI have greater
potential for creativity than do CoP. Different backgrounds and different perspectives can lead to
new insights (Bonifacio & Molani, 2003; Csikszentmihalyi, 1996). Based on previous work
(Clark & Brennan, 1991), Fischer declares that the most fundamental barrier that CoI need to
overcome is the challenge of creating common ground and shared understanding.
In this study, in order to avoid any ambiguity, ‘common’, ‘shared’ and ‘mutual’
understanding are considered synonymous terms. The term ‘mutual understanding’ seems to be
the most appropriate because as mentioned above, an individual’s mind is not a sharable device.
It represents the outcome of combined activities of sense-making and shared meaning that allows
a group of individuals to reach the same level of understanding. Vision, perspective (viewpoint),
language, jargon and other specific vocabulary or representation models resulting from cultural
practices, backgrounds and conventions are involved in the process of reaching a mutual
understanding. As a matter of fact, it is well known that project teams get a mutual understanding
of their process as soon as they are able to collectively represent and refine it graphically (e.g.
functional activity modelling based on the use of IDEF0 modelling technique and tool).

68
2.11 Virtual Collocation with Collaboration Technology
2.11.1 Face-to-face versus Distributed Environment
Issues Physical Collocation Virtual Collocation
Proximity Close Remote
Typical Use In small and medium sized companies with one or few sites
Multi-national and international organisations with different sites
Cultures Limited diversity, since the team members come from the same company or site
Larger diversity due to participants from different countries or regions
Information Exchange
Opportunity for sharing formal and informal information (ideas, dilemmas)
Limited opportunity to share informal information due to the dispersed location
Relationships Ample opportunity for face-to-face interactions
Limited opportunity to interact and build relationships
Purpose An evolving common sense of purpose A directed common sense of purpose
Resources Ample opportunity for sharing of resources (technical, human, financial)
Limited access to similar technical and non-technical resources
Technology Fewer hiccups due to possible sharing of technical systems
Possible problems due to variations in non interoperable technical systems
Working Environment A higher sense of belonging within the team Feelings of isolation and frustration, and
possible absence of a sense of belonging
Accessing Information
Availability of information at any time to every team member
Limitation in time and space for accessing information
Transparency of Activities Greater visibility of the design work Lack of visibility of the work being carried
on by the group
Education Background Similarity of work method and employment Difference in education, language, training,
time orientation and expertise
Empowerment A lower degree of empowerment and closer supervision
A higher degree of empowerment and delegated authority and looser control
Table 2.2: A comparison of the typical characteristics of physically or virtually collocated teams
(Sharifi and Pawar, 1997)
Today, there is no longer debate about whether collaboration adds to a face-to-face
(physical collocation) or distributed (virtual) environment. There are two main reasons for this:
First of all, numerous empirical studies have demonstrated the benefits of face-to-face
collaboration simply because it is a human activity, while Kock (2005) argues that a decrease in
the degree of communication naturalness decreases the interaction quality.
69
Second, the race to increase productivity and innovation leads to a greater openness to
external ideas and competences that in turn leads to distributed Collaborative Working
Environments (CWE). Because technology lowers time and distance barriers, teams grow with a
broader life-cycle scope and involve new stakeholders such as suppliers, customers and end-
users, most of them operating from dispersed locations. This issue was identified by Lipnack and
Stamps (1997) in their model named ‘Team Size and Bands of Involvement’, with its three
layers: ‘inner circle’, ‘extended team’ and ‘external partners’. They also explained the process:
‘Make a first pass at the team’s bands of membership: the small core group, the extended
network of closely involved part-timers, and a periphery of experts and support people who are
recruited on an as needed basis.’
One previous study, carried out by Sharifi and Pawar (2002), explores and compares the
concepts of the collocation of teams in physical and virtual environments. The authors state that
a face-to-face environment implies that stakeholders contributing to the design and development
of a new product are located in close proximity to each other. They note that major benefits of
collocation are often described in terms of increased interactions, ease of informal
communication and efficiency of use of resources. However, they cite Rafii (1995), who
considered these gains as illusory, arguing that centralised collocated product development
activities become inefficient in the context of globalised manufacturing. They state that
electronic mail and engineering databases are often used to facilitate a kind of virtual collocation
simulating face-to-face communication (Pawar & Sharifi, 1997), and provide a table (see Table
2.2) that lists a set of issues and respective characteristics on the basis of which the two forms of
teaming may be compared. Lipnack and Stamps (1997) propose three foundational concepts:
‘people, purpose and links’ and state that: ‘The principles of people, purpose and links form a
simple systems model of inputs, processes and outputs.’ Their book is structured according to
these three principles (see Table 2.3).
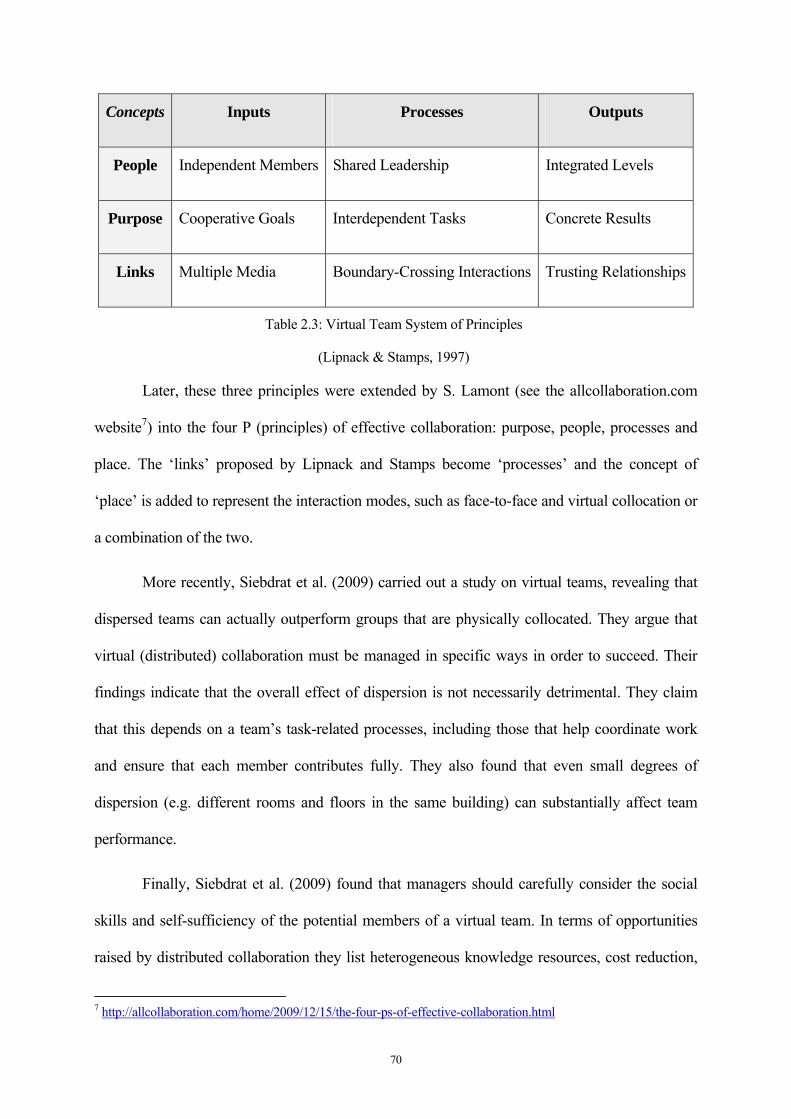
70
Concepts Inputs Processes Outputs
People Independent Members Shared Leadership Integrated Levels
Purpose Cooperative Goals Interdependent Tasks Concrete Results
Links Multiple Media Boundary-Crossing Interactions Trusting Relationships
Table 2.3: Virtual Team System of Principles
(Lipnack & Stamps, 1997)
Later, these three principles were extended by S. Lamont (see the allcollaboration.com
website7) into the four P (principles) of effective collaboration: purpose, people, processes and
place. The ‘links’ proposed by Lipnack and Stamps become ‘processes’ and the concept of
‘place’ is added to represent the interaction modes, such as face-to-face and virtual collocation or
a combination of the two.
More recently, Siebdrat et al. (2009) carried out a study on virtual teams, revealing that
dispersed teams can actually outperform groups that are physically collocated. They argue that
virtual (distributed) collaboration must be managed in specific ways in order to succeed. Their
findings indicate that the overall effect of dispersion is not necessarily detrimental. They claim
that this depends on a team’s task-related processes, including those that help coordinate work
and ensure that each member contributes fully. They also found that even small degrees of
dispersion (e.g. different rooms and floors in the same building) can substantially affect team
performance.
Finally, Siebdrat et al. (2009) found that managers should carefully consider the social
skills and self-sufficiency of the potential members of a virtual team. In terms of opportunities
raised by distributed collaboration they list heterogeneous knowledge resources, cost reduction,
7 http://allcollaboration.com/home/2009/12/15/the-four-ps-of-effective-collaboration.html

71
access to diverse skills and experience, knowledge about diverse markets and a ‘follow the sun’
working strategy. In terms of difficulties they list language differences, cultural incompatibilities,
harder to establish ‘common ground’, fewer (or even no) synchronous face-to-face interactions
and harder to achieve good teamwork (Nardi & Whittaker, 2002). One might conclude that
temporal distance (team spanning different time zones) is a special case where the benefit of
working 24 hours a day as a ‘follow the sun’ strategy is very clear, and physical collocation is
not an option.
The use of collaboration technology in cooperation between individuals and
organisations is currently growing. This is due to various driving forces, such as globalisation
and outsourcing trends, workforce demand for flexibility, critical need for rapid innovation, and
value co-creation among suppliers, customers and end-users. Other driving forces include
technology and tools enabling a networked world, and the behaviour and expectations of the Net
Generation or Digital Natives. Collaboration is becoming an ever more essential competitiveness
tool for both individuals and businesses.
While collaboration remains among people, the adoption of collaboration techniques,
methods, technology and tools induces significant challenges. Collaboration applications,
whether traditional or Web 2.0, widen the scope of functionalities, including social networking.
The dedicated selection of appropriate collaboration tools is a real challenge for most
organisations. They can choose either many tools for different purposes or a few tools to which
new functionalities can be added based on the needs of evolving projects. New ways of doing
things require, at least, the adaptation of current processes or even the creation of new ones in
order to achieve a greater value. One might see collaboration as a coin having two sides: the
social elements on one side and the technical means on the other side. Inside the collaboration
coin reside structural and legal ingredients.
72
Collaboration experts8 D. Coleman, S. Lamont, L. Datta and A. Schmidt have declared
on their website:
We repeatedly make the case that enterprises need to approach collaboration
holistically. Effective collaborations must cross functional and company
boundaries to include all the right people. They must challenge and inspire the
teams to invent new approaches. And they must encompass more than the team
assignments and the tools. In short, they must address the Four Ps of
Collaboration9: Purpose, People, Processes and Place.
Place refers to the ‘place’ where the team conduct their interactions, such as face-to-face
or virtual collocation, through the use of synchronous interactions (physical meetings, phone or
Web conferences) or asynchronous interactions (message boards, wikis, e-mail exchanges, etc.).
In fact, with the exception of physical meetings, all types of places are virtual collocation; hence
the use of collaboration technology. However, they also mention that interactions or place might
change over the course of the collaboration project; for example there might be a kick-off
meeting for more direct contact at the start of the collaboration project, followed by virtual
interactions throughout the project duration, then a final face-to-face meeting with direct contact
to arrive at the solution.
It is worthwhile to note that Coleman et al. also recommend the use of a holistic approach
for implementing a collaboration project. A possible comparison of the dimensions used in their
holistic approach of collaboration and the one used in this study could be the following: purpose
and processes mean the structural dimension, people refers to the social dimension and place
corresponds to the technical dimension.
Coleman et al. also state that:
8 http://allcollaboration.com/about-me/ 9 http://allcollaboration.com/home/2009/12/15/the-four-ps-of-effective-collaboration.html
73
Collaboration requires culture change aimed at flattening hierarchy, increasing
transparency, allowing right talent to naturally flow to right endeavours without
organizational barriers, establishing open communication, ensuring recognition
commensurate with contributions, firing know-it-all’s and gate-keepers, and so
on. You will know you have succeeded when leading companies are trying to
steal your employees because of their collaboration skills. Seemingly little things
can become big, especially when it comes to the human element. It helps a great
deal to pay close attention to communication styles and needs, cultural
differences, personal desires and constraints, and recognition and rewards.
2.11.2 Groupware versus CSCW
In terms of collaboration technology, two research streams, ‘CSCW’ and ‘Groupware’,
appear in the literature. Koch and Gross (2006) define CSCW as follows:
The research field Computer-Supported Cooperative Work (CSCW) is concerned
with understanding social interaction and the design, development, and
evaluation of technical systems supporting social interaction in teams and
communities – or in other words it is about researching the use of computer-
based technology for supporting collaboration. The field was coined in the 1980s
by researchers from computer science, information science and social science.
Koch and Gross (2006) adapt a functional classification comprising five application
classes: awareness support, communication support, coordination support, team support and
community support, often used for discussing groupware applications (Borghoff & Schlichter,
2000).
Groupware is a general concept representing technology that supports group
collaboration. Defined by Ellis et al. (1991) as ‘computer-based systems that support groups of
74
people engaged in a common task or goal and that provide an interface to a shared environment’,
groupware encompasses groups of technologies that mediate interpersonal collaboration through
computers and networks such as the Internet. It encourages collaboration and interpersonal
productivity by automating tasks and enhancing communication efficiency. In terms of
applications, groupware can be anything from e-mail and online conferencing to workflow
automation. First described by Peter and Trudy Johnson-Lenz in 1978 as ‘intentional group
processes plus software to support them’, groupware has been referred to by Doug Englebart
(1988) as ‘a co-evolving human-tool system’. Later, David Coleman (1997) described
groupware as ‘computer-mediated collaboration that increases the productivity or functionality
of person-to-person processes’.
The primary motivations for groupware were fewer face-to-face meetings (reduced travel
costs), automation of routine processes (increased individual productivity), integration of
geographically disparate teams (reduction of relocation costs) and extension of the organisation
to include both customers and suppliers (better coordination and customer service). Other
motivations were enhancement of competitiveness through faster time to market and better
support for Total Quality Management. Later, groupware evolved as a broader concept to foster
collaboration and increase interpersonal productivity by automating tasks (workflow) or
enhancing the efficiency of communication and interaction.
2.11.3 Collaborative Working Environments
The myriad software tools to support distributed collaboration include real-time
conferencing tools, collaborative authoring tools, workspace functionality, messaging support,
functions to coordinate tasks, awareness information about the people collaborating, facilities for
persistent conversations and functionality to syndicate contributions. Figure 2.5 below, an
updated version by Slagter et al. (2006) of a previous figure by O’Kelly and Gotta (2006),
illustrates the key functionalities of a Collaborative Working Environment (CWE).

75
Many different tools and applications support collaboration. Within a group of
independent eProfessionals, team members will have different preferences and experiences
regarding the use of these tools and applications. Moreover, eProfessionals often contribute to
more than one project. Consequently, they are members of different shared workspaces and have
their own personal information spaces where they keep track of their overall planning and store
their private information.
Figure 2.5: Key functions of collaboration and communication infrastructure
Slagter et al. (2006) updated from O’Kelly & Gotta (2006)
Major bottlenecks with current collaboration tools are the lack of interoperability and
information overload. Most of the collaboration applications are designed under the assumption
that all project team members will use the same application. While this is an attractive and
simplifying goal for collaboration tool designers, it does not reflect the reality.
The descriptions of current collaboration ICT infrastructure show that most of the tools
focus on supporting individuals’ activities rather than team activities. A survey carried out by
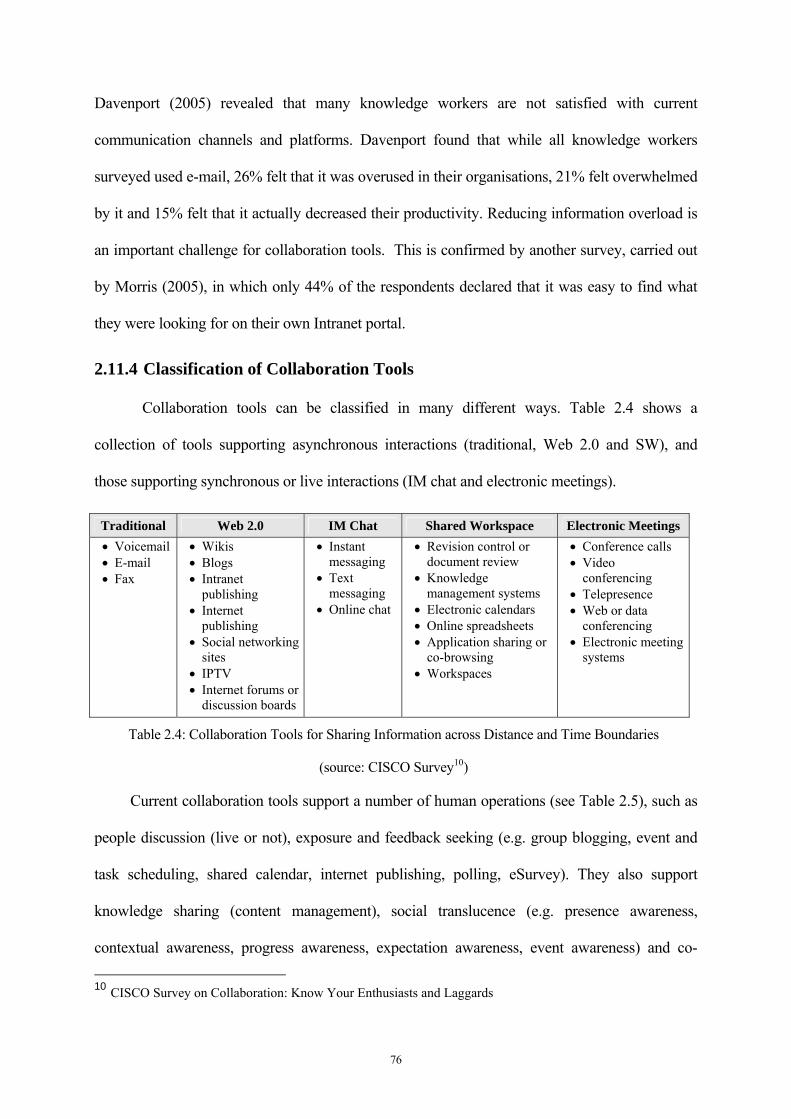
76
Davenport (2005) revealed that many knowledge workers are not satisfied with current
communication channels and platforms. Davenport found that while all knowledge workers
surveyed used e-mail, 26% felt that it was overused in their organisations, 21% felt overwhelmed
by it and 15% felt that it actually decreased their productivity. Reducing information overload is
an important challenge for collaboration tools. This is confirmed by another survey, carried out
by Morris (2005), in which only 44% of the respondents declared that it was easy to find what
they were looking for on their own Intranet portal.
2.11.4 Classification of Collaboration Tools
Collaboration tools can be classified in many different ways. Table 2.4 shows a
collection of tools supporting asynchronous interactions (traditional, Web 2.0 and SW), and
those supporting synchronous or live interactions (IM chat and electronic meetings).
Table 2.4: Collaboration Tools for Sharing Information across Distance and Time Boundaries
(source: CISCO Survey10)
Current collaboration tools support a number of human operations (see Table 2.5), such as
people discussion (live or not), exposure and feedback seeking (e.g. group blogging, event and
task scheduling, shared calendar, internet publishing, polling, eSurvey). They also support
knowledge sharing (content management), social translucence (e.g. presence awareness,
contextual awareness, progress awareness, expectation awareness, event awareness) and co- 10 CISCO Survey on Collaboration: Know Your Enthusiasts and Laggards
Traditional Web 2.0 IM Chat Shared Workspace Electronic Meetings • Voicemail • E-mail • Fax
• Wikis • Blogs • Intranet
publishing • Internet
publishing • Social networking
sites • IPTV • Internet forums or
discussion boards
• Instant messaging
• Text messaging
• Online chat
• Revision control or document review
• Knowledge management systems
• Electronic calendars • Online spreadsheets • Application sharing or
co-browsing • Workspaces
• Conference calls • Video
conferencing • Telepresence • Web or data
conferencing • Electronic meeting
systems

77
working (collaborative authoring, application sharing, co-browsing, electronic whiteboard) as
well as social intelligence. Social networking is still considered as a newcomer in the
collaboration tools arena.
Group or community discussion
Exposure & feedback seeking
Knowledge sharing
Social translucence
Co-working Social intelligence
Live (synchronous)
Differed (asynch)
Differed Differed Live – Differed Live - Differed Differed
• Conference calls
• Video conferencing
• Web or data conferencing
• Electronic meeting systems
• Instant messaging
• Text messaging
• Online chat
• Virtual world
• Internet forums
• Discussion boards
• Community blogging
• Group blogging
• Micro-blogging
• Shared calendar
• Video publishing
• Photo publishing
• Event and task scheduling
• Polling
• eSurvey
• Document sharing
• Tagsonomy
• Revision control or document review
• Knowledge management systems
• Shared workspaces
• Shared links
• People-concepts networking
• Presence awareness
• Contextual awareness
• Expectation awareness
• Activity awareness
• Event awareness
• Travelling awareness
• Co-editing (wikis, online spreadsheet, text editing & presentation)
• Application sharing
• Co-browsing
• Electronic whiteboard
• Social networking
• Self coordination
• Community tagging
• Community bookmarking
• Collaborative searching
• Community annotating
• Community notification
Table 2.5: A proposed classification of collaboration tools
Many studies on collaboration technology and tools report e-mail overuse (around 70%
of people collaboration is still based on e-mail exchange). While these studies fail to identify a
reasonable explanation, a testimony blog entry from Jim McGee11 provides an interesting
comment, confirming that e-mail is the lowest common denominator tool for supporting
collaboration:
Most organizations still operate on the notion that the corporate network is a
fortress to be protected. This makes my life difficult from two perspectives. First, 11 2005 Jim McGee Extreme mobility and knowledge work effectiveness
http://www.mcgeesmusings.net/2003/07/13.html#a3512
78
getting into my own network is more difficult than I would like from my selfish,
time-pressed, user perspective. Second, when I am with clients, my effectiveness is
compromised by the hurdles I have to negotiate to get access to material on their
networks. Email becomes the lowest common denominator for coordinating work
and the impacts on knowledge work effectiveness are invisible to the
organization. Extra hours that I work to cope with these limits don't show up
anywhere in the reporting systems.
However, in the case of mass collaboration where people use wikis (e.g Wikipedia), e-
mail and other synchronous tools become useless because page history and discussion are
directly integrated into the wiki applications. In this study, group blogging is expected to
significantly decrease the number of e-mails exchanged among team members. All the
participants were able to write blog entries about project activities and personal feelings that
could be read and commented on by all team members. This constitutes a kind of ‘project
history’ that could be browsed afterwards when looking for explanations about specific situations
and decisions taken. It also constitutes a remarkable instrument for deeper ethnographic studies,
as it leaves a permanent trace of the project activities and of individuals’ feelings.
2.12 Gaps in Existing Literature
The missing holistic view of all distance types and factors (see Figure 2.7) affecting
collaboration effectiveness and efficiency constitutes the most important gap in the existing
literature. As a result of this lack, it is not possible to disentangle all factors in order to better
understand their interrelationships. Furthermore, the conceptual ambiguity among different
concepts used in the literature does not facilitate the task of identifying the different types of
distance and their respective roles. Finally, the absence of a holistic model of collaborative
distance inhibits any willingness to compare findings, according to their specific research
methodology, among the published case studies. The needed holistic model would facilitate
79
study of the potential capacity of new practices and new tools for compressing or bridging
distances.
However, one of the aforementioned papers related to proximity in collaboration does
address this aspect of a broader view in a specific domain of application, Inter-Enterprise
Collaboration (IEC), and attempts to disentangle relevant factors. Knoben and Oerlemans’
(2006) conceptual approach to the dimensions is still based on too many levels, hindering any
real attempt to better understand or clarify relationships among all factors.
Regarding literature related to mutual, shared or common understanding, there is very
little research exploring the role of distance factors in affecting the way collaborating individuals
reach a mutual understanding. This confirms the existence of a gap in mutual understanding
models, where relationships with distance factors appear sufficient for better comprehension.
Interestingly, social interaction is often mentioned in the literature, without any
explanation of its link to the ability to reach a mutual understanding leading to new knowledge.
When, in 1955, Luft and Ingham developed the well-known ‘Johari Window’ to explain
interpersonal communication and development of relationships, a model of social interaction was
lacking.
2.13 A Holistic View and Model on Collaborative Distance
Collaborative distance is a complex phenomenon and a paradox. It is like a coin with two
sides, each bringing both positive and negative effects. On the one side, while some distance
types provide opportunities to increase overall productivity and decrease lead time, others (or
even the same ones) contribute to decreasing collaboration effectiveness and efficiency. For
example, temporal distance could result from an extension of daily work to 24 hours by engaging
teams located on different geographical sites around the world. A second example, cultural
distance, increases the teams’ diversity, enhancing the creativity and innovativeness potential
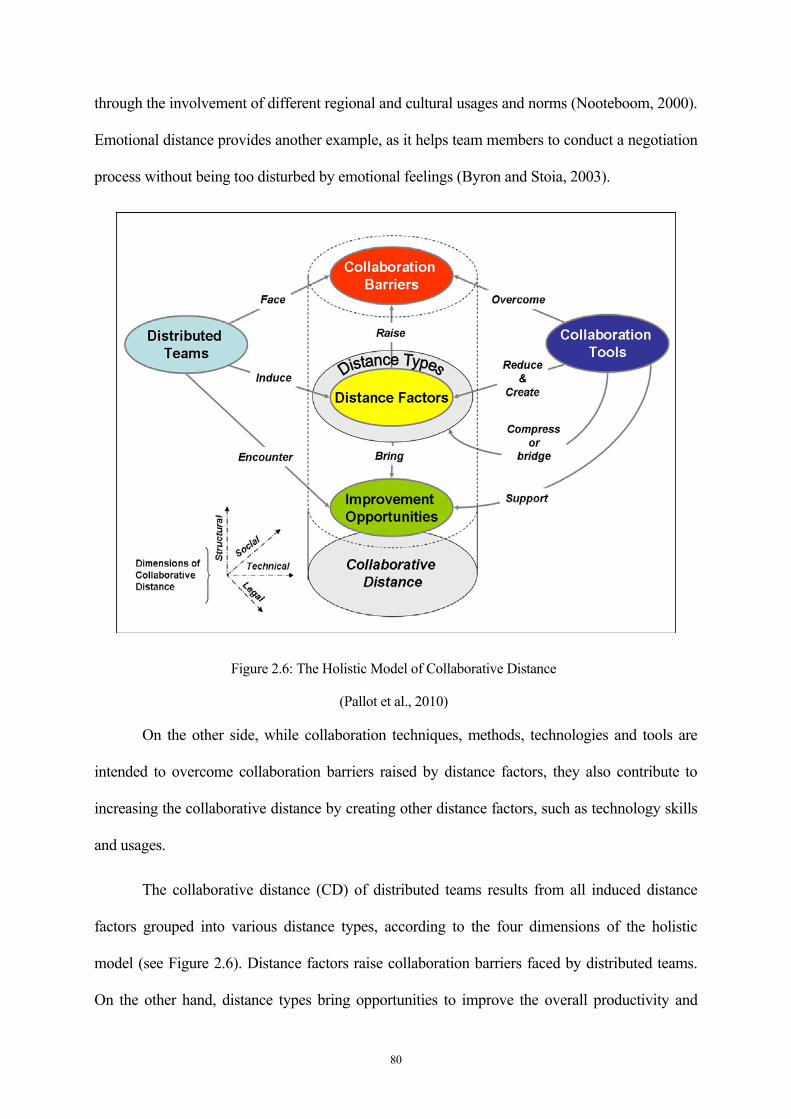
80
through the involvement of different regional and cultural usages and norms (Nooteboom, 2000).
Emotional distance provides another example, as it helps team members to conduct a negotiation
process without being too disturbed by emotional feelings (Byron and Stoia, 2003).
Figure 2.6: The Holistic Model of Collaborative Distance
(Pallot et al., 2010)
On the other side, while collaboration techniques, methods, technologies and tools are
intended to overcome collaboration barriers raised by distance factors, they also contribute to
increasing the collaborative distance by creating other distance factors, such as technology skills
and usages.
The collaborative distance (CD) of distributed teams results from all induced distance
factors grouped into various distance types, according to the four dimensions of the holistic
model (see Figure 2.6). Distance factors raise collaboration barriers faced by distributed teams.
On the other hand, distance types bring opportunities to improve the overall productivity and
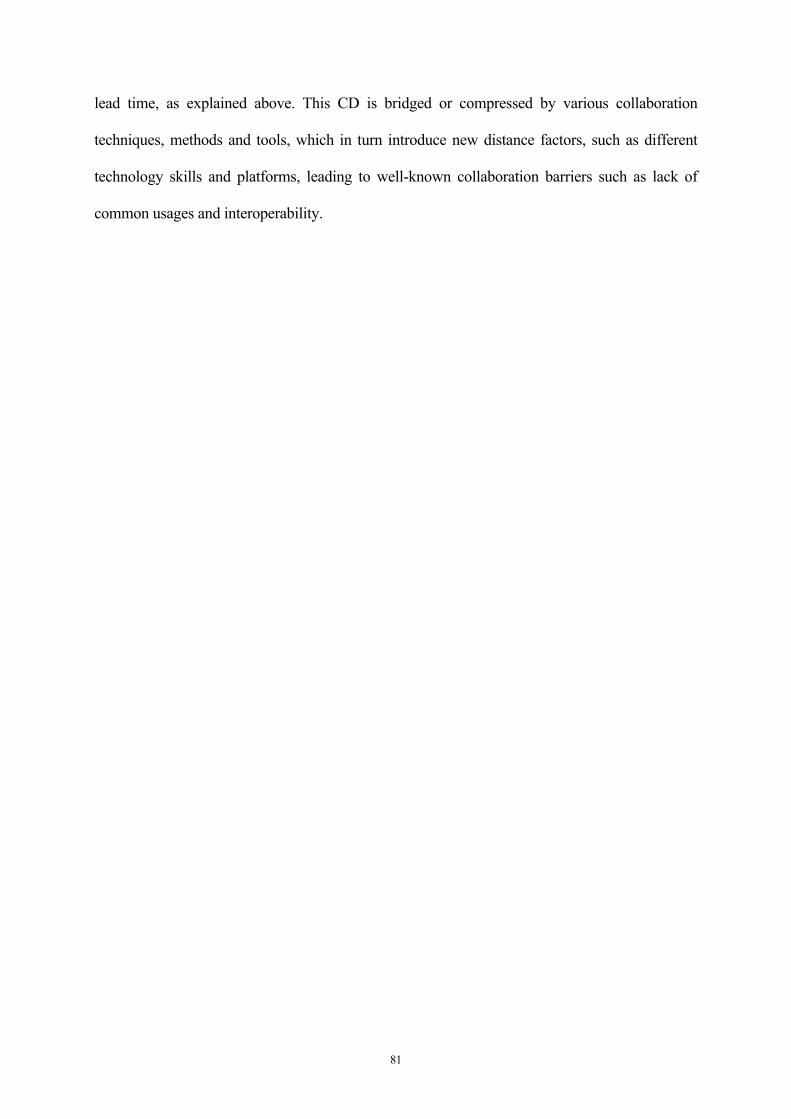
81
lead time, as explained above. This CD is bridged or compressed by various collaboration
techniques, methods and tools, which in turn introduce new distance factors, such as different
technology skills and platforms, leading to well-known collaboration barriers such as lack of
common usages and interoperability.
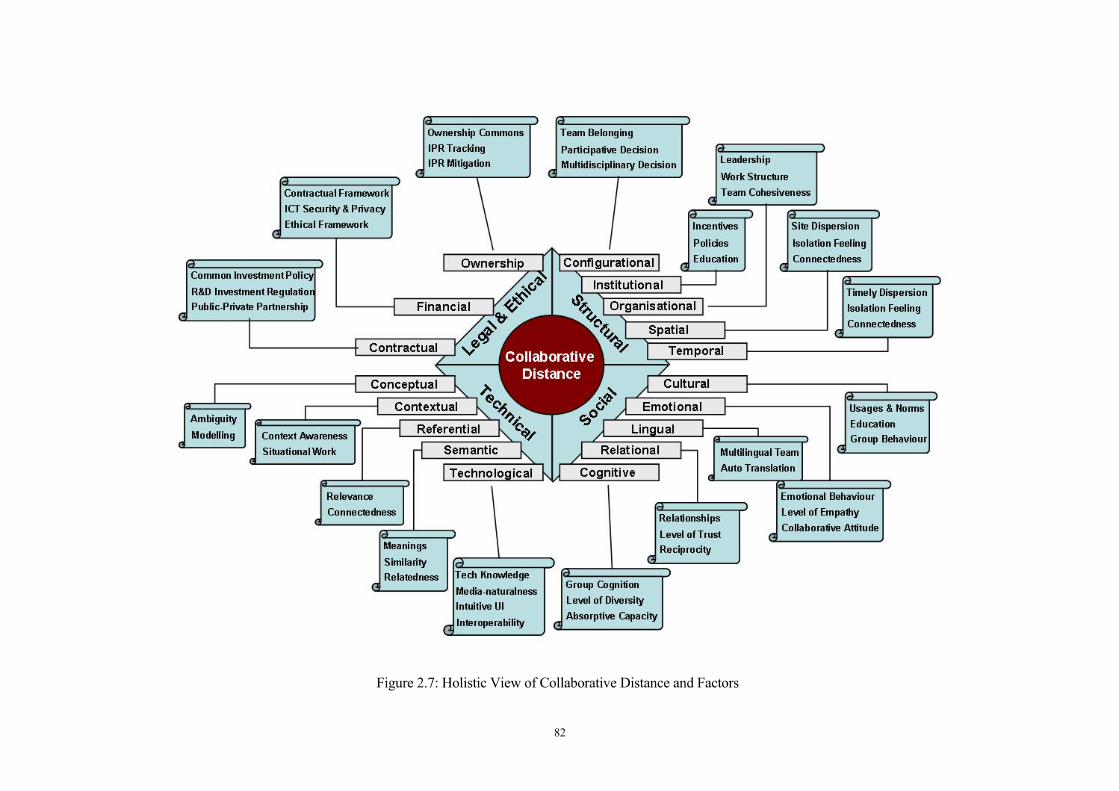
82
Figure 2.7: Holistic View of Collaborative Distance and Factors
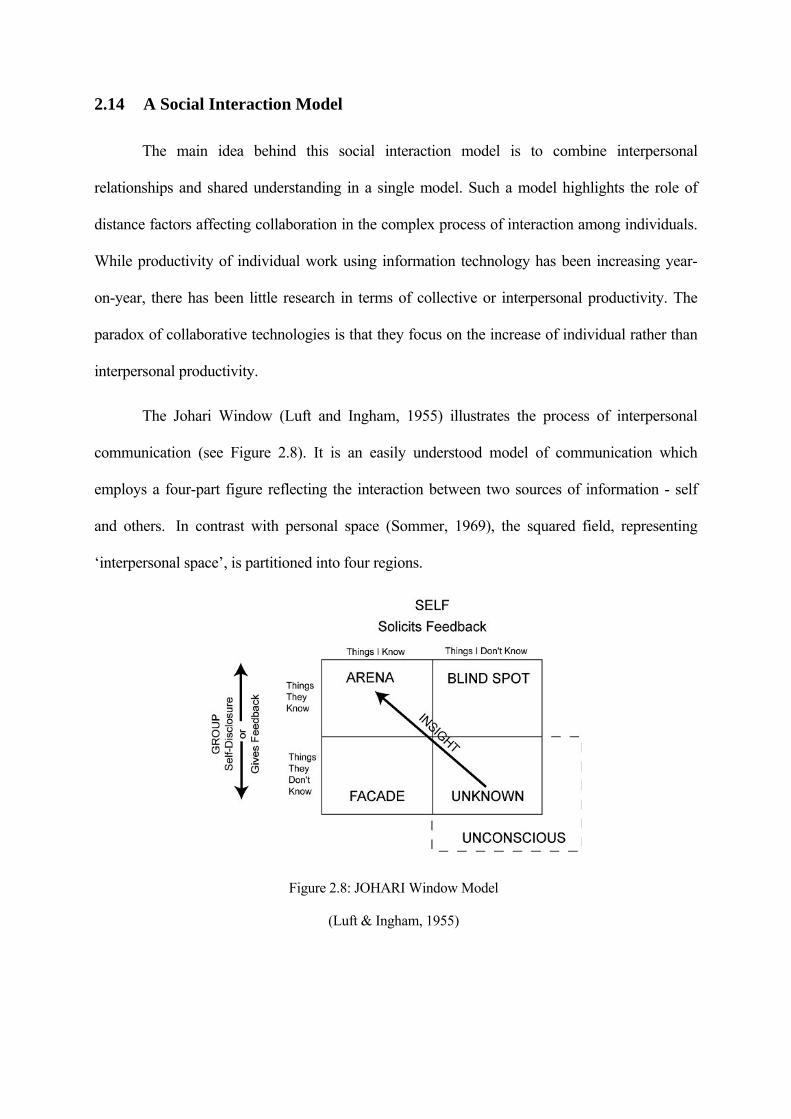
2.14 A Social Interaction Model
The main idea behind this social interaction model is to combine interpersonal
relationships and shared understanding in a single model. Such a model highlights the role of
distance factors affecting collaboration in the complex process of interaction among individuals.
While productivity of individual work using information technology has been increasing year-
on-year, there has been little research in terms of collective or interpersonal productivity. The
paradox of collaborative technologies is that they focus on the increase of individual rather than
interpersonal productivity.
The Johari Window (Luft and Ingham, 1955) illustrates the process of interpersonal
communication (see Figure 2.8). It is an easily understood model of communication which
employs a four-part figure reflecting the interaction between two sources of information - self
and others. In contrast with personal space (Sommer, 1969), the squared field, representing
‘interpersonal space’, is partitioned into four regions.
Figure 2.8: JOHARI Window Model
(Luft & Ingham, 1955)
84
The arena is the portion of the total interpersonal space devoted to mutual understanding
and shared information. This ‘known by the self - known by others’ facet of the relationship is
thought to control interpersonal productivity.
The assumption is that productivity and interpersonal effectiveness are directly related to
the amount of mutually-held information. Therefore, the larger the arena becomes, the more
rewarding, effective, and productive the relationship is apt to be. The arena can be thought of as
the place where good communication happens. As the size of this region increases, exposure and
feedback seeking also increase.
Figure 2.9 shows an adaptation of the Johari Window model in the age of the Internet,
Web and shared workspaces where eProfessional individuals, groups and communities have
the ability to expose and share their knowledge. This extended model, also called the on-line
Community Window Model, illustrates the process of Web enabled interpersonal
communication through the use of collaborative shared workspaces.
Figure 2.9: Extended JOHARI Window model
(Pallot et al., 2005)

85
This model, like the Johari, employs a four-part figure to reflect the interaction of two
sources of knowledge: self (the eProfessional characterised by his individual shared
workspace) and others (characterised by the group or community shared workspaces). The
size of the squared field, representing the arena, is increased by knowledge exposition into
two different regions. The dashed region represents the source of incremental innovation and
the solid filled region represents the source of breakthrough innovation (Pallot et al., 2005).
As argued in a previous paper, there has been almost no work done in the area of
interpersonal productivity (Pallot et al., 2006). Individual productivity is still considered as the
holy grail by industrial companies (Puybaraud, 2004, 2005), which do not consider social
interaction as a vital activity for a business organisation, even though social interaction has been
demonstrated as the source of knowledge creation (Nonaka & Takeuchi, 1995).
Figure 2.10 shows another potential use of the Johari Window model in its enhanced
form. An interesting aspect of this process for reaching a mutual understanding is the
confrontation among existing domains of knowledge from which new ideas and concepts
emerge. One may conclude that discussion among individuals confronting different knowledge
domains may lead to a kind of ‘instant learning’, increasing the space of mutual understanding –
the arena – and at the same time decreasing the unknown area. This unknown area, according to
the Johari Window model, resides in the unconscious of individuals. It could be deduced that
new ideas and concepts emerge from the unconscious to the conscious.
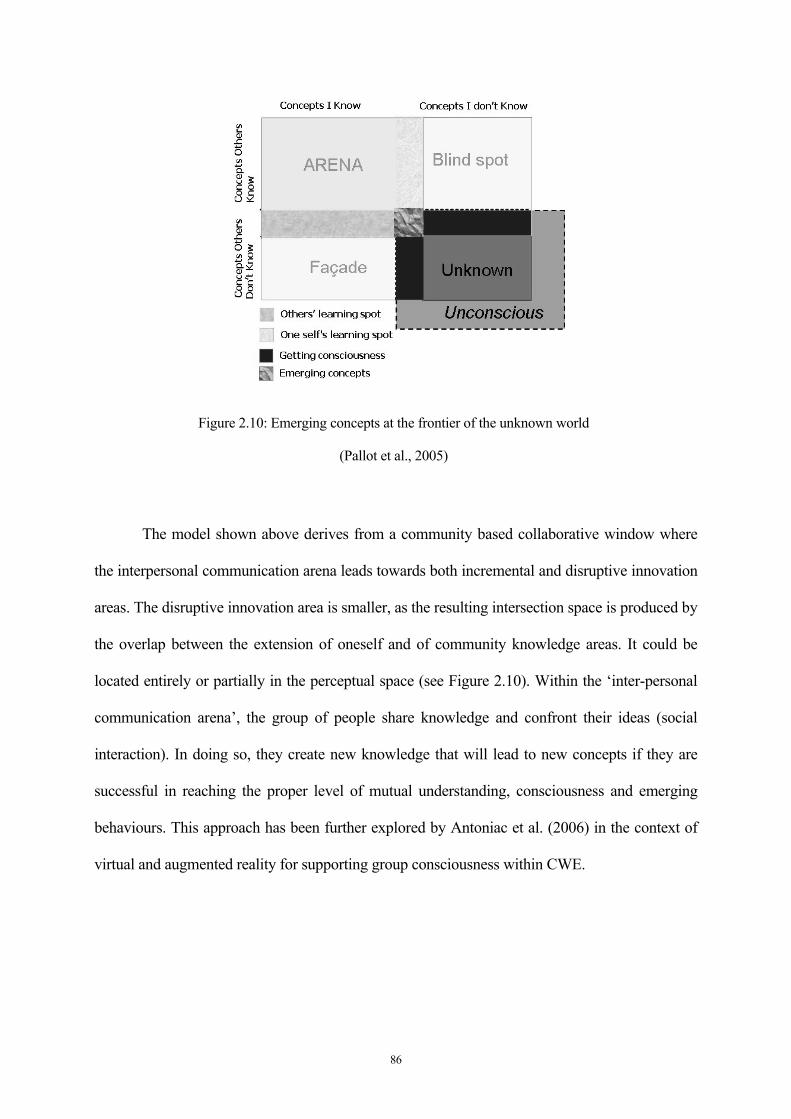
86
Figure 2.10: Emerging concepts at the frontier of the unknown world
(Pallot et al., 2005)
The model shown above derives from a community based collaborative window where
the interpersonal communication arena leads towards both incremental and disruptive innovation
areas. The disruptive innovation area is smaller, as the resulting intersection space is produced by
the overlap between the extension of oneself and of community knowledge areas. It could be
located entirely or partially in the perceptual space (see Figure 2.10). Within the ‘inter-personal
communication arena’, the group of people share knowledge and confront their ideas (social
interaction). In doing so, they create new knowledge that will lead to new concepts if they are
successful in reaching the proper level of mutual understanding, consciousness and emerging
behaviours. This approach has been further explored by Antoniac et al. (2006) in the context of
virtual and augmented reality for supporting group consciousness within CWE.
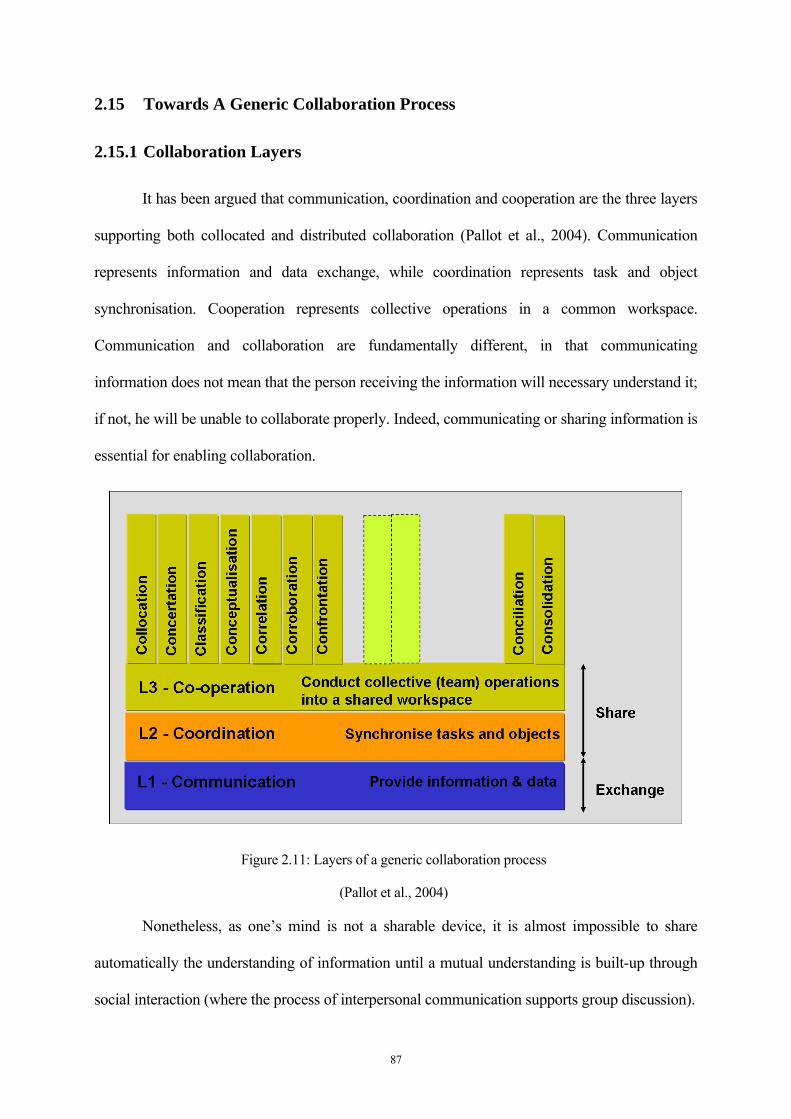
87
2.15 Towards A Generic Collaboration Process
2.15.1 Collaboration Layers
It has been argued that communication, coordination and cooperation are the three layers
supporting both collocated and distributed collaboration (Pallot et al., 2004). Communication
represents information and data exchange, while coordination represents task and object
synchronisation. Cooperation represents collective operations in a common workspace.
Communication and collaboration are fundamentally different, in that communicating
information does not mean that the person receiving the information will necessary understand it;
if not, he will be unable to collaborate properly. Indeed, communicating or sharing information is
essential for enabling collaboration.
Figure 2.11: Layers of a generic collaboration process
(Pallot et al., 2004)
Nonetheless, as one’s mind is not a sharable device, it is almost impossible to share
automatically the understanding of information until a mutual understanding is built-up through
social interaction (where the process of interpersonal communication supports group discussion).
88
Interestingly, the above Figure 2.11 shows not only the three layers of collaboration, but
also the activities that need to be conducted for collaborating, as follow:
• Collocation: group members are either physically or virtually collocated into a shared
workspace for promoting social interaction. Shared workspaces, either physical or
virtual, behave as social innovation spaces.
• Concertation: a shared workspace is used for sharing explicit as well as tacit knowledge
(e.g. chat among group members).
• Classification: expressed knowledge is then classified by group members. This
classification becomes a specific new knowledge created and shared by the group.
• Conceptualisation: new ideas and knowledge are formalised into construct or artefact
design. This illustrates the emergence behaviour in a group where new ideas and new
concepts are born.
• Correlation: interrelationships among new concepts are evaluated for building a mutual
understanding.
• Corroboration: relationships between new concepts and existing knowledge are
evaluated.
• Confrontation: new concepts in the context of other expertise (e.g. the potential adoption
of new artefacts by users) are evaluated.
2.15.2 Shared Workspace
Gutwin and Greenberg (1999) state that in the real
world, a shared workspace is a physical space where people
can undertake tasks as a group. For example, a classroom is a
workspace where teachers and students carry out the learning
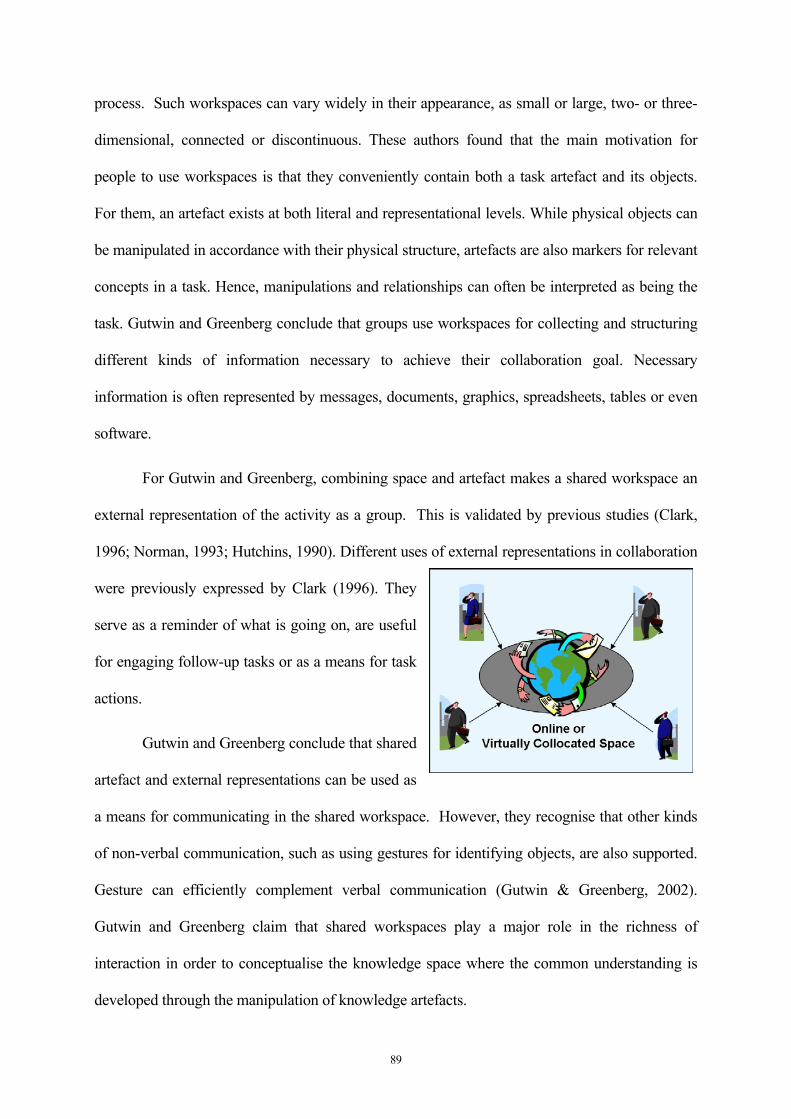
89
process. Such workspaces can vary widely in their appearance, as small or large, two- or three-
dimensional, connected or discontinuous. These authors found that the main motivation for
people to use workspaces is that they conveniently contain both a task artefact and its objects.
For them, an artefact exists at both literal and representational levels. While physical objects can
be manipulated in accordance with their physical structure, artefacts are also markers for relevant
concepts in a task. Hence, manipulations and relationships can often be interpreted as being the
task. Gutwin and Greenberg conclude that groups use workspaces for collecting and structuring
different kinds of information necessary to achieve their collaboration goal. Necessary
information is often represented by messages, documents, graphics, spreadsheets, tables or even
software.
For Gutwin and Greenberg, combining space and artefact makes a shared workspace an
external representation of the activity as a group. This is validated by previous studies (Clark,
1996; Norman, 1993; Hutchins, 1990). Different uses of external representations in collaboration
were previously expressed by Clark (1996). They
serve as a reminder of what is going on, are useful
for engaging follow-up tasks or as a means for task
actions.
Gutwin and Greenberg conclude that shared
artefact and external representations can be used as
a means for communicating in the shared workspace. However, they recognise that other kinds
of non-verbal communication, such as using gestures for identifying objects, are also supported.
Gesture can efficiently complement verbal communication (Gutwin & Greenberg, 2002).
Gutwin and Greenberg claim that shared workspaces play a major role in the richness of
interaction in order to conceptualise the knowledge space where the common understanding is
developed through the manipulation of knowledge artefacts.
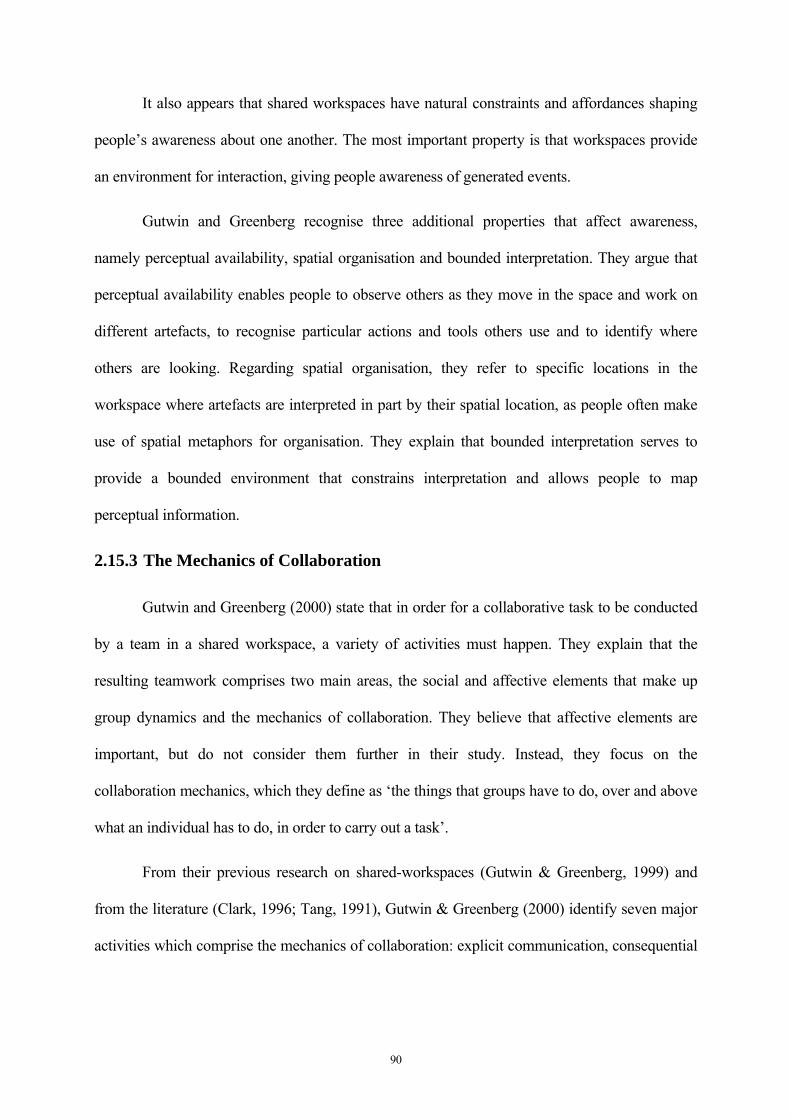
90
It also appears that shared workspaces have natural constraints and affordances shaping
people’s awareness about one another. The most important property is that workspaces provide
an environment for interaction, giving people awareness of generated events.
Gutwin and Greenberg recognise three additional properties that affect awareness,
namely perceptual availability, spatial organisation and bounded interpretation. They argue that
perceptual availability enables people to observe others as they move in the space and work on
different artefacts, to recognise particular actions and tools others use and to identify where
others are looking. Regarding spatial organisation, they refer to specific locations in the
workspace where artefacts are interpreted in part by their spatial location, as people often make
use of spatial metaphors for organisation. They explain that bounded interpretation serves to
provide a bounded environment that constrains interpretation and allows people to map
perceptual information.
2.15.3 The Mechanics of Collaboration
Gutwin and Greenberg (2000) state that in order for a collaborative task to be conducted
by a team in a shared workspace, a variety of activities must happen. They explain that the
resulting teamwork comprises two main areas, the social and affective elements that make up
group dynamics and the mechanics of collaboration. They believe that affective elements are
important, but do not consider them further in their study. Instead, they focus on the
collaboration mechanics, which they define as ‘the things that groups have to do, over and above
what an individual has to do, in order to carry out a task’.
From their previous research on shared-workspaces (Gutwin & Greenberg, 1999) and
from the literature (Clark, 1996; Tang, 1991), Gutwin & Greenberg (2000) identify seven major
activities which comprise the mechanics of collaboration: explicit communication, consequential
91
communication, coordination of action, planning, monitoring and gathering information,
assistance and protection.
Explicit communication occurs when group members intentionally provide each other
with information, as verbal and written communication is a cornerstone of collaboration. As for
consequential communication (Segal, 1995), Gutwin and Greenberg found that as they go about
their activities people unintentionally provide information which is complementary to explicit
communication. In terms of coordination of action, they explain that people organise their
actions in a shared workspace in order to avoid any conflict with others. Furthermore, people
learn to predict others’ actions in order to achieve effective and efficient collaboration. They
recognise that some planning activities are too high-level to be considered mechanics of
collaboration.
Gutwin and Greenberg claim that many of the other activities of collaboration mechanics
rely on the ability to monitor and gather information about other participants in the workspace.
Much of this information is simply workspace awareness information (Gutwin & Greenberg,
2000), helping to answer the following questions: Who is in the workspace? Where are they
working? What are they currently doing?
Figure 2.12: Logical view of the collaboration mechanics
92
Group members provide assistance to one another when needed as a kind of solidarity
behaviour (Gutwin & Greenberg, 2000). However, to be appropriate, any assistance requires that
one understands what others are doing and where they are at in their tasks. In terms of protection,
the traditional danger in group work is to inadvertently alter or destroy work carried out by one
another.
Roschelle (1992) claimed that building a mutual understanding that is based on shared
meaning is the essence of collaboration. In this study on conceptual change, Roschelle presented
a particular stance on the role of collaboration, having in common with contemporary cognitive
theory an emphasis on the restructuring of common-sense metaphors. However, it differed from
that theory in taking the view that meanings are relational and that collaboration provides a
mechanism for achieving convergent relational meanings. Roschelle stated that convergent
conceptual change is achieved incrementally, interactively, and socially through collaborative
participation in joint activity. He also drew attention to the process of mutually contributing to
shared knowledge, whereas conceptual convergence emphasises mutual construction of
understanding. Hence, we drafted a logical view of the collaboration mechanics as shown in
Figure 2.12.
2.15.4 Collaboration Process Model
The collaboration process model presented in the Figure 2.13 is based on the building of
a mutual understanding which starts by sharing knowledge and ends by creating new knowledge.
There are two side activities: enlarging the interaction arena in exposing and seeking feedback
from the group (online Johari Window), and gaining consciousness of emerging ideas and
concepts through the intersection of frontier objects.
This conceptual approach demonstrates that collaborative distance factors impede mutual
understanding by interfering in one or several activities of the collaboration mechanics. The

93
ultimate goal is to demonstrate that all distance factors operate within the context of a shared
workspace regardless of its nature, whether physical or virtual or a mix of both. The well-known
geographical distance and lesser known temporal distance are just the tip of the iceberg. Ideally,
mapping of the distance factors with the above mentioned activities of the generic collaboration
process would help to improve understanding of how to overcome distance factors to achieve a
higher level of collaboration performance.
Figure 2.13: Integrating collaboration process and mechanics
2.16 Propositions
A number of issues need to be investigated during this empirical study with regard to
increasing the level of knowledge on:
• The impact of distance factors on the ability to reach a mutual understanding;
94
• The use of collaboration techniques, methods and tools (collaboration
technology) to bridge distances and to enable mutual understanding and
shared knowledge;
• The role of mutual understanding in the collaboration mechanics and increase
of collaboration performance;
• The role of trust among group members in enabling shared knowledge and
mutual understanding.
All these issues are related to the research questions, specifically addressing the
correlations between the above mentioned aspects that lead to the following propositions:
Proposition 1: Collaboration performance is decreased by distance factors due to the fact that it
takes more time and effort to reach a certain level of mutual understanding.
With more distance factors, it becomes more demanding and takes longer to reach a mutual
understanding, implying lower collaboration effectiveness and efficiency, leading to lower
project performance12.
Proposition 2: Knowledge sharing is increased by the use of collaboration techniques, methods
and tools (collaboration technology) that contribute to overcoming or compressing collaboration
barriers raised by distance factors.
The more collaboration techniques, methods and tools are used to overcome distance factors, the
faster and less demanding it will be to reach a mutual understanding.
Proposition 3: Collaboration performance is increased by the use of collaboration techniques,
methods and tools that contribute to overcoming collaboration barriers raised by distance factors.
12 Comparing realised achievements within a fixed duration, where it is assumed that an individual alone will not obtain the same level of achievements as will a group.
95
This implies higher collaboration effectiveness and efficiency, leading to higher project
performance.
Proposition 4: Roschelle & Teasley (1995) claim that reaching a mutual understanding based
on a shared meaning is the essence of collaboration. According to Roschelle (1992): ‘The
essence of collaboration is the construction of shared meanings for conversations, concepts, and
experiences.’ With the developed model of a generic collaboration process (Pallot et al., 2008)
and extended JOHARI Window model (Pallot, 2007), one can increase the size of the arena (area
of interpersonal interaction) by exposing and requesting feedback, resulting in a more productive
interpersonal relationship. Consequently, collaboration performance is higher when mutual
understanding is broader. This depends on the level of trust among group members.
Proposition 5: The broader the mutual understanding, the higher the level of trust among group
members. Reciprocally, the higher the level of trust among group members, the broader the
mutual understanding.
2.17 Summary
Because of the impressive number of distance types, there is a plethora of collaborative
tools used to support online collaboration. However, identifying the frontiers among
communication tools (e.g. telephony, VoIP, e-mailing, IM), coordination tools (e.g. shared
agenda, workflow) and cooperation tools (Shared Workspace) is not straightforward. It has been
argued that communication (information & data exchange), coordination (task & object
synchronisation) and cooperation (collective operations in a common workspace) comprise the
three layers of either collocated or distributed collaboration (Pallot et al., 2004). Some tools,
such as Shared Workspace (e.g. BSCW, SharePoint), cover several layers through embedded
communication features (e.g. event notification) and coordination features to synchronise objects
96
(e.g. object upload & download, versioning, history). Some have cooperation features which
synchronise tasks and online collocation of workspace members (e.g. presence), as well as
concertation (e.g. group blogging, polling) and classification features (e.g. object tagging). Even
so, it is necessary to use other tools such as Web-conferencing and instant messaging (IM) for
synchronous communication, and e-mailing for asynchronous communication. Furthermore,
whatever features are integrated into a Shared Workspace tool, not everyone will necessarily use
the same set of features and tools. Hence, the personalisation and interoperability within the
technological distance is of paramount importance.
In this section, the need for clarification of concepts used to represent factors and group
them into valid classes was discussed. This led to the design of the Collaborative Distance
Framework (CDF), which disentangles these distance factors. Hence we were able to categorise
previous published empirical studies on distance factors and concurrently to foresee how an
existing or emerging concept and related artefact could bridge a specific collaboration distance
type. Identifying interrelationships among the different factors and foreseeing their respective
impact would make this CDF even more valuable.
As mentioned in the literature review, individuals entering into collaboration face a kind
of paradox. On the one hand, close proximity among team members speeds up the process
towards reaching a mutual understanding, but on the other hand, it simultaneously reduces
creativity (Sternberg, 1988) and innovation due to a lower level of diversity. It has been observed
that a higher diversity level means spending much more time reaching a proper level of mutual
understanding, while enabling an effective collaborative innovation.
97
Chapter 3. Methodology
I f I h a v e s e e n f a r t h e r t h a n o t h e r s , i t i s b e c a u s e I
w a s s t a n d i n g o n t h e s h o u l d e r s o f g i a n t s . – A l b e r t
E i n s t e i n
This chapter introduces the research strategy and compares various research methods that
could be used in this empirical study on collaborative distance. The selected survey and
comparative case study, including focus group interviews and log data, are combined into a
triangulated research approach. The chapter also presents the selected group work performance
model (IPO), which is turned into an efficiency and effectiveness collaboration performance
model on the basis of IDEF0 functional activity modelling. Finally, the observation model and
platform are depicted.
98
3.1 Introduction
This empirical study on Collaborative Distance in Open Innovation (Chesbrough, 2003),
intends to restrict the number of variables in play during the comparative cases, as previously
explained in the research strategy. All comparative cases are dedicated to the observation of
various distance types and collaboration barriers raised by distance factors, and the ways in
which they are bridged or compressed by collaboration technology within projects on
collaborative innovation (Ahuja, 2000) involving different disciplines and stakeholders (e.g.
external experts, customers).
Furthermore, all subject types of the 14 project cases constituting the comparative case
study were dedicated to the same topic of collaborative innovation, in order to avoid the
introduction of variables related to the nature of the projects (for example comparing a project
dedicated to Front End Innovation with other projects dedicated to software development, design
in architecture, design engineering or manufacturing engineering). The research strategy also
included evaluation of the ‘boundary objects’ theory (Star & Griesemer, 1989), exploring the
potential impact of applying shared practices across all project cases, to determine whether the
impact is constant across all cases. Finally, another research objective was to evaluate the impact
on bridging various distance types when all project cases used a shared project model, based on a
combination of SADT (Structured Analysis Design Technique) (Ross & Schoman, 1976),
IDEF0 (Integrated Definition for Function Modelling) (Ross, 1985; 1989), OBS (Organisational
Breakdown Structure) and WBS (Work Breakdown Structure) techniques.
Research questions and issues to be investigated were formulated in a manner that led
naturally to the design of a triangulated research approach comprising qualitative and
quantitative methodologies. The qualitative part is intended for the observation of distance
factors affecting collaboration performance within 14 comparative cases and the corresponding

99
focus group interviews, as well as the related log data. The quantitative part is intended to
provide indications on the perceived effect of collaboration barriers raised by distance factors.
Figure 3.1 below illustrates the analysis and research approach from initial propositions to re-
visited propositions.
Figure 3.1: Triangulated Research Approach
For many years now there has been an ongoing debate among researchers within the
social sciences concerning the best methods for science to use to research society. Typically, this
debate focuses on which of two methodologies is the more appropriate. Quantitative research
aims to collect facts and figures using methods such as social surveys or statistical analysis,
while quantitative methods translate data into information.
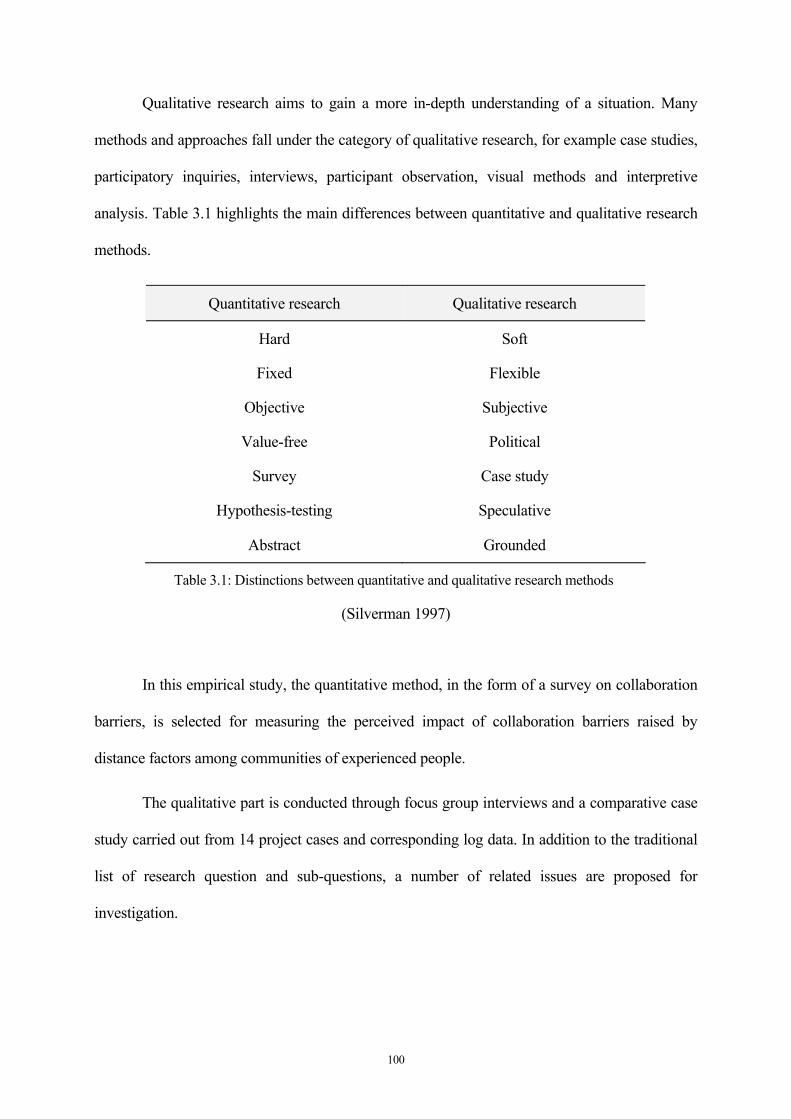
100
Qualitative research aims to gain a more in-depth understanding of a situation. Many
methods and approaches fall under the category of qualitative research, for example case studies,
participatory inquiries, interviews, participant observation, visual methods and interpretive
analysis. Table 3.1 highlights the main differences between quantitative and qualitative research
methods.
Quantitative research Qualitative research
Hard Soft
Fixed Flexible
Objective Subjective
Value-free Political
Survey Case study
Hypothesis-testing Speculative
Abstract Grounded
Table 3.1: Distinctions between quantitative and qualitative research methods
(Silverman 1997)
In this empirical study, the quantitative method, in the form of a survey on collaboration
barriers, is selected for measuring the perceived impact of collaboration barriers raised by
distance factors among communities of experienced people.
The qualitative part is conducted through focus group interviews and a comparative case
study carried out from 14 project cases and corresponding log data. In addition to the traditional
list of research question and sub-questions, a number of related issues are proposed for
investigation.
101
3.2 Methodology Review
3.2.1 Quantitative Methodology
Quantitative research, primarily concerned with objectivity, seeks to achieve
explanations and predications that one can generalise in other circumstances and settings
(Maxim, 1999). Rigid sampling strategies, combined with identifiable variables and measurable
relationships, form the data collection process and make it possible to obtain results that can be
generalised (Thompson, 1992). Based on the ontological assumption that the social reality is
independent of human minds, the role of the quantitative researcher is to obtain scientific
knowledge through observing and measuring objective reality (Phillips, 1987). Various methods,
such as surveys, experiments, inventories and demographic analyses, are employed to produce
quantitative data, on the basis of which correlations between defined variables can be established
(Griffin & Kacmar, 1991).
3.2.2 Qualitative Methodology
By contrast, qualitative research aims to explore, investigate and understand phenomena
that are socially constructed, complex and indivisible, into discrete variables. The aim of
qualitative research is not to measure and predict the studied phenomena, but to interpret the
social actor’s perception of the meanings embedded within the social settings (Sackmann, 1992).
Qualitative research, by focusing on the unfolding of the process rather than the structure, is
broader and more holistic than quantitative research (Das, 1983). Furthermore, qualitative
research often uses case studies as its preferred method of study, in contrast to the surveys and
experiments of quantitative research (Bryman & Burgess, 1999).
As explained above, this research does not seek to test or measure the relationship
between the chosen phenomena or to offer any predictions. Rather, it aims to understand how
teams interact within different cultural contexts. In other words, it follows the principles of
102
the social construction perspective (Glaser & Strauss 1967). In the light of these research
objectives, qualitative rather than quantitative methods are clearly appropriate here.
Questionnaires are a particularly valuable method, as they allow the collection of data
from large numbers of people. Questionnaires are particularly useful for finding out about the
incidence of some behaviour or the opinions, beliefs or attitudes of large numbers of groups
of people. According to Hoinville and Jowell, a questionnaire has to help engage people’s
interest, encouraging their cooperation and eliciting answers as close as possible to the truth
(Hoinville & Jowell 1978).
Focus Group Interviews in Qualitative Research
Focus group interviews (FGI) are commonly included in a triangulated research approach
in order to introduce a qualitative side. Stewart and Shamdasani (1990) provide the following list
of FGI applications:
Obtaining general background information about a topic of interest;
Generating research hypotheses that can be submitted to further research and testing
using more quantitative approaches;
Stimulating new ideas and creative concepts;
Diagnosing the potential for problems with a new program, service or product;
Generating impressions of products, programs, services, institutions, or other objects of
interest;
Learning how respondents talk about the phenomenon of interest, which may facilitate
quantitative research tools;
Interpreting previously obtained qualitative results.
FGIs are essential in the evaluation process as part of a needs assessment in order to
gather perceptions as to the outcome. They could be conducted during, at the end or even months
after the completion of a program.
A group size of a minimum of four to a maximum of twelve participants is
recommended, while the number of groups is dependant on the population segments. Questions
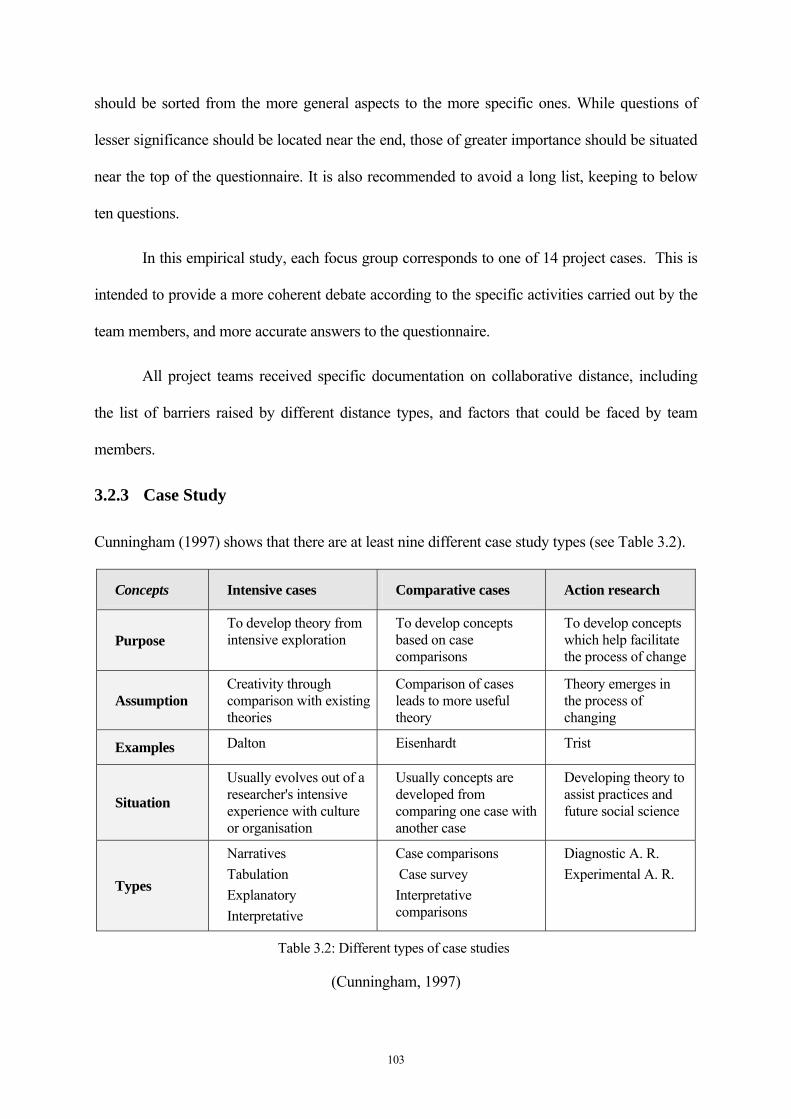
103
should be sorted from the more general aspects to the more specific ones. While questions of
lesser significance should be located near the end, those of greater importance should be situated
near the top of the questionnaire. It is also recommended to avoid a long list, keeping to below
ten questions.
In this empirical study, each focus group corresponds to one of 14 project cases. This is
intended to provide a more coherent debate according to the specific activities carried out by the
team members, and more accurate answers to the questionnaire.
All project teams received specific documentation on collaborative distance, including
the list of barriers raised by different distance types, and factors that could be faced by team
members.
3.2.3 Case Study
Cunningham (1997) shows that there are at least nine different case study types (see Table 3.2).
Concepts Intensive cases Comparative cases Action research
Purpose To develop theory from intensive exploration
To develop concepts based on case comparisons
To develop concepts which help facilitate the process of change
Assumption Creativity through comparison with existing theories
Comparison of cases leads to more useful theory
Theory emerges in the process of changing
Examples Dalton Eisenhardt Trist
Situation Usually evolves out of a researcher's intensive experience with culture or organisation
Usually concepts are developed from comparing one case with another case
Developing theory to assist practices and future social science
Types
Narratives Tabulation Explanatory Interpretative
Case comparisons Case survey Interpretative comparisons
Diagnostic A. R. Experimental A. R.
Table 3.2: Different types of case studies
(Cunningham, 1997)

104
Because there are case study types belonging to different research approach categories,
this method cannot be classified into only one class. Traditionally, the case study research
method has been classified into the theory-creating research approach. However, one can decide
to apply the comparative cases type for interpretative comparisons.
The question of whether there is a need to conduct a survey, carry out an experiment or
an observation, or even use a case study, shapes the research approach. The decision about which
methodology one should use is dependent on a number of factors, but most importantly, on the
type of questions posed (Langdridge, 2004). The research methods to be applied are usually
decided according to research situation, operational context, or sometimes even researchers’
interest.
In this empirical study, the selected type of case study is the ‘comparative cases’ type for
interpretative comparisons. The main goals are to evaluate and check the impact and consistency
of distance factors on collaboration performance across 14 project cases. In order to avoid the
introduction of variables polluting the comparative cases, all the project cases were to apply the
same collaboration techniques, methods and tools to support their teamwork. If project cases
apply different techniques, methods and tools, then the resulting observed differences in
collaboration performance among the different teams could be due to the use of a higher or lower
performing technique, method or tool.
3.2.4 Triangulated Research Methodology
This empirical study applies quantitative research through surveys dedicated to
people’s perception of the impact induced by various collaborative distance factors. It also
applies qualitative research through focus group interviews (FGI) and selected comparative
case study, providing a more accurate in-depth picture of what is happening during
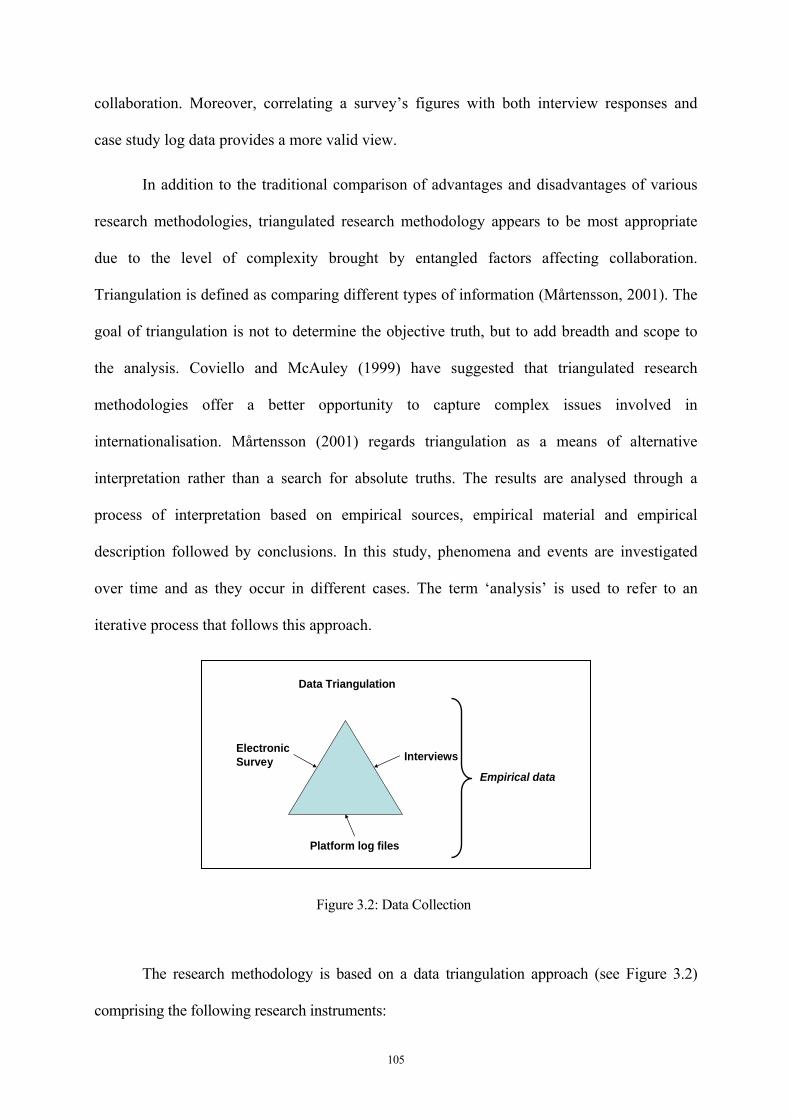
105
collaboration. Moreover, correlating a survey’s figures with both interview responses and
case study log data provides a more valid view.
In addition to the traditional comparison of advantages and disadvantages of various
research methodologies, triangulated research methodology appears to be most appropriate
due to the level of complexity brought by entangled factors affecting collaboration.
Triangulation is defined as comparing different types of information (Mårtensson, 2001). The
goal of triangulation is not to determine the objective truth, but to add breadth and scope to
the analysis. Coviello and McAuley (1999) have suggested that triangulated research
methodologies offer a better opportunity to capture complex issues involved in
internationalisation. Mårtensson (2001) regards triangulation as a means of alternative
interpretation rather than a search for absolute truths. The results are analysed through a
process of interpretation based on empirical sources, empirical material and empirical
description followed by conclusions. In this study, phenomena and events are investigated
over time and as they occur in different cases. The term ‘analysis’ is used to refer to an
iterative process that follows this approach.
Figure 3.2: Data Collection
The research methodology is based on a data triangulation approach (see Figure 3.2)
comprising the following research instruments:
Data Triangulation
ElectronicSurvey Interviews
Platform log files
Empirical data
106
1. Quantitative: Survey on collaboration barriers raised by distance factors (electronic
survey via a combination of several polls posted on a collaborative Web environment of
about 1500 community members).
2. Comparative case study (14 collaboration project cases). Collected data come from the
14 corresponding shared workspaces as a log file.
3. Qualitative: 14 FGIs of the 14 corresponding project teams.
3.2.5 Evaluating Project Team Performance
It is assumed that collaboration performance relies on the level of the project team’s
effectiveness and efficiency. While effectiveness is the ability to have high quality projects and
outputs, efficiency is the ability to perform project tasks well with a minimum resource level for
a maximum output (high productivity level). To be synthetic, effectiveness is about quality, and
efficiency is about productivity. Efficacy refers more to the ability to fulfil a request in due time,
without concern for the mobilised resources, methods and tools used or the quality of the project
and outcomes. Both effectiveness and efficiency are necessary for evaluating the performance of
project teams within the 14 comparative cases. Distance factors, identified during the literature
review, impact collaboration effectiveness and efficiency through raising collaboration barriers.
Collaboration technology (techniques, methods and tools) is intended to overcome the
collaboration barriers.
It should be noted here that there may be ambiguity in the use of terms such as ‘group’,
‘team’ and ‘project team’. A group assembling a few people (small group) could be considered
as a team, where all participants can easily interact with one another. By contrast, a group
assembling a lot of people (large group) is considered as a community, where all members
cannot interact with one another simply because there are too many members. One could argue
that a group of people does not necessarily form a team until they are trained to operate as a
107
team. The metaphor often employed is that of a sports team. Real life experience has shown that
a group of high performing individual players facing difficulties playing together often does not
outperform a group of lesser performing players operating with a great team spirit, where each
member sacrifices his own individual interest for the benefit of the team. In this empirical study,
a team is considered as a small group of project stakeholders where social interaction happens
among collaborating team members. By extension, a project team is a team of individuals whose
common goal is to collaborate in order to achieve project objectives. In this case, synchronous
interaction is the norm. By contrast, a very large group could lead to mass collaboration where
social interaction is rarely the norm due to the impossibility of interacting with all participants
(e.g. Wikipedia); hence it no longer constitutes a team, but rather a community of contributors.
Nonetheless, there could be collaborative authoring of Web pages where participants use the
discussion page to agree on content. In this case, asynchronous interaction is the norm.
Another interesting aspect is the discussion about comparing face-to-face collocation and
virtual collocation (Nardi & Whittaker, 2002). This discussion is, in effect, obsolete, because in
reality project teams are more and more based on a mixed mode of collocation (McDonough et
al., 2000; Malhotra et al., 2001; Gartner and MIT, 2001). While several of the members of a
project team could be physically collocated on a common geographic site, all other participants
might be in a distributed situation, operating from home, during travels, or in a remote situation
such as at a customer or supplier site.
Years ago, groups were necessarily physically collocated because project teams were
more effective and because before the Internet, computer networks were both undeveloped and
very expensive. Nonetheless, group performance in terms of effectiveness was already a research
topic for such prominent authors as McGrath (1964), and for Hackman & Morris (1975), who
adapted the work of McGrath to develop the famous ‘Input-Process-Output’ (IPO) model for
evaluating the performance effectiveness of a group. This model is the probable inspiration
108
behind Lipnack and Stamps’ (1997) description of ‘A System of Virtual Team Principles’,
illustrated by a matrix composed of ‘Inputs-Processes-Outputs’ on one side and ‘People-
Purpose-Links’ on the other. According to Lipnack and Stamps: ‘The principles of people,
purpose and links form a simple systems model of inputs, processes and outputs.’
The IPO model proposed by Hackman and Morris is a general paradigm for analysing
the role of group interaction process as a mediator of input-performance relationships, as shown
in Figure 3.3. They explain:
The fundamental assumption underlying the IPO model is that input factors affect
performance outcomes through the interaction process. Thus, if highly cohesive
groups (input at t1) perform better on some tasks (outcome at t2) than less-
cohesive groups, it should be possible to explain the performance difference by
examining the difference between the interaction processes of the high and the
low cohesive groups.
The concept ‘interaction process’ refers to all observable interpersonal behaviour
occurring between two arbitrary points in time mentioned in the figure as ‘t1’ and ‘t2’. Hackman
and Morris argue that: ‘The state of all system variables potentially may be assessed at any given
"slice" in time, and therefore input-output relationships may be examined for periods of time
ranging from a few seconds to a year or more.’
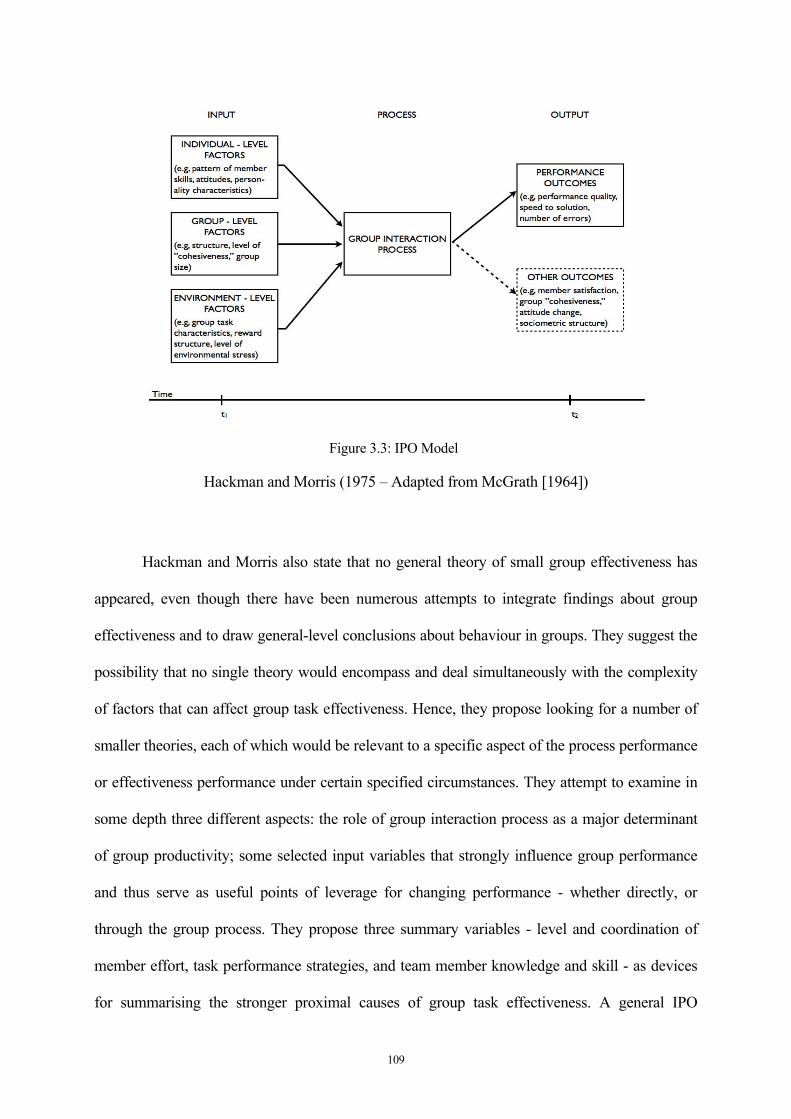
109
Figure 3.3: IPO Model
Hackman and Morris (1975 – Adapted from McGrath [1964])
Hackman and Morris also state that no general theory of small group effectiveness has
appeared, even though there have been numerous attempts to integrate findings about group
effectiveness and to draw general-level conclusions about behaviour in groups. They suggest the
possibility that no single theory would encompass and deal simultaneously with the complexity
of factors that can affect group task effectiveness. Hence, they propose looking for a number of
smaller theories, each of which would be relevant to a specific aspect of the process performance
or effectiveness performance under certain specified circumstances. They attempt to examine in
some depth three different aspects: the role of group interaction process as a major determinant
of group productivity; some selected input variables that strongly influence group performance
and thus serve as useful points of leverage for changing performance - whether directly, or
through the group process. They propose three summary variables - level and coordination of
member effort, task performance strategies, and team member knowledge and skill - as devices
for summarising the stronger proximal causes of group task effectiveness. A general IPO
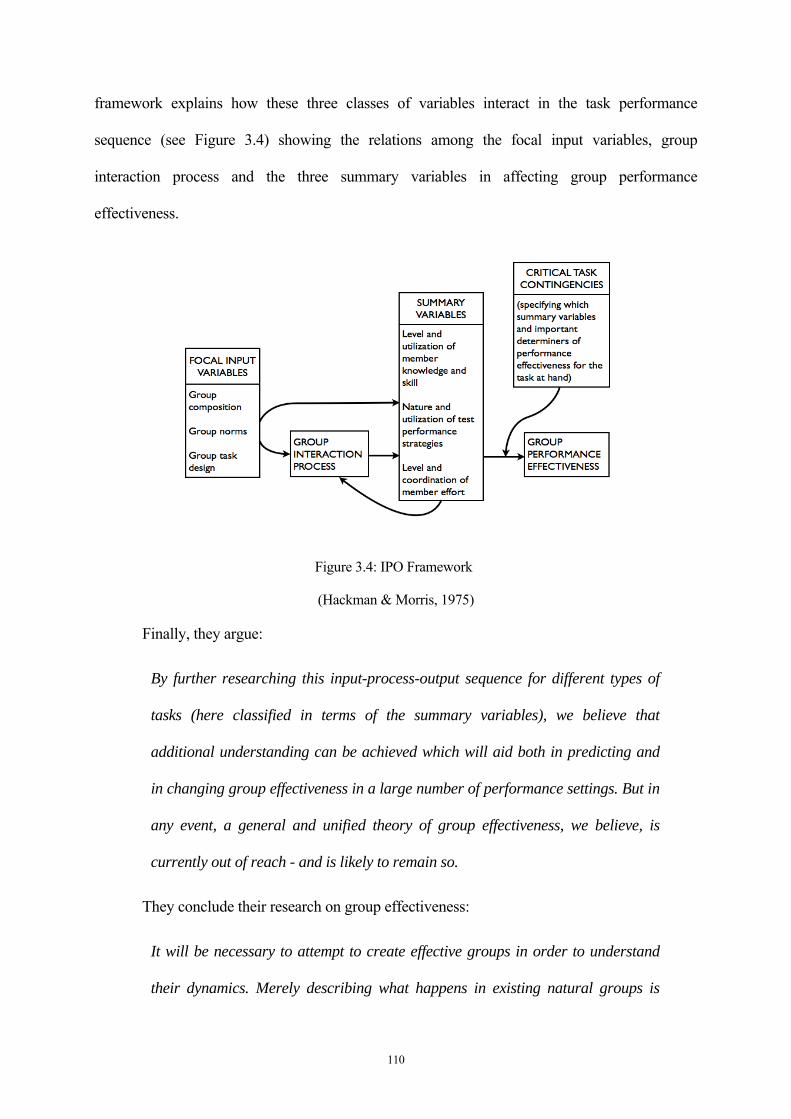
110
framework explains how these three classes of variables interact in the task performance
sequence (see Figure 3.4) showing the relations among the focal input variables, group
interaction process and the three summary variables in affecting group performance
effectiveness.
Figure 3.4: IPO Framework
(Hackman & Morris, 1975)
Finally, they argue:
By further researching this input-process-output sequence for different types of
tasks (here classified in terms of the summary variables), we believe that
additional understanding can be achieved which will aid both in predicting and
in changing group effectiveness in a large number of performance settings. But in
any event, a general and unified theory of group effectiveness, we believe, is
currently out of reach - and is likely to remain so.
They conclude their research on group effectiveness:
It will be necessary to attempt to create effective groups in order to understand
their dynamics. Merely describing what happens in existing natural groups is
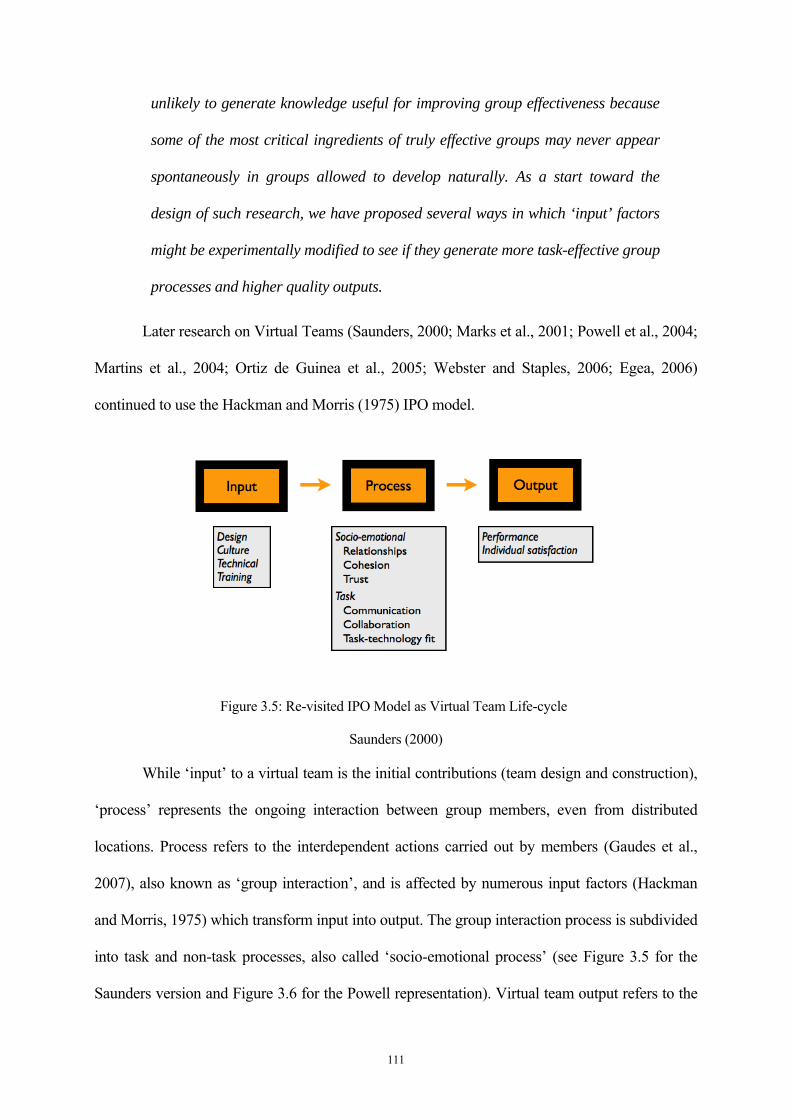
111
unlikely to generate knowledge useful for improving group effectiveness because
some of the most critical ingredients of truly effective groups may never appear
spontaneously in groups allowed to develop naturally. As a start toward the
design of such research, we have proposed several ways in which ‘input’ factors
might be experimentally modified to see if they generate more task-effective group
processes and higher quality outputs.
Later research on Virtual Teams (Saunders, 2000; Marks et al., 2001; Powell et al., 2004;
Martins et al., 2004; Ortiz de Guinea et al., 2005; Webster and Staples, 2006; Egea, 2006)
continued to use the Hackman and Morris (1975) IPO model.
Figure 3.5: Re-visited IPO Model as Virtual Team Life-cycle
Saunders (2000)
While ‘input’ to a virtual team is the initial contributions (team design and construction),
‘process’ represents the ongoing interaction between group members, even from distributed
locations. Process refers to the interdependent actions carried out by members (Gaudes et al.,
2007), also known as ‘group interaction’, and is affected by numerous input factors (Hackman
and Morris, 1975) which transform input into output. The group interaction process is subdivided
into task and non-task processes, also called ‘socio-emotional process’ (see Figure 3.5 for the
Saunders version and Figure 3.6 for the Powell representation). Virtual team output refers to the

112
consequences of a group’s collaboration as they relate to task (task process) and non-task (socio-
emotional process) items (Gaudes et al., 2007).
Figure 3.6: Re-visited IPO Model as ‘Focus of Early Virtual Team Research’
Powell et al. (2004)
Today, group performance effectiveness has evolved with the proliferation of mixed
collocation modes (face-to-face for physically collocated groups and virtual for distributed
groups) to the extent that the group interaction process should take this new situation into
account. In addition, collaboration technology is continuously evolving due to the rapid
worldwide propagation of social media and the huge penetration of the Internet, Web and smart
device technologies, which make tools and applications available whenever and wherever people
need them, for a very reasonable price.
While ten years ago it was still extremely difficult to build a relationship with people
working or living far away, today it is made simple by using Web 2.0 applications to share blog
entries, photos, videos and other content objects. Indeed, it is becoming easier and faster to make
new friends in the electronic world than in the real world. This constitutes an interesting
opportunity when considering that group interactions will be conducted more and more often
through collaboration technology (e.g. on the Internet through various Web applications),
113
because data log and data mining provide the capacity to better track shared content objects and
events. For researchers, this opens plenty of experimental possibilities and options for design.
In this empirical study, the design of the case study experiment also takes into account
the legacy of the IPO model and the two types of processes, namely the task process and socio-
emotional process. Prominent scientists in the area of emotional intelligence13, for example
Cherniss, Druskat and Goleman, have examined closely the role of emotional intelligence in
organisational effectiveness. Emotional intelligence is defined as a combination of cognitive and
emotional abilities (Goleman, 1998). Cherniss (2001) states that, according to Goleman, ‘The
essence of emotional intelligence is the integration of the emotional centers of the brain (the
limbic system) and cognitive centers (prefrontal cortex).’ He further explains:
Emotional Intelligence influences organisational effectiveness in a number of
areas, such as employee recruitment and retention, development of talent,
teamwork, employee commitment, innovation, productivity, efficiency, sales,
revenues, quality of service, customer loyalty, client or student outcomes.
Cherniss adds: ‘Similarly, Mayer, Salovey and Caruso (2000) conceive emotional
intelligence as a set of skills that involve processing information about emotion.’ Druskat and
Wolff worked out the emotional intelligence of a group and argued that the essence of group
emotional intelligence is constituted by norms and processes that support awareness and
regulation of emotion within a group (see Figure 3.7), rather than the sum of the group members’
individual emotional intelligence (Druskat and Wolff, 2001).
The proposed IPO model for collaborative distance (see Figure 3.8) for this empirical
study includes the Druskat and Wolff emotional process as the socio-emotional process and a
project process model as task process. All participants in the project cases were trained in using
13 http://www.eiconsortium.org/members/consortium_membership.htm
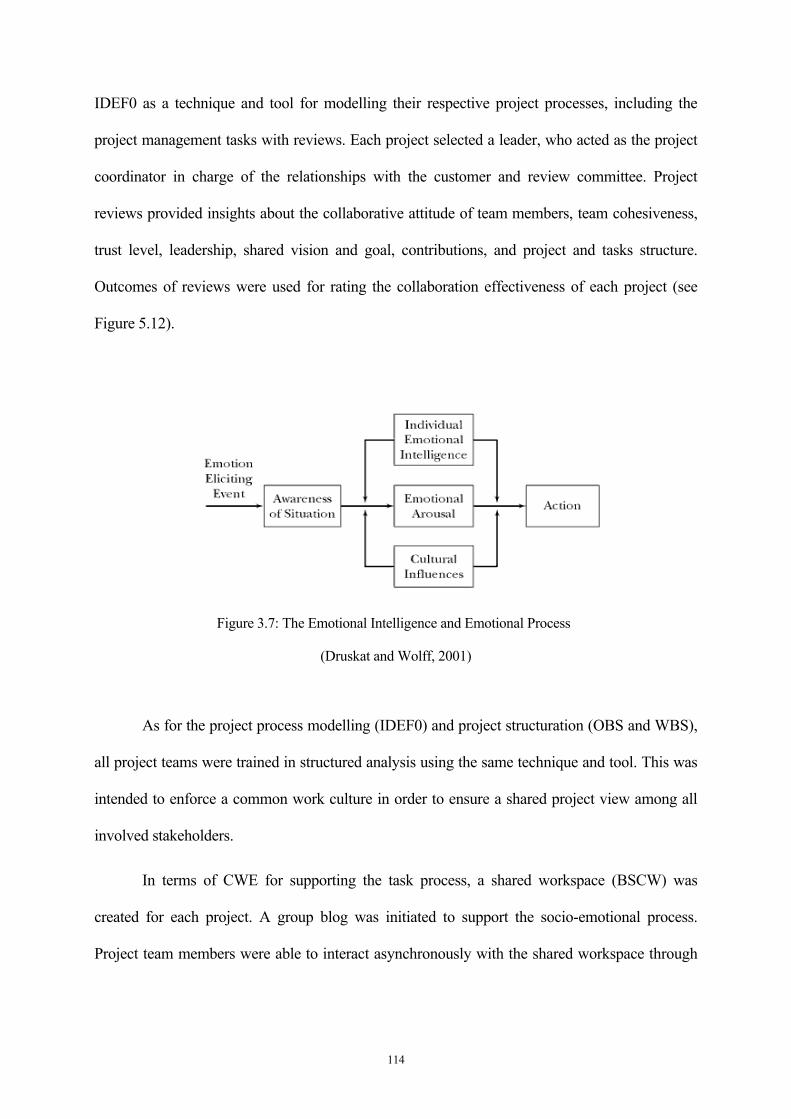
114
IDEF0 as a technique and tool for modelling their respective project processes, including the
project management tasks with reviews. Each project selected a leader, who acted as the project
coordinator in charge of the relationships with the customer and review committee. Project
reviews provided insights about the collaborative attitude of team members, team cohesiveness,
trust level, leadership, shared vision and goal, contributions, and project and tasks structure.
Outcomes of reviews were used for rating the collaboration effectiveness of each project (see
Figure 5.12).
Figure 3.7: The Emotional Intelligence and Emotional Process
(Druskat and Wolff, 2001)
As for the project process modelling (IDEF0) and project structuration (OBS and WBS),
all project teams were trained in structured analysis using the same technique and tool. This was
intended to enforce a common work culture in order to ensure a shared project view among all
involved stakeholders.
In terms of CWE for supporting the task process, a shared workspace (BSCW) was
created for each project. A group blog was initiated to support the socio-emotional process.
Project team members were able to interact asynchronously with the shared workspace through
115
group blogging, as well as e-mailing. For synchronous interactions, team members used instant
messaging (text based) and Web conferencing (voice based) tools.
A generic model of a group interaction process is tentatively designed (see Figure 3.9),
taking into account the previously described social interaction model (see Figure 2.8) and
collaboration process and mechanics models (see Figure 2.13) in Chapter 2.
Collaboration efficiency was evaluated through the various activities and related
interactions conducted on the CWE platform. The resulting log data are explored in the findings
and analysis. The efficiency is assessed through two aspects: the ratio of produced content
objects per project participant (output per mobilised resource) and the ratio of generated events
per project participant (see Figure 5.12).
All factors are shown in Figure 3.8 ‘Input’ factors are related to individual team
members, culture, organisation, team and technology. ‘Socio-Emotional Process’ factors are
related to relationships building, team cohesiveness and trust. ‘Task Process’ factors are related
to coordination, communication and technology. Finally, ‘Output’ factors are related to
collaboration performance and individual satisfaction.

116
Figure 3.8: The IPO Model for the Collaborative Distance Experiment

117
Figure 3.9: A generic model of a Group Interaction Process based on the collaboration mechanics

118
3.3 The Observation Model
The observation model, as shown in Figure 3.10, is designed according to the above
described research methods in order to get a better understanding of what is going on when
individuals collaborate. This collaboration, whatever the distance factors, uses an online Shared
Workspace platform where generated events are recorded.
The online Shared Workspace platform provides an opportunity to observe the
interaction process, as proposed by the IPO model for the CD experiment (see Figure 3.8),
especially the nature and frequency of interactions among individuals through the analysis of
resulting log data.
Figure 3.10: The Observation Model
Collaborative distance among individuals collaborating through the use of asynchronous
tools such as a Shared Workspace technology (BSCW), including group blogging and other
119
synchronous collaboration tools (e.g. MSN, Skype), is observed through their level of interaction
in developing the produced outcomes and through the number of generated events.
3.4 Comparative Cases
3.4.1 Case Objectives
The first objective was to compare, among a set of collaboration projects, the degree to
which team members perceived the impact of distance factors on their collaboration as reported
by project participants during the focus group interviews.
The second objective was to observe and compare, among all project teams, the degree to
which the use of an online Shared Workspace platform had allowed team members to overcome
or bridge collaborative distances, as reported by project participants during the focus group
interviews and as recorded in the log-data of the collaboration platform.
3.4.2 Case Selection
In selecting the comparative cases, the main idea was to use the projects of Master’s
degree students at ISTIA Innovation as an interesting opportunity to compare the feedback of
professionals (survey on collaboration barriers) with that of participants representing the Net-
Generation. Even more importantly, all students’ projects apply the same methodology and
collaboration platform, while in industry it would be extremely difficult to find a set of projects
sharing the same size and timeframe, and using the same methodology and toolset, hence making
any tentative comparison risky.
Second year Master’s degree students at ISTIA Innovation (University of Angers) form
project teams in order to carry out a concrete project with real customers and involving various
external experts. These projects deal with a variety of innovation subjects provided by local
industry or regional authorities. Students have one day per week devoted to their project, over a
120
period of five months. They operate in a hybrid collaboration mode of collocated/distributed
team and use an online shared workspace for sharing information and documents.
These experiments were intended to confront students with collaboration barriers and
distance factors, which they would try to overcome through the use of collaboration technology
and tools (online Shared Workspace). Important issues, such as whether the collaborative
platform had helped in sharing knowledge and reaching a mutual understanding, and in
overcoming various types of collaborative distance, were also part of this study.
3.4.3 Context of the 14 projects
The experimentation was conducted from October 2007 to February 2008. The 75
participants had an average age of 25 years, representing the Net-Generation. Project teams
comprised Master’s degree students from four innovation domains: Strategic Information,
European Venture, Agro-biology, and Virtual Reality. Students had one full day per week
devoted to their respective collaborative project for applying what they had learnt during courses.
There were three intermediate project reviews and a final one in the presence of the customer and
a panel of external experts; these reviews were intended to evaluate the collaboration
performance and satisfaction of the customer.
Owing to a confidentiality agreement between customers and ISTIA Innovation, the
contents of the projects could not be presented. However, as they all addressed innovation in
various sectors, with specific activities such as technology or competitiveness study, the projects
had the same sort of generic process which, once personalised, neither interfered in observations
nor polluted collected data.
According to the defined research strategy, the 14 comparative cases implemented a
structured analysis approach (SADT) and a functional activity modelling instrument (IDEF0),
used by project participants to define and agree on their respective project processes. The
121
strategy included team building (purpose, people, process and place), relationship and leadership
experiments throughout the project life-cycle (project duration was five consecutive months). In
terms of shared techniques and methods enforcing a shared understanding, in addition to the
previously mentioned use of SADT and IDEF0, all project teams used WBS and OBS for the
structuration of their respective projects. The BSCW platform log data, together with the level of
interaction and usage, is intended to provide insights into the various collaborative activities
conducted by each team, such as shared models, common classification, shared structuration,
team communication and shared space. In terms of team performance, log data are also intended
to provide figures on the level of team productivity, compared to the level of interaction and
number of project stakeholders.
3.4.4 Focus Group Interviews
In order to have a more immersive experience, focus groups replicated project teams. To
reach the proper level of group consciousness, interaction should be as inconspicuous as possible
and should encourage presentation and perception among participants; therefore, it should not be
forced by the moderator. In this kind of experimentation environment, users should have a total
freedom and wide access to the collaborative platform functions without any specific restriction
or obligation. In this case, the collaborative environment was flexible enough to fit team
members in their respective daily activities.
The questionnaire for the focus group interviews, based on open ended questions,
included three main discussion topics:
• The degree to which mutual understanding is perceived as the key to an effective
collaboration;
• The appropriateness of online Shared Workspace and Group Blogging (collaboration
technologies) for sharing information and documents, hence making more effective
122
the collaboration among team members wherever they are located and whenever they
need it;
• The degree to which collaboration technologies allow the bridging or compression of
distances and whether the use of technologies creates in return a specific distance
type.
The interpretation of the results of the focus group interviews is used to scale comments
on the degree to which the used collaboration technology allowed project teams to bridge or
compress distance types, from ‘not at all compressed or bridged’ (value 0), ‘not satisfactorily
compressed or bridged’ (value 1), ‘only partially compressed or bridged’ (value 2), to ‘fully
compressed or bridged (value 3).
The above described scale of four different ratings is intended to correspond to the four
ratings of the survey on collaboration barriers, in order to make easier the comparison between
the rated collaboration barriers by professionals (survey) and experienced technology capacity to
overcome these distance types during students’ projects (see Figure 5.11).
All project participants received specific training on collaborative distance and
collaboration technologies when they started their projects.
3.4.5 Data Sources
In this empirical study, data sources comprise a survey, focus group interviews and log
data. The survey represents the quantitative side of the triangulated research approach, while the
focus group interviews represent the qualitative side. The log data complete the triangulated
research approach.
123
3.4.6 Data Collection
Data are collected from a survey, focus group interviews and comparative cases. For
comparative cases, log data come directly from the shared workspace environments (BSCW),
either from direct data export or through data mining techniques that are not part of the shared
workspace environment (see explanations below regarding the data mining techniques).
3.4.7 Data Mining
Artefacts can be accessed in BSCW by interactive navigation along the predefined folder
structures and by search facilities that offer comprehensive specifications of all available
attributes (e.g. artefact name, content, metadata, activities). The tracked user activities can be
requested by history of artefacts, awareness icons, mail notification, and search. However, there
is no tool support for gaining a good overview of topics and activities within the workspace.
Similar observations have been made for other workspace support systems.
A more comprehensive and flexible support of asynchronous awareness should enable
the user to analyse cooperation activities from different perspectives (Pankoke-Babatz et al.,
2004). Graphical overviews, together with text mining, can significantly facilitate the
investigation of larger tracks of cooperation artefacts. Novak and Wurst (2005) claim that multi-
perspective visualisations for cooperative work analysis must not be static, but rather must
provide the current picture of a cooperation environment and offer flexibility through rich
interaction.
Recent work within a European research project has already addressed some aspects of
activity analysis. Two approaches are of particular interest here: The Readers system (Pallot et
al., 2006) uses a Hypergraph metaphor to link group members and content objects with
generated events. A red link indicates the creation of an artefact, while a green link depicts a
read-activity. Filters can be defined to restrict time and other criteria, leading to new graphs.
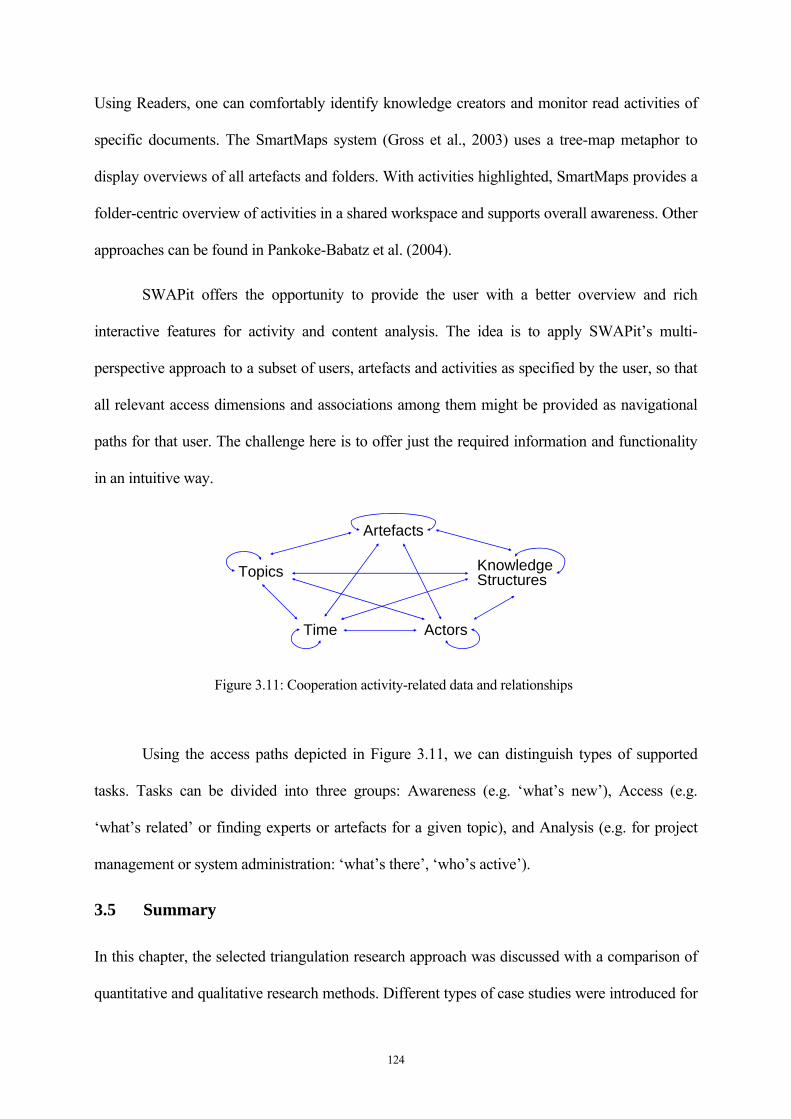
124
Using Readers, one can comfortably identify knowledge creators and monitor read activities of
specific documents. The SmartMaps system (Gross et al., 2003) uses a tree-map metaphor to
display overviews of all artefacts and folders. With activities highlighted, SmartMaps provides a
folder-centric overview of activities in a shared workspace and supports overall awareness. Other
approaches can be found in Pankoke-Babatz et al. (2004).
SWAPit offers the opportunity to provide the user with a better overview and rich
interactive features for activity and content analysis. The idea is to apply SWAPit’s multi-
perspective approach to a subset of users, artefacts and activities as specified by the user, so that
all relevant access dimensions and associations among them might be provided as navigational
paths for that user. The challenge here is to offer just the required information and functionality
in an intuitive way.
Topics KnowledgeStructures
ActorsTime
Artefacts
Figure 3.11: Cooperation activity-related data and relationships
Using the access paths depicted in Figure 3.11, we can distinguish types of supported
tasks. Tasks can be divided into three groups: Awareness (e.g. ‘what’s new’), Access (e.g.
‘what’s related’ or finding experts or artefacts for a given topic), and Analysis (e.g. for project
management or system administration: ‘what’s there’, ‘who’s active’).
3.5 Summary
In this chapter, the selected triangulation research approach was discussed with a comparison of
quantitative and qualitative research methods. Different types of case studies were introduced for
125
explaining that the type of comparative cases was selected in this empirical study for carrying out
interpretative comparisons. As for evaluating collaboration effectiveness and efficiency, the
“Input-Process-Output” (IPO) model is also discussed and explained as well as adapted versions
of the IPO model by Saunders (2000) and later on by Powell and colleagues (2004). In addition,
the Druskat and Wolff (2001) emotional process is included in the IPO model for the
Collaborative Distance experiment which is adapted from Hackman and Morris (1975).
Further to this, the observation model is described for enabling the evaluation of the nature and
frequency of interactions among individuals through the analysis of log-data. The objectives of
the comparative cases and their selection, as well as, the context of the project cases were
explained. The focus group interviews, including the questionnaire and ratings, were presented
and explained. Finally the data sources and data collection strategy, as well as, data mining
within the Shared Workspace (BSCW) were described.

126
127
Chapter 4. Research Findings
R e a l i t y i s m e r e l y a n i l l u s i o n , a l b e i t a v e r y
p e r s i s t e n t o n e . – A l b e r t E i n s t e i n
This chapter presents the findings from the survey on collaboration barriers raised by
distance factors, and from the focus group interviews and the comparative cases log data. It
introduces the context of the survey and respondents’ perceptions of the impact of distance
factors in raising collaboration barriers. It also describes the collaboration technology used
consistently across all comparative project cases. Finally, the outcomes of the focus group
interviews and comparative project cases are presented in terms of the resulting data.
128
4.1 Survey Data
A survey on collaboration barriers, carried out from June 2007 to June 2008, was
intended to collect respondents’ views about a number of collaboration barriers based on their
own experience forged during previous collaborative projects. Each assertion included in the
questionnaire identifies a potential barrier which implies a certain negative impact on
collaboration performance. The question that respondents answered was: ‘Do you believe that
this assertion corresponds to a collaboration barrier which has a negative impact on collaboration
performance?’
Respondents were asked to check only one of the following possible answers: major
impact, average impact, minor impact, or no impact at all. Collaboration barriers included in this
survey correspond to various distance factors as previously discussed in the literature review.
These collaboration barriers or distance factors were grouped into four dimensions
corresponding to the Collaborative Distance Framework: structural, social, technical and legal.
The website approach applied to post the survey comprised four complementary polls,
one for each dimension. This approach provides a lot of flexibility to respondents, as they can
start expressing their opinion for one poll and then pause for a while if they need to before
turning to another dimension, or vote for several polls during the same visit. The main objective
is to ensure that respondents do not spend too much time completing the whole survey at once.
Furthermore, current voting figures are always available to respondents without their having to
respond to the survey. This means that there is no risk of participants giving fake responses just
to get access to the results.
This is considered a valid approach to avoid low quality responses, because only
motivated people respond to the survey. Moreover, another interesting added value of
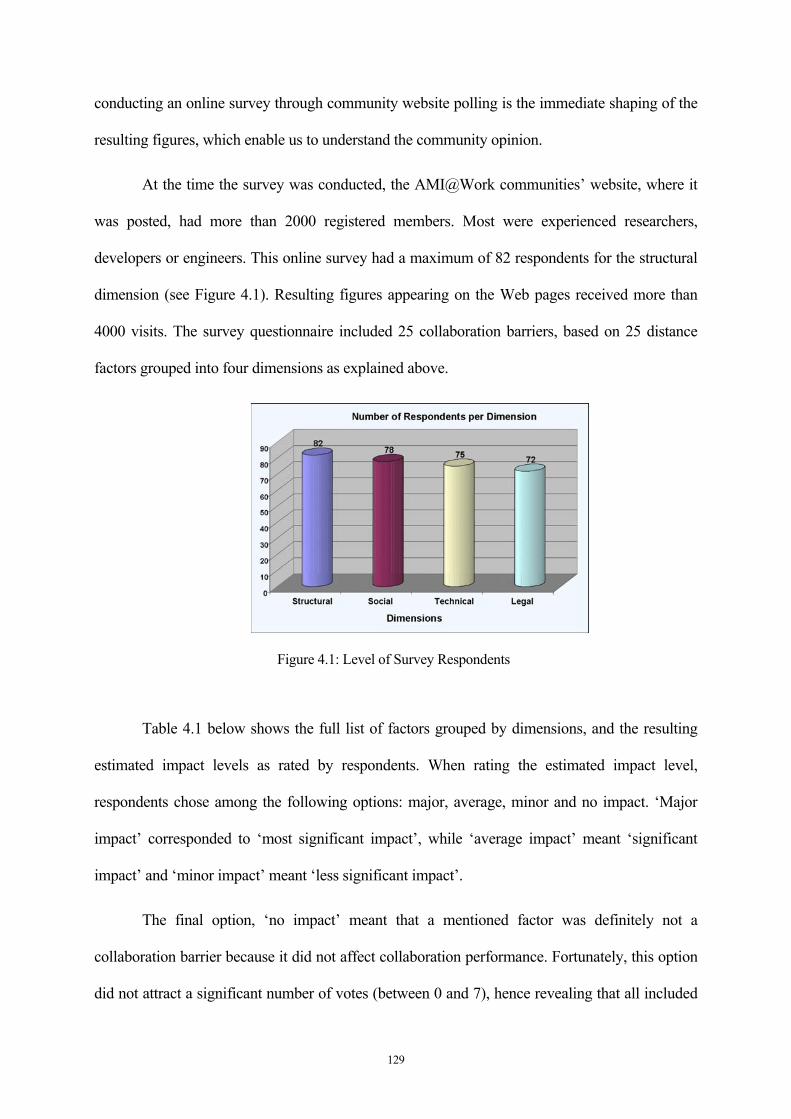
129
conducting an online survey through community website polling is the immediate shaping of the
resulting figures, which enable us to understand the community opinion.
At the time the survey was conducted, the AMI@Work communities’ website, where it
was posted, had more than 2000 registered members. Most were experienced researchers,
developers or engineers. This online survey had a maximum of 82 respondents for the structural
dimension (see Figure 4.1). Resulting figures appearing on the Web pages received more than
4000 visits. The survey questionnaire included 25 collaboration barriers, based on 25 distance
factors grouped into four dimensions as explained above.
Figure 4.1: Level of Survey Respondents
Table 4.1 below shows the full list of factors grouped by dimensions, and the resulting
estimated impact levels as rated by respondents. When rating the estimated impact level,
respondents chose among the following options: major, average, minor and no impact. ‘Major
impact’ corresponded to ‘most significant impact’, while ‘average impact’ meant ‘significant
impact’ and ‘minor impact’ meant ‘less significant impact’.
The final option, ‘no impact’ meant that a mentioned factor was definitely not a
collaboration barrier because it did not affect collaboration performance. Fortunately, this option
did not attract a significant number of votes (between 0 and 7), hence revealing that all included
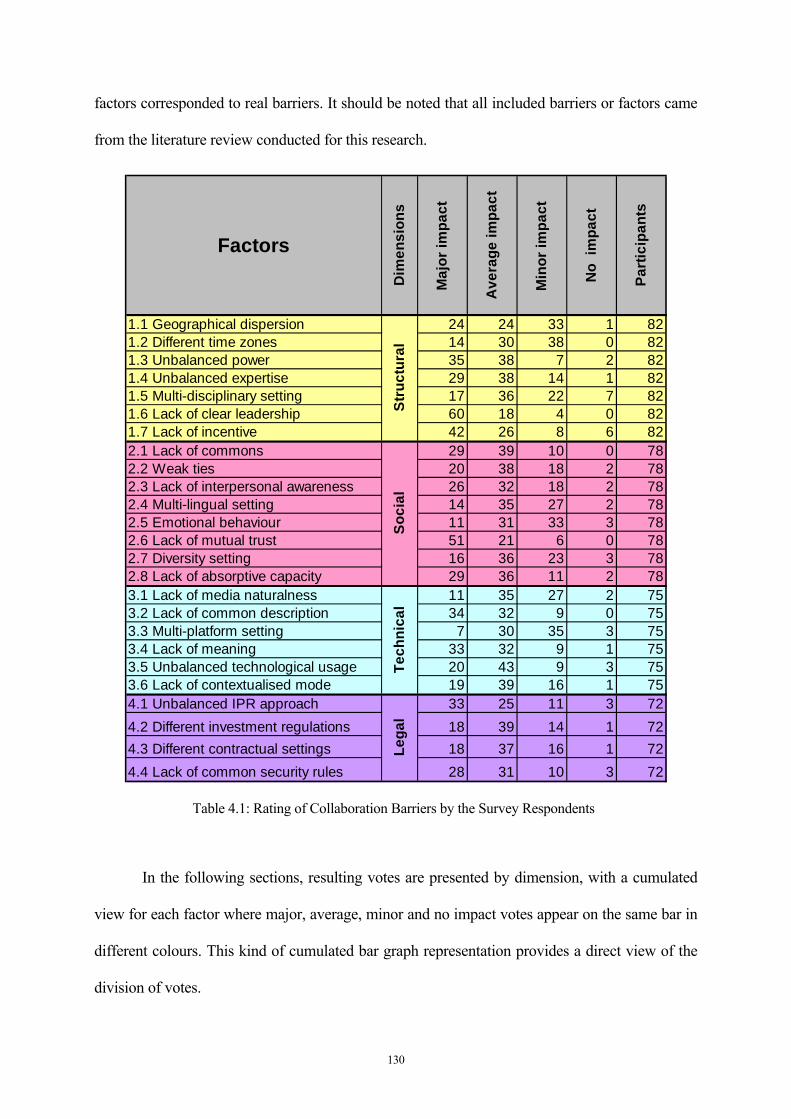
130
factors corresponded to real barriers. It should be noted that all included barriers or factors came
from the literature review conducted for this research.
Factors
Dim
ensi
ons
Maj
or im
pact
Ave
rage
impa
ct
Min
or im
pact
No
impa
ct
Part
icip
ants
1.1 Geographical dispersion 24 24 33 1 821.2 Different time zones 14 30 38 0 821.3 Unbalanced power 35 38 7 2 821.4 Unbalanced expertise 29 38 14 1 821.5 Multi-disciplinary setting 17 36 22 7 821.6 Lack of clear leadership 60 18 4 0 821.7 Lack of incentive 42 26 8 6 822.1 Lack of commons 29 39 10 0 782.2 Weak ties 20 38 18 2 782.3 Lack of interpersonal awareness 26 32 18 2 782.4 Multi-lingual setting 14 35 27 2 782.5 Emotional behaviour 11 31 33 3 782.6 Lack of mutual trust 51 21 6 0 782.7 Diversity setting 16 36 23 3 782.8 Lack of absorptive capacity 29 36 11 2 783.1 Lack of media naturalness 11 35 27 2 753.2 Lack of common description 34 32 9 0 753.3 Multi-platform setting 7 30 35 3 753.4 Lack of meaning 33 32 9 1 753.5 Unbalanced technological usage 20 43 9 3 753.6 Lack of contextualised mode 19 39 16 1 754.1 Unbalanced IPR approach 33 25 11 3 724.2 Different investment regulations 18 39 14 1 724.3 Different contractual settings 18 37 16 1 724.4 Lack of common security rules 28 31 10 3 72
Stru
ctur
alSo
cial
Tech
nica
lLe
gal
Table 4.1: Rating of Collaboration Barriers by the Survey Respondents
In the following sections, resulting votes are presented by dimension, with a cumulated
view for each factor where major, average, minor and no impact votes appear on the same bar in
different colours. This kind of cumulated bar graph representation provides a direct view of the
division of votes.
131
Introduction to the Survey as Posted on the Website
Today, it is widely recognised that diverse factors impact collaboration effectiveness and
efficiency. Those factors create different types of distance among collaborating people such as
eProfessionals. The literature review has allowed us to identify a number of factors grouped into
twenty factor types or classes that are tentatively clustered into an overall concept named
‘collaborative distance’. This overall concept of collaborative distance has four dimensions:
structural, social, technical and legal. Collaboration barriers are generated by factors creating
different types of collaborative distance, which negatively impact collaboration performance.
Participants were informed that the survey was intended to collect their views about the
specified collaboration barriers based on their own experience forged during collaborative
projects. Resulting figures were constantly monitored during the complete cycle of the survey.
Each assertion identified a potential barrier implying a certain negative impact on collaboration.
The question that respondents were asked to answer was: ‘Do you believe that this assertion
corresponds to a collaboration barrier which has a negative impact on collaboration
performance?’
When expressing their opinions, respondents were requested to check one of the four
possible ratings:
• Major impact: Implies a collaboration barrier that has a major negative impact on
collaboration effectiveness and efficiency.
• Average impact: Implies a collaboration barrier that has an average negative impact.
• Minor impact: Implies a collaboration barrier that has a minor negative impact.
• No impact: Implies no collaboration barrier!
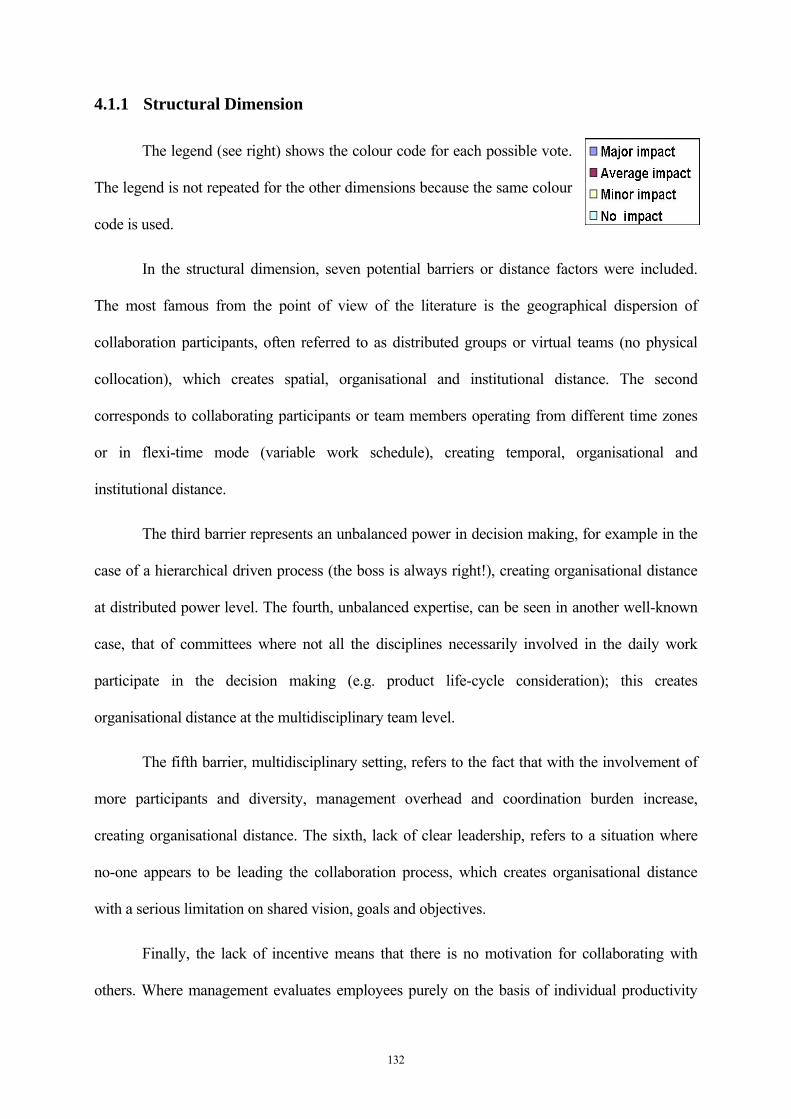
132
4.1.1 Structural Dimension
The legend (see right) shows the colour code for each possible vote.
The legend is not repeated for the other dimensions because the same colour
code is used.
In the structural dimension, seven potential barriers or distance factors were included.
The most famous from the point of view of the literature is the geographical dispersion of
collaboration participants, often referred to as distributed groups or virtual teams (no physical
collocation), which creates spatial, organisational and institutional distance. The second
corresponds to collaborating participants or team members operating from different time zones
or in flexi-time mode (variable work schedule), creating temporal, organisational and
institutional distance.
The third barrier represents an unbalanced power in decision making, for example in the
case of a hierarchical driven process (the boss is always right!), creating organisational distance
at distributed power level. The fourth, unbalanced expertise, can be seen in another well-known
case, that of committees where not all the disciplines necessarily involved in the daily work
participate in the decision making (e.g. product life-cycle consideration); this creates
organisational distance at the multidisciplinary team level.
The fifth barrier, multidisciplinary setting, refers to the fact that with the involvement of
more participants and diversity, management overhead and coordination burden increase,
creating organisational distance. The sixth, lack of clear leadership, refers to a situation where
no-one appears to be leading the collaboration process, which creates organisational distance
with a serious limitation on shared vision, goals and objectives.
Finally, the lack of incentive means that there is no motivation for collaborating with
others. Where management evaluates employees purely on the basis of individual productivity
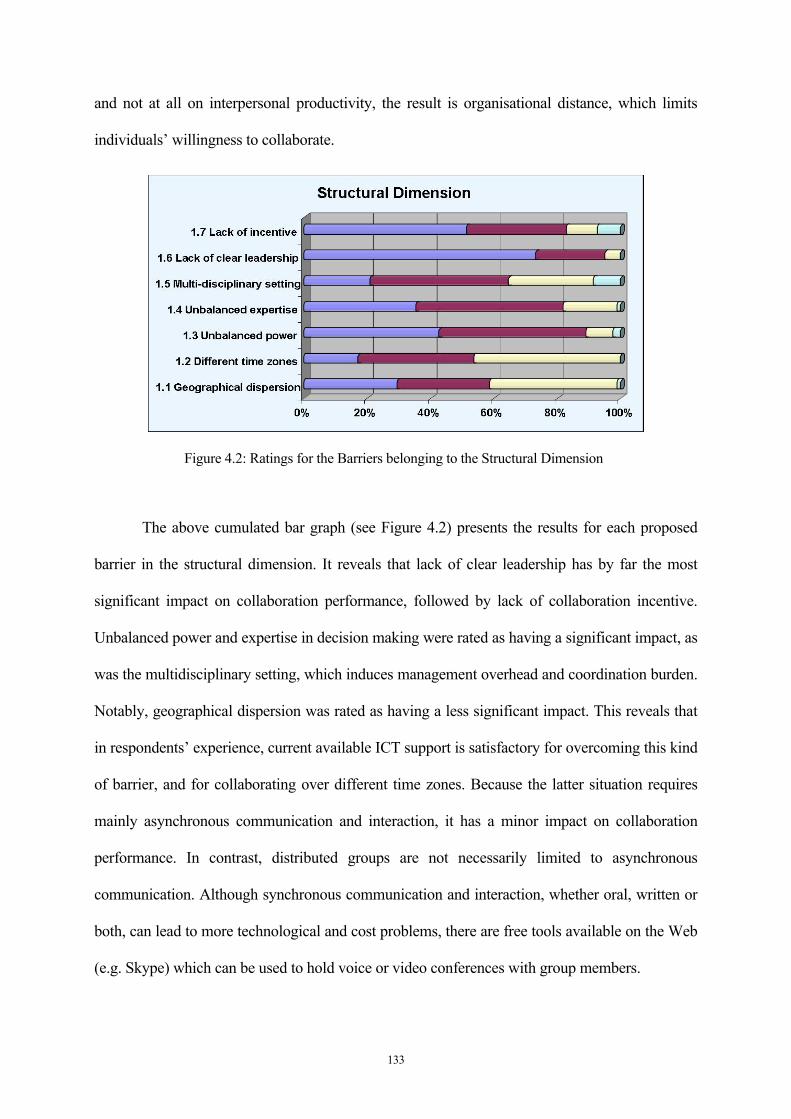
133
and not at all on interpersonal productivity, the result is organisational distance, which limits
individuals’ willingness to collaborate.
Figure 4.2: Ratings for the Barriers belonging to the Structural Dimension
The above cumulated bar graph (see Figure 4.2) presents the results for each proposed
barrier in the structural dimension. It reveals that lack of clear leadership has by far the most
significant impact on collaboration performance, followed by lack of collaboration incentive.
Unbalanced power and expertise in decision making were rated as having a significant impact, as
was the multidisciplinary setting, which induces management overhead and coordination burden.
Notably, geographical dispersion was rated as having a less significant impact. This reveals that
in respondents’ experience, current available ICT support is satisfactory for overcoming this kind
of barrier, and for collaborating over different time zones. Because the latter situation requires
mainly asynchronous communication and interaction, it has a minor impact on collaboration
performance. In contrast, distributed groups are not necessarily limited to asynchronous
communication. Although synchronous communication and interaction, whether oral, written or
both, can lead to more technological and cost problems, there are free tools available on the Web
(e.g. Skype) which can be used to hold voice or video conferences with group members.
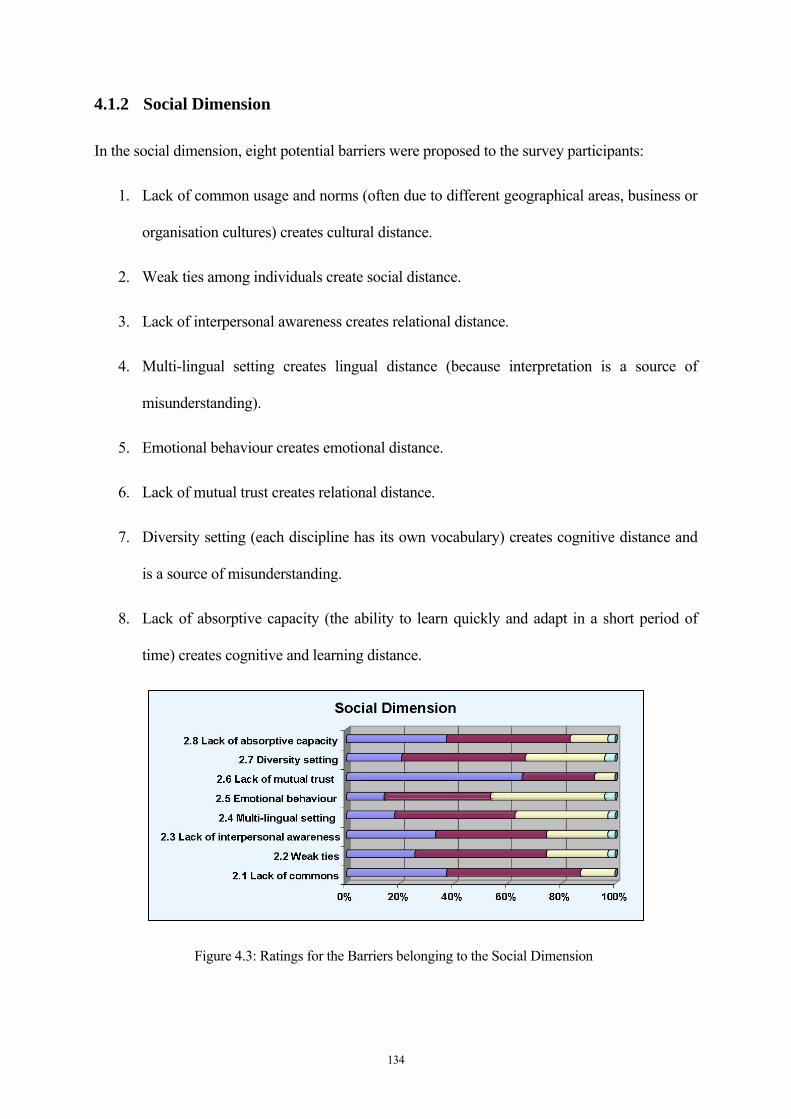
134
4.1.2 Social Dimension
In the social dimension, eight potential barriers were proposed to the survey participants:
1. Lack of common usage and norms (often due to different geographical areas, business or
organisation cultures) creates cultural distance.
2. Weak ties among individuals create social distance.
3. Lack of interpersonal awareness creates relational distance.
4. Multi-lingual setting creates lingual distance (because interpretation is a source of
misunderstanding).
5. Emotional behaviour creates emotional distance.
6. Lack of mutual trust creates relational distance.
7. Diversity setting (each discipline has its own vocabulary) creates cognitive distance and
is a source of misunderstanding.
8. Lack of absorptive capacity (the ability to learn quickly and adapt in a short period of
time) creates cognitive and learning distance.
Figure 4.3: Ratings for the Barriers belonging to the Social Dimension
135
The above cumulated bar graph (see Figure 4.3) presents the results for each proposed
barrier in the social dimension. It reveals that lack of mutual trust has by far the most significant
impact on collaboration performance, which confirms the outcome of the literature review
regarding the trust factor. However, there is no relevant trust model for collaboration that
explains the links with other factors such as weak ties and interpersonal awareness. There is a
possible link with the multi-lingual setting factor, since the bringing together of people from
different cultures speaking different mother tongues does not encourage a good level of
confidence and trust. Lack of common usage and norms, together with lack of absorptive
capacity (Tsai, 2001), were also rated as having a quite significant impact on collaboration
performance. The diversity setting was rated as having a significant impact, since on the one
hand it brings more creative potential, while on the other it brings more cultural and cognitive
distance, noticeably impeding collaboration performance. In contrast, emotional behaviour was
rated as having a less significant impact. This might be explained by the fact that people,
especially those who are shy, feel more comfortable in situations where there is emotional
distance.
4.1.3 Technical Dimension
In the technical dimension, six potential barriers were proposed to the survey participants:
1. Lack of media naturalness (such as facial expression and gesture) creates cognitive
distance.
2. Lack of common description (such as concepts, references and taxonomy) creates
conceptual distance.
3. Multi-platform setting (in terms of types of device and operating systems for example)
creates referential and technological distance.
4. Lack of meaning creates semantic distance.

136
5. Unbalanced technological usage and expertise creates technological distance.
6. Lack of contextualised operational mode (such as context awareness) creates contextual
distance.
Figure 4.4: Ratings for the Barriers belonging to the Technical Dimension
The above cumulated bar graph (see Figure 4.4) presents the results for each proposed
barrier in the technical dimension. It shows that lack of common description (shared knowledge),
together with lack of meanings (shared sense-making) were rated as having the most significant
impact. This also confirms the findings from the literature review that shared knowledge and
sense-making constitute the essence of collaboration. Unbalanced technological usage, which
induces technological distance, and lack of contextualised operational mode, which induces
contextual distance, were considered as having a significant impact on collaboration
performance. Interestingly, the multi-platform setting was rated as being a less significant factor,
which may lead to the interpretation that survey participants are satisfied with the current level of
tools execution whatever the computing device and operating system used.
4.1.4 Legal Dimension
In the legal dimension, four potential barriers were proposed to the survey participants:
1. Unbalanced Intellectual Property Rights (IPR) approach creates ownership distance.
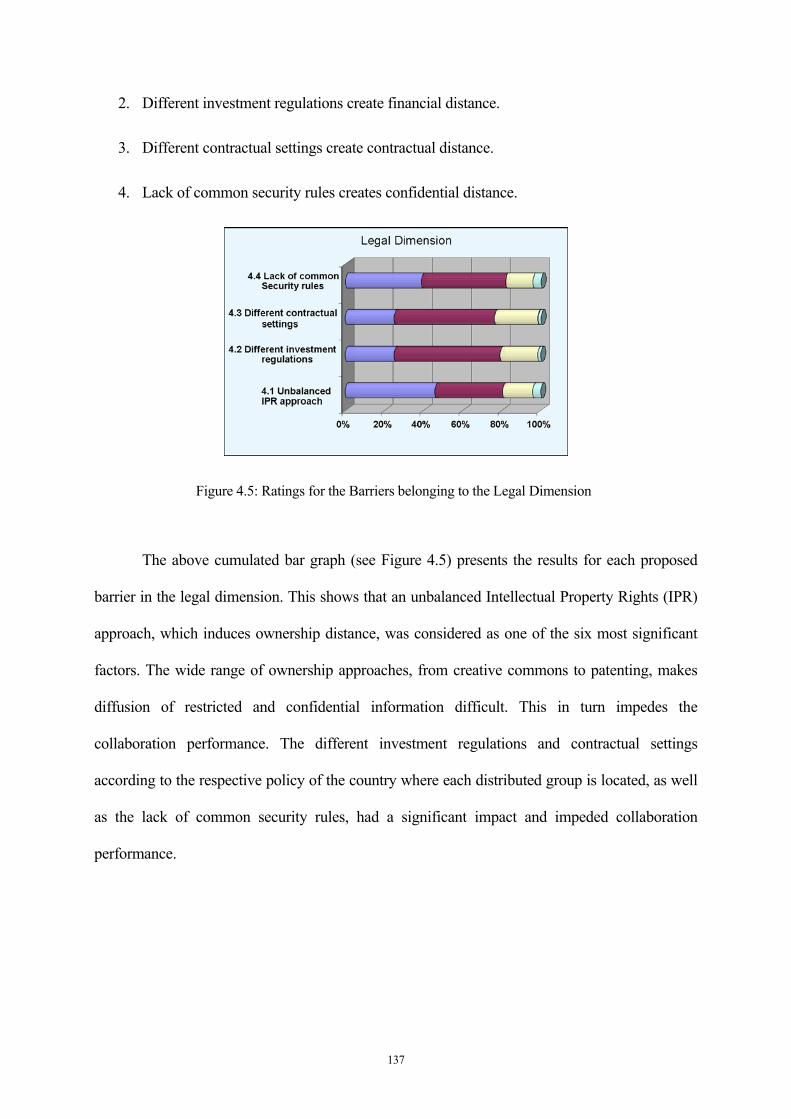
137
2. Different investment regulations create financial distance.
3. Different contractual settings create contractual distance.
4. Lack of common security rules creates confidential distance.
Figure 4.5: Ratings for the Barriers belonging to the Legal Dimension
The above cumulated bar graph (see Figure 4.5) presents the results for each proposed
barrier in the legal dimension. This shows that an unbalanced Intellectual Property Rights (IPR)
approach, which induces ownership distance, was considered as one of the six most significant
factors. The wide range of ownership approaches, from creative commons to patenting, makes
diffusion of restricted and confidential information difficult. This in turn impedes the
collaboration performance. The different investment regulations and contractual settings
according to the respective policy of the country where each distributed group is located, as well
as the lack of common security rules, had a significant impact and impeded collaboration
performance.

138
4.2 Focus Group Data
4.2.1 Introduction
This section presents the results of the focus group interviews (FGI). It also addresses
the use of collaboration technology and tools such as an online Shared Workspace (SW)
platform operating on the Web. The study was conducted as a real life experiment, through the
use of a SW platform that included a number of new features, such as presence and expectation
awareness, and group blogging. The basic idea was to engage a community of users in
collaborative project experimentations. These experiments were intended to confront students
with collaboration barriers and distance factors, and for them to try to overcome these barriers
through the use of collaboration technology and tools. Important issues, such as whether the
collaborative platform had helped in sharing knowledge and reaching a mutual understanding,
and in overcoming various types of collaborative distance, were also part of this study.
The first goal was to evaluate the impact of various collaborative distance factors during
real life collaboration projects. All project cases were conducted by groups of students together
with external participants such as customers and experts. The second goal was to explore the use
of collaboration technology and tools for overcoming barriers in bridging collaborative distances.
It was expected that FGI would support the creation of an inter-personal communication
arena among focus group members. Group members share knowledge and known concepts, and
compare their ideas while discussing their own experience using the SW platform. Through this
social interaction, they gain a better consciousness of the various concepts embedded in the SW
platform, and their benefits versus difficulties based on diverse encountered situations.
In order to have a more immersive experience, focus groups replicated project teams. To
reach the proper level of group consciousness, interaction should be as inconspicuous as possible
and should encourage presentation and perception among participants; therefore, it should not be
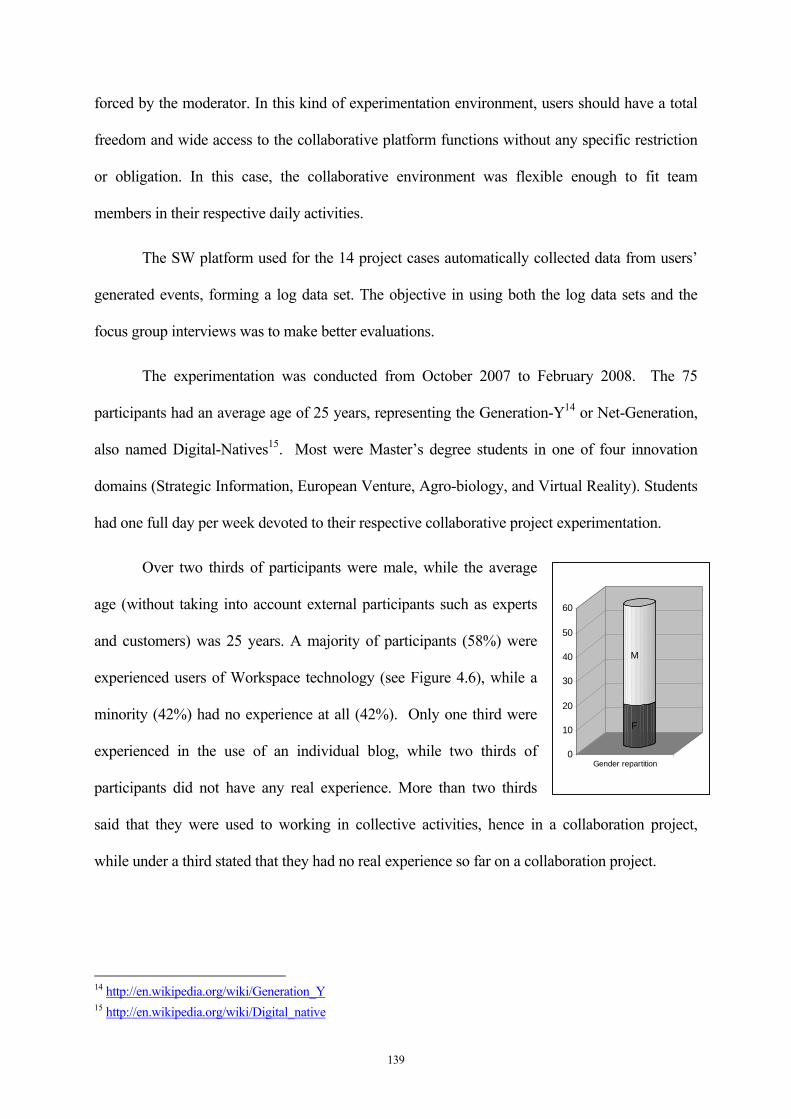
139
forced by the moderator. In this kind of experimentation environment, users should have a total
freedom and wide access to the collaborative platform functions without any specific restriction
or obligation. In this case, the collaborative environment was flexible enough to fit team
members in their respective daily activities.
The SW platform used for the 14 project cases automatically collected data from users’
generated events, forming a log data set. The objective in using both the log data sets and the
focus group interviews was to make better evaluations.
The experimentation was conducted from October 2007 to February 2008. The 75
participants had an average age of 25 years, representing the Generation-Y14 or Net-Generation,
also named Digital-Natives15. Most were Master’s degree students in one of four innovation
domains (Strategic Information, European Venture, Agro-biology, and Virtual Reality). Students
had one full day per week devoted to their respective collaborative project experimentation.
Over two thirds of participants were male, while the average
age (without taking into account external participants such as experts
and customers) was 25 years. A majority of participants (58%) were
experienced users of Workspace technology (see Figure 4.6), while a
minority (42%) had no experience at all (42%). Only one third were
experienced in the use of an individual blog, while two thirds of
participants did not have any real experience. More than two thirds
said that they were used to working in collective activities, hence in a collaboration project,
while under a third stated that they had no real experience so far on a collaboration project.
14 http://en.wikipedia.org/wiki/Generation_Y 15 http://en.wikipedia.org/wiki/Digital_native
F
M
0
10
20
30
40
50
60
Gender repartition
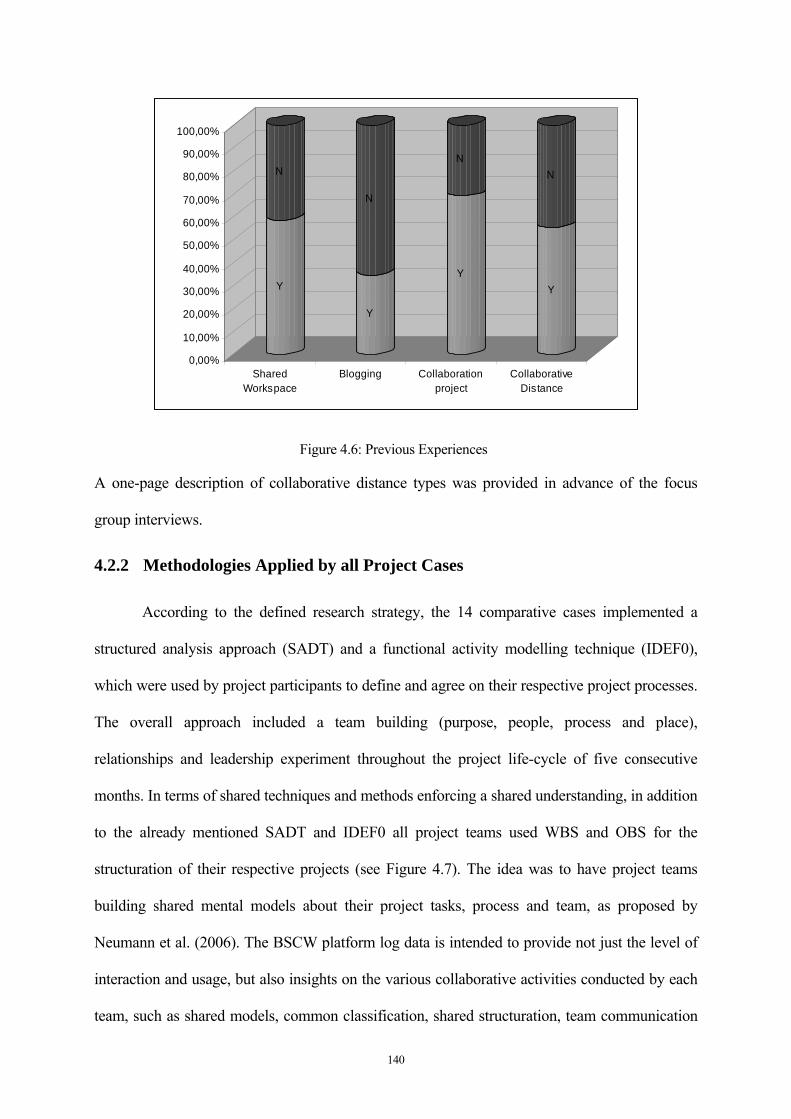
140
Y
N
Y
N
Y
N
Y
N
0,00%
10,00%
20,00%
30,00%
40,00%
50,00%
60,00%
70,00%
80,00%
90,00%
100,00%
SharedWorkspace
Blogging Collaborationproject
CollaborativeDistance
Figure 4.6: Previous Experiences
A one-page description of collaborative distance types was provided in advance of the focus
group interviews.
4.2.2 Methodologies Applied by all Project Cases
According to the defined research strategy, the 14 comparative cases implemented a
structured analysis approach (SADT) and a functional activity modelling technique (IDEF0),
which were used by project participants to define and agree on their respective project processes.
The overall approach included a team building (purpose, people, process and place),
relationships and leadership experiment throughout the project life-cycle of five consecutive
months. In terms of shared techniques and methods enforcing a shared understanding, in addition
to the already mentioned SADT and IDEF0 all project teams used WBS and OBS for the
structuration of their respective projects (see Figure 4.7). The idea was to have project teams
building shared mental models about their project tasks, process and team, as proposed by
Neumann et al. (2006). The BSCW platform log data is intended to provide not just the level of
interaction and usage, but also insights on the various collaborative activities conducted by each
team, such as shared models, common classification, shared structuration, team communication

141
and shared spaces. In addition, log data is intended to provide figures on the level of team
efficiency as a ratio of produced content objects per resource (see Figure 5.12), for comparison
with the level of interaction and number of project stakeholders as a ratio of generated events per
project participant.
Figure 4.7: Project Structuration Model with OBS and WBS
The use of common techniques, methods and tools, as mentioned in the boundary object
theory (Star and Griesemer, 1989), facilitates shared mental models among participants
belonging to different disciplines or communities. According to Star and Griesemer:
Boundary objects are objects which are both plastic enough to adapt to local
needs and constraints of the several parties employing them, yet robust enough to
maintain a common identity across sites. They are weakly structured in common
use, and become strongly structured in individual-site use. They may be abstract
or concrete. They have different meanings in different social worlds but their
structure is common enough to more than one world to make them recognizable
means of translation. The creation and management of boundary objects
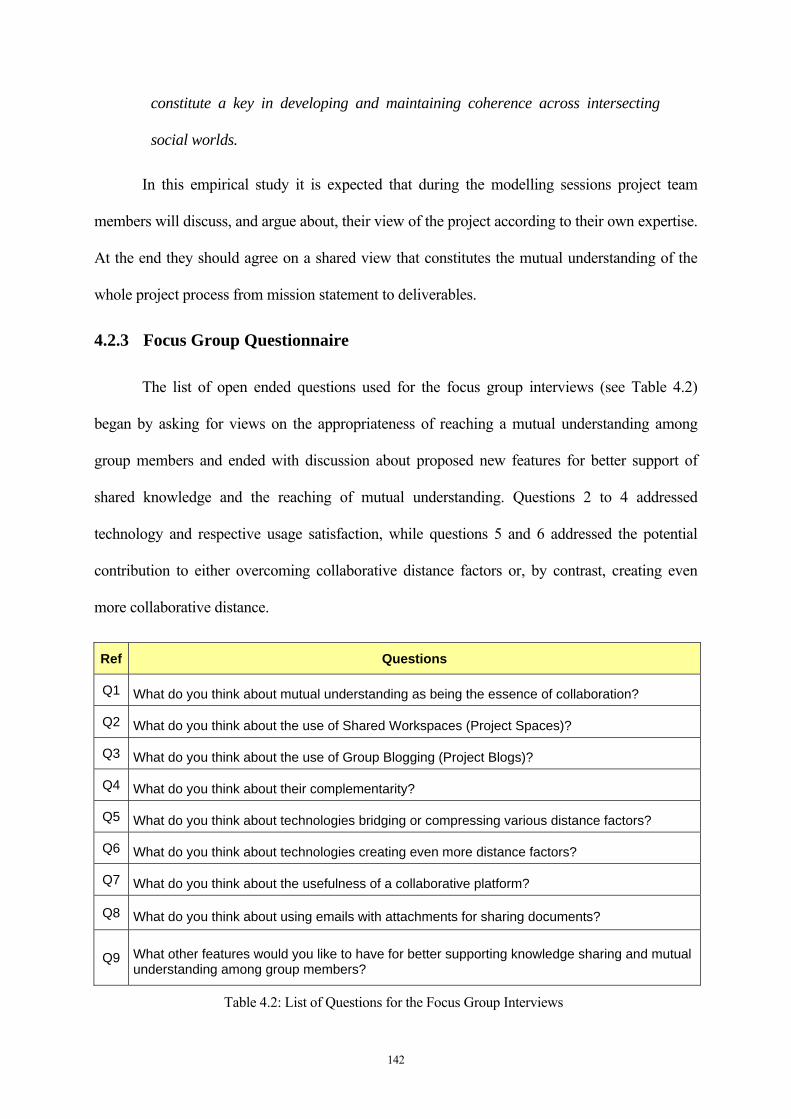
142
constitute a key in developing and maintaining coherence across intersecting
social worlds.
In this empirical study it is expected that during the modelling sessions project team
members will discuss, and argue about, their view of the project according to their own expertise.
At the end they should agree on a shared view that constitutes the mutual understanding of the
whole project process from mission statement to deliverables.
4.2.3 Focus Group Questionnaire
The list of open ended questions used for the focus group interviews (see Table 4.2)
began by asking for views on the appropriateness of reaching a mutual understanding among
group members and ended with discussion about proposed new features for better support of
shared knowledge and the reaching of mutual understanding. Questions 2 to 4 addressed
technology and respective usage satisfaction, while questions 5 and 6 addressed the potential
contribution to either overcoming collaborative distance factors or, by contrast, creating even
more collaborative distance.
Ref Questions
Q1 What do you think about mutual understanding as being the essence of collaboration?
Q2 What do you think about the use of Shared Workspaces (Project Spaces)?
Q3 What do you think about the use of Group Blogging (Project Blogs)?
Q4 What do you think about their complementarity?
Q5 What do you think about technologies bridging or compressing various distance factors?
Q6 What do you think about technologies creating even more distance factors?
Q7 What do you think about the usefulness of a collaborative platform?
Q8 What do you think about using emails with attachments for sharing documents?
Q9 What other features would you like to have for better supporting knowledge sharing and mutual understanding among group members?
Table 4.2: List of Questions for the Focus Group Interviews
143
Question 7 referred, in essence, to a synthesis of using a collaboration platform and its
capacity to deal with the various collaborative distance types. Question 8 addressed a crucial and
very sensitive point in the domain of collaborative technology, as people still rely so much on
their e-mail tool that they are often reluctant to use a Shared Workspace tool. Therefore, this
question was intended to get a better understanding of the preference and motivation for e-
mailing, which is only one of the many asynchronous communication tools.
The fourteen focus group interviews corresponded to the fourteen project cases and took
place after their projects at the end of the first semester. For reasons of privacy and
confidentiality, the contents of the projects could not be presented. However, as they all
addressed innovation in various sectors, with specific activities such as technology or
competitiveness study, the projects had the same sort of generic process which, once
personalised, neither interfered in observations nor polluted collected data.
Project tables listing the main relevant points mentioned during the focus group
interviews are presented in appendix B.
4.2.4 Focus Group Project Case P01
• Project team members had difficulties reaching agreement on a shared view about project
goal and objectives. However, they recognised that all project stakeholders should share
their respective knowledge in order to reach a mutual understanding.
• The modelling of the project process, in terms of functional activities (IDEF0) was a
demanding activity. Project participants did not perceive its full benefit from the
beginning besides recognising only the easier production of a Pert diagram and Gantt
diagram, because constraints were already specified in the functional model. Only after
144
some time did it become obvious that sharing a single homogeneous process description
was making the reaching of mutual understanding easier and faster.
• Interestingly, some discussion took place about the classification of content objects,
mainly multi-media documents and links to Web pages, and about the structuration of
their online project space in various folders and sub-folders. Individuals all had their own
approach, and were not willing to make any cognitive effort to learn or adapt to another’s
preferred structure. This situation, incidentally, demonstrated a lack of leadership and
absorptive capacity.
• Finally, several team members suggested using another SW platform with which they
had previously had a good experience.
4.2.5 Focus Group Project Case P02
• Although project goal and objectives were clearly expressed by the customer, a lack of
mutual understanding meant that the project team members had been facing difficulties
in formulating the list of necessary activities to be carried out. After some time it became
obvious that sharing a single homogeneous process description was making the reaching
of mutual understanding of necessary activities easier and faster.
• Project participants perceived the benefit of the central storage of documents right from
the beginning, because it allowed everyone to access up-to-date documents. They stated
that: ‘Normally, we are used to storing documents on USB memory keys, but we realised
that is not an effective way of sharing information.’
• They were not used to blogging, hence they did not realise the full benefit of group
blogging, especially because they were in a project configuration where most team
members were physically collocated. However, they stated that blogging could be
145
complementary to Shared Workspace: ‘Blog entries provide an opportunity to add
specific information related to uploaded material and get comments about them.’
• They found that technologies fully compress collaborative distances such as geographical
and temporal distance types, while introducing another distance type based on the
technology skills of the team members. They stated that relying too much on the use of
technology leads to weak interpersonal relationships, creating relational distance.
• As for the use of the SW platform, one team member had previous experience, which
proved to be useful for the others. They clearly learned from one another, demonstrating
the usefulness of sharing knowledge and the importance of absorptive capacity.
4.2.6 Focus Group Project Case P03
• This project team also had difficulties reaching an agreement on the project goal and
objectives, as well as necessary activities to be carried out. They declared that: ‘The
difficulty to make sure everyone understands the same thing is mostly due to the lack of
time spent on sense-making at the team level.’ They also stated that the risk of
misunderstanding leads to non-coherent work.
• Regarding the modelling of the project process in term of functional activities (IDEF0),
two team members had previous experience, which proved useful for the others. They
clearly learned from one another, demonstrating the usefulness of an open mind and
absorptive capacity. It was still a demanding activity, but due to the previous experience,
participants perceived the benefit of getting a shared functional model right from the
beginning.
• Interestingly, some discussion took place about the classification of content objects and
about the structure of their online project space in various folders and sub-folders. This
146
illustrated the fact that it is painful for anyone to make a higher cognitive effort to
identify and locate the content objects.
• As for the SW platform, after some discussion, they finally stated that the technology and
tools they used did compress geographical and temporal distances, especially for
accessing documents that need to be shared by all project participants. However, it
simultaneously created relational and emotional distances. They also noted the
importance of being sure to use the latest document version on the SW platform.
• On the subject of group blogging, the team members declared it useful for developing a
project culture and awareness about others’ feelings regarding the progress of the project.
Finally, they declared: ‘Sending too many e-mails pollutes everyone’s e-mail box and
makes it very difficult to identify important messages that need a prompt reply.’
4.2.7 Focus Group Project Case P04
• Project team members used the functional modelling (IDEF0) of their project process to
establish a common view on the work to be carried out, allocation of resources and task
responsibilities. They stated that this modelling approach was also very useful for
establishing a trusting dialogue with customers, even if it took time to reach a mutual
understanding among all project stakeholders. Some team members reached a clearer
global view earlier than others, hence the difficulty for everyone to be at the same level
of understanding. They found that this was probably due to their lack of experience.
• The project participants did not find the user interface of the SW platform intuitive
enough, as it lacked an entertaining look and feel. However, they stated that generated
events were useful for being aware of what other team members were doing. It was
difficult to agree the folder structure because everyone wanted to have it his own way,
thereby creating cognitive distance.
147
• Regarding the group blogging feature, they mentioned the complementarity in providing
specific information about uploaded documents and awareness of the latest status. They
also stated that it is useful for providing document links to external participants.
• As for the SW platform, they mentioned the lack of media naturalness for supporting the
building of interpersonal relationships and trust among project stakeholders.
Nevertheless, they recognised the capacity of collaboration technology and tools to
overcome some collaboration barriers induced by distance factors. They declared that: ‘It
is impressive to see the democratic access to all documents and information provided by
the SW platform as it was impossible to retain information.’
4.2.8 Focus Group Project Case P05
• The project team experienced difficulties reaching a mutual understanding due to the fact
that there was no common understanding among team members of the customer needs
and requirements. They decided to set up a meeting with the customer and other project
stakeholders in order to specify all needs and requirements as well as expected
deliverables. Finally, an agreement toward a shared view about project goal and
objectives was established.
• They stated that the modelling of the project process in terms of functional activities
(IDEF0) helped to achieve a mutual understanding of the necessary activities to be
carried out. The use of the group blogging facilitated the discussion with external
participants operating from distributed locations.
• The use of e-mail appeared to be mandatory for informing all project stakeholders at
once whatever their location. The project team noted that sending documents by e-mail
attachment is less efficient than uploading documents on the SW platform.
148
• Regarding the SW platform, team members recognised the usefulness of the central
storage compared to individual approaches (e.g. USB memory stick, CD), allowing for
the compressing of geographical distance and more generally of all structural distance
types. They also mentioned the sharing of documents and information as a very
important aspect for building trust. They referred to the risk of working outside normal
office time, such as over night and weekends, due to the permanent availability of up-to-
date documents on the SW platform from anywhere at any time while there is a free
Internet connection available. While discussing the various distance types and related
factors, they declared: ‘Too much individual work on the SW platform induces a lack of
social activity, which creates relational distance.’
4.2.9 Focus Group Project Case P06
• In this project, team members had difficulties understanding the vocabulary used by
others, especially people representing the customer and external experts, as well as some
student colleagues from different disciplines. Their experience demonstrated that
reaching an agreement on the project goal and objectives is not the real problem, but that
issuing a common vocabulary to enable everyone to understand requires time right from
the beginning of the project.
• They were not able to experiment with group blogging because their customer required a
more formal approach.
• Regarding the SW platform, they stated that both geographical and temporal distances
were properly bridged, but that it created technological distance for those who had never
used it before. They also noted that some difficulties in use were due to the lack of
French language in the user interface, which created a lingual distance.
149
4.2.10 Focus Group Project Case P07
• While discussing the essence of collaboration, project team members stated that: ‘Mutual
understanding is the basis for making sure no-one is going to work in the wrong
direction.’ They also said: ‘Sharing permanent information among project stakeholders
allows seeing what others are doing and how they make progress which is useful for
everyone to adapt his own contribution in the most efficient way.’ This was related to the
use of models for designing the activities to be carried out.
• In their case, group blogging was supplanted by face-to-face interactions. However, they
recognised the interest of having a recorded history of progress in the blog.
• Regarding the SW platform, they appreciated the fact that there was no risk of losing
documents or latest versions. The possibility of seeing the project progress on the basis of
produced documents available on the SW platform was also recognised as an important
element of project awareness, especially for involving external participants. They said
that: ‘It helped to largely overcome structural factors and bridged structural distance
types such as geographical, temporal and organisational distances, while it created more
distance from social aspects such as cultural and relational distance types.’
4.2.11 Focus Group Project Case P08
This project case is special because team members did not use the SW platform
intensively enough to have a real experience. However, students claimed to have used another
SW platform, GoogleDoc, which is available free on the Internet. Their choice to use this SW
platform was justified by the availability of an online document editing feature. The information
they provided during the focus group interview was related to their experience with GoogleDoc;
unfortunately, however, it was not possible to get log data from this platform.
150
• Project team members felt that group blogging is not something well-known and
accepted by people.
• The modelling of the project process in terms of functional activities (IDEF0) was
revealed as very useful for reaching a mutual understanding on the organisation of the
project.
• As for the use of collaboration technology and tools, they stated that these overcome
structural factors such as geographical and organisational dispersion, while creating a
technological barrier for people who are not skilled in the use of ICT tools, as well as
relational and emotional distance types. With reference to emotional aspects, they
concluded that: ‘It could help a person who is too shy to express problems during a face-
to-face meeting.’
4.2.12 Focus Group Project Case P09
• Team members considered the SW platform as a shared storage place to save documents
where they uploaded the final version of their deliverables. This explains why they had a
low number of files uploaded on the SW platform. Like the previous project team, they
said that they used GoogleDoc, with the same motivation of online editing.
• They explained that collaboration technology and tools helped to overcome spatial
distance, albeit only partially due to the lack of a synchronous communication tool on the
SW platform. Nonetheless, they declared that it bridged the temporal distance because
there, the need is for asynchronous communication tools. They found that too much
technology creates a lack of social interaction, because it encourages participants to use
asynchronous communication tools with limited or no level of interaction.
• As for e-mail and attached files for sharing documents, they stated that this is still their
favourite asynchronous communication tool, especially when there is no attachment.
151
4.2.13 Focus Group Project Case P10
• Project team members spontaneously mentioned the use of the modelling approach as a
kind of ‘best practice’ for ensuring that everyone has the same understanding of the
project goal and objectives, as well as necessary activities to be carried out. A common
model of the folders structure on the SW platform was also cited by team members as a
standard for all project stakeholders. They mentioned several times that a mutual
understanding is very important for team cohesiveness.
• Regarding the SW platform, they stated that it contributed to overcoming most of the
structural barriers and bridged all related distance types while simultaneously creating
relational, cultural and technological distances. When discussing distance factors, they
stated that: ‘Everyone does not have the same ICT skills and experience; hence this
explains the need to learn from others and the importance of the absorptive capacity.’
They also mentioned that another type of technological distance was illustrated by the
unavailability of the Internet and access to the Web, due either to the lack, or the high
cost, of a Wifi connection. Finally, they found that it creates a specific online culture with
the inherent risk of becoming addicted.
4.2.14 Focus Group Project Case P11
• Project team members apparently did not recognise the role of mutual understanding.
They declared that it would have been far more interesting to share information among
all projects.
• They found the SW platform useless for team members who were physically collocated,
but useful for project stakeholders who were distributed. They stated that collaboration
tools bridge spatial and temporal distances if and only if an Internet connection is
152
available. Sharing information and documents was recognised by team members as
building trust among project stakeholders, especially with customers.
4.2.15 Focus Group Project Case P12
• Team members did not believe they had reached a mutual understanding; they declared
that they had faced many difficulties reaching an agreement on project goal and
objectives.
• They found that the use of collaboration tools is appropriate only when participants are in
a distributed organisation, because although these tools clearly contribute to compressing
geographical distance, it is necessary to learn how to use them. They also said that the
lack of a video conferencing tool for synchronous communication made the media
naturalness even more difficult. Finally, they used the SW platform as a shared storage
unit.
4.2.16 Focus Group Project Case P13
• Team members stated that the modelling exercise part of the project process revealed that
the mechanics of collaboration is very much dependent on mutual understanding. They
did not face real difficulties reaching an agreement on the necessary activities to be
carried out and came rapidly to a shared view of the project goal and objectives.
• Regarding the use of collaboration technology and tools, they stated that these clearly
contributed to overcoming structural barriers, while introducing a technological barrier
because participants do not necessarily have the same ICT skills. Team members did not
consider the fact that technology creates emotional distance as a negative aspect because
it guards against over-reacting. They found that the usefulness of the SW platform was
unquestionable, especially in terms of sharing documents and being sure of using the
latest version. However, there was a question about what would happen if different SW
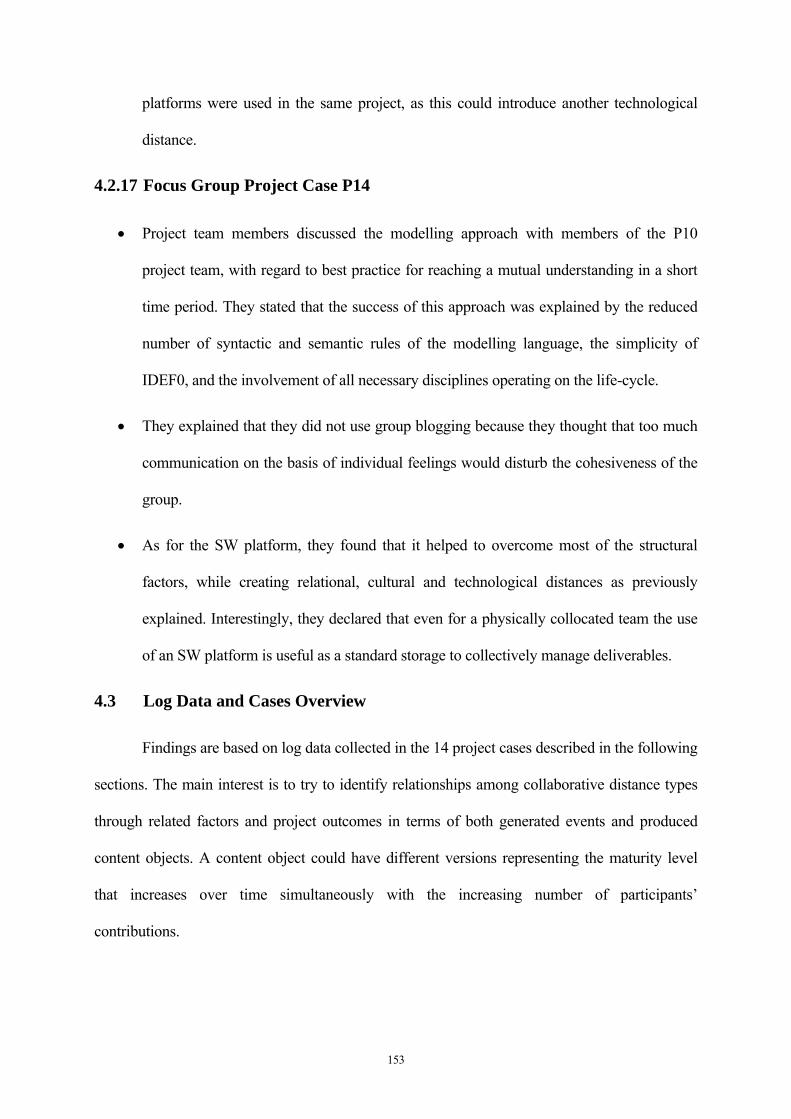
153
platforms were used in the same project, as this could introduce another technological
distance.
4.2.17 Focus Group Project Case P14
• Project team members discussed the modelling approach with members of the P10
project team, with regard to best practice for reaching a mutual understanding in a short
time period. They stated that the success of this approach was explained by the reduced
number of syntactic and semantic rules of the modelling language, the simplicity of
IDEF0, and the involvement of all necessary disciplines operating on the life-cycle.
• They explained that they did not use group blogging because they thought that too much
communication on the basis of individual feelings would disturb the cohesiveness of the
group.
• As for the SW platform, they found that it helped to overcome most of the structural
factors, while creating relational, cultural and technological distances as previously
explained. Interestingly, they declared that even for a physically collocated team the use
of an SW platform is useful as a standard storage to collectively manage deliverables.
4.3 Log Data and Cases Overview
Findings are based on log data collected in the 14 project cases described in the following
sections. The main interest is to try to identify relationships among collaborative distance types
through related factors and project outcomes in terms of both generated events and produced
content objects. A content object could have different versions representing the maturity level
that increases over time simultaneously with the increasing number of participants’
contributions.
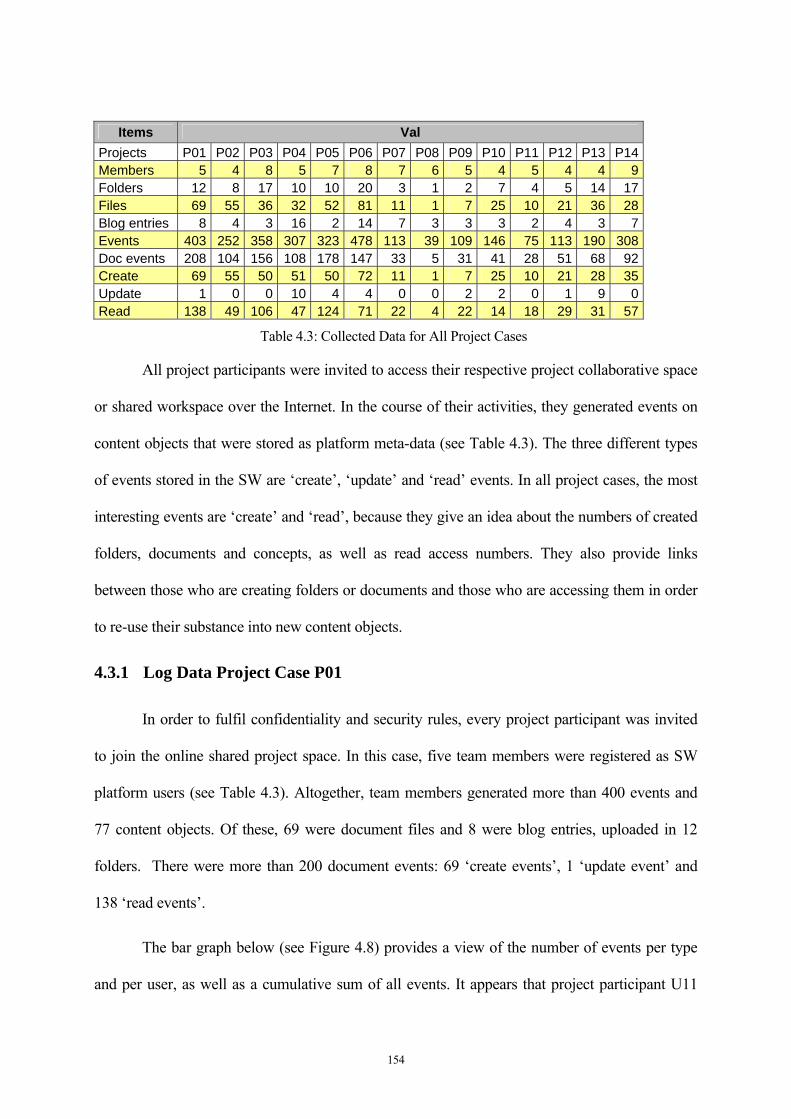
154
Items Val Projects P01 P02 P03 P04 P05 P06 P07 P08 P09 P10 P11 P12 P13 P14 Members 5 4 8 5 7 8 7 6 5 4 5 4 4 9 Folders 12 8 17 10 10 20 3 1 2 7 4 5 14 17 Files 69 55 36 32 52 81 11 1 7 25 10 21 36 28 Blog entries 8 4 3 16 2 14 7 3 3 3 2 4 3 7 Events 403 252 358 307 323 478 113 39 109 146 75 113 190 308 Doc events 208 104 156 108 178 147 33 5 31 41 28 51 68 92 Create 69 55 50 51 50 72 11 1 7 25 10 21 28 35 Update 1 0 0 10 4 4 0 0 2 2 0 1 9 0 Read 138 49 106 47 124 71 22 4 22 14 18 29 31 57
Table 4.3: Collected Data for All Project Cases
All project participants were invited to access their respective project collaborative space
or shared workspace over the Internet. In the course of their activities, they generated events on
content objects that were stored as platform meta-data (see Table 4.3). The three different types
of events stored in the SW are ‘create’, ‘update’ and ‘read’ events. In all project cases, the most
interesting events are ‘create’ and ‘read’, because they give an idea about the numbers of created
folders, documents and concepts, as well as read access numbers. They also provide links
between those who are creating folders or documents and those who are accessing them in order
to re-use their substance into new content objects.
4.3.1 Log Data Project Case P01
In order to fulfil confidentiality and security rules, every project participant was invited
to join the online shared project space. In this case, five team members were registered as SW
platform users (see Table 4.3). Altogether, team members generated more than 400 events and
77 content objects. Of these, 69 were document files and 8 were blog entries, uploaded in 12
folders. There were more than 200 document events: 69 ‘create events’, 1 ‘update event’ and
138 ‘read events’.
The bar graph below (see Figure 4.8) provides a view of the number of events per type
and per user, as well as a cumulative sum of all events. It appears that project participant U11
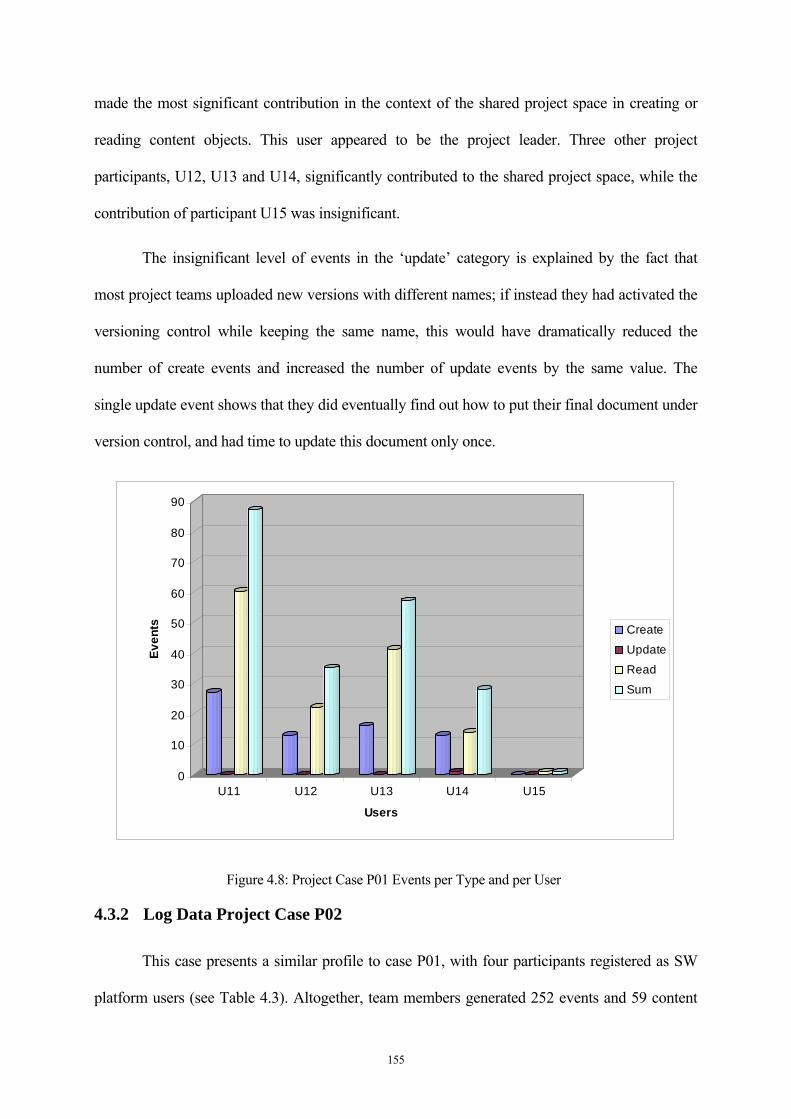
155
made the most significant contribution in the context of the shared project space in creating or
reading content objects. This user appeared to be the project leader. Three other project
participants, U12, U13 and U14, significantly contributed to the shared project space, while the
contribution of participant U15 was insignificant.
The insignificant level of events in the ‘update’ category is explained by the fact that
most project teams uploaded new versions with different names; if instead they had activated the
versioning control while keeping the same name, this would have dramatically reduced the
number of create events and increased the number of update events by the same value. The
single update event shows that they did eventually find out how to put their final document under
version control, and had time to update this document only once.
0
10
20
30
40
50
60
70
80
90
Even
ts
U11 U12 U13 U14 U15
Users
Create
Update
Read
Sum
Figure 4.8: Project Case P01 Events per Type and per User
4.3.2 Log Data Project Case P02
This case presents a similar profile to case P01, with four participants registered as SW
platform users (see Table 4.3). Altogether, team members generated 252 events and 59 content
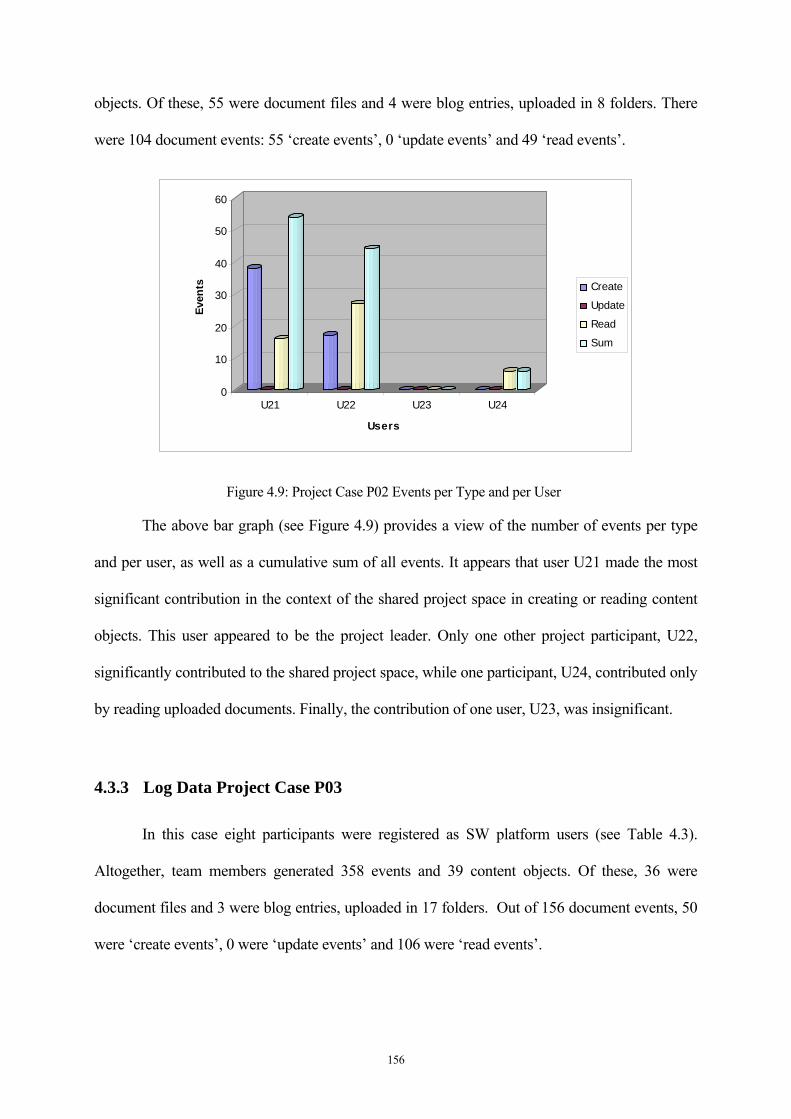
156
objects. Of these, 55 were document files and 4 were blog entries, uploaded in 8 folders. There
were 104 document events: 55 ‘create events’, 0 ‘update events’ and 49 ‘read events’.
0
10
20
30
40
50
60Ev
ents
U21 U22 U23 U24
Users
Create
Update
Read
Sum
Figure 4.9: Project Case P02 Events per Type and per User
The above bar graph (see Figure 4.9) provides a view of the number of events per type
and per user, as well as a cumulative sum of all events. It appears that user U21 made the most
significant contribution in the context of the shared project space in creating or reading content
objects. This user appeared to be the project leader. Only one other project participant, U22,
significantly contributed to the shared project space, while one participant, U24, contributed only
by reading uploaded documents. Finally, the contribution of one user, U23, was insignificant.
4.3.3 Log Data Project Case P03
In this case eight participants were registered as SW platform users (see Table 4.3).
Altogether, team members generated 358 events and 39 content objects. Of these, 36 were
document files and 3 were blog entries, uploaded in 17 folders. Out of 156 document events, 50
were ‘create events’, 0 were ‘update events’ and 106 were ‘read events’.

157
The following bar graph (see Figure 4.10) illustrates the number of events per type and
per user as well as a cumulative sum of all events. It is clear from the graph that user U33 made
the most significant contribution in the context of the shared project space in creating and
reading content objects. This user appeared to be the project leader. Three other project
participants, U31, U32 and U34, significantly contributed to the shared project space, while
participants U35 and U36 contributed mainly by reading uploaded documents.
0
5
10
15
20
25
30
35
40
45
Even
ts
U31 U32 U33 U34 U35 U36
Users
Create
Update
Read
Sum
Figure 4.10: Project Case P03 Events per Type and per User
4.3.4 Log Data Project Case P04
In this case five participants registered as SW platform users (see Table 4.3) generated
307 events and 48 content objects. Of these, 32 were document files and 16 were blog entries,
uploaded in 10 folders. There were 108 document events: 51 create events, 10 update events and
47 read events.
Interestingly, in this case, project participants generated 10 update events. This
demonstrates that they reached the appropriate level of knowledge on how to use the versioning

158
feature on the SW platform. This meant that they created fewer documents corresponding to new
versions, which explains the 32 files compared to the 16 blog entries. If they had not used the
versioning or generated any update event, they would have created 32 files and 10 blog entries, a
total of 42 content objects.
0
10
20
30
40
50
60
70
80
90
Even
ts
U41 U42 U43 U44 U45
Users
Create
Update
Read
Sum
Figure 4.11: Project Case P04 Events per Type and per User
The above bar graph (see Figure 4.11) provides a view of the number of events per type
and per user, as well as a cumulative sum of all events. It appears that user U41 made the most
significant contribution in the context of the shared project space in creating, updating and
reading content objects. This user appeared to be the leader of the shared project space, as no
other participant made a significant contribution in terms of document creation. One project
participant, U44, made an insignificant contribution, while three others, U42, U43 and U45,
contributed solely by reading uploaded documents. In this case, the team had decided that only
one participant would be allowed to create folders and upload (create) documents on the SW
platform.
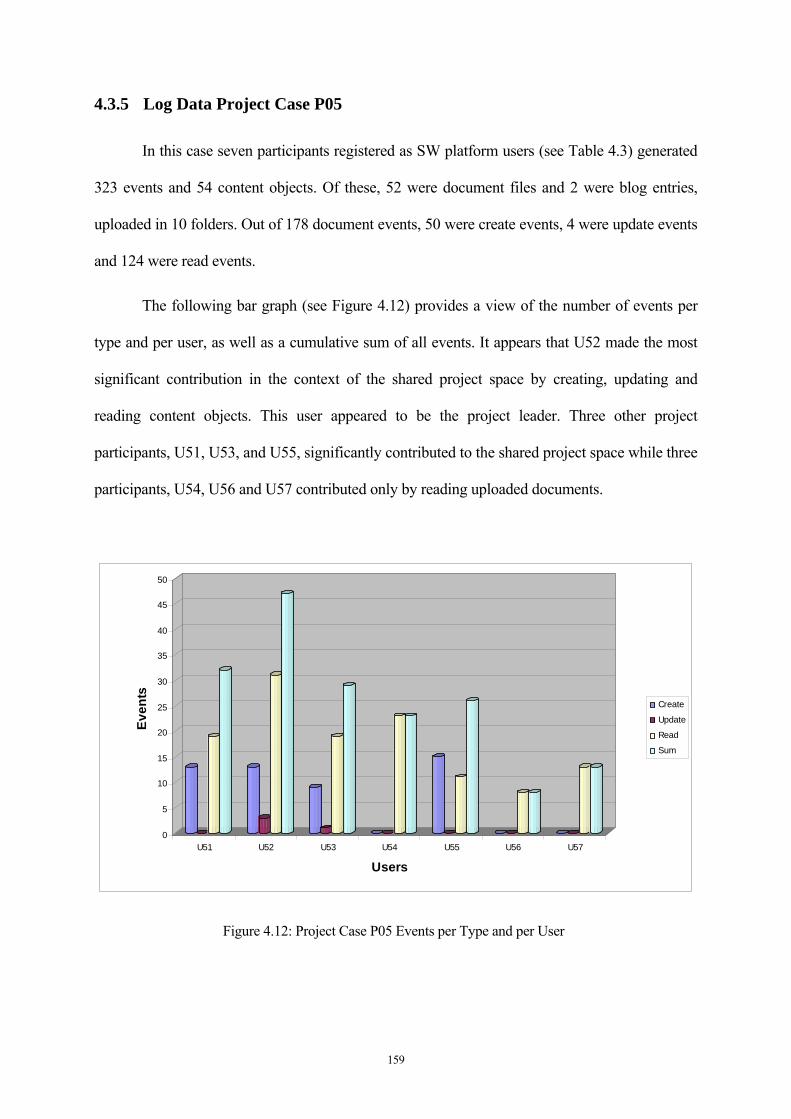
159
4.3.5 Log Data Project Case P05
In this case seven participants registered as SW platform users (see Table 4.3) generated
323 events and 54 content objects. Of these, 52 were document files and 2 were blog entries,
uploaded in 10 folders. Out of 178 document events, 50 were create events, 4 were update events
and 124 were read events.
The following bar graph (see Figure 4.12) provides a view of the number of events per
type and per user, as well as a cumulative sum of all events. It appears that U52 made the most
significant contribution in the context of the shared project space by creating, updating and
reading content objects. This user appeared to be the project leader. Three other project
participants, U51, U53, and U55, significantly contributed to the shared project space while three
participants, U54, U56 and U57 contributed only by reading uploaded documents.
0
5
10
15
20
25
30
35
40
45
50
Even
ts
U51 U52 U53 U54 U55 U56 U57
Users
Create
Update
Read
Sum
Figure 4.12: Project Case P05 Events per Type and per User
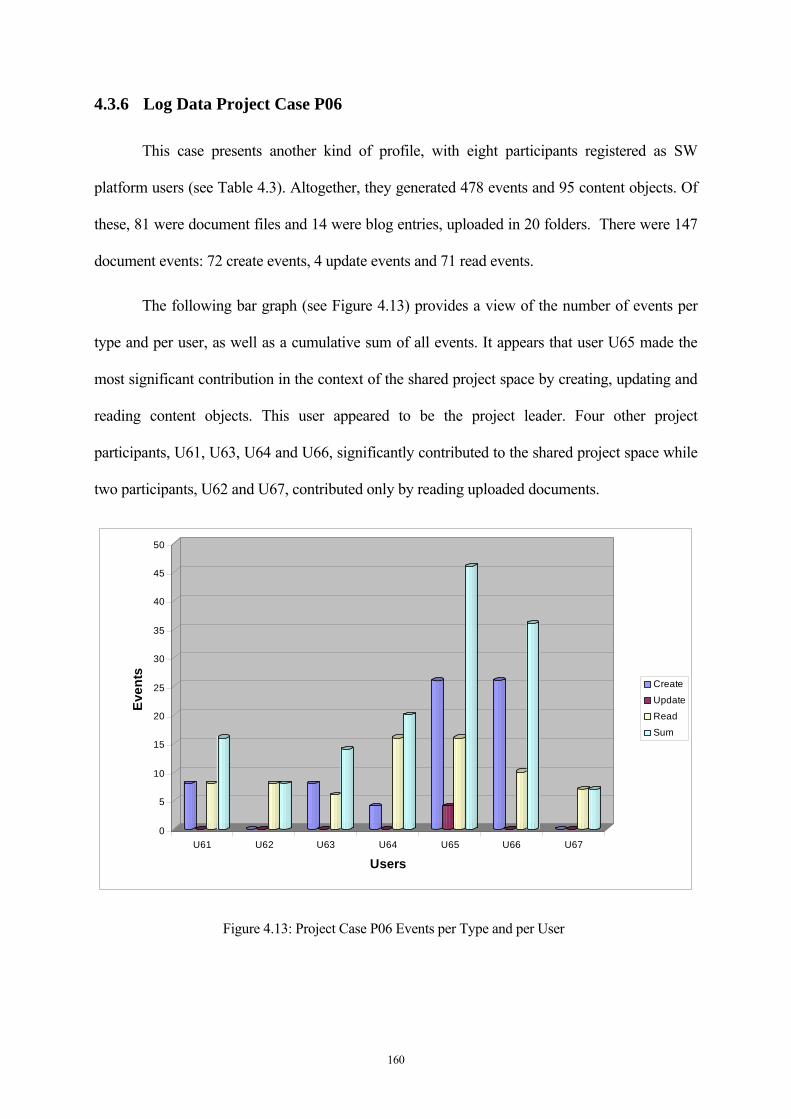
160
4.3.6 Log Data Project Case P06
This case presents another kind of profile, with eight participants registered as SW
platform users (see Table 4.3). Altogether, they generated 478 events and 95 content objects. Of
these, 81 were document files and 14 were blog entries, uploaded in 20 folders. There were 147
document events: 72 create events, 4 update events and 71 read events.
The following bar graph (see Figure 4.13) provides a view of the number of events per
type and per user, as well as a cumulative sum of all events. It appears that user U65 made the
most significant contribution in the context of the shared project space by creating, updating and
reading content objects. This user appeared to be the project leader. Four other project
participants, U61, U63, U64 and U66, significantly contributed to the shared project space while
two participants, U62 and U67, contributed only by reading uploaded documents.
0
5
10
15
20
25
30
35
40
45
50
Even
ts
U61 U62 U63 U64 U65 U66 U67
Users
Create
UpdateRead
Sum
Figure 4.13: Project Case P06 Events per Type and per User
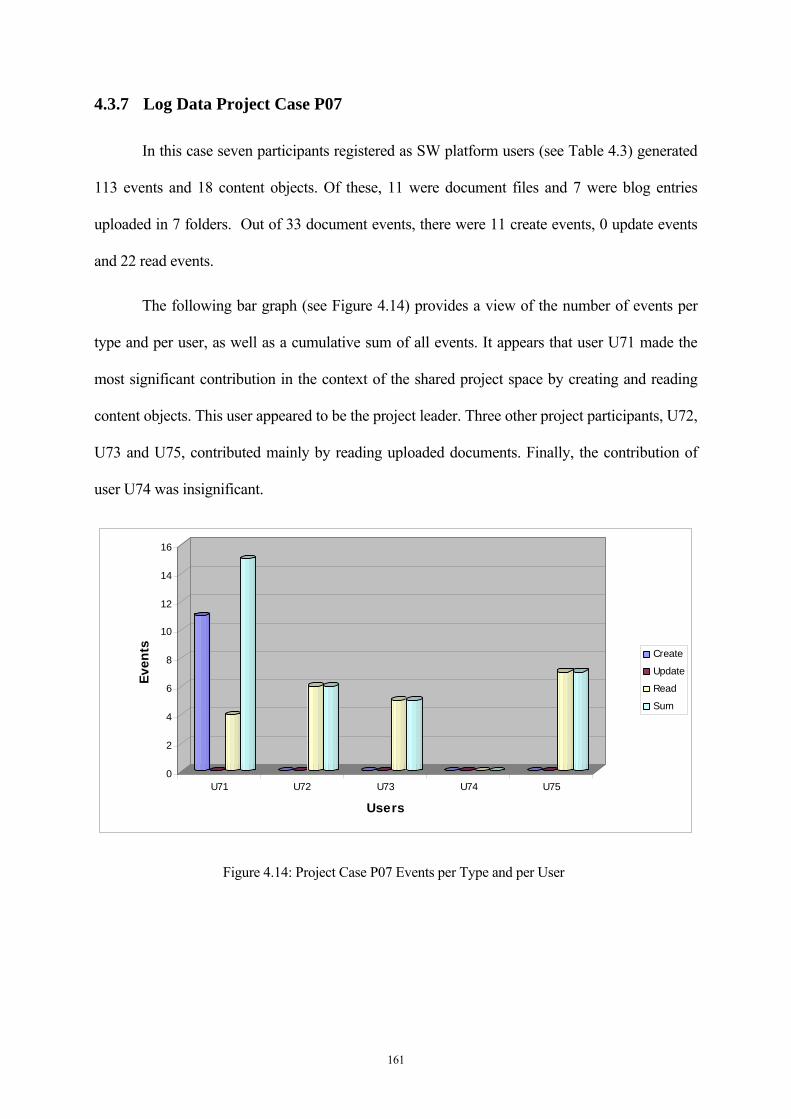
161
4.3.7 Log Data Project Case P07
In this case seven participants registered as SW platform users (see Table 4.3) generated
113 events and 18 content objects. Of these, 11 were document files and 7 were blog entries
uploaded in 7 folders. Out of 33 document events, there were 11 create events, 0 update events
and 22 read events.
The following bar graph (see Figure 4.14) provides a view of the number of events per
type and per user, as well as a cumulative sum of all events. It appears that user U71 made the
most significant contribution in the context of the shared project space by creating and reading
content objects. This user appeared to be the project leader. Three other project participants, U72,
U73 and U75, contributed mainly by reading uploaded documents. Finally, the contribution of
user U74 was insignificant.
0
2
4
6
8
10
12
14
16
Even
ts
U71 U72 U73 U74 U75
Users
Create
Update
Read
Sum
Figure 4.14: Project Case P07 Events per Type and per User
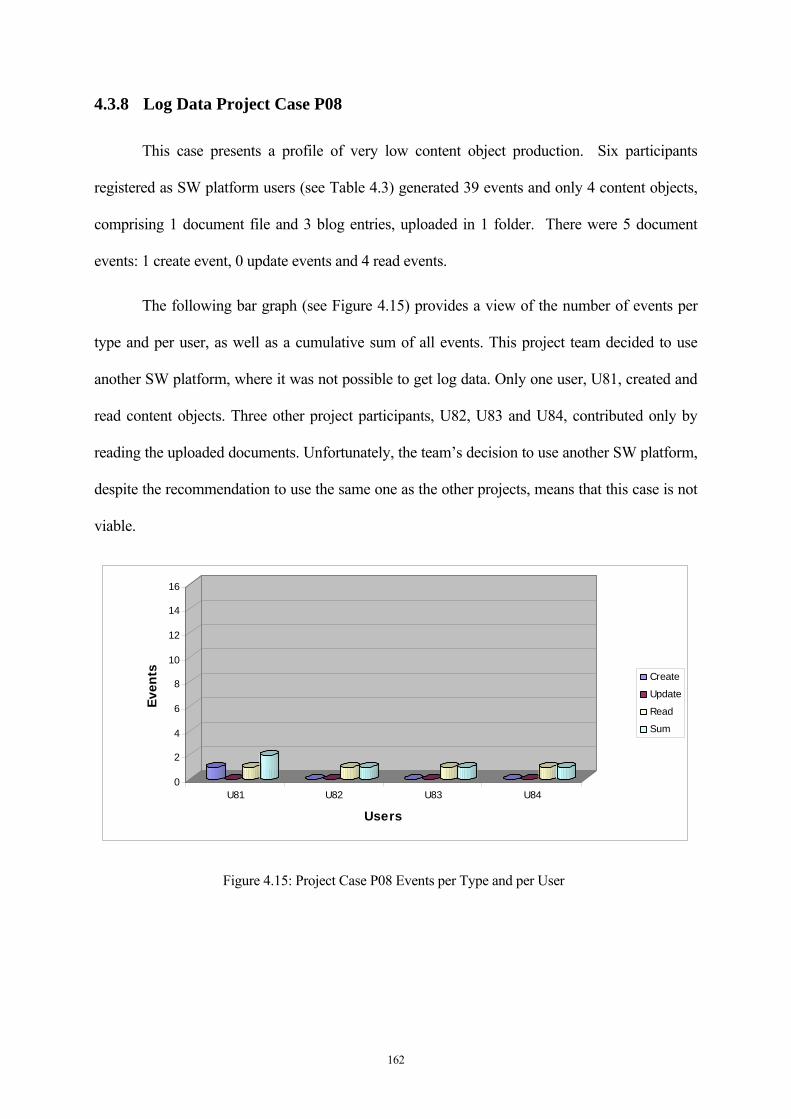
162
4.3.8 Log Data Project Case P08
This case presents a profile of very low content object production. Six participants
registered as SW platform users (see Table 4.3) generated 39 events and only 4 content objects,
comprising 1 document file and 3 blog entries, uploaded in 1 folder. There were 5 document
events: 1 create event, 0 update events and 4 read events.
The following bar graph (see Figure 4.15) provides a view of the number of events per
type and per user, as well as a cumulative sum of all events. This project team decided to use
another SW platform, where it was not possible to get log data. Only one user, U81, created and
read content objects. Three other project participants, U82, U83 and U84, contributed only by
reading the uploaded documents. Unfortunately, the team’s decision to use another SW platform,
despite the recommendation to use the same one as the other projects, means that this case is not
viable.
0
2
4
6
8
10
12
14
16
Even
ts
U81 U82 U83 U84
Users
Create
Update
Read
Sum
Figure 4.15: Project Case P08 Events per Type and per User
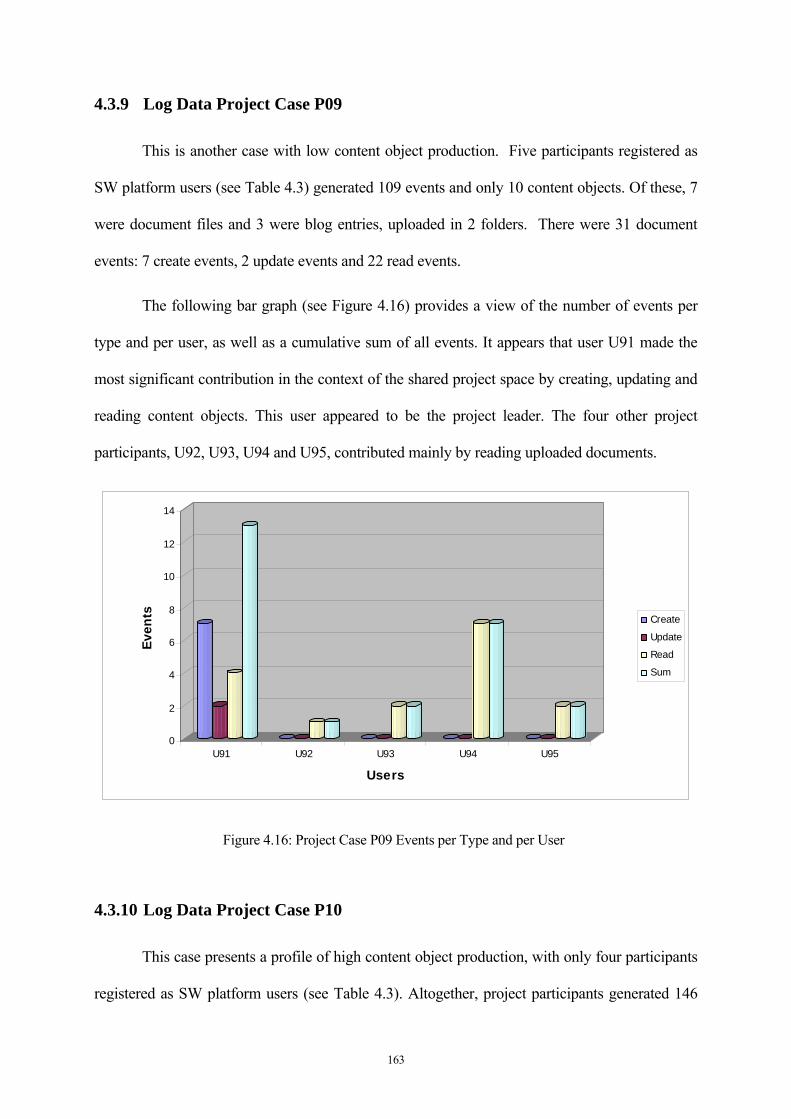
163
4.3.9 Log Data Project Case P09
This is another case with low content object production. Five participants registered as
SW platform users (see Table 4.3) generated 109 events and only 10 content objects. Of these, 7
were document files and 3 were blog entries, uploaded in 2 folders. There were 31 document
events: 7 create events, 2 update events and 22 read events.
The following bar graph (see Figure 4.16) provides a view of the number of events per
type and per user, as well as a cumulative sum of all events. It appears that user U91 made the
most significant contribution in the context of the shared project space by creating, updating and
reading content objects. This user appeared to be the project leader. The four other project
participants, U92, U93, U94 and U95, contributed mainly by reading uploaded documents.
0
2
4
6
8
10
12
14
Even
ts
U91 U92 U93 U94 U95
Users
Create
Update
Read
Sum
Figure 4.16: Project Case P09 Events per Type and per User
4.3.10 Log Data Project Case P10
This case presents a profile of high content object production, with only four participants
registered as SW platform users (see Table 4.3). Altogether, project participants generated 146
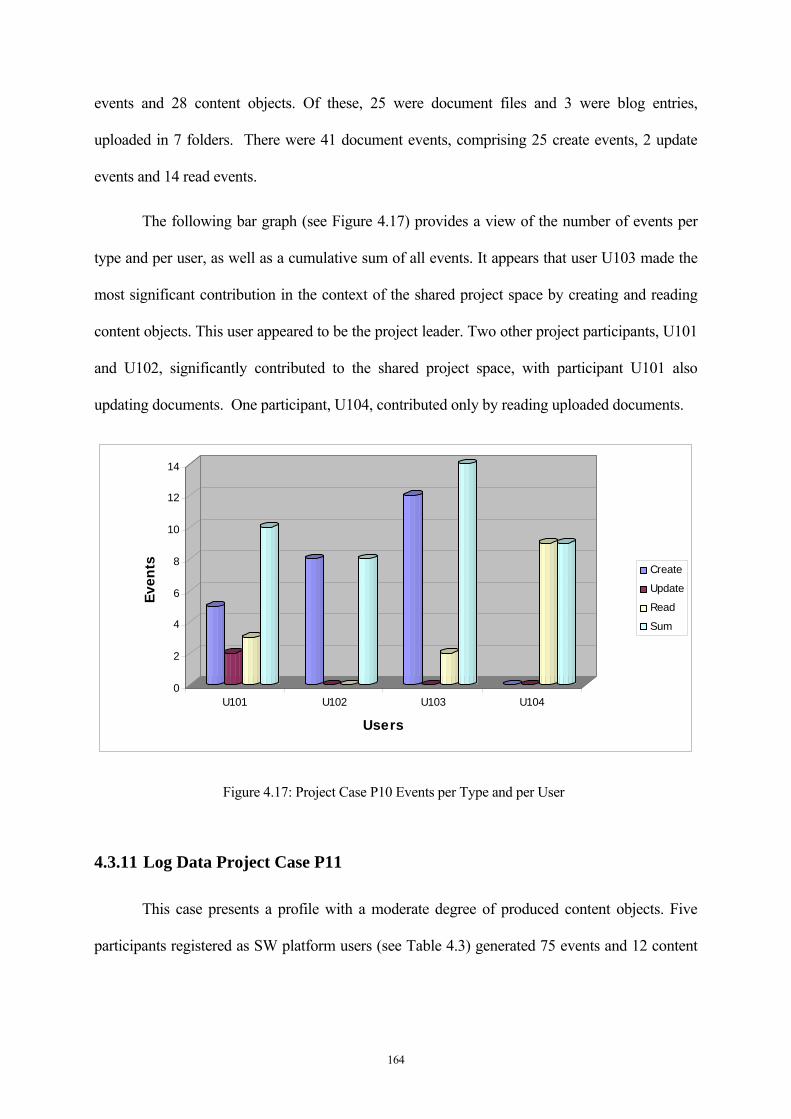
164
events and 28 content objects. Of these, 25 were document files and 3 were blog entries,
uploaded in 7 folders. There were 41 document events, comprising 25 create events, 2 update
events and 14 read events.
The following bar graph (see Figure 4.17) provides a view of the number of events per
type and per user, as well as a cumulative sum of all events. It appears that user U103 made the
most significant contribution in the context of the shared project space by creating and reading
content objects. This user appeared to be the project leader. Two other project participants, U101
and U102, significantly contributed to the shared project space, with participant U101 also
updating documents. One participant, U104, contributed only by reading uploaded documents.
0
2
4
6
8
10
12
14
Even
ts
U101 U102 U103 U104
Users
Create
Update
Read
Sum
Figure 4.17: Project Case P10 Events per Type and per User
4.3.11 Log Data Project Case P11
This case presents a profile with a moderate degree of produced content objects. Five
participants registered as SW platform users (see Table 4.3) generated 75 events and 12 content

165
objects. Of these, 10 were document files and 2 were blog entries, uploaded in 4 folders. There
were 28 document events: 10 create events, 0 update events and 18 read events.
The following bar graph (see Figure 4.18) provides a view of the number of events per
type and per user, as well as a cumulative sum of all events. It appears that user U113 made the
most significant contribution in the context of the shared project space by creating and reading
content objects. This user appeared to be the project leader. Two other project participants, U111
and U112, significantly contributed to the shared project space, while two participants, U114 and
U115, contributed mainly by reading uploaded documents.
0
2
4
6
8
10
12
14
Even
ts
U111 U112 U113 U114 U115
Users
Create
Update
Read
Sum
Figure 4.18: Project Case P11 Events per Type and per User
4.3.12 Log Data Project Case P12
This case also presents a profile with a moderate degree of produced content objects.
Four participants registered as SW platform users (see Table 4.3) generated 113 events and 25
content objects. Of these, 21 were document files and 4 were blog entries, uploaded in 5 folders.
There were 51 document events, comprising 21 create events, 1 update event and 29 read events.
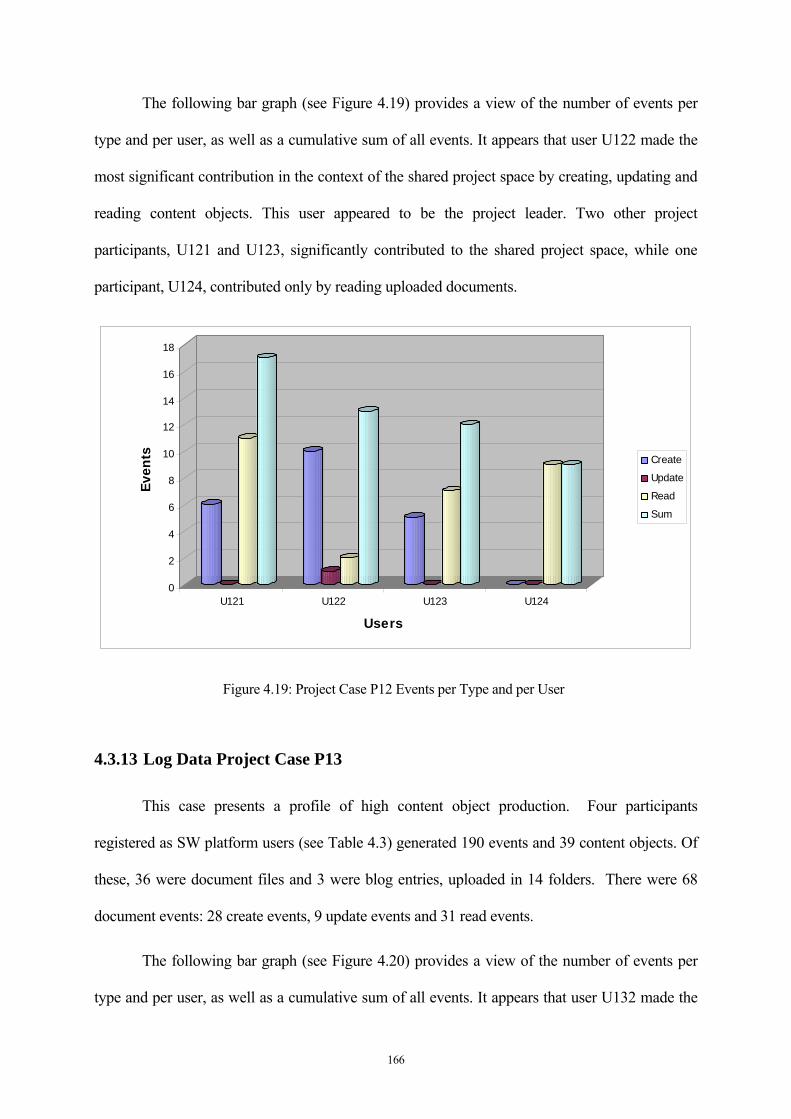
166
The following bar graph (see Figure 4.19) provides a view of the number of events per
type and per user, as well as a cumulative sum of all events. It appears that user U122 made the
most significant contribution in the context of the shared project space by creating, updating and
reading content objects. This user appeared to be the project leader. Two other project
participants, U121 and U123, significantly contributed to the shared project space, while one
participant, U124, contributed only by reading uploaded documents.
0
2
4
6
8
10
12
14
16
18
Even
ts
U121 U122 U123 U124
Users
Create
Update
Read
Sum
Figure 4.19: Project Case P12 Events per Type and per User
4.3.13 Log Data Project Case P13
This case presents a profile of high content object production. Four participants
registered as SW platform users (see Table 4.3) generated 190 events and 39 content objects. Of
these, 36 were document files and 3 were blog entries, uploaded in 14 folders. There were 68
document events: 28 create events, 9 update events and 31 read events.
The following bar graph (see Figure 4.20) provides a view of the number of events per
type and per user, as well as a cumulative sum of all events. It appears that user U132 made the

167
most significant contribution in the context of the shared project space by creating, updating and
reading content objects. This user appeared to be the project leader. Two other project
participants, U131 and U134, contributed mainly by reading uploaded documents, although
U131 also created documents. Finally, participant U133 made an insignificant contribution.
0
5
10
15
20
25
30
35
40
Even
ts
U131 U132 U133 U134
Users
CreateUpdateReadSum
Figure 4.20: Project Case P13 Events per Type and per User
4.3.14 Log Data Project Case P14
This case presents a profile of reasonably high content object production. Nine
participants registered as SW platform users (see Table 4.3) generated 308 events and 35 content
objects. Of these, 28 were document files and 7 were blog entries, uploaded in 17 folders. There
were 92 document events, comprising 35 create events, 0 update events and 57 read events.
The following bar graph (see Figure 4.21) provides a view of the number of events per
type and per user, as well as a cumulative sum of all events. It appears that user U146 made the
most significant contribution in the context of the shared project space by creating and reading
content objects. This user appeared to be the project leader. Five other project participants, U141,
U142, U143, U144 and U148, significantly contributed to the shared project space while two
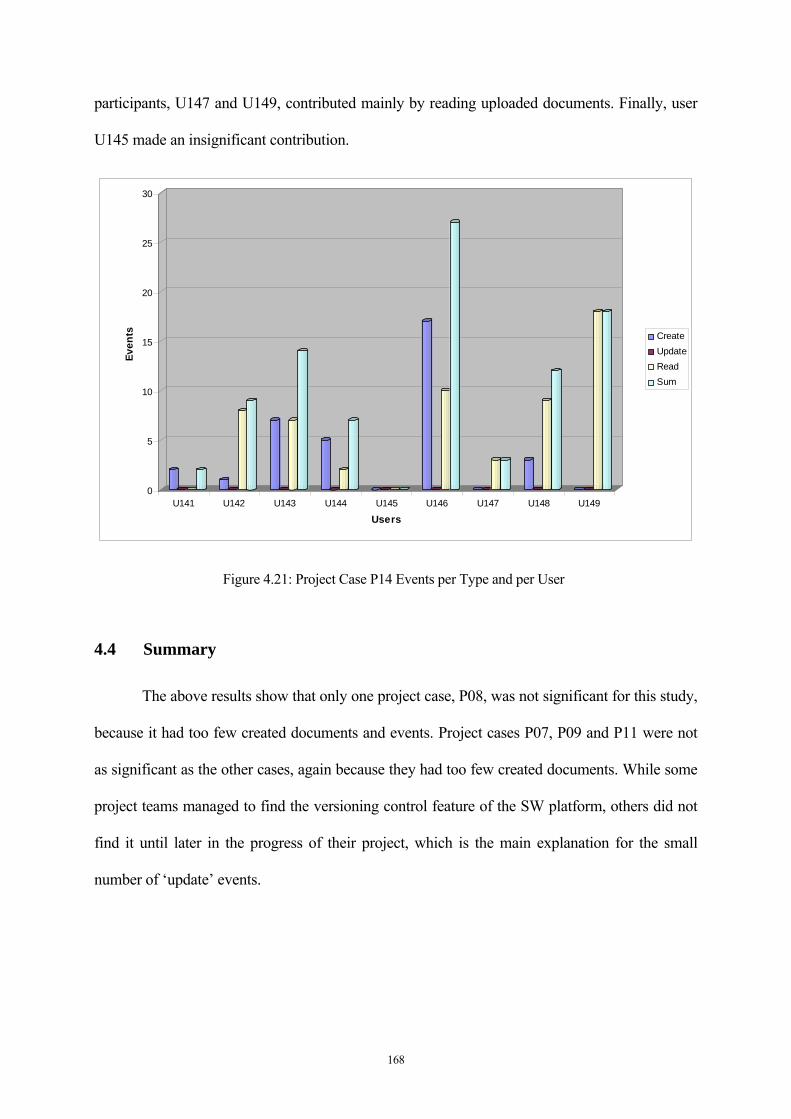
168
participants, U147 and U149, contributed mainly by reading uploaded documents. Finally, user
U145 made an insignificant contribution.
0
5
10
15
20
25
30
Even
ts
U141 U142 U143 U144 U145 U146 U147 U148 U149
Users
CreateUpdateReadSum
Figure 4.21: Project Case P14 Events per Type and per User
4.4 Summary
The above results show that only one project case, P08, was not significant for this study,
because it had too few created documents and events. Project cases P07, P09 and P11 were not
as significant as the other cases, again because they had too few created documents. While some
project teams managed to find the versioning control feature of the SW platform, others did not
find it until later in the progress of their project, which is the main explanation for the small
number of ‘update’ events.
169
Chapter 5. Data Analysis and Discussion
R e s e a r c h i s t o s e e w h a t e v e r y b o d y e l s e h a s s e e n ,
a n d t o t h i n k w h a t n o b o d y e l s e h a s t h o u g h t . -
A l b e r t S z e n t - G y o r g y i
This chapter analyses the survey findings on collaboration barriers, and classifies them
into three categories according to their respective impacts. It also presents the analysis of the
focus group interviews and comparative cases log data, and compares what participants said they
had done (FGI) with what they really did (log data). The chapter discusses the different distance
types within each specific dimension, summarising the discussion through the four dimensions of
the CDF. Finally, it discusses the outcome in terms of resulting collaboration performance for all
projects, explores the possibility of confronting distance factors with CWE, and introduces a
comparison with other relevant surveys and studies on collaboration.

170
5.1 Survey Analysis
Among the 25 collaboration barriers mentioned in this survey, five barriers rated as
having ‘major impact’ were considered by respondents to be most significant. Next, 15 barriers
rated as having ‘average impact’ were considered to be significant. Finally, four barriers rated as
having ‘minor impact’ were considered by respondents to be less significant.
5.1.1 Major Impact Barriers
Figure 5.1 below shows that of those barriers rated as having a major impact on
collaboration performance, three received an absolute majority of votes. Two barriers, namely
‘lack of clear leadership’ (73%) and ‘lack of mutual trust’ (65%), were considered by
respondents to be the most significant by far.
0% 10% 20% 30% 40% 50% 60% 70% 80%
1.6 Lack of clear leadership
2.6 Lack of mutual trust
1.7 Lack of incentive
4.1 Unbalanced IPR approach
3.2 Lack of common description
3.4 Lack of meaning
Major impact %
Figure 5.1: Major Impact Barriers
The third, ‘lack of incentive’, also received an absolute majority of votes with 51%. This
is logical because the ‘lack of incentive’ governs the collaborative attitude of group members. In
this survey, lack of clear leadership was mentioned as a potential barrier, contributing to
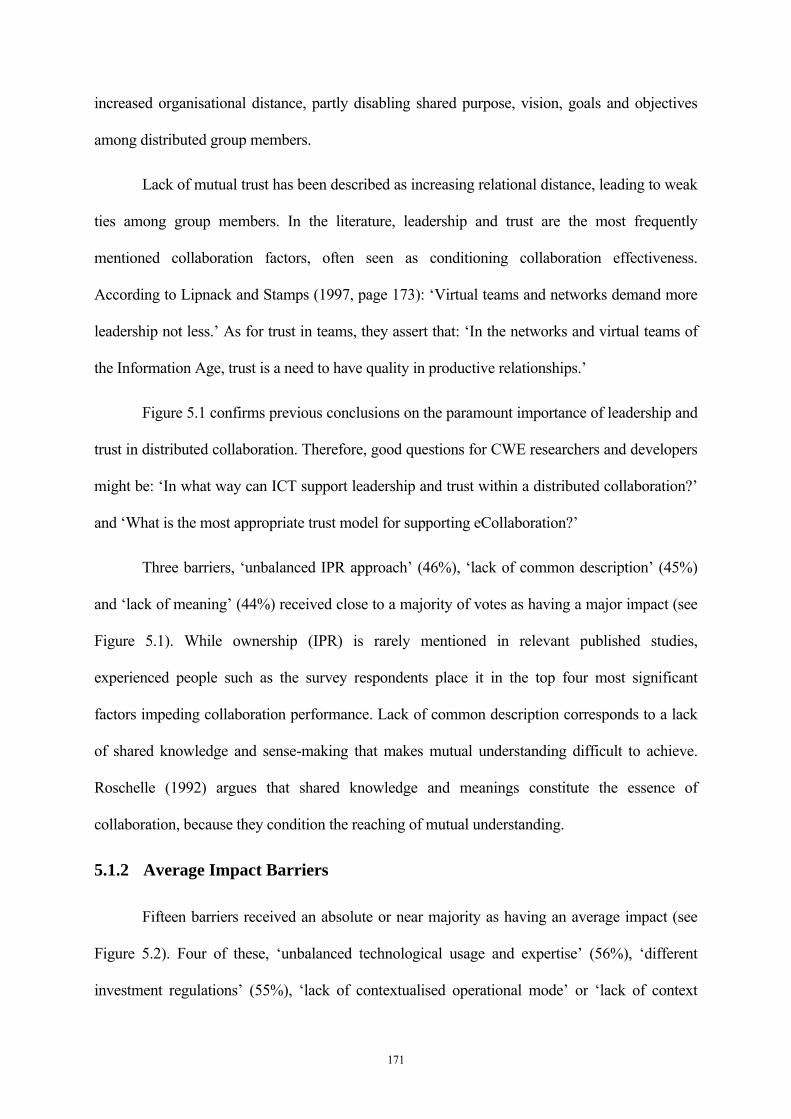
171
increased organisational distance, partly disabling shared purpose, vision, goals and objectives
among distributed group members.
Lack of mutual trust has been described as increasing relational distance, leading to weak
ties among group members. In the literature, leadership and trust are the most frequently
mentioned collaboration factors, often seen as conditioning collaboration effectiveness.
According to Lipnack and Stamps (1997, page 173): ‘Virtual teams and networks demand more
leadership not less.’ As for trust in teams, they assert that: ‘In the networks and virtual teams of
the Information Age, trust is a need to have quality in productive relationships.’
Figure 5.1 confirms previous conclusions on the paramount importance of leadership and
trust in distributed collaboration. Therefore, good questions for CWE researchers and developers
might be: ‘In what way can ICT support leadership and trust within a distributed collaboration?’
and ‘What is the most appropriate trust model for supporting eCollaboration?’
Three barriers, ‘unbalanced IPR approach’ (46%), ‘lack of common description’ (45%)
and ‘lack of meaning’ (44%) received close to a majority of votes as having a major impact (see
Figure 5.1). While ownership (IPR) is rarely mentioned in relevant published studies,
experienced people such as the survey respondents place it in the top four most significant
factors impeding collaboration performance. Lack of common description corresponds to a lack
of shared knowledge and sense-making that makes mutual understanding difficult to achieve.
Roschelle (1992) argues that shared knowledge and meanings constitute the essence of
collaboration, because they condition the reaching of mutual understanding.
5.1.2 Average Impact Barriers
Fifteen barriers received an absolute or near majority as having an average impact (see
Figure 5.2). Four of these, ‘unbalanced technological usage and expertise’ (56%), ‘different
investment regulations’ (55%), ‘lack of contextualised operational mode’ or ‘lack of context
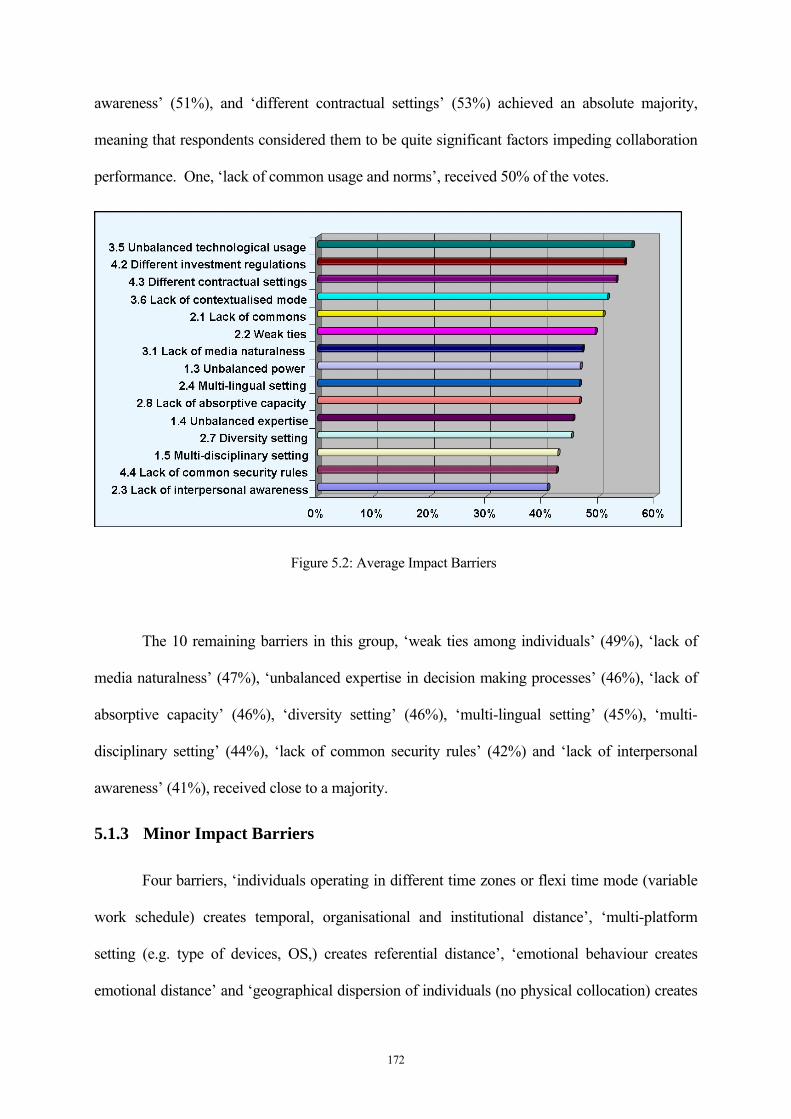
172
awareness’ (51%), and ‘different contractual settings’ (53%) achieved an absolute majority,
meaning that respondents considered them to be quite significant factors impeding collaboration
performance. One, ‘lack of common usage and norms’, received 50% of the votes.
Figure 5.2: Average Impact Barriers
The 10 remaining barriers in this group, ‘weak ties among individuals’ (49%), ‘lack of
media naturalness’ (47%), ‘unbalanced expertise in decision making processes’ (46%), ‘lack of
absorptive capacity’ (46%), ‘diversity setting’ (46%), ‘multi-lingual setting’ (45%), ‘multi-
disciplinary setting’ (44%), ‘lack of common security rules’ (42%) and ‘lack of interpersonal
awareness’ (41%), received close to a majority.
5.1.3 Minor Impact Barriers
Four barriers, ‘individuals operating in different time zones or flexi time mode (variable
work schedule) creates temporal, organisational and institutional distance’, ‘multi-platform
setting (e.g. type of devices, OS,) creates referential distance’, ‘emotional behaviour creates
emotional distance’ and ‘geographical dispersion of individuals (no physical collocation) creates

173
spatial, organisational and institutional distance’, received close to a majority as having a minor
impact (see Figure 5.3). They were considered by respondents to be less significant factors
impeding collaboration performance.
Figure 5.3: Minor Impact Barriers
Most of the respondents seemed to be convinced of the benefits of flexible work
arrangements, such as remote working from home, travelling environment (e.g. train, plane or
hotel), meeting place or event location. Such arrangements are already being implemented, often
based on the motivation of cost-cutting and increased productivity due to less wasted time. For
example, there is no need for the knowledge worker to travel every day to the office, as he could
decide to carry out his tasks from his home office, customers’ sites or even suppliers’ premises.
This has a clear benefit for the organisation in terms of cost-cutting and increased mobility, and
for employees in terms of freedom and self-organisation.
In fact, a large majority of experienced people, such as the survey respondents, believe
that future online shared workspaces will better integrate social, learning and work activities.
This is due especially to flexible working time, allowing knowledge workers to decide to engage
in social activities or take learning breaks over the Internet as needed.

174
5.1.4 Analysis per Collaborative Distance Dimension
The tables below present the various factors leading to collaboration barriers, organised
according to the four dimensions of the Collaborative Distance Framework. In the first table, the
corresponding collaborative distance types are indicated for all collaboration barriers categorised
by dimensions (see Table 5.1).
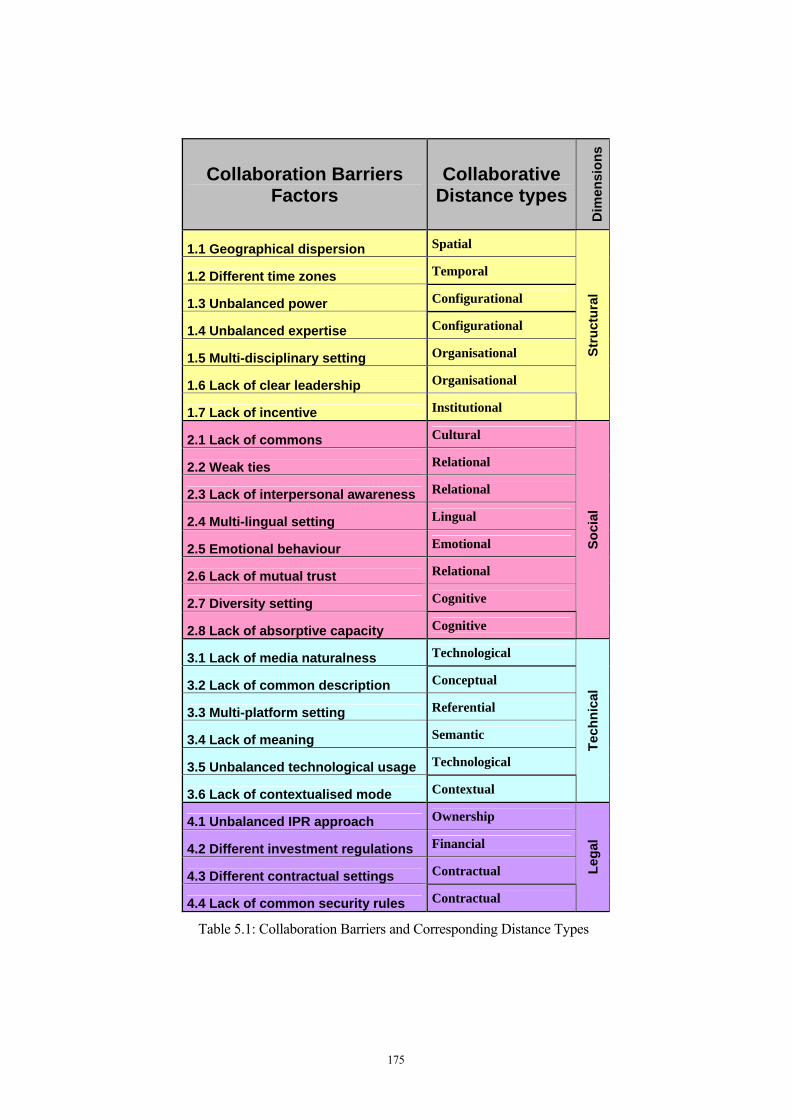
175
Collaboration Barriers Factors
Collaborative Distance types
Dim
ensi
ons
1.1 Geographical dispersion Spatial
1.2 Different time zones Temporal
1.3 Unbalanced power Configurational
1.4 Unbalanced expertise Configurational
1.5 Multi-disciplinary setting Organisational
1.6 Lack of clear leadership Organisational
1.7 Lack of incentive Institutional
Stru
ctur
al
2.1 Lack of commons Cultural
2.2 Weak ties Relational
2.3 Lack of interpersonal awareness Relational
2.4 Multi-lingual setting Lingual
2.5 Emotional behaviour Emotional
2.6 Lack of mutual trust Relational
2.7 Diversity setting Cognitive
2.8 Lack of absorptive capacity Cognitive
Soci
al
3.1 Lack of media naturalness Technological
3.2 Lack of common description Conceptual
3.3 Multi-platform setting Referential
3.4 Lack of meaning Semantic
3.5 Unbalanced technological usage Technological
3.6 Lack of contextualised mode Contextual
Tech
nica
l
4.1 Unbalanced IPR approach Ownership
4.2 Different investment regulations Financial
4.3 Different contractual settings Contractual
4.4 Lack of common security rules Contractual
Lega
l
Table 5.1: Collaboration Barriers and Corresponding Distance Types
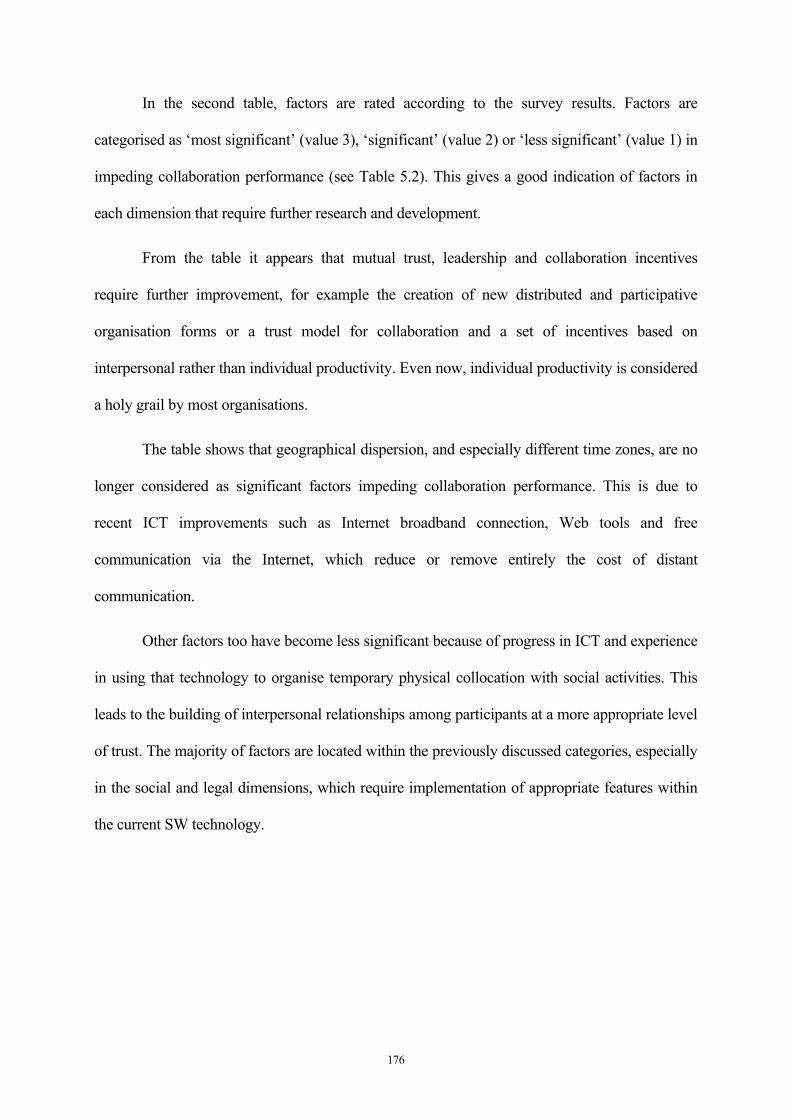
176
In the second table, factors are rated according to the survey results. Factors are
categorised as ‘most significant’ (value 3), ‘significant’ (value 2) or ‘less significant’ (value 1) in
impeding collaboration performance (see Table 5.2). This gives a good indication of factors in
each dimension that require further research and development.
From the table it appears that mutual trust, leadership and collaboration incentives
require further improvement, for example the creation of new distributed and participative
organisation forms or a trust model for collaboration and a set of incentives based on
interpersonal rather than individual productivity. Even now, individual productivity is considered
a holy grail by most organisations.
The table shows that geographical dispersion, and especially different time zones, are no
longer considered as significant factors impeding collaboration performance. This is due to
recent ICT improvements such as Internet broadband connection, Web tools and free
communication via the Internet, which reduce or remove entirely the cost of distant
communication.
Other factors too have become less significant because of progress in ICT and experience
in using that technology to organise temporary physical collocation with social activities. This
leads to the building of interpersonal relationships among participants at a more appropriate level
of trust. The majority of factors are located within the previously discussed categories, especially
in the social and legal dimensions, which require implementation of appropriate features within
the current SW technology.

177
Factors
Dim
ensi
ons
Mos
t sig
nific
ant
Sign
ifica
nt
Less
sig
nific
ant
1.1 Geographical dispersion X 1.2 Different time zones X 1.3 Unbalanced power X
1.4 Unbalanced expertise X
1.5 Multi-disciplinary setting X
1.6 Lack of clear leadership X
1.7 Lack of incentive
Stru
ctur
al
X
2.1 Lack of commons X
2.2 Weak ties X
2.3 Lack of interpersonal awareness X
2.4 Multi-lingual setting X
2.5 Emotional behaviour X 2.6 Lack of mutual trust X
2.7 Diversity setting X
2.8 Lack of absorptive capacity
Soci
al
X
3.1 Lack of media naturalness X
3.2 Lack of common description X
3.3 Multi-platform setting X 3.4 Lack of meaning X
3.5 Unbalanced technological usage X
3.6 Lack of contextualised mode
Tech
nica
l
X
4.1 Unbalanced IPR approach X
4.2 Different investment regulations X
4.3 Different contractual settings X
4.4 Lack of common security rules
Lega
l
X
Table 5.2: Rating of Collaboration Barriers by the Survey Respondents
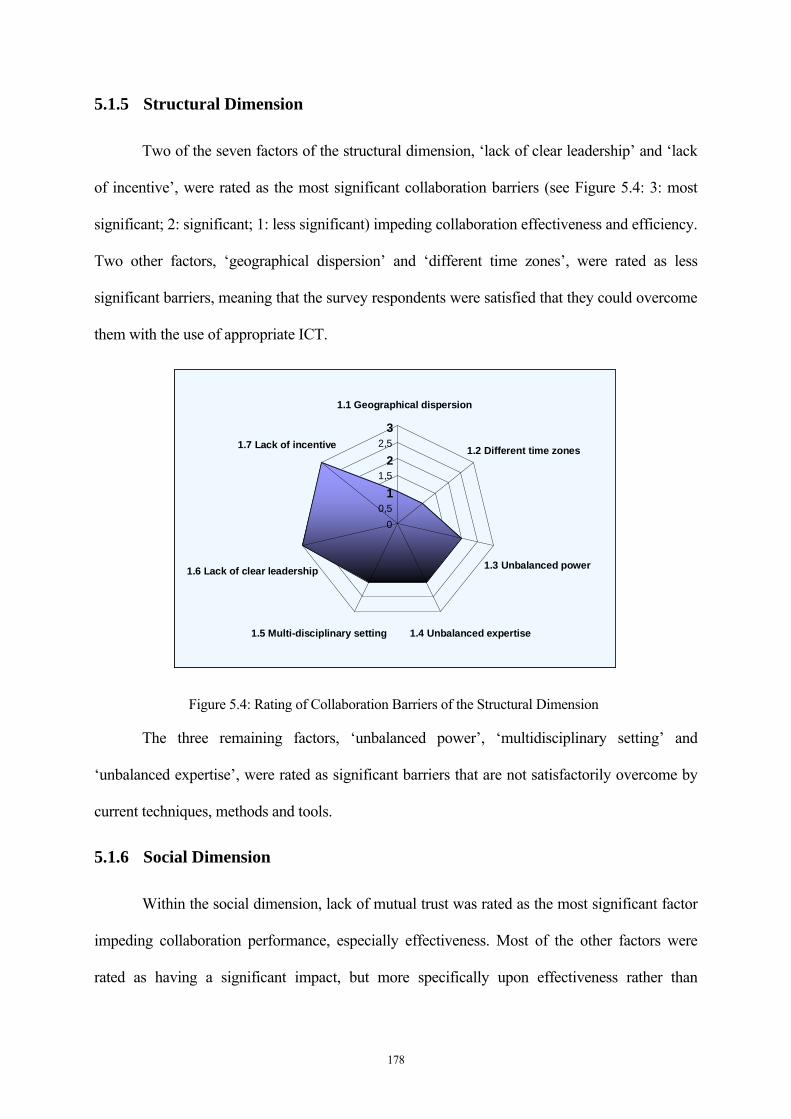
178
5.1.5 Structural Dimension
Two of the seven factors of the structural dimension, ‘lack of clear leadership’ and ‘lack
of incentive’, were rated as the most significant collaboration barriers (see Figure 5.4: 3: most
significant; 2: significant; 1: less significant) impeding collaboration effectiveness and efficiency.
Two other factors, ‘geographical dispersion’ and ‘different time zones’, were rated as less
significant barriers, meaning that the survey respondents were satisfied that they could overcome
them with the use of appropriate ICT.
00,5
11,5
22,5
3
1.1 Geographical dispersion
1.2 Different time zones
1.3 Unbalanced power
1.4 Unbalanced expertise1.5 Multi-disciplinary setting
1.6 Lack of clear leadership
1.7 Lack of incentive
00,5
11,5
22,5
3
1.1 Geographical dispersion
1.2 Different time zones
1.3 Unbalanced power
1.4 Unbalanced expertise1.5 Multi-disciplinary setting
1.6 Lack of clear leadership
1.7 Lack of incentive
Figure 5.4: Rating of Collaboration Barriers of the Structural Dimension
The three remaining factors, ‘unbalanced power’, ‘multidisciplinary setting’ and
‘unbalanced expertise’, were rated as significant barriers that are not satisfactorily overcome by
current techniques, methods and tools.
5.1.6 Social Dimension
Within the social dimension, lack of mutual trust was rated as the most significant factor
impeding collaboration performance, especially effectiveness. Most of the other factors were
rated as having a significant impact, but more specifically upon effectiveness rather than

179
efficiency (see Figure 5.5: 3: most significant; 2: significant; 1: less significant). Finally,
emotional behaviour was rated by the survey respondents as having a less significant impact.
Figure 5.5: Rating of Collaboration Barriers of the Social Dimension
5.1.7 Technical Dimension
Within the technical dimension, lack of common description and meaning were rated as
having the most significant impact on collaboration performance. Lack of commons corresponds
to the notion of shared knowledge, while lack of meaning corresponds to the notion of sense-
making (see Figure 5.6: 3: most significant; 2: significant; 1: less significant); together these
form the basis for reaching a mutual understanding. It was previously argued by Roschelle
(1992) that mutual understanding is the essence of collaboration. The remaining problem is to
identify what constitutes the collaboration engine.

180
Figure 5.6: Rating of Collaboration Barriers of the Technical Dimension
By contrast one factor, ‘multiplatform setting’, was rated as having a less significant
impact on collaboration performance, while the remaining three factors were, not surprisingly,
rated as having a significant impact.
5.1.8 Legal Dimension
Within the legal dimension, the most prominent factor appears to be an unbalanced IPR
approach, whereby collaborating partners have different approaches and objectives in terms of
ownership. Among the experienced people who responded to this survey on collaboration
barriers, this factor of ownership was perceived as one of the most significant impacts on
collaboration performance (see Figure 5.7: 3: most significant; 2: significant; 1: less significant).
181
Figure 5.7: Rating of Collaboration Barriers of the Legal Dimension
Other factors such as shared security rules, contractual settings and investment
regulations were rated as having a significant impact. However, it should be noted that all these
factors directly impeded the effectiveness of collaboration rather than its efficiency (see Table
5.2).
5.2 Concluding Remarks on the Survey
Interestingly, this survey indicates that the most significant factors impacting
collaboration performance impede effectiveness rather than efficiency. By contrast, the four
factors rated in this survey as less significant impede efficiency, although two of them require
ICT to solve the effectiveness aspect. One is considered to improve efficiency in the case of
potential conflicts when emotional aspects are too deeply embedded in business activities.
It does seem logical that effectiveness factors are rated as most significant, because they
determine the readiness for collaboration. For example, it is well known in the international
project area that gathering participants from different countries, each of whom will have their
own regional and institutional culture and language, creates a wide collaborative distance. In this

182
context, collaboration effectiveness will not be ensured until they collectively decide to build a
common culture and use a common vocabulary.
Efficiency factors relate more to technical and organisational support where appropriate
methods, techniques and especially new ICT environments compress various distance types.
Within the social and legal dimensions, there is currently a clear lack of ICT support. Hence
there are plenty of opportunities to create innovative ICT tools and environments. With regard to
the technical dimension, the two factors rated as most significant correspond to shared
knowledge and meanings. These lead to mutual understanding, which is recognised as the
essence of collaboration (Roschelle, 1992). From this we can infer that lack of mutual
understanding implies a lack of collaboration effectiveness. Hence, it is unlikely to produce a
successful collaboration.
5.3 Focus Group Analysis
5.3.1 Insight from the Focus Group Interviews
While the daily e-mail reporting systematic activity events was criticised by participants
as flooding their e-mail boxes, they recognised the importance of being kept aware of what
others were doing in real-time. In the same way, most of them acknowledged the usefulness of
seeing progress through the evolving common project structure and growing number of
documents.
Table 5.3 below presents the ratings for the use of collaboration tools for compressing or
bridging the various distance types as expressed during the focus group interviews (FGI). The
value model (from 3 to 0) for all distance types is as follows: fully compressed or bridged by the
use of technology (value 3), only partially compressed or bridged (value 2), not satisfactorily
compressed or bridged and collaboration technology simultaneously introduces other distance
types (value 1), not at all compressed or bridged (value 0).
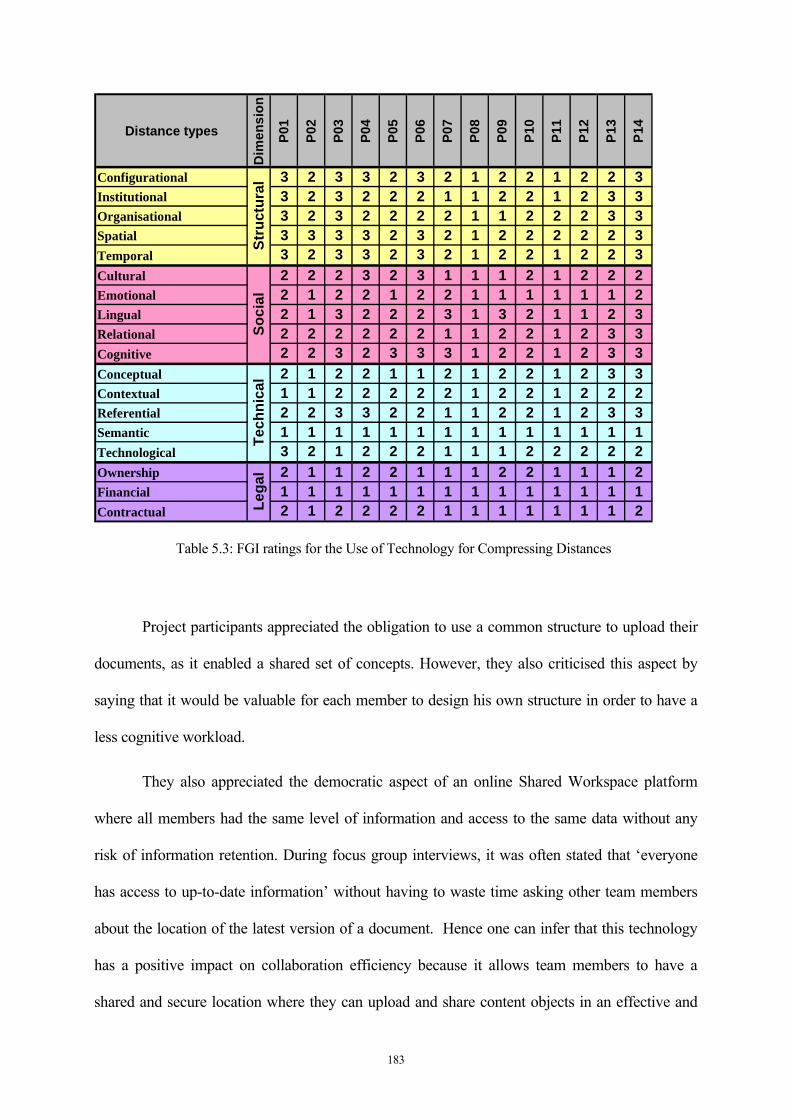
183
Distance types
Dim
ensi
on
P01
P02
P03
P04
P05
P06
P07
P08
P09
P10
P11
P12
P13
P14
Configurational 3 2 3 3 2 3 2 1 2 2 1 2 2 3Institutional 3 2 3 2 2 2 1 1 2 2 1 2 3 3Organisational 3 2 3 2 2 2 2 1 1 2 2 2 3 3Spatial 3 3 3 3 2 3 2 1 2 2 2 2 2 3Temporal 3 2 3 3 2 3 2 1 2 2 1 2 2 3Cultural 2 2 2 3 2 3 1 1 1 2 1 2 2 2Emotional 2 1 2 2 1 2 2 1 1 1 1 1 1 2Lingual 2 1 3 2 2 2 3 1 3 2 1 1 2 3Relational 2 2 2 2 2 2 1 1 2 2 1 2 3 3Cognitive 2 2 3 2 3 3 3 1 2 2 1 2 3 3Conceptual 2 1 2 2 1 1 2 1 2 2 1 2 3 3Contextual 1 1 2 2 2 2 2 1 2 2 1 2 2 2Referential 2 2 3 3 2 2 1 1 2 2 1 2 3 3Semantic 1 1 1 1 1 1 1 1 1 1 1 1 1 1Technological 3 2 1 2 2 2 1 1 1 2 2 2 2 2Ownership 2 1 1 2 2 1 1 1 2 2 1 1 1 2Financial 1 1 1 1 1 1 1 1 1 1 1 1 1 1Contractual 2 1 2 2 2 2 1 1 1 1 1 1 1 2
Stru
ctur
alSo
cial
Tech
nica
lLe
gal
Table 5.3: FGI ratings for the Use of Technology for Compressing Distances
Project participants appreciated the obligation to use a common structure to upload their
documents, as it enabled a shared set of concepts. However, they also criticised this aspect by
saying that it would be valuable for each member to design his own structure in order to have a
less cognitive workload.
They also appreciated the democratic aspect of an online Shared Workspace platform
where all members had the same level of information and access to the same data without any
risk of information retention. During focus group interviews, it was often stated that ‘everyone
has access to up-to-date information’ without having to waste time asking other team members
about the location of the latest version of a document. Hence one can infer that this technology
has a positive impact on collaboration efficiency because it allows team members to have a
shared and secure location where they can upload and share content objects in an effective and
184
efficient way. This confirms the feeling expressed by most of the project teams regarding the
benefit of using this technology in a physically or virtually collocated space.
In the discussion about preference for e-mailing over group blogging, it appeared that
most of the participants preferred to use an instant messaging tool to support synchronous rather
than asynchronous interactions. However, when necessary, they preferred e-mail rather than
group blogging as an asynchronous communication tool, in particular because they had easier
access to e-mail. They also claimed that uploading a document into the Shared Workspace by
‘drag and drop’ was faster, and much more reliable, than sending an attached document by email.
A few participants did express an interest in group blogging to compile a project history and
chronology of events. They also emphasised that the involvement of more external participants
would have encouraged more teams to experience this blogging technology. Finally, a large
majority of participants recognised the complementarily of Shared Workspace and group
blogging technologies.
In terms of collaborative distance, almost all participants commented that these
technologies were useful to overcome collaboration barriers by compressing distances, especially
spatial, temporal and organisational distance types. They also declared that cognitive, relational,
emotional and cultural distances were to some extent bridged. Although emotional and relational
distance types were not heavily discussed during the interviews, they were mentioned as a way to
start a relationship remotely with someone too shy for live interaction. One participant said that it
helped to resolve a conflict, without stating clearly what kind of conflict.
While this empirical study confirms that technologies compress several types of
collaborative distance, they can also introduce other types of distance because of the possible
disparity in technology skills and lack of interoperability.

185
5.4 Cases Comparison
5.4.1 Introduction to Cases and Distance Factors
The analysis of data collected during the project cases confirmed the potential negative
impact of distance factors on the process of reaching a mutual understanding. Individuals who
cannot properly understand each other cannot operate as an effective collaboration team; hence,
they cannot be efficient in achieving their group objectives. Clearly, distance factors impede
mutual understanding and shared meanings that determine the capacity to build shared
knowledge and collective or social intelligence for undertaking appropriate decisions.
Every time team members upload documents on their Shared Workspace, this leads to
the sharing of explicit knowledge. Complementarily, when team members communicate through
either face-to-face meetings or electronic audio means such as call or Web conferences, that
leads to the sharing of tacit knowledge. By contrast, when they communicate tacit knowledge
through electronic written means such as instant messaging, e-mailing, blogging and tagging,
that tacit knowledge becomes progressively more explicit. This typically happens when
individuals categorise or classify content objects in order to be able to find them more quickly
without any significant cognitive load. This study revealed that team activities, such as defining
and sharing the categorisation of content objects, involved consensus building among team
members to reach a proper level of shared meaning and mutual understanding. The description of
shared concepts necessitated the application of sense-making mechanisms. It also confirmed that
individuals from the same discipline are able to quickly reach a mutual understanding because
they use the same vocabulary and embedded meanings. Institutional distance factors such as
migration tides and brand new techniques and tools can disable this ability, as explained by
Nordstrom and Vahlne (1992), and Vahlne and Wiedersheim-Paul (1977). Often vocabularies
evolve over time, which inevitably impedes the progress towards shared meanings and mutual
understanding.
186
This study also intends to confirm another crucial benefit of sharing explicit and tacit
knowledge among group members, whereby the more participants share knowledge, the higher
their level of trust. As described by Luft and Ingham (1955), this sharing through exposing and
soliciting feedback, increases the size of the ‘arena’, the area of mutual understanding. The larger
the arena, the more productive the interpersonal relationship. Hence this is considered a
progressive cognitive mechanism to build trust among participants.
In addition to examining how collaboration technology and tools compress the well-
known spatial and temporal distance types, one of the objectives of this study is to explore how
far technologies such as online Shared Workspace and group blogging contribute to overcome
other collaboration barriers in compressing or bridging other distance types.
5.4.2 A Synthetic View on All Project Cases
The table below presents an integrated synthetic view of collected data for each project
case as introduced in the previous chapter. Project teams comprised four to six team members
from different disciplines, plus external participants such as representatives of project customers
and external experts. A quarter of the participants were located in the Virtual Reality Centre in
Laval. The other three quarters were located in Angers; of these, one third specialised in Agro-
Biology, another third in Strategic Information and another in Innovation Management.
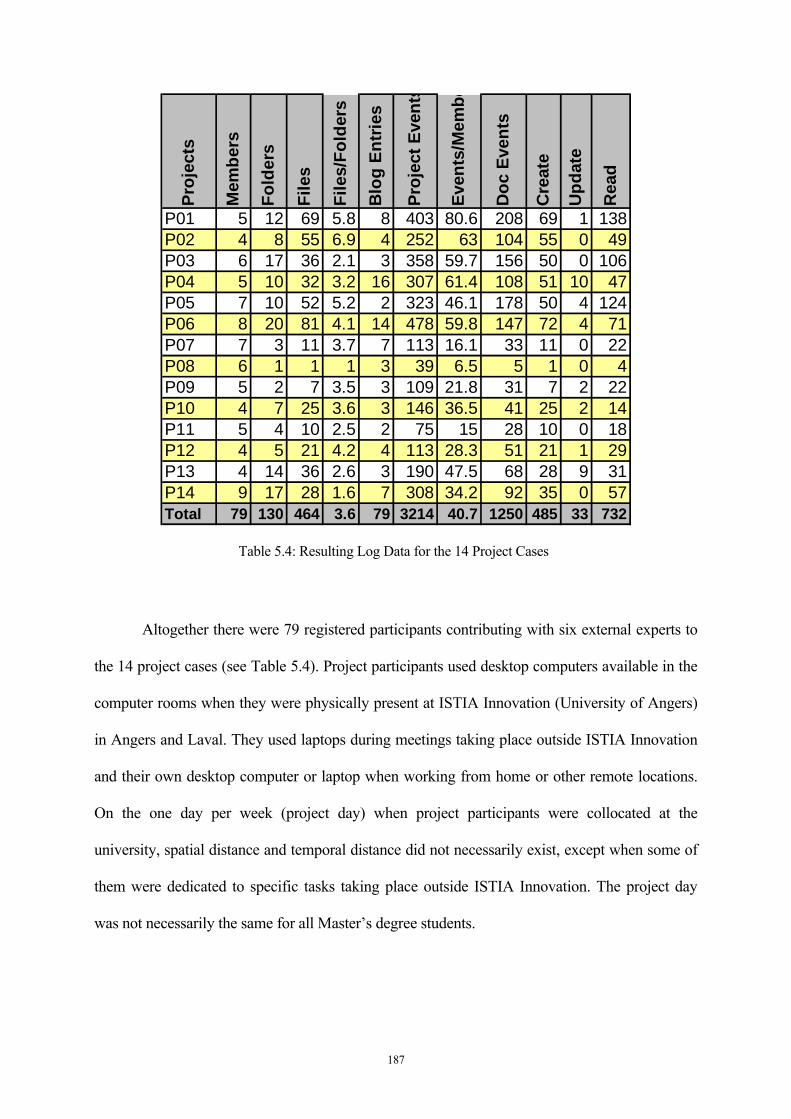
187
Proj
ects
Mem
bers
Fold
ers
File
s
File
s/Fo
lder
s
Blo
g En
trie
s
Proj
ect E
vent
s
Even
ts/M
embe
Doc
Eve
nts
Cre
ate
Upd
ate
Rea
d
P01 5 12 69 5.8 8 403 80.6 208 69 1 138P02 4 8 55 6.9 4 252 63 104 55 0 49P03 6 17 36 2.1 3 358 59.7 156 50 0 106P04 5 10 32 3.2 16 307 61.4 108 51 10 47P05 7 10 52 5.2 2 323 46.1 178 50 4 124P06 8 20 81 4.1 14 478 59.8 147 72 4 71P07 7 3 11 3.7 7 113 16.1 33 11 0 22P08 6 1 1 1 3 39 6.5 5 1 0 4P09 5 2 7 3.5 3 109 21.8 31 7 2 22P10 4 7 25 3.6 3 146 36.5 41 25 2 14P11 5 4 10 2.5 2 75 15 28 10 0 18P12 4 5 21 4.2 4 113 28.3 51 21 1 29P13 4 14 36 2.6 3 190 47.5 68 28 9 31P14 9 17 28 1.6 7 308 34.2 92 35 0 57Total 79 130 464 3.6 79 3214 40.7 1250 485 33 732
Table 5.4: Resulting Log Data for the 14 Project Cases
Altogether there were 79 registered participants contributing with six external experts to
the 14 project cases (see Table 5.4). Project participants used desktop computers available in the
computer rooms when they were physically present at ISTIA Innovation (University of Angers)
in Angers and Laval. They used laptops during meetings taking place outside ISTIA Innovation
and their own desktop computer or laptop when working from home or other remote locations.
On the one day per week (project day) when project participants were collocated at the
university, spatial distance and temporal distance did not necessarily exist, except when some of
them were dedicated to specific tasks taking place outside ISTIA Innovation. The project day
was not necessarily the same for all Master’s degree students.
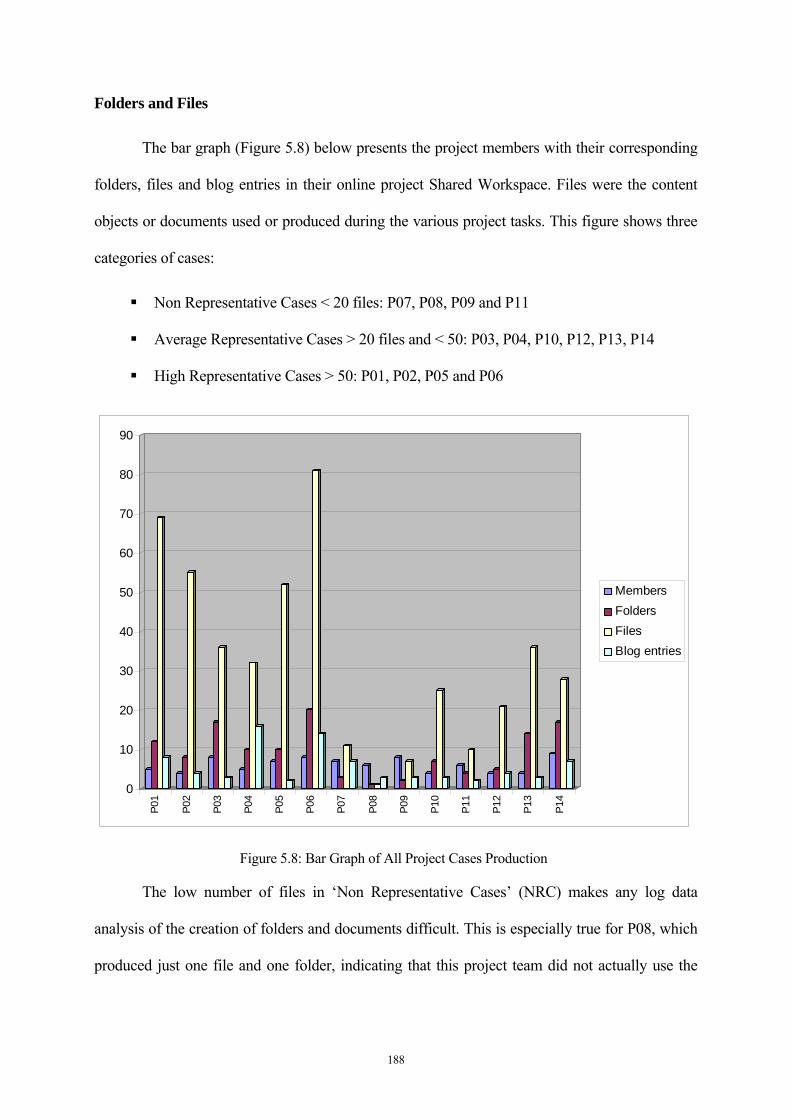
188
Folders and Files
The bar graph (Figure 5.8) below presents the project members with their corresponding
folders, files and blog entries in their online project Shared Workspace. Files were the content
objects or documents used or produced during the various project tasks. This figure shows three
categories of cases:
Non Representative Cases < 20 files: P07, P08, P09 and P11
Average Representative Cases > 20 files and < 50: P03, P04, P10, P12, P13, P14
High Representative Cases > 50: P01, P02, P05 and P06
0
10
20
30
40
50
60
70
80
90
P01
P02
P03
P04
P05
P06
P07
P08
P09
P10
P11
P12
P13
P14
MembersFoldersFilesBlog entries
Figure 5.8: Bar Graph of All Project Cases Production
The low number of files in ‘Non Representative Cases’ (NRC) makes any log data
analysis of the creation of folders and documents difficult. This is especially true for P08, which
produced just one file and one folder, indicating that this project team did not actually use the
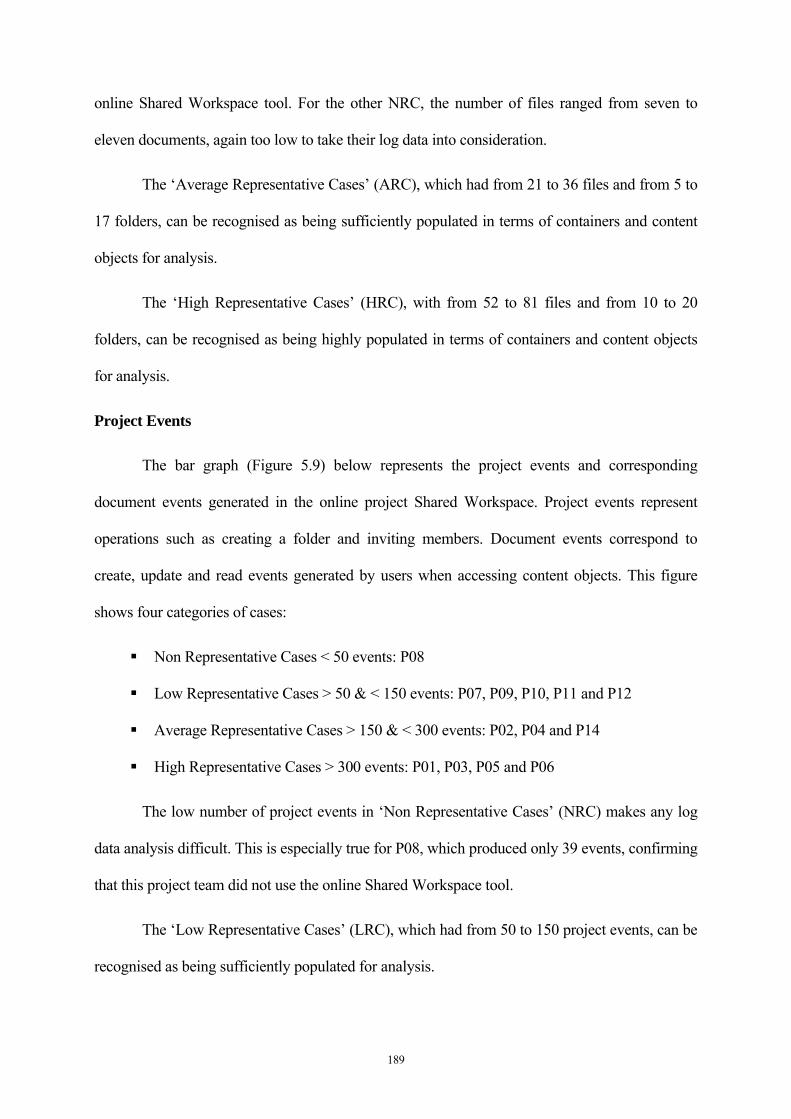
189
online Shared Workspace tool. For the other NRC, the number of files ranged from seven to
eleven documents, again too low to take their log data into consideration.
The ‘Average Representative Cases’ (ARC), which had from 21 to 36 files and from 5 to
17 folders, can be recognised as being sufficiently populated in terms of containers and content
objects for analysis.
The ‘High Representative Cases’ (HRC), with from 52 to 81 files and from 10 to 20
folders, can be recognised as being highly populated in terms of containers and content objects
for analysis.
Project Events
The bar graph (Figure 5.9) below represents the project events and corresponding
document events generated in the online project Shared Workspace. Project events represent
operations such as creating a folder and inviting members. Document events correspond to
create, update and read events generated by users when accessing content objects. This figure
shows four categories of cases:
Non Representative Cases < 50 events: P08
Low Representative Cases > 50 & < 150 events: P07, P09, P10, P11 and P12
Average Representative Cases > 150 & < 300 events: P02, P04 and P14
High Representative Cases > 300 events: P01, P03, P05 and P06
The low number of project events in ‘Non Representative Cases’ (NRC) makes any log
data analysis difficult. This is especially true for P08, which produced only 39 events, confirming
that this project team did not use the online Shared Workspace tool.
The ‘Low Representative Cases’ (LRC), which had from 50 to 150 project events, can be
recognised as being sufficiently populated for analysis.

190
The ‘Average Representative Cases’ (ARC), with from 150 to 300 project events, can be
recognised as being appropriately populated for analysis.
The ‘High Representative Cases’ (HRC), which had from 300 to 500 project events, can
be recognised as being highly populated for analysis.
0
50
100
150
200
250
300
350
400
450
500
P01
P02
P03
P04
P05
P06
P07
P08
P09
P10
P11
P12
P13
P14
Project EventsDoc events
Figure 5.9: Bar Graph of All Project Cases Events
Create, Update & Read Events
The bar graph (Figure 5.10) below represents the document operation events in each
online project Shared Workspace. Operation events generated within an online project SW
represent operations such as creating, updating and reading a content object. The figure shows
four categories of cases:
Non Representative Cases < 50 events: P07, P08, P09, P10 and P11
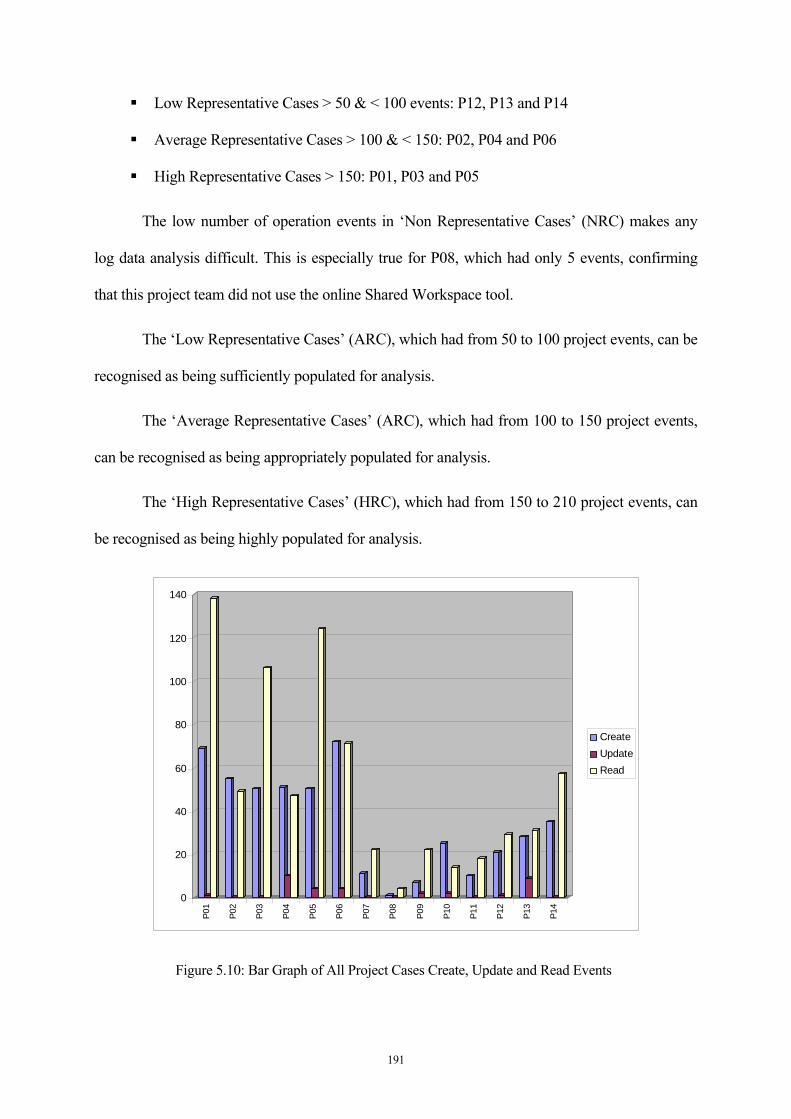
191
Low Representative Cases > 50 & < 100 events: P12, P13 and P14
Average Representative Cases > 100 & < 150: P02, P04 and P06
High Representative Cases > 150: P01, P03 and P05
The low number of operation events in ‘Non Representative Cases’ (NRC) makes any
log data analysis difficult. This is especially true for P08, which had only 5 events, confirming
that this project team did not use the online Shared Workspace tool.
The ‘Low Representative Cases’ (ARC), which had from 50 to 100 project events, can be
recognised as being sufficiently populated for analysis.
The ‘Average Representative Cases’ (ARC), which had from 100 to 150 project events,
can be recognised as being appropriately populated for analysis.
The ‘High Representative Cases’ (HRC), which had from 150 to 210 project events, can
be recognised as being highly populated for analysis.
0
20
40
60
80
100
120
140
P01
P02
P03
P04
P05
P06
P07
P08
P09
P10
P11
P12
P13
P14
CreateUpdateRead
Figure 5.10: Bar Graph of All Project Cases Create, Update and Read Events
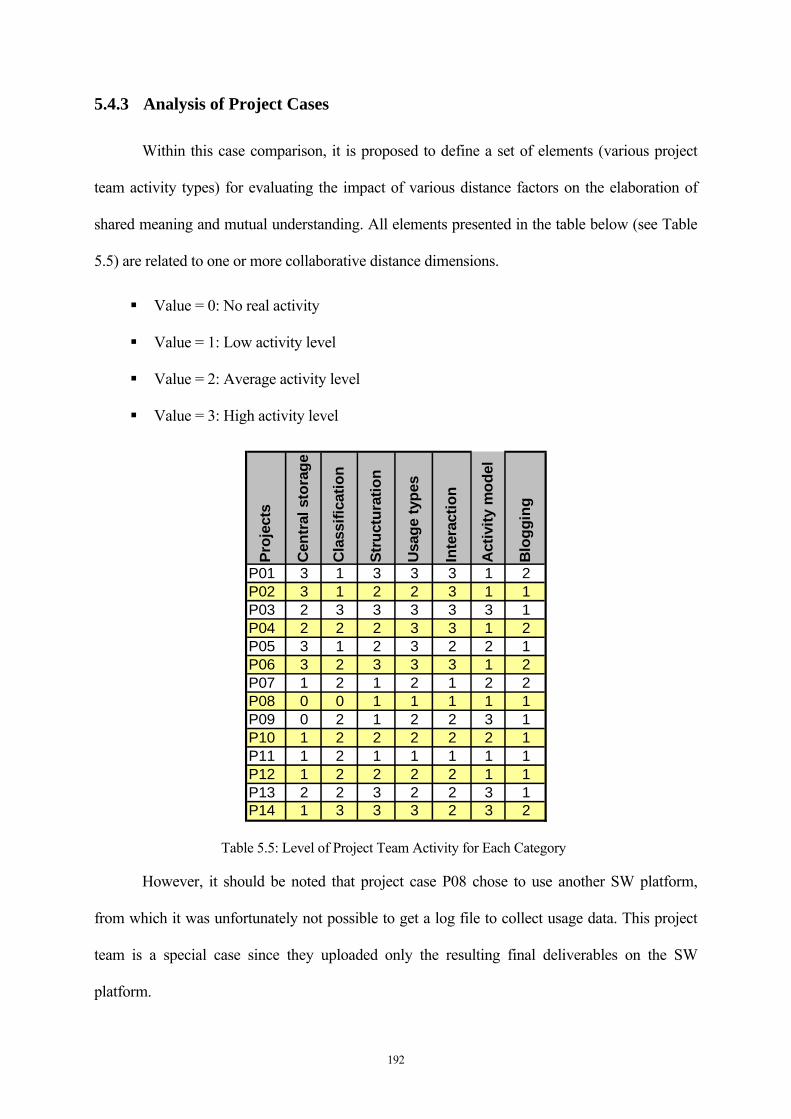
192
5.4.3 Analysis of Project Cases
Within this case comparison, it is proposed to define a set of elements (various project
team activity types) for evaluating the impact of various distance factors on the elaboration of
shared meaning and mutual understanding. All elements presented in the table below (see Table
5.5) are related to one or more collaborative distance dimensions.
Value = 0: No real activity
Value = 1: Low activity level
Value = 2: Average activity level
Value = 3: High activity level
Proj
ects
Cen
tral
sto
rage
Cla
ssifi
catio
n
Stru
ctur
atio
n
Usa
ge ty
pes
Inte
ract
ion
Act
ivity
mod
el
Blo
ggin
g
P01 3 1 3 3 3 1 2P02 3 1 2 2 3 1 1P03 2 3 3 3 3 3 1P04 2 2 2 3 3 1 2P05 3 1 2 3 2 2 1P06 3 2 3 3 3 1 2P07 1 2 1 2 1 2 2P08 0 0 1 1 1 1 1P09 0 2 1 2 2 3 1P10 1 2 2 2 2 2 1P11 1 2 1 1 1 1 1P12 1 2 2 2 2 1 1P13 2 2 3 2 2 3 1P14 1 3 3 3 2 3 2
Table 5.5: Level of Project Team Activity for Each Category
However, it should be noted that project case P08 chose to use another SW platform,
from which it was unfortunately not possible to get a log file to collect usage data. This project
team is a special case since they uploaded only the resulting final deliverables on the SW
platform.
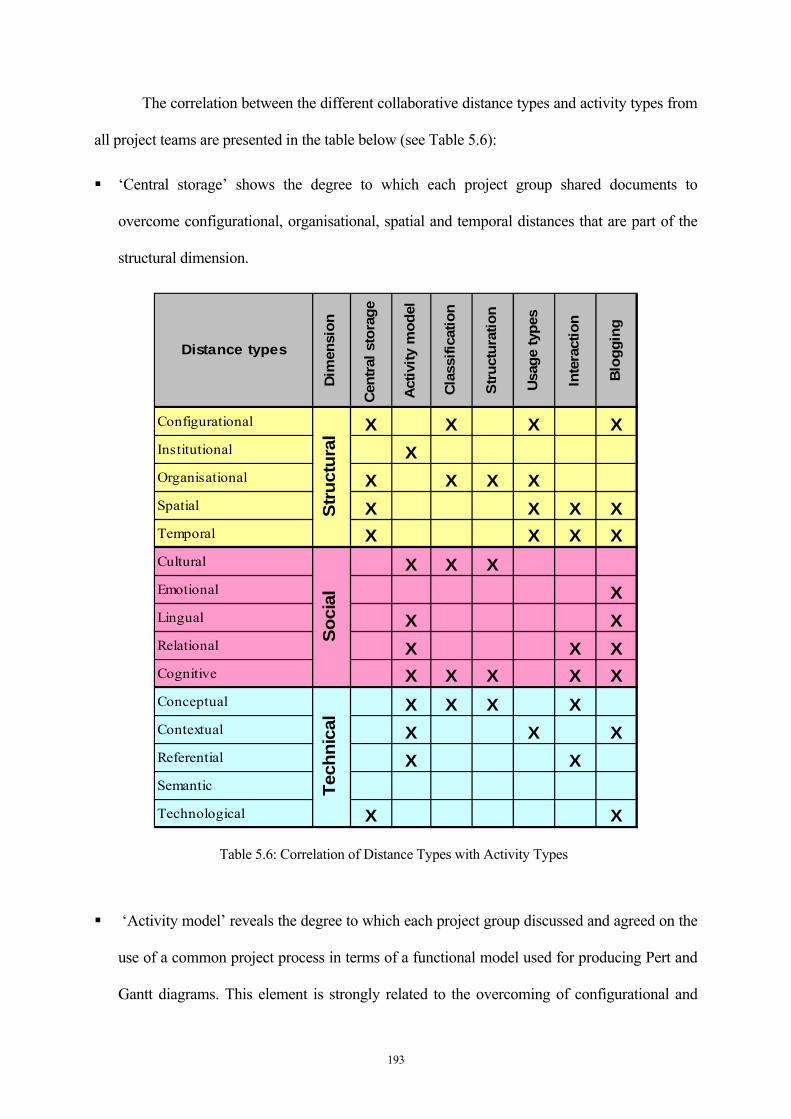
193
The correlation between the different collaborative distance types and activity types from
all project teams are presented in the table below (see Table 5.6):
‘Central storage’ shows the degree to which each project group shared documents to
overcome configurational, organisational, spatial and temporal distances that are part of the
structural dimension.
Distance typesDi
men
sion
Cen
tral
sto
rage
Act
ivity
mod
el
Clas
sific
atio
n
Stru
ctur
atio
n
Usag
e ty
pes
Inte
ract
ion
Blo
ggin
g
Configurational X X X XInstitutional XOrganisational X X X XSpatial X X X XTemporal X X X XCultural X X XEmotional XLingual X XRelational X X XCognitive X X X X XConceptual X X X XContextual X X XReferential X XSemantic
Technological X X
Stru
ctur
alSo
cial
Tech
nica
l
Table 5.6: Correlation of Distance Types with Activity Types
‘Activity model’ reveals the degree to which each project group discussed and agreed on the
use of a common project process in terms of a functional model used for producing Pert and
Gantt diagrams. This element is strongly related to the overcoming of configurational and
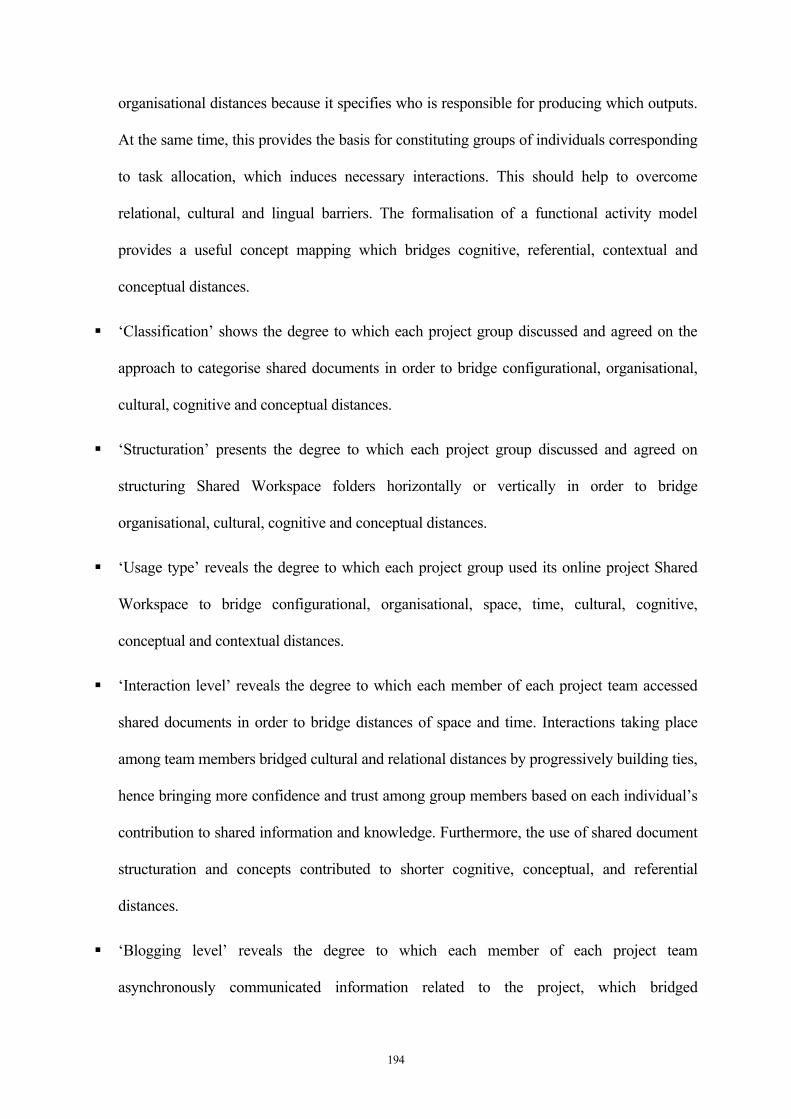
194
organisational distances because it specifies who is responsible for producing which outputs.
At the same time, this provides the basis for constituting groups of individuals corresponding
to task allocation, which induces necessary interactions. This should help to overcome
relational, cultural and lingual barriers. The formalisation of a functional activity model
provides a useful concept mapping which bridges cognitive, referential, contextual and
conceptual distances.
‘Classification’ shows the degree to which each project group discussed and agreed on the
approach to categorise shared documents in order to bridge configurational, organisational,
cultural, cognitive and conceptual distances.
‘Structuration’ presents the degree to which each project group discussed and agreed on
structuring Shared Workspace folders horizontally or vertically in order to bridge
organisational, cultural, cognitive and conceptual distances.
‘Usage type’ reveals the degree to which each project group used its online project Shared
Workspace to bridge configurational, organisational, space, time, cultural, cognitive,
conceptual and contextual distances.
‘Interaction level’ reveals the degree to which each member of each project team accessed
shared documents in order to bridge distances of space and time. Interactions taking place
among team members bridged cultural and relational distances by progressively building ties,
hence bringing more confidence and trust among group members based on each individual’s
contribution to shared information and knowledge. Furthermore, the use of shared document
structuration and concepts contributed to shorter cognitive, conceptual, and referential
distances.
‘Blogging level’ reveals the degree to which each member of each project team
asynchronously communicated information related to the project, which bridged
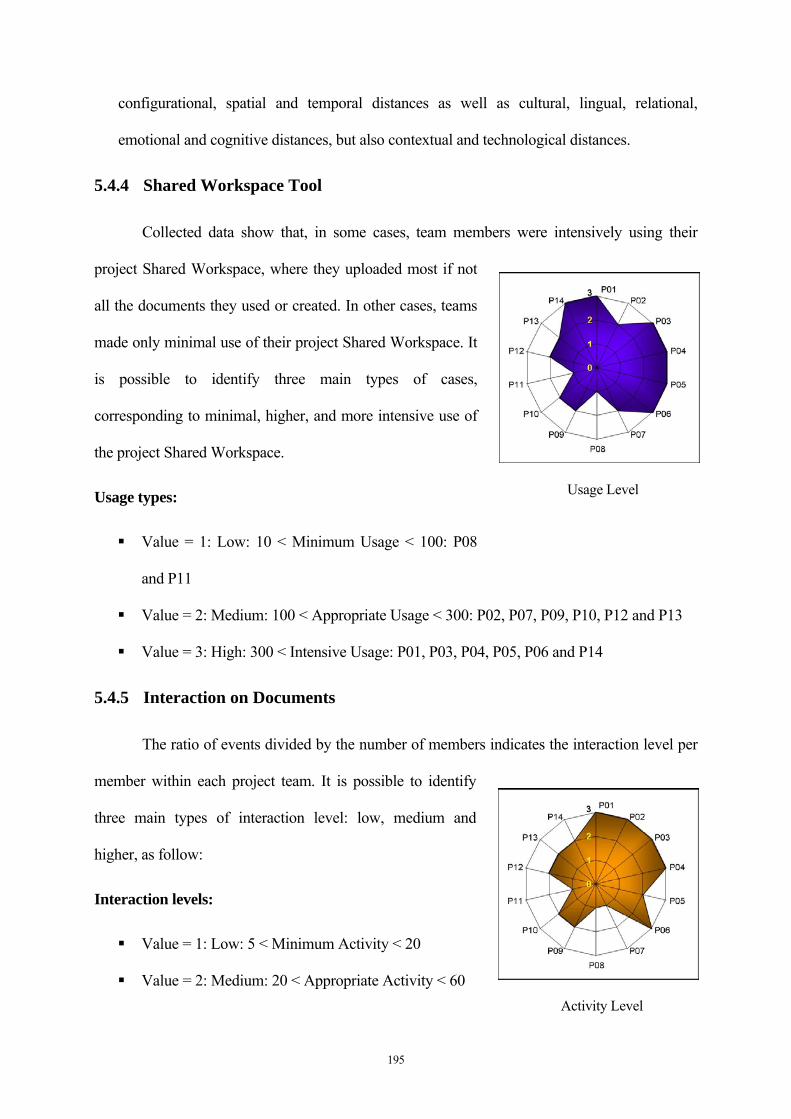
195
configurational, spatial and temporal distances as well as cultural, lingual, relational,
emotional and cognitive distances, but also contextual and technological distances.
5.4.4 Shared Workspace Tool
Collected data show that, in some cases, team members were intensively using their
project Shared Workspace, where they uploaded most if not
all the documents they used or created. In other cases, teams
made only minimal use of their project Shared Workspace. It
is possible to identify three main types of cases,
corresponding to minimal, higher, and more intensive use of
the project Shared Workspace.
Usage types:
Value = 1: Low: 10 < Minimum Usage < 100: P08
and P11
Value = 2: Medium: 100 < Appropriate Usage < 300: P02, P07, P09, P10, P12 and P13
Value = 3: High: 300 < Intensive Usage: P01, P03, P04, P05, P06 and P14
5.4.5 Interaction on Documents
The ratio of events divided by the number of members indicates the interaction level per
member within each project team. It is possible to identify
three main types of interaction level: low, medium and
higher, as follow:
Interaction levels:
Value = 1: Low: 5 < Minimum Activity < 20
Value = 2: Medium: 20 < Appropriate Activity < 60
Usage Level
Activity Level
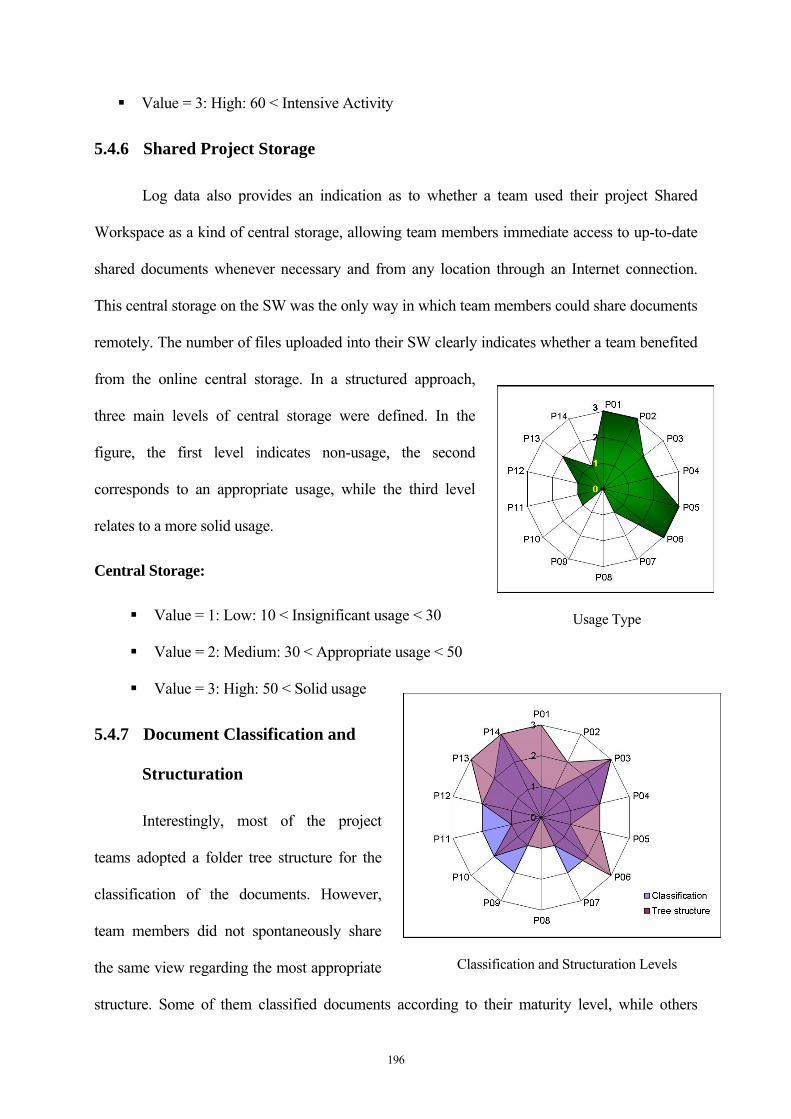
196
Value = 3: High: 60 < Intensive Activity
5.4.6 Shared Project Storage
Log data also provides an indication as to whether a team used their project Shared
Workspace as a kind of central storage, allowing team members immediate access to up-to-date
shared documents whenever necessary and from any location through an Internet connection.
This central storage on the SW was the only way in which team members could share documents
remotely. The number of files uploaded into their SW clearly indicates whether a team benefited
from the online central storage. In a structured approach,
three main levels of central storage were defined. In the
figure, the first level indicates non-usage, the second
corresponds to an appropriate usage, while the third level
relates to a more solid usage.
Central Storage:
Value = 1: Low: 10 < Insignificant usage < 30
Value = 2: Medium: 30 < Appropriate usage < 50
Value = 3: High: 50 < Solid usage
5.4.7 Document Classification and
Structuration
Interestingly, most of the project
teams adopted a folder tree structure for the
classification of the documents. However,
team members did not spontaneously share
the same view regarding the most appropriate
structure. Some of them classified documents according to their maturity level, while others
Usage Type
Classification and Structuration Levels
197
classified on the basis of project work packages. This observation leads to the conclusion that it
might be better to personalise the structure of the folders according to individuals’ preference.
Nonetheless, it is possible to identify three main levels of document classification based on the
tree structure of folders. The first level represents a flat level without any tree structure; the
second corresponds to a tree structure of a single layer of folders, while the third level represents
a double layer of folders.
Classification:
Value = 1: Low (Reasonable): 5 < ratio documents/folders < 7
Value = 2: Medium (Dense): 2 < ratio documents/folders < 5
Value = 3: High (Very Dense): ratio documents/folders 2
Structuration:
Value = 1: Low: Depth = 0
Value = 2: Medium: Depth = 1
Value = 3: High: Depth = 2
5.4.8 Shared Workspace Folder Labels
All project cases developed Activity Functional Diagrams that represent the agreed
activity model of the project process. Each team started with a context diagram specifying the
provided inputs and expected outputs of the project. They had the opportunity to specify
resources, as well as some specific constraints representing potential controls. From the context
diagram, they prepared a tree diagram representing the various levels of decomposition
diagrams. Finally, they derived a first decomposition level diagram from the context diagram.
Based on context and first decomposition diagrams, they then derived the second level of
decomposition diagrams from the various activity boxes represented within the first
decomposition level.

198
As expected, team members did not all see their project process in the same way. There
were as many views as participants. Their first job was to reconcile these different views and
considerations into a single agreed process view. In some cases this discussion was dominated by
a strong personality. In other cases the
discussion was more participative.
Unfortunately, the polling function of the Shared
Workspace tool was not used by any of the
groups; hence there were no log data available
from decisions taken by project teams.
With regard to the alignment of the
project process with the structuration of the
project SW, there was a great deal of discussion within most of the groups. Some team members
had folder names reflecting project activities included in the project process (e.g. work package
names, task names), while others had a folder name which corresponded to the level of
completion of documents (e.g. draft, final). Other teams decided to name folders according to the
type of documents (e.g. final report, activity diagrams). Several project teams ended up with a
combination of the above approaches.
Activity Model:
Value = 1: Type = 1: folder names based on the type of documents
Value = 2: Type, Activity & Maturity = 3: folder names based on the maturity level of
documents
Value = 3: Activity = 2: folder names based on activity names given in the IDEF0
diagram
Folders Structure

199
Group Blogging
5.4.9 Asynchronous Communication
Communication among project team members was based mainly on regular face-to-face
meetings and the use of online communication tools, both synchronous and asynchronous, such
as instant messaging (MSN) and e-mailing (Outlook). A new online communication capability
was provided through the group blogging that was
available directly within the Shared Workspace tool.
Most of the FGI participants declared during the
interviews that they were not aware of the
availability of a group blogging tool, although the
group blogging technique was mentioned during a
specific course on collaboration tools. It was
presented as semi-private blogging for groups such as project teams, in contrast with traditional
individual blogging tools. It was also explained that group blogging provides the capacity for
team members to write blog entries and to comment on entries created by others. However, it
appeared that team members did not spend much time trying this new collaboration tool.
Group Blogging:
Value = 1: Low: 1 < number of entries < 5
Value = 2: Medium: 5 < number of entries < 20
Value = 3: High: 20 < number of entries
5.4.10 Insight from Log Data
Project team profiles were elaborated with the log data collected on the Shared
Workspace platform. Each project team profile was based on the measured activity level of
created documents, generated events and registered users. The values in the table below (see
Table 5.7) correspond to the computed profile of each project team according to activities that
200
corresponded to each distance type mentioned in Table 5.5 and Table 5.6. Such computed
profiles are intended to indicate the extent to which different distance types have impacted the
activity level of project teams. The applied rule is: ‘The higher the measured activity level, the
less significant the impact of the distance type.’ By contrast: ‘The lower the measured activity
level, the more significant the impact of the distance type.’
A radar graph was then produced for each distance type, integrating the activity level of
the different project teams, as the goal was not to evaluate the performance of each project team
but rather to evaluate the impact generated by the various collaborative distance types. These
radar graphs are used in the next chapter to compare what focus groups stated in terms of
distance types with what they had actually done.
It should be noted that four distance types, including three from the legal dimension, did
not get any team profile because there were no relevant collected data. For example, there was no
ontology based activity that could justify a profile for the semantic distance type. Similarly, there
was no activity dedicated to, or at least relevant to, ownership, financial or contractual distance
types. This explains the label ‘not applicable’ given to these specific distance types.

201
Distance
Dim
ensi
ons
Proj
ect P
01
Proj
ect P
02
Proj
ect P
03
Proj
ect P
04
Proj
ect P
05
Proj
ect P
06
Proj
ect P
07
Proj
ect P
08
Proj
ect P
09
Proj
ect P
10
Proj
ect P
11
Proj
ect P
12
Proj
ect P
13
Proj
ect P
14
Configurational 2,25 1,75 2,25 2,25 2,00 2,50 1,75 0,50 1,25 1,50 1,25 1,50 1,75 2,25
Institutional 1,67 1,33 3,00 1,67 1,67 2,00 1,67 0,67 2,00 2,00 1,33 1,67 2,67 3,00
Organisational 2,50 2,00 2,75 2,25 2,25 2,75 1,50 0,50 1,25 1,75 1,25 1,75 2,25 2,50
Spatial 2,75 2,25 2,25 2,50 2,25 2,75 1,50 0,75 1,25 1,50 1,00 1,50 1,75 2,00
Temporal 2,29 1,86 2,57 2,14 2,00 2,43 1,57 0,71 1,57 1,71 1,14 1,57 2,14 2,43
Cultural 2,75 2,25 2,25 2,50 2,25 2,75 1,50 0,75 1,25 1,50 1,00 1,50 1,75 2,00
Emotional 2,00 1,00 1,00 2,00 1,00 2,00 2,00 1,00 1,00 1,00 1,00 1,00 1,00 2,00
Lingual 1,50 1,00 2,00 1,50 1,50 1,50 2,00 1,00 2,00 1,50 1,00 1,00 2,00 2,50
Relational 2,00 1,67 2,33 2,00 1,67 2,00 1,67 1,00 2,00 1,67 1,00 1,33 2,00 2,33
Cognitive 2,00 1,60 2,60 2,00 1,60 2,20 1,60 0,80 1,80 1,80 1,20 1,60 2,20 2,60
Conceptual 1,75 1,25 2,50 1,75 1,50 2,00 1,75 0,75 1,75 1,75 1,25 1,50 2,25 2,75
Contextual 2,00 1,33 2,33 2,00 2,00 2,00 2,00 1,00 2,00 1,67 1,00 1,33 2,00 2,67
Referential 2,00 2,00 3,00 2,00 2,00 2,00 1,50 1,00 2,50 2,00 1,00 1,50 2,50 2,50
Semantic 1,00 1,00 1,00 1,00 1,00 1,00 1,00 1,00 1,00 1,00 1,00 1,00 1,00 1,00
Technological 2,50 2,00 1,50 2,00 2,00 2,50 1,50 0,50 0,50 1,00 1,00 1,00 1,50 1,50
Stru
ctur
alSo
cial
Tech
nica
l
Table 5.7 : Estimated Values of Project Activity Level Corresponding to Each Distance Type
5.4.11 Insight from Cases Log Data and FGI Data Overlap
The analysis of the 14 FGI was conducted in order to identify the respective level of
perceived impact for each focus group, while the analysis of the SW platform log data of the 14
project cases led to the production of a specific radar graph for each distance type as a measured
impact. By selecting the same type of graph with the same scale for evaluating the impact of
each type of collaborative distance on the 14 focus groups (FGI) and on the corresponding 14
project cases (LD), it was possible to compare the perceived and measured impacts, shown by
the overlapping of the respective FGI and LD radar graphs. The correlation with the outcome of
202
the survey is clear, because each dimension with its respective distance types corresponds to one
or more collaboration barriers, confirming the previous comparison.
5.5 Introducing the Evaluation of Collaborative Distance
The following sections discuss the evaluation for each collaborative distance type as
perceived by the project teams (FGI) and as interpreted with the activity level (LD). The results
are presented in radar graphs with FGI and LD overlapped shapes, since this is the most
appropriate graphic representation to get an intuitive overview of how a distance type was
compressed or bridged to overcome collaboration barriers. According to the scale in the radar
view, ‘the higher the value, the more the distance type was compressed or bridged’. By contrast,
‘the lower the value, the less the distance type was compressed or bridged’.
Possible values for each project case (FGI or LD shape) in the radar graphs are as follow:
Value = 3: This distance type was fully compressed or bridged.
Value = 2: This distance type was only partially compressed or bridged.
Value = 1: This distance type was not satisfactorily compressed or bridged and collaboration
technology simultaneously introduced other distance types.
Value = 0: This distance type was not at all compressed or bridged.
The following radar graphs present two overlapping shapes for each distance type. The
shape in the background corresponds to the interpretation of the data collected during the focus
group interviews (FGI). The one in the foreground corresponds to the interpretation of the data
collected on the Shared Workspace platform (LD).
When the FGI and LD shapes are homothetic with a dilation or contraction remaining in
the same value, the two shapes are similar. If the FGI and LD shapes are similar then the
recorded activities on the Shared Workspace (LD) are estimated as correlating to the findings of

203
Configurational Distance Radar Graph FGI and Log-data shapes
the interviews (FGI). In other words, this confirms that participants did actually do (LD) what
they said they had done (FGI).
The dilation or contraction of the FGI shape, in the event of similarity with the LD shape,
provides some insight about whether the project team was optimistic (dilation) or pessimistic
(contraction).
5.6 Structural Dimension
5.6.1 Configurational Distance
In contrast to the outcome of the survey on collaboration barriers, all the project teams
except two (P08 and P11) declared that they were not impacted by the barrier ‘unbalanced
power’. This is explained by the fact that project
teams made up of students do not face a hierarchical
context in the decision process. They were more
impacted by the barrier ‘unbalanced expertise’, since
they had to partly revise their choices based on
guidance and suggestions by external experts and
reviewers.
Interestingly, there is no big contrast between
the FGI and LD radar profiles because their shapes are homothetic enough to be considered
similar. However, it should be noted that the dilation of the FGI shape compared with the LD
shape reveals that interviewees were optimistic. Clearly, their level of activity was lower than
they had claimed during the interviews. However, the measured level of activity from the log
data is an average estimation of several activity types that are considered to be impacted by
configurational distance (see Table 5.4).
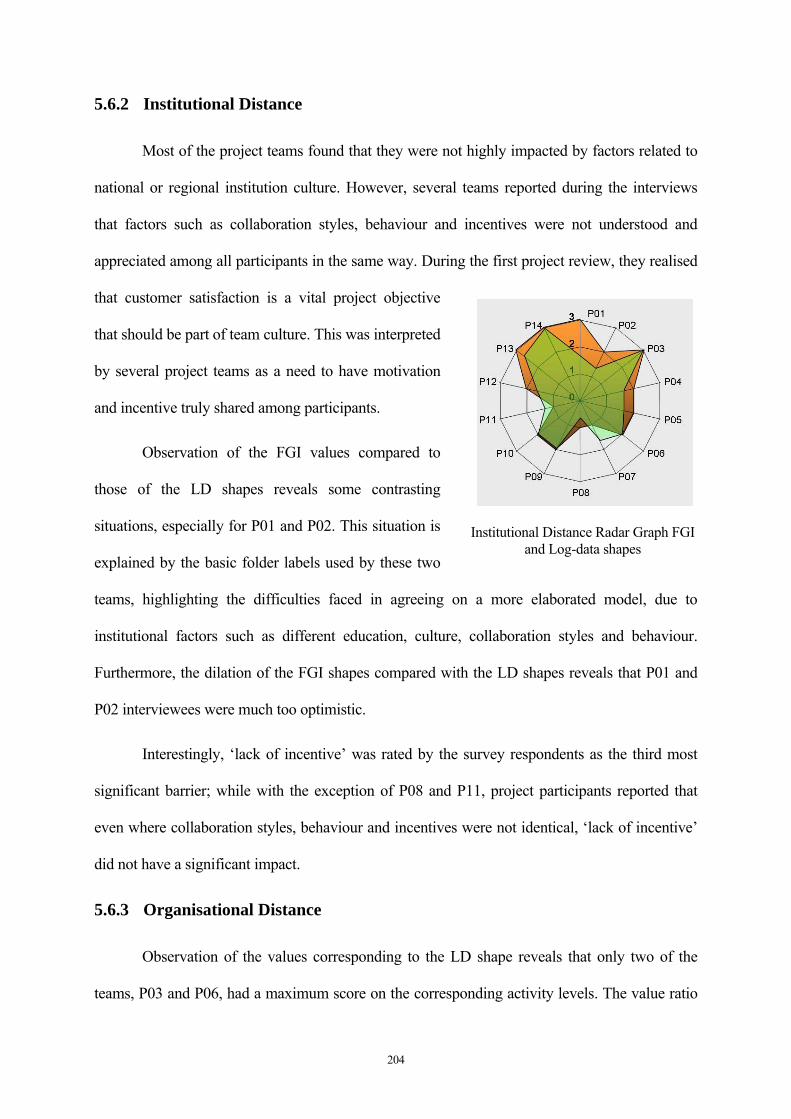
204
Institutional Distance Radar Graph FGI and Log-data shapes
5.6.2 Institutional Distance
Most of the project teams found that they were not highly impacted by factors related to
national or regional institution culture. However, several teams reported during the interviews
that factors such as collaboration styles, behaviour and incentives were not understood and
appreciated among all participants in the same way. During the first project review, they realised
that customer satisfaction is a vital project objective
that should be part of team culture. This was interpreted
by several project teams as a need to have motivation
and incentive truly shared among participants.
Observation of the FGI values compared to
those of the LD shapes reveals some contrasting
situations, especially for P01 and P02. This situation is
explained by the basic folder labels used by these two
teams, highlighting the difficulties faced in agreeing on a more elaborated model, due to
institutional factors such as different education, culture, collaboration styles and behaviour.
Furthermore, the dilation of the FGI shapes compared with the LD shapes reveals that P01 and
P02 interviewees were much too optimistic.
Interestingly, ‘lack of incentive’ was rated by the survey respondents as the third most
significant barrier; while with the exception of P08 and P11, project participants reported that
even where collaboration styles, behaviour and incentives were not identical, ‘lack of incentive’
did not have a significant impact.
5.6.3 Organisational Distance
Observation of the values corresponding to the LD shape reveals that only two of the
teams, P03 and P06, had a maximum score on the corresponding activity levels. The value ratio
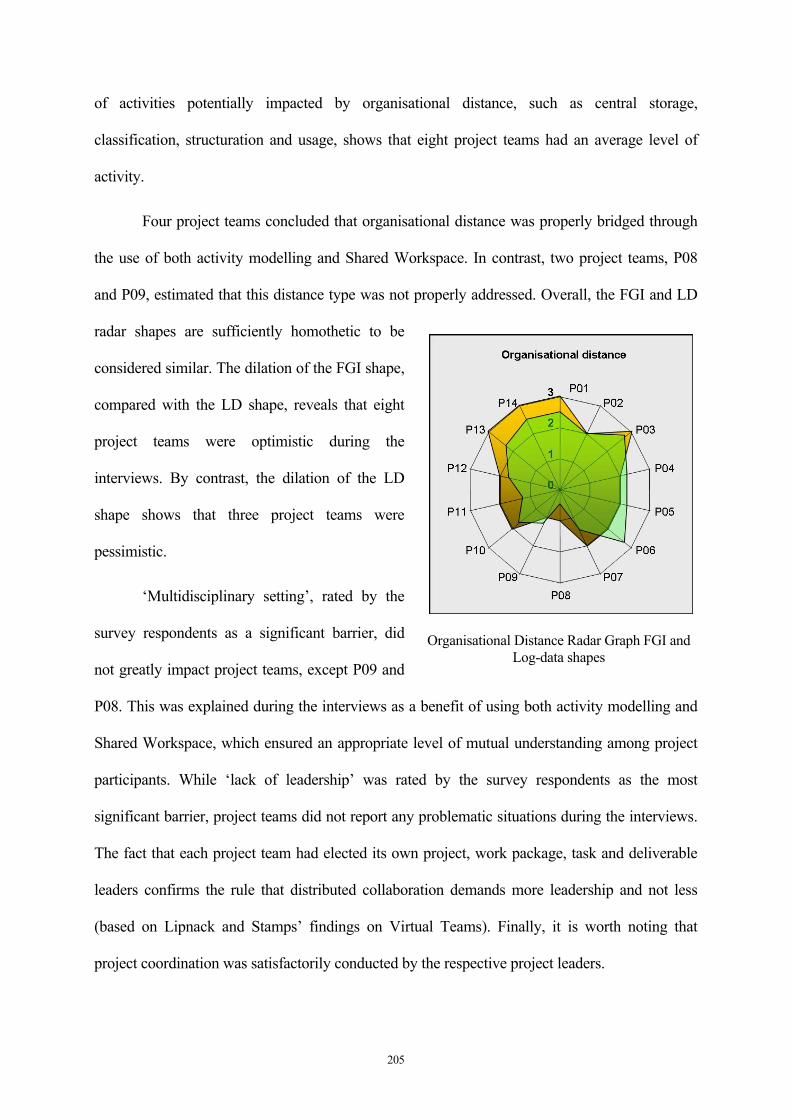
205
Organisational Distance Radar Graph FGI and Log-data shapes
of activities potentially impacted by organisational distance, such as central storage,
classification, structuration and usage, shows that eight project teams had an average level of
activity.
Four project teams concluded that organisational distance was properly bridged through
the use of both activity modelling and Shared Workspace. In contrast, two project teams, P08
and P09, estimated that this distance type was not properly addressed. Overall, the FGI and LD
radar shapes are sufficiently homothetic to be
considered similar. The dilation of the FGI shape,
compared with the LD shape, reveals that eight
project teams were optimistic during the
interviews. By contrast, the dilation of the LD
shape shows that three project teams were
pessimistic.
‘Multidisciplinary setting’, rated by the
survey respondents as a significant barrier, did
not greatly impact project teams, except P09 and
P08. This was explained during the interviews as a benefit of using both activity modelling and
Shared Workspace, which ensured an appropriate level of mutual understanding among project
participants. While ‘lack of leadership’ was rated by the survey respondents as the most
significant barrier, project teams did not report any problematic situations during the interviews.
The fact that each project team had elected its own project, work package, task and deliverable
leaders confirms the rule that distributed collaboration demands more leadership and not less
(based on Lipnack and Stamps’ findings on Virtual Teams). Finally, it is worth noting that
project coordination was satisfactorily conducted by the respective project leaders.
206
Spatial Distance Radar Graph FGI and Log-data shapes
5.6.4 Spatial Distance
Six project teams stated during the interview that they were satisfied with the level of
compression of the spatial distance, because the current available ICT contributed quite well to
overcoming the barrier of geographical dispersion (see
the FGI shape. However, seven project teams said that
spatial distance was only partially bridged, because the
lack of media-naturalness and unbalanced
technological usage created technological distance. The
media naturalness theory introduced by Kock and
D’Arcy (2002) explains that this phenomenon of
frustration occurs because not all human senses are
engaged in online (e.g. video, Web) conferencing. In particular, this point highlights the
weakness in synchronous communication when it occurs through the use of the current available
technology. Furthermore, the project teams mentioned that the use of the SW platform
introduced social distance types such as the lack of a shared social space.
‘Geographical dispersion’ was rated by survey respondents as one of the least significant
collaboration barriers. While finding that unbalanced technological usage and lack of media-
naturalness are consequences of using ICT in this situation, this study confirms that the spatial
distance type is satisfactorily compressed when participants are sufficiently trained.
Observation of the values corresponding to the FGI and LD shapes shows that a majority
of project teams (six) have an average level of activity. There is no large contrast between the
FGI and LD radar profiles because their shapes are homothetic enough to be considered similar.
However, it should be noted that the dilation of the FGI shape compared with the LD shape
reveals that interviewees were optimistic.
207
Temporal Distance Radar Graph FGI and Log-data shapes
In contrast with the findings of our survey, Cummings and Kiesler (2003), based on a
previous study on multidisciplinary distributed collaborations, argued that spatial distance had a
negative impact on both collaboration effectiveness and efficiency due to difficulties faced in
communication and coordination. However, communication and collaboration technologies have
rapidly evolved, so that, for example, the WEB 2.0 has brought social computing (Hoschka &
Prinz, 1998) into higher usage through social networking and online mass collaboration (e.g.
Wikipedia).
5.6.5 Temporal Distance
Five project teams declared themselves
satisfied with the level of compression on this
distance type because available ICT, especially all
asynchronous technologies, contributed
significantly to overcoming the potential impact of
temporal barriers. By contrast, seven project teams
had a different perception, declaring only a partial
bridging of this distance type. While it was repeated that the use of the SW platform introduced
other distance types such as social and technological distances, only two project teams, P08 and
P11, declared that this distance type was not bridged at all. This could be explained by their low
level of usage of the Shared Workspace platform. However, it should be noted that people
operating within different time zones cannot have synchronous communication. This means that
all interactions must be conducted asynchronously, as in the context of mass collaboration when
people contribute to Wikipedia. To be successful in overcoming this distance type all project
stakeholders operating in an asynchronous way must be properly trained and experienced.
The barrier ‘different time zones’ was rated by survey respondents as one of the less
significant collaboration barriers. This study confirms that a temporal barrier could be overcome
208
by the current available technologies. The extensive use of technologies simultaneously
introduced social and technological distances, which could be partly bridged by appropriate
training and temporary physical collocation with social activities to enable ties among team
members.

209
Cultural Distance Radar Graph FGI and Log-data shapes
5.7 Social Dimension
5.7.1 Cultural Distance
Only two project teams, P04 and P06, said that cultural distance was properly bridged by
the Shared Workspace creating a common culture in terms of project coordination and
monitoring, and ICT usage. However, it should be noted that because participants within these
two focus groups originated from the same region, they had a common homogeneous cultural
profile. This could explain their appreciation, in contrast with the survey finding that ‘lack of
commons’, a cultural distance type, was rated as a significant barrier. Indeed, a large majority of
the project teams declared that this distance type was only partially bridged, due to the lack of
social activities, and four project teams reported
that this distance type was not bridged at all. This
could be related to their low level of usage of the
Shared Workspace platform.
Interestingly, FGI and LD radar shapes are
sufficiently homothetic to be considered similar.
However, it should be noted that the dilation of the
FGI shape compared with the LD shape for P04, P10, P12 and P13, reveals that interviewees
were optimistic during the focus group interviews. Clearly, their actual level of activity was
lower than they claimed during the interviews. Four other project teams, P01, P02, P03 and P05,
have a contraction of the FGI shape, which highlights that they were pessimistic during the
interviews.
210
Emotional Distance Radar Graph FGI and Log-data shapes
5.7.2 Emotional Distance
Six of the project teams declared that the SW platform created more emotional distance.
In fact, no project team said that this distance was satisfactorily bridged. Participants from two
project teams explained that the availability of emoticons in instant messaging (e.g. Skype) or
webmail did not provide a satisfactory approach to bridging emotional distance. All the other
project teams considered that this emotional distance
was not bridged at all.
Emotional distance is a very specific case.
While everyone has his own emotional capital
influencing the decision-making process, it should be
noted that emotional aspects are not necessarily
perceived as mandatory. Indeed, many participants
considered that it was not legitimate to engage in
emotional aspects during business communication, while others wished to exclude emotions,
especially in conflicts or negotiation activities. Moreover, during the focus group interviews it
was frequently mentioned that emotional distance is a positive aspect for people who are too shy
or too emotive to be exposed to conflict situations. ‘Emotional behaviour’ was rated by survey
respondents as one of the less significant collaboration barriers.
Interestingly, the similar shapes show that there is no big contrast between the FGI and
LD radar profiles. Only one project team, P03, was revealed to be more optimistic during the
interview compared with the real activity level throughout the project duration. This study
confirms that emotional distance is not properly bridged by the current collaboration technology
and does not necessarily need to be.
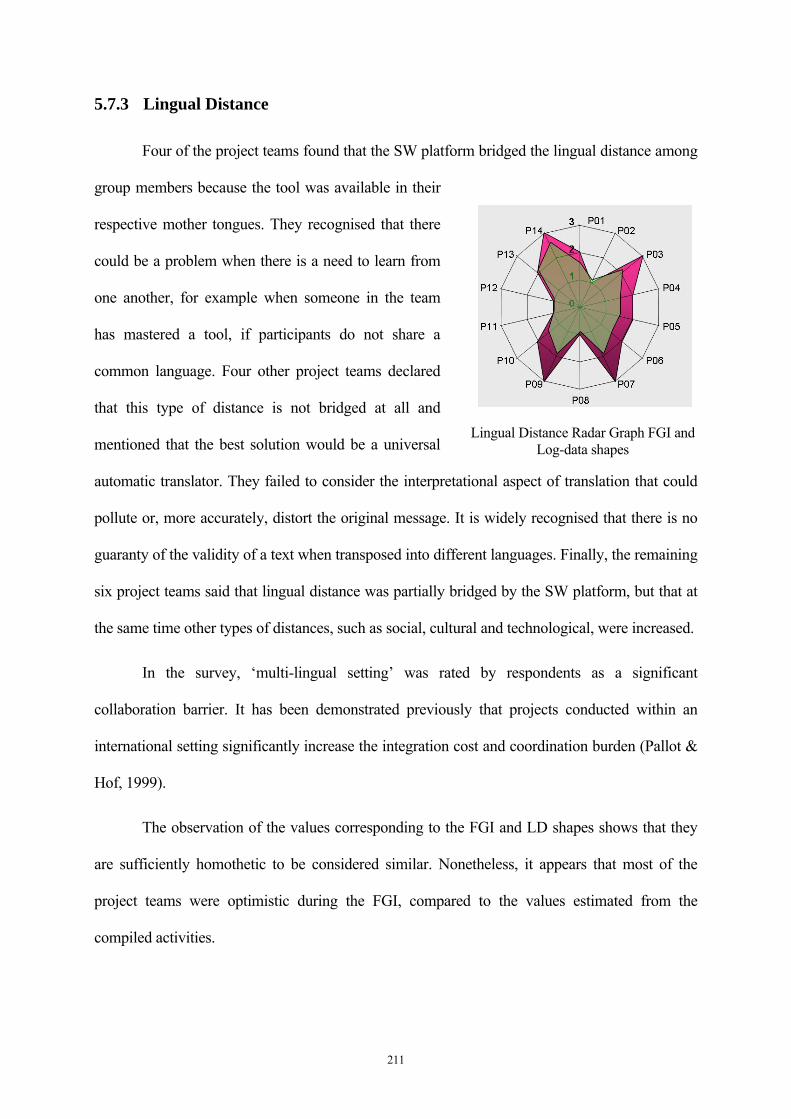
211
Lingual Distance Radar Graph FGI and Log-data shapes
5.7.3 Lingual Distance
Four of the project teams found that the SW platform bridged the lingual distance among
group members because the tool was available in their
respective mother tongues. They recognised that there
could be a problem when there is a need to learn from
one another, for example when someone in the team
has mastered a tool, if participants do not share a
common language. Four other project teams declared
that this type of distance is not bridged at all and
mentioned that the best solution would be a universal
automatic translator. They failed to consider the interpretational aspect of translation that could
pollute or, more accurately, distort the original message. It is widely recognised that there is no
guaranty of the validity of a text when transposed into different languages. Finally, the remaining
six project teams said that lingual distance was partially bridged by the SW platform, but that at
the same time other types of distances, such as social, cultural and technological, were increased.
In the survey, ‘multi-lingual setting’ was rated by respondents as a significant
collaboration barrier. It has been demonstrated previously that projects conducted within an
international setting significantly increase the integration cost and coordination burden (Pallot &
Hof, 1999).
The observation of the values corresponding to the FGI and LD shapes shows that they
are sufficiently homothetic to be considered similar. Nonetheless, it appears that most of the
project teams were optimistic during the FGI, compared to the values estimated from the
compiled activities.
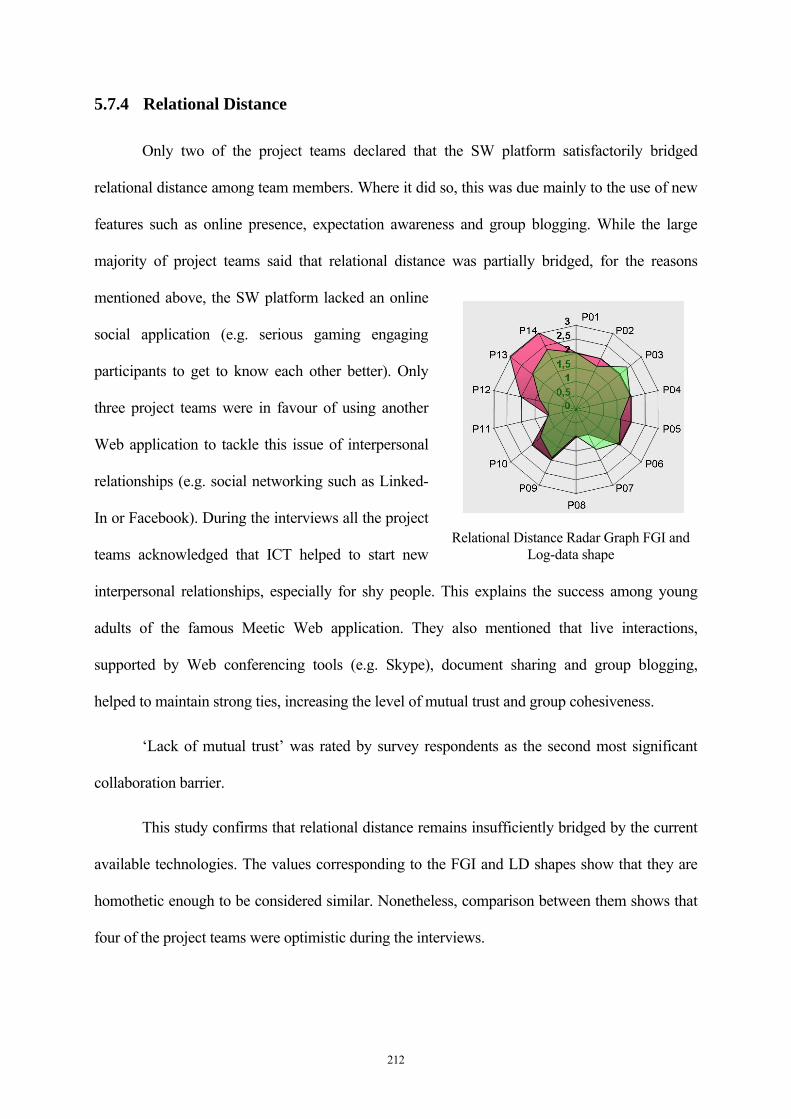
212
Relational Distance Radar Graph FGI and Log-data shape
5.7.4 Relational Distance
Only two of the project teams declared that the SW platform satisfactorily bridged
relational distance among team members. Where it did so, this was due mainly to the use of new
features such as online presence, expectation awareness and group blogging. While the large
majority of project teams said that relational distance was partially bridged, for the reasons
mentioned above, the SW platform lacked an online
social application (e.g. serious gaming engaging
participants to get to know each other better). Only
three project teams were in favour of using another
Web application to tackle this issue of interpersonal
relationships (e.g. social networking such as Linked-
In or Facebook). During the interviews all the project
teams acknowledged that ICT helped to start new
interpersonal relationships, especially for shy people. This explains the success among young
adults of the famous Meetic Web application. They also mentioned that live interactions,
supported by Web conferencing tools (e.g. Skype), document sharing and group blogging,
helped to maintain strong ties, increasing the level of mutual trust and group cohesiveness.
‘Lack of mutual trust’ was rated by survey respondents as the second most significant
collaboration barrier.
This study confirms that relational distance remains insufficiently bridged by the current
available technologies. The values corresponding to the FGI and LD shapes show that they are
homothetic enough to be considered similar. Nonetheless, comparison between them shows that
four of the project teams were optimistic during the interviews.
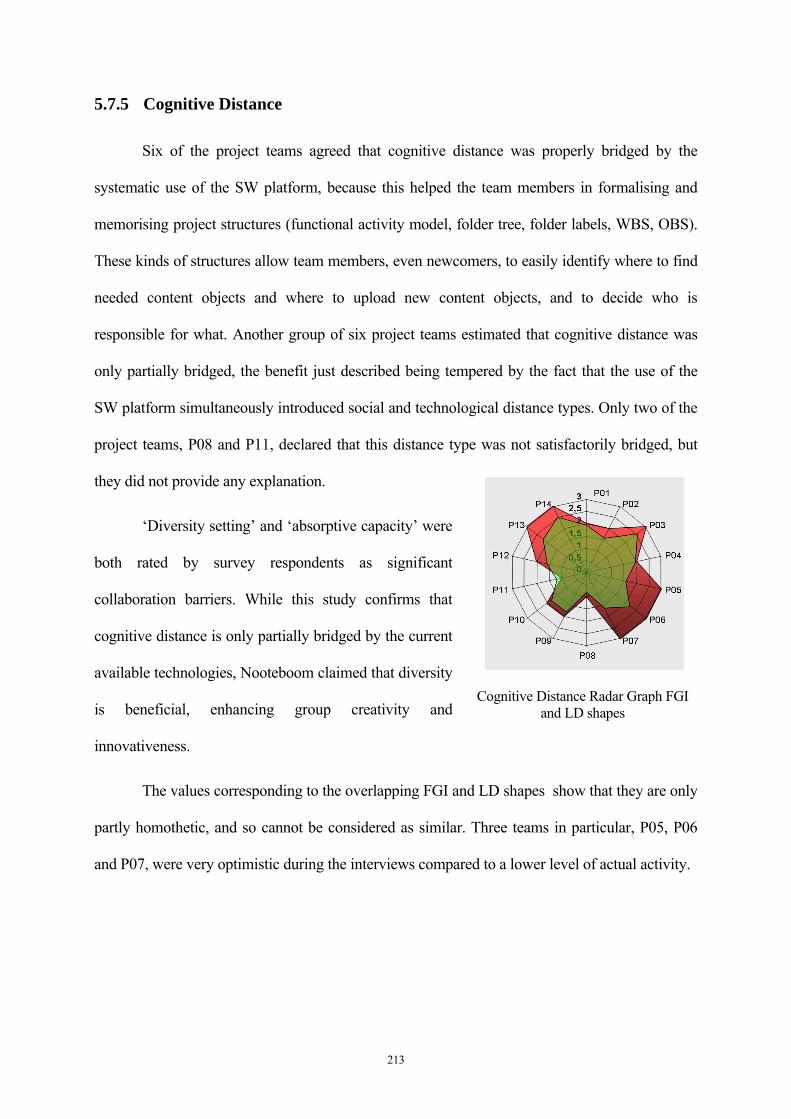
213
Cognitive Distance Radar Graph FGI and LD shapes
5.7.5 Cognitive Distance
Six of the project teams agreed that cognitive distance was properly bridged by the
systematic use of the SW platform, because this helped the team members in formalising and
memorising project structures (functional activity model, folder tree, folder labels, WBS, OBS).
These kinds of structures allow team members, even newcomers, to easily identify where to find
needed content objects and where to upload new content objects, and to decide who is
responsible for what. Another group of six project teams estimated that cognitive distance was
only partially bridged, the benefit just described being tempered by the fact that the use of the
SW platform simultaneously introduced social and technological distance types. Only two of the
project teams, P08 and P11, declared that this distance type was not satisfactorily bridged, but
they did not provide any explanation.
‘Diversity setting’ and ‘absorptive capacity’ were
both rated by survey respondents as significant
collaboration barriers. While this study confirms that
cognitive distance is only partially bridged by the current
available technologies, Nooteboom claimed that diversity
is beneficial, enhancing group creativity and
innovativeness.
The values corresponding to the overlapping FGI and LD shapes show that they are only
partly homothetic, and so cannot be considered as similar. Three teams in particular, P05, P06
and P07, were very optimistic during the interviews compared to a lower level of actual activity.
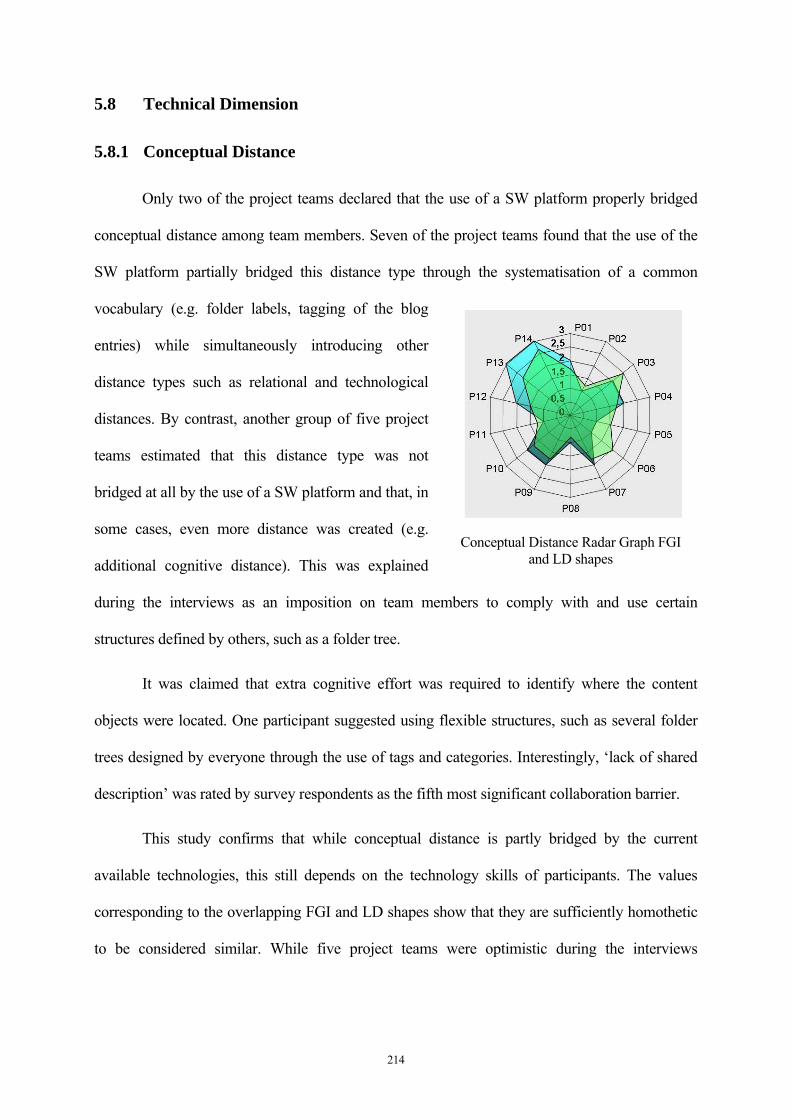
214
Conceptual Distance Radar Graph FGI and LD shapes
5.8 Technical Dimension
5.8.1 Conceptual Distance
Only two of the project teams declared that the use of a SW platform properly bridged
conceptual distance among team members. Seven of the project teams found that the use of the
SW platform partially bridged this distance type through the systematisation of a common
vocabulary (e.g. folder labels, tagging of the blog
entries) while simultaneously introducing other
distance types such as relational and technological
distances. By contrast, another group of five project
teams estimated that this distance type was not
bridged at all by the use of a SW platform and that, in
some cases, even more distance was created (e.g.
additional cognitive distance). This was explained
during the interviews as an imposition on team members to comply with and use certain
structures defined by others, such as a folder tree.
It was claimed that extra cognitive effort was required to identify where the content
objects were located. One participant suggested using flexible structures, such as several folder
trees designed by everyone through the use of tags and categories. Interestingly, ‘lack of shared
description’ was rated by survey respondents as the fifth most significant collaboration barrier.
This study confirms that while conceptual distance is partly bridged by the current
available technologies, this still depends on the technology skills of participants. The values
corresponding to the overlapping FGI and LD shapes show that they are sufficiently homothetic
to be considered similar. While five project teams were optimistic during the interviews

215
Contextual Distance Radar Graph FGI and LD shape
compared to a lower level of actual activity, three project teams were rather pessimistic, as
shown by the LD shape.
5.8.2 Contextual Distance
Although none of the project teams said that the use of a SW platform bridged contextual
distance among team members, ten of them recognised that this distance type was partially
bridged. By contrast, four of the project teams argued that the working context was too complex
to be bridged by the SW platform. However, they recognised that sharing context information is
vital for team members in order to work more efficiently (Neck & Manz, 1994). Some of the
participants said that sharing a working context would be beneficial to reduce the cognitive effort
required of individual members to situate themselves into the group activities and to help one
another. Not surprisingly, ‘lack of contextualised
mode’ was rated by survey respondents as a
significant collaboration barrier.
This study confirms that the contextual
distance was partly bridged by the available
technologies, which allow sharing of contextual
information among project participants. This
collaboration technology feature is named ‘context
awareness’ in the CSCW scientific community (Gross & Prinz, 2003). Observation of the values
corresponding to the overlapping FGI and LD shapes shows that they are homothetic enough to
be considered similar. While only two project teams, P10 and P12, were optimistic during the
interviews compared to a lower level of actual activity, four project teams, P01, P02, P03 and
P14, were rather pessimistic, as shown by the LD shape.
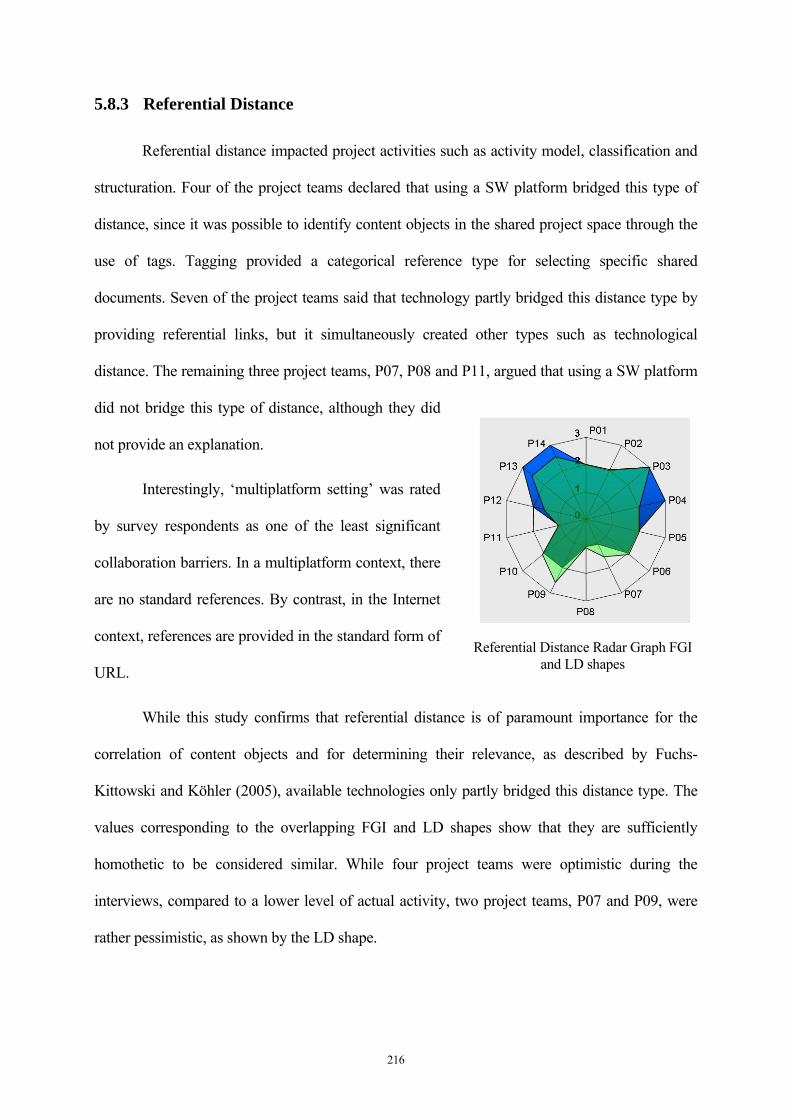
216
Referential Distance Radar Graph FGI and LD shapes
5.8.3 Referential Distance
Referential distance impacted project activities such as activity model, classification and
structuration. Four of the project teams declared that using a SW platform bridged this type of
distance, since it was possible to identify content objects in the shared project space through the
use of tags. Tagging provided a categorical reference type for selecting specific shared
documents. Seven of the project teams said that technology partly bridged this distance type by
providing referential links, but it simultaneously created other types such as technological
distance. The remaining three project teams, P07, P08 and P11, argued that using a SW platform
did not bridge this type of distance, although they did
not provide an explanation.
Interestingly, ‘multiplatform setting’ was rated
by survey respondents as one of the least significant
collaboration barriers. In a multiplatform context, there
are no standard references. By contrast, in the Internet
context, references are provided in the standard form of
URL.
While this study confirms that referential distance is of paramount importance for the
correlation of content objects and for determining their relevance, as described by Fuchs-
Kittowski and Köhler (2005), available technologies only partly bridged this distance type. The
values corresponding to the overlapping FGI and LD shapes show that they are sufficiently
homothetic to be considered similar. While four project teams were optimistic during the
interviews, compared to a lower level of actual activity, two project teams, P07 and P09, were
rather pessimistic, as shown by the LD shape.
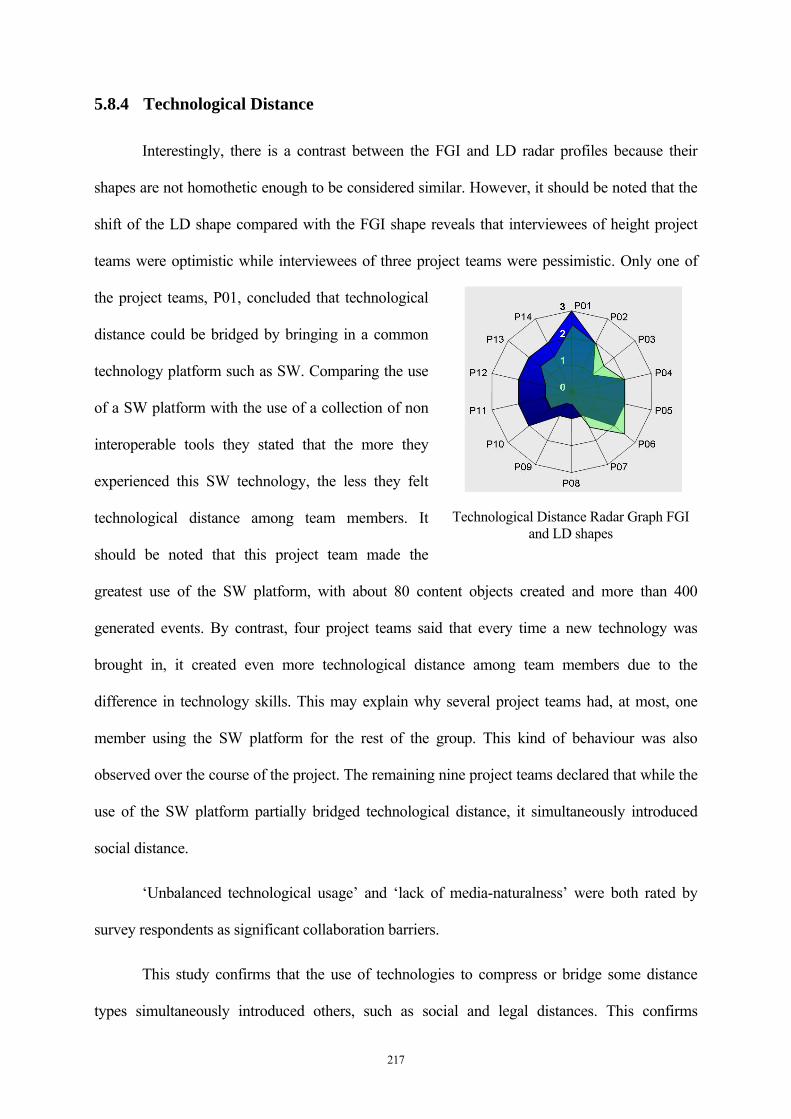
217
Technological Distance Radar Graph FGI and LD shapes
5.8.4 Technological Distance
Interestingly, there is a contrast between the FGI and LD radar profiles because their
shapes are not homothetic enough to be considered similar. However, it should be noted that the
shift of the LD shape compared with the FGI shape reveals that interviewees of height project
teams were optimistic while interviewees of three project teams were pessimistic. Only one of
the project teams, P01, concluded that technological
distance could be bridged by bringing in a common
technology platform such as SW. Comparing the use
of a SW platform with the use of a collection of non
interoperable tools they stated that the more they
experienced this SW technology, the less they felt
technological distance among team members. It
should be noted that this project team made the
greatest use of the SW platform, with about 80 content objects created and more than 400
generated events. By contrast, four project teams said that every time a new technology was
brought in, it created even more technological distance among team members due to the
difference in technology skills. This may explain why several project teams had, at most, one
member using the SW platform for the rest of the group. This kind of behaviour was also
observed over the course of the project. The remaining nine project teams declared that while the
use of the SW platform partially bridged technological distance, it simultaneously introduced
social distance.
‘Unbalanced technological usage’ and ‘lack of media-naturalness’ were both rated by
survey respondents as significant collaboration barriers.
This study confirms that the use of technologies to compress or bridge some distance
types simultaneously introduced others, such as social and legal distances. This confirms

218
Mulder’s (2002) argument that distributed group members should have a mutual understanding
of how to use collaborative technologies.
5.9 Legal Dimension
This section is based solely on the survey and FGI findings, as the legal dimension could
not be fully experienced in the context of student projects.
5.9.1 Ownership Distance
None of the project teams stated that ownership distance was bridged by the use of the
SW platform. In fact, they had no concrete experience with this type of distance, although the
Master’s Degree in Innovation does include a course on the protection of Intellectual Property
Rights (IPR), patenting and copyrighting. While eight project teams estimated that the issue of
ownership distance was not tackled at all by the use of a SW platform, the six that perceived this
distance type to be partly bridged based their conclusion on the fact that most of the needed
information (e.g. who has an idea, who has created a new concept) is embedded inside the
documents stored on the SW platform. However, in order for the platform to become a real IPR
management application intended to manage ideas ownership within a group of individuals, a
specific data mining must be put in place. Interestingly, in the debate about the software tracking
all participants’ actions across the SW platform, another concern emerged regarding privacy and
fears of a ‘Big Brother’ syndrome.
‘Unbalanced IPR approach’ was rated by survey respondents as the fourth most
significant collaboration barrier. This confirms the paramount importance of having a technology
able to manage ownership, at least in the context of creative commons or science commons, as
suggested by Ristau Baca (2006).
219
5.9.2 Contractual Distance
Six project teams estimated that the SW platform partially answered the need to bridge
contractual distance, offering a way for participants to adopt a set of common rules covering
financial, security, confidentiality and privacy aspects (legal and ethical contractual aspects being
enforced by local regulations). The remaining eight project teams declared that this contractual
distance type was not handled at all by the use of a SW platform, but did not provide any
explanation for this view. Interestingly, some participants mentioned that their project customers
asked questions about security, IPR and privacy issues in direct relation to the use of the SW
platform.
‘Different contractual settings’ and ‘lack of common security rules’ were rated by survey
respondents as significant collaboration barriers. This study confirms that while technologies can
be used to compress or bridge different distance types, this simultaneously introduces other
distance types such as contractual distance, particularly with regard to security, IPR and privacy
issues within the legal dimension.
5.9.3 Financial Distance
This distance type was addressed only in the survey on collaboration barriers, as it was
impossible to implement it in the context of student projects. ‘Different investment regulations’
was rated by survey respondents as a significant collaboration barrier. It is widely recognised that
financial investments for innovation often depend on local regulations on investment for R&D.
5.10 Summary of Discussion on Distances
This section summarises the findings and analysis of the survey on collaboration barriers,
the focus group interviews and the log data of the 14 project cases for each dimension of the
CDF. A comparison of the evaluation of each distance type and collaboration technology for
compressing or bridging the distance is provided in the following figure (see Figure 5.11). The
220
bar graph on the left hand side of the figure corresponds to the combined survey rating of each
factor into the distance type to which it belongs. The bar graph on the right hand side of the
figure presents the FGI and log data rating of the distance type as bridged by the collaboration
tools used. Overall, in terms of barriers and distances, the legal dimension was considered the
most difficult, with an average score of 2.3, followed by the technical dimension with 2.2, then
the structural dimension with 1.9, and finally, social distance with 1.8. While the legal dimension
is revealed as the toughest collaboration barrier, there is a clear lack of empirical research
addressing IPR, investment regulations, security and privacy policies in the context of
collaboration for supporting open innovation.
There is also a lack of technology development for tracking ideas ownership
(copyrighting) and privacy, although such technology could be implemented when people are
operating within an e-collaboration context. This situation explains the evaluation of
corresponding distances as unsatisfactorily bridged by technology. Surprisingly, while the
technical dimension comes second, the social dimension ranks fourth, where the inverse situation
might have been expected. This might indicate that technology users are disappointed by the
lack of sense-making features in the current collaboration tools, which would explain the high
rating of conceptual and semantic distances.
The rating of contextual distance indicates a need for more contextual awareness
features, while the technological distance reveals a crucial need for more intuitive and
customisable tools. By contrast, the development of social computing, combined with the current
deployment of a plethora of Web 2.0 social media applications, counter-balances the evaluation
of the social dimension, especially because project participants were Digital Natives. Finally, the
structural dimension ranks third, mainly due to the high rating of institutional and organisational
distances. It should be noted that while an enterprise’s policy on the use of social media
applications becomes part of the institutional distance, the organisational distance increases as
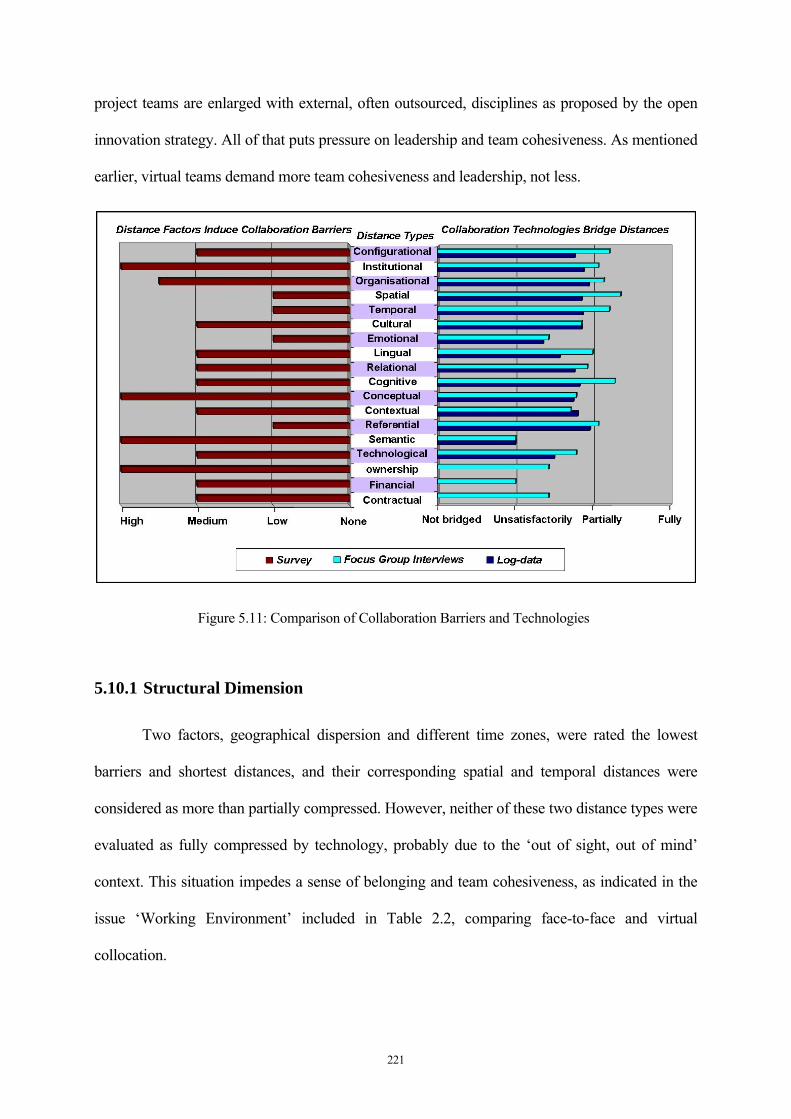
221
project teams are enlarged with external, often outsourced, disciplines as proposed by the open
innovation strategy. All of that puts pressure on leadership and team cohesiveness. As mentioned
earlier, virtual teams demand more team cohesiveness and leadership, not less.
Figure 5.11: Comparison of Collaboration Barriers and Technologies
5.10.1 Structural Dimension
Two factors, geographical dispersion and different time zones, were rated the lowest
barriers and shortest distances, and their corresponding spatial and temporal distances were
considered as more than partially compressed. However, neither of these two distance types were
evaluated as fully compressed by technology, probably due to the ‘out of sight, out of mind’
context. This situation impedes a sense of belonging and team cohesiveness, as indicated in the
issue ‘Working Environment’ included in Table 2.2, comparing face-to-face and virtual
collocation.
222
By contrast, while ‘lack of incentive’ was rated as one the highest collaboration barriers
and a longer distance, its corresponding institutional distance type was evaluated as partially
bridged. One might infer that technology does not bring any incentive, but instead raises a
supplementary barrier in terms of technology skill. In fact this is not the case, since every team
member and leader can visit the shared workspace to look at the recorded contributions of other
members; therefore, they can assess the collaborative attitude and contributions of everyone. It is
even possible for every involved project stakeholder to get a list of the most active collaborators.
The organisational distance factors ‘lack of clear leadership’ and ‘multidisciplinary
setting’ were rated as highest and medium barriers respectively, resulting in one of the longest
distances. This distance type was evaluated as partially bridged by technology due to available
features on the SW platform such as shared knowledge objects, folder structuration and
expectation awareness. The two remaining factors, ‘unbalanced power in decision making’ and
‘unbalanced expertise’, aspects of configurational distance, were both rated as medium barriers
resulting in a medium distance, which was evaluated as partially bridged by technology. This
could be explained by the degree of transparency of the decision process implemented by the
project teams and by the involvement of diverse competences.
5.10.2 Social Dimension
Within the social dimension, ‘lack of mutual trust’ was rated as one of the highest
barriers, and this together with ‘weak ties’ and ‘interpersonal awareness factors’ accounted for
the relational distance. This medium rated distance was considered as partially bridged by
technology. For example, interpersonal awareness plays an important role in collaboration
effectiveness, because each team member has to know what the others are doing and what kind
of problems they are facing, so that he can self-organise, adjusting his own contributions and
anticipating which tasks must be given priority. In a previous empirical study, Erickson called
this form of awareness ‘social translucence’ (Erickson & Kellogg, 2000).
223
Interestingly, ‘emotional behaviour’ was rated as one of the lowest barriers; hence
emotional distance ranks as one of the shortest distances that was evaluated as unsatisfactorily
bridged by technology. However, Damian (2002) in a case study about distant negotiation
revealed that holding meetings within computer-mediated distributed settings did not result in a
decrease of performance. Indeed, Damian argues that the ability to better sense emotional states
within face-to-face meetings brings a risk of impeding the negotiation process.
‘Diversity setting’ and ‘absorptive capacity’ result in a medium-sized cognitive distance,
considered in this study as partially bridged by technology. This is mainly due to the use of
group tagging and folder structuration available on the SW platform. Finally, ‘lack of commons’
and ‘multi-lingual setting’ were also rated as medium-sized barriers, resulting in cultural and
lingual distance respectively. Interestingly, both were considered as partially bridged by
technology. While the SW platform was used to create a common project culture, nothing really
explains how the technology used was able to partially bridge the lingual distance, except the
fact that the platform was operating in various languages.
5.10.3 Technical Dimension
‘Lack of common description’ and ‘lack of meaning’ were rated among the highest
barriers, resulting respectively in conceptual and semantic distances that were considered
partially and unsatisfactorily bridged by technology. While lack of common description
corresponds to the notion of shared knowledge, lack of meaning corresponds to the notion of
sense-making; together they form the basis for reaching a mutual understanding. Roschelle and
Teasley (1995) argued that the construction of shared meaning is the very essence of
collaboration. Another factor, ‘multiplatform setting’, was rated as a medium-sized barrier,
resulting in the referential distance that was considered as partially bridged by technology.
‘Media naturalness’ and ‘technological usage’ were also rated as medium-sized barriers and
resulted in technological distance, which was considered as almost bridged by technology.
224
Finally, ‘contextual awareness’ resulted in contextual distance, which was considered as partially
bridged by technology.
5.10.4 Legal Dimension
The most prominent legal dimension factor appears to be ‘unbalanced IPR approach’,
whereby collaborating partners have different approaches and objectives for ownership. Among
the experienced people who responded to this survey on collaboration barriers, this factor of
ownership was considered one of the highest collaboration barriers. Other factors such as ‘shared
security rules’, ‘contractual setting’ and ‘investment regulations’ were rated as medium barriers.
The resulting distances were considered to be unsatisfactorily bridged by technology.
5.11 Discussion on Project Teams’ Collaboration Performance
Due to the mixed mode of collocation, project teams could not rely solely on face-to-face
interaction (McDonough et al., 2000). Therefore, team members had to interact electronically
through the use of synchronous and asynchronous tools. Within the project objectives, each team
was required to produce several deliverables, where members had to contribute in order to
achieve good quality outcomes. The development of the deliverables was realised on the SW,
which implies a number of created content objects and a higher number of generated events. The
more generated events from all team members, indicating that all team members were
contributing to the development of the content objects, the higher the collaboration effectiveness.
The larger the gap between the numbers of created content objects and generated events,
indicating that team members were properly contributing (i.e. reading, reviewing, commenting,
editing) to each other’s work, the higher the interpersonal productivity level. In project cases
with lower collaboration efficiency, only a few team members generated events, and not
necessarily on the content objects developed by others. The extreme case would be a project
225
team in which each team member developed content objects alone, without any interactions with
the rest of the team, revealing a ‘zero’ collaboration effectiveness.
In addition to using SW log data to evaluate the collaboration effectiveness and
efficiency, it was decided to make observations on team members’ respective understandings,
cohesiveness and interpersonal relationships during each review meeting. Project review
meetings were intended to assess the respective quality of the projects (functional model, Pert
and Gantt diagrams), their current progress and the deliverables (both draft and final versions), as
well as the operative mode of project teams. All review meetings resulted in qualitative
evaluations of each project team, which were then combined with the quantitative evaluations
generated with the use of the SW log data. The resulting ratios of collaboration effectiveness and
efficiency are presented in Figure 5.12, showing that project teams P01, P03 and P05
outperformed the other teams. To some degree, P02 and P04 also outperformed the majority of
the other teams. It should be noted that project teams from P01 up to P05 intensively shared
information about their practices and experiences during informal discussions, which allowed
teams to save time by re-using what was working and by not repeating mistakes. Ultimately, they
created a common project culture based on the sharing of practice and experience; this
contributed to bridging institutional, configurational and organisational distances, and greatly
increased both their collaboration effectiveness and efficiency. The lower efficiency ratio teams,
P06 to P14, operated entirely without communicating with other teams. As a result, they wasted
time by repeating mistakes already made by other teams, and were unable to save time by re-
using successful practice.
One example of re-using performing practices occurred during the first review meeting,
when the review panel introduced to project team P03 the notion of collectively elaborated
project progress summary. During the following review meeting, this practice was disseminated
to teams P01, P02, P04 and P05. After a while, students explained that this practice had been
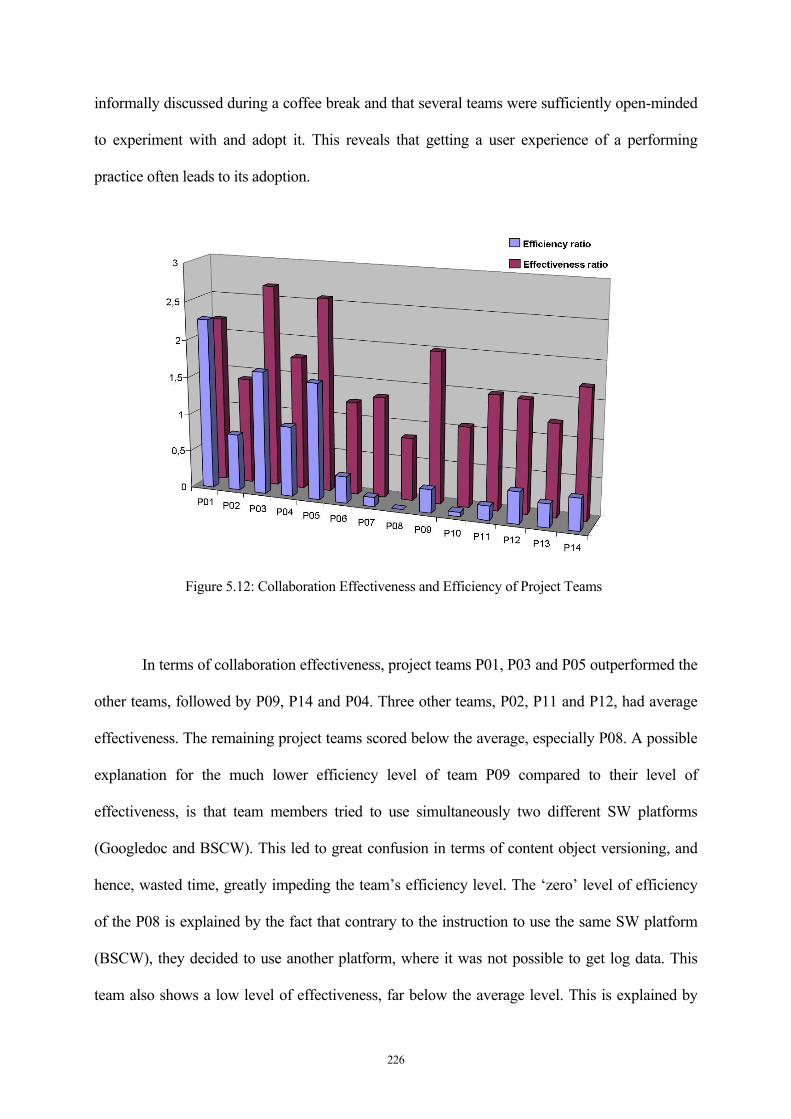
226
informally discussed during a coffee break and that several teams were sufficiently open-minded
to experiment with and adopt it. This reveals that getting a user experience of a performing
practice often leads to its adoption.
Figure 5.12: Collaboration Effectiveness and Efficiency of Project Teams
In terms of collaboration effectiveness, project teams P01, P03 and P05 outperformed the
other teams, followed by P09, P14 and P04. Three other teams, P02, P11 and P12, had average
effectiveness. The remaining project teams scored below the average, especially P08. A possible
explanation for the much lower efficiency level of team P09 compared to their level of
effectiveness, is that team members tried to use simultaneously two different SW platforms
(Googledoc and BSCW). This led to great confusion in terms of content object versioning, and
hence, wasted time, greatly impeding the team’s efficiency level. The ‘zero’ level of efficiency
of the P08 is explained by the fact that contrary to the instruction to use the same SW platform
(BSCW), they decided to use another platform, where it was not possible to get log data. This
team also shows a low level of effectiveness, far below the average level. This is explained by
227
the attitude of some of team members, which contributed to a non collaborative climate in which
they remained a group of individuals working separately without any motivation. It should be
noted that out of 14 project cases, only one was finally unable to form a team despite all the
instructions, techniques, methods and tools being provided in advance. Teams that had members
with a lower technology skill, impeding an appropriate use of the SW, had a lower efficiency
ratio.
The performance figure also shows that, with the exception of P08, all project teams had
a satisfying effectiveness ratio compared to their efficiency ratio. This situation could be
explained by the inclusion of training on shared collaboration techniques and methods, which led
to the development of a common project process model, facilitating mutual understanding
among team members. It appears that when team members develop a common model, it leads to
shared mental models, clarifying the shared understanding of tasks. Previous studies have
illustrated the positive role of shared mental models on team performance (Cannon-Bowers et
al., 1993; Mathieu et al., 2000; Espinosa et al., 2002; Levesque et al., 2001; Carley, 1997; Eccles
& Tenenbaum, 2004; Smith-Jentsch et al., 2005; Kleinsmann & Valkenburg, 2005). In this
empirical study, the development of a project process model by project stakeholders led to
shared mental models, hence to mutual understanding. It played a crucial role in bridging the
cognitive distance and increased the collaboration effectiveness.
With regard to the efficiency ratio, one can observe two groups. One group, comprising
teams numbered P01 to P05, were the most skilled in the use of technology. Therefore, they
outperformed a second group, comprising teams numbered P06 to P14, who were less skilled in
using collaboration technology and tools. This illustrates the important effect of technology
distance, which also explains project stakeholders’ reluctance to use the SW platform. It should
be noted that no specific training in the use of the SW platform was provided to the project
teams. As teams P01 to P05 were sharing practices and experiences, the deeper technology skills
228
of some members were disseminated to others within the informal community. This illustrates
the importance of team members’ absorptive capacity. Furthermore, the expected intuitivity level
of the SW user interface did not meet expectations compared to current Web 2.0 applications, to
which students are accustomed.
5.12 Confronting Distance Factors with CWE
Table 5.8 below presents the CWE tools and technologies contributing to the overcoming
of collaboration barriers. The table represents a matrix with a list of factors on the vertical axis
and a list of tools on the horizontal axis. The matching of factors and tools is based on the
findings of the focus group interviews and research work carried out during the ECOSPACE
project. A detailed description of Web-based applications, including advantages and
disadvantages, has been presented in a previous paper (Pallot & Bergmann, 2010).
It frequently appears in the literature that different types of contexts, such as social
settings, spatial locations, time zones, tools and technologies in use, and activity types, play a
crucial role in group cognition, behaviour and task coordination, whereby everyone involved in a
collaboration context tries to adapt his behaviour according to the current situation. This has been
characterised as ‘swarm intelligence’ (Dorigo & Stützle, 2004) or the ‘stigmergic approach’
(Elliott, 2006) where activities of ants are driven by pheromones. Hence, ‘social awareness’ and
‘presence awareness’ are interesting aspects to observe in terms of their impact on the
performance of the collaborative work performed. There are already a number of tools offering
presence awareness for users who wish to know who else is online in the same application, but
very few propose social awareness. For example, BSCW16 is the only CWE that allows the
sharing of expectations in terms of actions to be undertaken by specific team members. This is
fundamentally different from traditional workflow tools, as it does not enforce the tasks, but
rather lets team members adjust themselves to the current situation. This kind of expectation 16 http://public.bscw.de/
229
awareness feature, being part of social awareness, is typically well-suited to supporting
coordination and leadership in distributed collaboration. It also fits well with the concept of
social translucence, defined by Erickson (2000) as ‘digital systems that support coherent
behaviour by making participants and their activities visible to one another’.
In this study, social awareness corresponds to behavioural adaptation in various
situations, as it is about not only what people know or become aware of, but also what people
consequently deduct and do. This fits perfectly with the concept of social intelligence (Goleman,
2006), which combines social awareness (what we sense) and social facility (what we do). In
fact, social awareness is about sensing the inner state of one another in order to understand
related feelings and thoughts, as well as specific social situations. Goleman (2006) argues that it
includes various elements such as primary empathy, the ability to feel with others and sense non-
verbal emotional signals; attunement, the ability to listen with full receptivity; empathetic
accuracy, the ability to understand another person's thoughts, feelings and intentions; and finally,
social cognition, the ability to know how the social world works.
Goleman (2006) also stated that social facility builds on social awareness to allow
smooth, effective interactions, rather than simply sensing how we feel, think or intend to act
toward one another. Included in this are elements such as synchrony, the ability to interact
smoothly at the non-verbal level; self-presentation, the ability to present ourselves effectively;
influence, the ability to shape the outcome of social interactions; and concern, the ability to care
about others' needs and act accordingly.
During the project cases, it was found that most of the participants were satisfied by the
use of the provided collaboration technologies to overcome distance factors. This was especially
true for spatial and temporal distances, but also applied to some degree to cognitive, cultural, and
emotional distance. Counter-intuitively, emotional and social distances were also mentioned as
providing an opportunity to remotely start a relationship with someone who is too shy or too

230
emotional to interact live in a face-to-face situation. One participant explained that emotional
distance had greatly helped to overcome a conflict, without explaining clearly the type of conflict
but describing a situation in which one group member wished to impose his own view rather
than having a more consensus building approach.
However, the project case participants found that collaboration tools increased the social
distance and introduced technological distance due to unbalanced technology skills and lack of
media-naturalness. Team members also acknowledged the great benefit of online content storage
on the shared workspace, where documents are available at any time from any location as long as
there is an Internet connection available. It seems that some of them even enjoyed working
remotely from home, enabled by Internet access to up-to-date documents, and started to work
outside normal operating hours.
Most of the participants preferred to use instant messaging tools as synchronous rather
than asynchronous communication. However, when necessary, they used e-mail as an
asynchronous communication tool rather than group blogging, chiefly because it was considered
easier to get access to e-mail than to blogging.
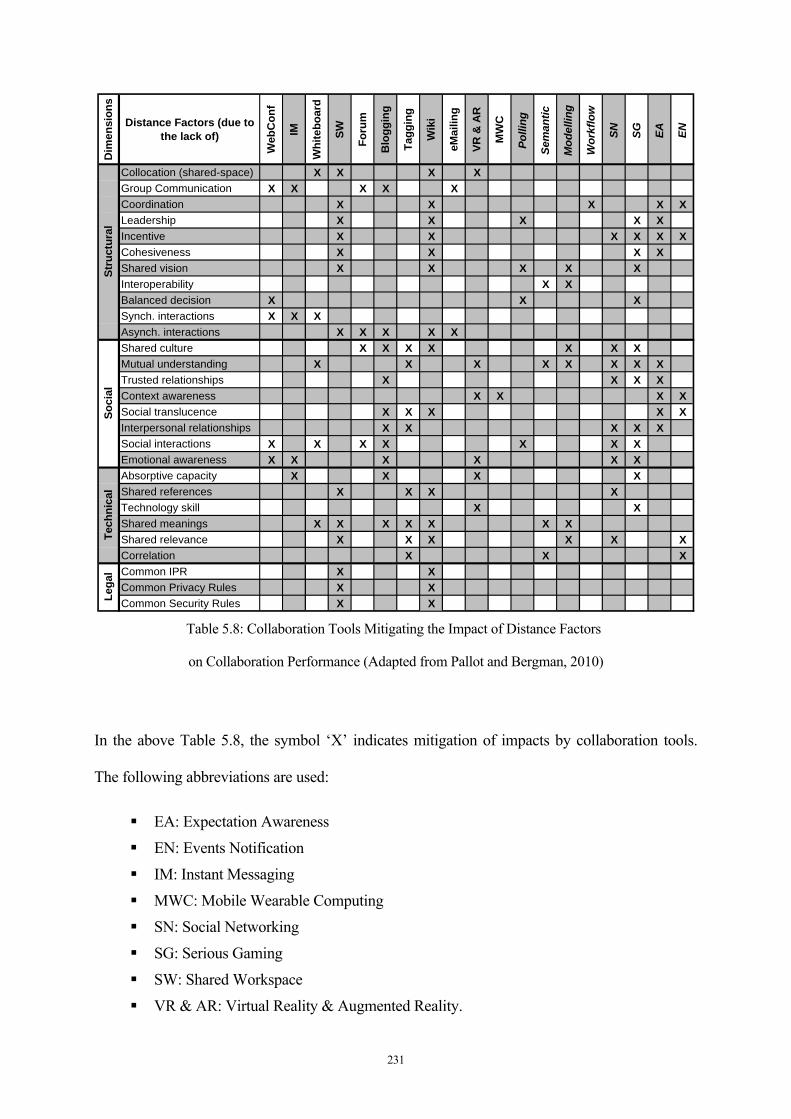
231
Dim
ensi
ons
Distance Factors (due to the lack of)
Web
Con
f
IM
Whi
tebo
ard
SW
Foru
m
Blo
ggin
g
Tagg
ing
Wik
i
eMai
ling
VR &
AR
MW
C
Polli
ng
Sem
antic
Mod
ellin
g
Wor
kflo
w
SN SG EA EN
Collocation (shared-space) X X X XGroup Communication X X X X XCoordination X X X X XLeadership X X X X XIncentive X X X X X XCohesiveness X X X XShared vision X X X X XInteroperability X XBalanced decision X X XSynch. interactions X X XAsynch. interactions X X X X XShared culture X X X X X X XMutual understanding X X X X X X X XTrusted relationships X X X XContext awareness X X X XSocial translucence X X X X XInterpersonal relationships X X X X XSocial interactions X X X X X X XEmotional awareness X X X X X XAbsorptive capacity X X X XShared references X X X XTechnology skill X XShared meanings X X X X X X XShared relevance X X X X X XCorrelation X X XCommon IPR X XCommon Privacy Rules X XCommon Security Rules X X
Stru
ctur
alSo
cial
Tech
nica
lLe
gal
Table 5.8: Collaboration Tools Mitigating the Impact of Distance Factors
on Collaboration Performance (Adapted from Pallot and Bergman, 2010)
In the above Table 5.8, the symbol ‘X’ indicates mitigation of impacts by collaboration tools.
The following abbreviations are used:
EA: Expectation Awareness
EN: Events Notification
IM: Instant Messaging
MWC: Mobile Wearable Computing
SN: Social Networking
SG: Serious Gaming
SW: Shared Workspace
VR & AR: Virtual Reality & Augmented Reality.
232
Many students claimed during the focus group interviews that uploading a document into
the shared workspace by ‘drag and drop’ was faster and much more reliable than sending an
attached document by e-mail. A few participants acknowledged interest in group blogging for
getting a project history and chronology of events, but re-emphasised that more external
participants would have encouraged more teams to experience a project blog. Finally, a large
majority acknowledged the complementarity of SW and group blogging technologies.
Intuitive user interfaces (e.g. drag and drop) with social as well as personalisation
features are crucial ingredients for successful adoption of CWE. However, social translucence,
social awareness and social intelligence are also related to specific working contexts. They are all
features expected by users for enhancing collaboration performance, especially in a distributed
context.
Another interesting aspect is that most of the participants considered collaborative
platforms to be useful if, and only if, project team members are in a distributed situation.
However, users were becoming progressively more aware of types of collaborative distance
other than the famous spatial one, and were beginning to recognise that collaborative platforms
could also be useful in a physically collocated situation. This constitutes an opportunity for ICT
developers to extend the aura of a place as well as of an object for a person17.
5.13 Comparison with other Surveys and Studies
5.13.1 AllCollaboration.com Study on Collaboration
A recent study carried out by the allcollaboration.com website sought to understand and
assess current practices in, and the future outlook on, collaboration. Over 450 respondents
participated in the survey, between January and February 2010. Respondents came from all
17 Concerning VR and AR the aura of an object is the combination of its cultural and personal significance for a user or group of users. ‘Cultural significance’ refers to the shared meaning for a community. ‘Personal significance’ refers to the individual associations that the place or object may have for a particular user.
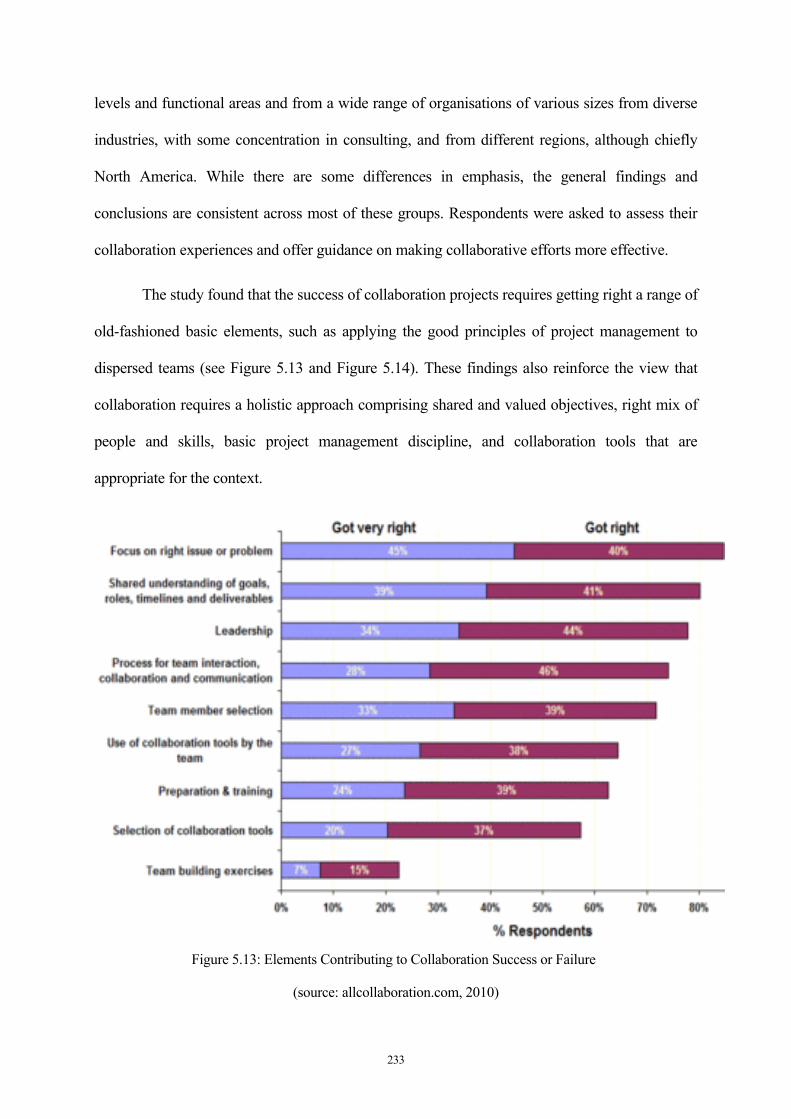
233
levels and functional areas and from a wide range of organisations of various sizes from diverse
industries, with some concentration in consulting, and from different regions, although chiefly
North America. While there are some differences in emphasis, the general findings and
conclusions are consistent across most of these groups. Respondents were asked to assess their
collaboration experiences and offer guidance on making collaborative efforts more effective.
The study found that the success of collaboration projects requires getting right a range of
old-fashioned basic elements, such as applying the good principles of project management to
dispersed teams (see Figure 5.13 and Figure 5.14). These findings also reinforce the view that
collaboration requires a holistic approach comprising shared and valued objectives, right mix of
people and skills, basic project management discipline, and collaboration tools that are
appropriate for the context.
Figure 5.13: Elements Contributing to Collaboration Success or Failure
(source: allcollaboration.com, 2010)

234
Participants argue that getting the old-fashioned basics right is critical. The most
important advice on effective collaboration offered by the respondents is to define goals, roles,
timelines and deliverables clearly, communicate the process and progress frequently and clearly,
and select team members who bring real knowledge and expertise. Key challenges to effective
collaboration include organisational culture and priorities, and collaboration process and tools.
Survey respondents evaluated e-mail, audio conferencing, file sharing, and Web
conferencing as being the most effective collaboration tools. Despite their perceived potential,
instant messaging (IM), discussion forums, wikis, and video conferencing rate among the least
effective for collaboration. There appears to be little connection between current widespread use
of a tool and its effectiveness for collaboration. IM is widely known and fairly easy to use, yet it
scored low on the effectiveness measure for collaboration and highest for being ineffective.
Selection of the correct tools, and proper training, are identified as potential areas for
improvement.
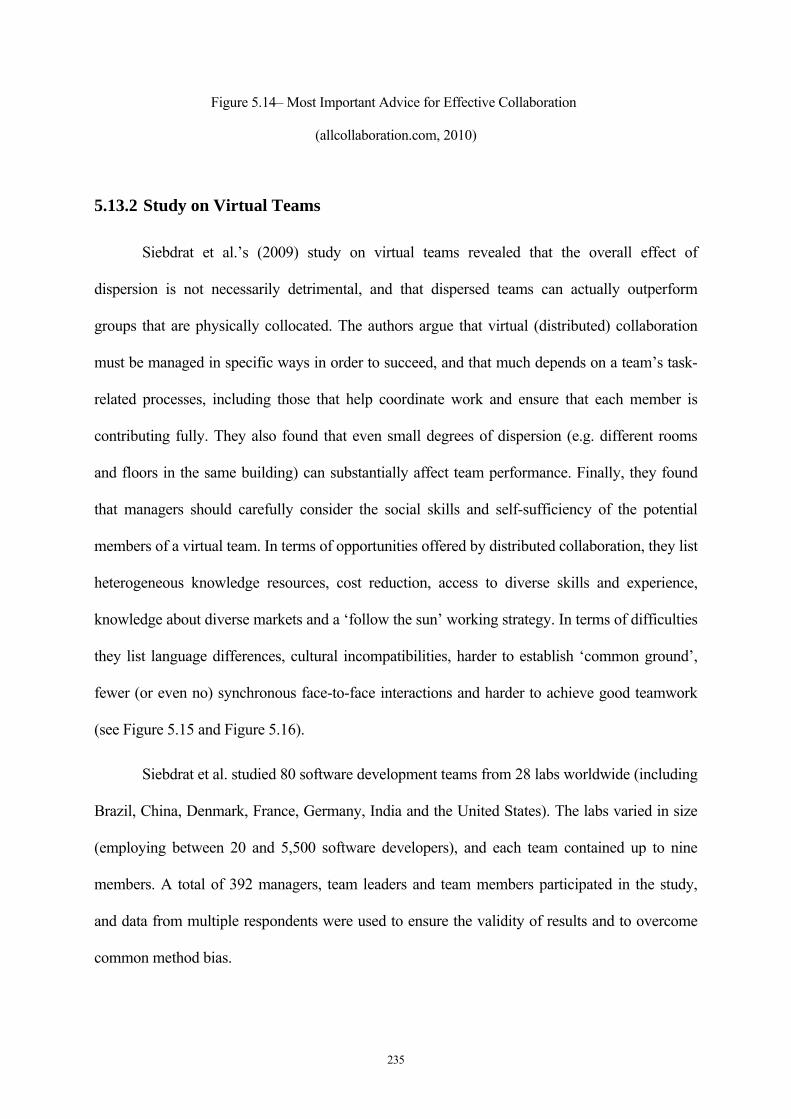
235
Figure 5.14– Most Important Advice for Effective Collaboration
(allcollaboration.com, 2010)
5.13.2 Study on Virtual Teams
Siebdrat et al.’s (2009) study on virtual teams revealed that the overall effect of
dispersion is not necessarily detrimental, and that dispersed teams can actually outperform
groups that are physically collocated. The authors argue that virtual (distributed) collaboration
must be managed in specific ways in order to succeed, and that much depends on a team’s task-
related processes, including those that help coordinate work and ensure that each member is
contributing fully. They also found that even small degrees of dispersion (e.g. different rooms
and floors in the same building) can substantially affect team performance. Finally, they found
that managers should carefully consider the social skills and self-sufficiency of the potential
members of a virtual team. In terms of opportunities offered by distributed collaboration, they list
heterogeneous knowledge resources, cost reduction, access to diverse skills and experience,
knowledge about diverse markets and a ‘follow the sun’ working strategy. In terms of difficulties
they list language differences, cultural incompatibilities, harder to establish ‘common ground’,
fewer (or even no) synchronous face-to-face interactions and harder to achieve good teamwork
(see Figure 5.15 and Figure 5.16).
Siebdrat et al. studied 80 software development teams from 28 labs worldwide (including
Brazil, China, Denmark, France, Germany, India and the United States). The labs varied in size
(employing between 20 and 5,500 software developers), and each team contained up to nine
members. A total of 392 managers, team leaders and team members participated in the study,
and data from multiple respondents were used to ensure the validity of results and to overcome
common method bias.

236
The authors found that:
Teams with a high level of task-related processes (such as those that help ensure
each member is contributing fully) outperform teams with a low level. The
difference becomes particularly acute the more dispersed the team is. Moreover,
virtual teams with high levels of task processes are able to outperform collocated
teams with similar levels of those same processes despite the physical separation
of their members. That is, the overall effect of dispersion can be beneficial,
depending on the quality of a team’s task-related processes.
Figure 5.15: Team Performance Depends on the Degree of Dispersion
(Siebdrat et al., 2009)
Siebdrat et al. also argue that:
Team performance tends to drop with increasing member dispersion. But
sometimes even a low level of dispersion (namely, members working on different
floors in the same building) can have a surprisingly large effect, especially with
respect to a team’s efficiency.
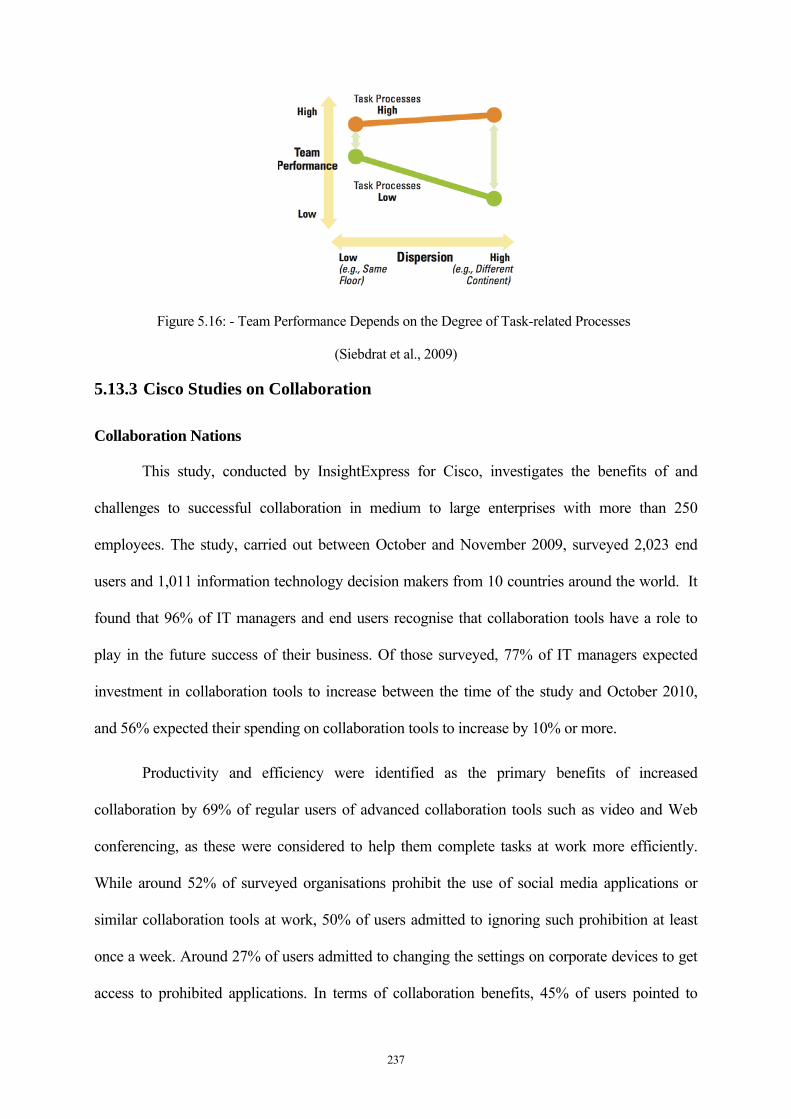
237
Figure 5.16: - Team Performance Depends on the Degree of Task-related Processes
(Siebdrat et al., 2009)
5.13.3 Cisco Studies on Collaboration
Collaboration Nations
This study, conducted by InsightExpress for Cisco, investigates the benefits of and
challenges to successful collaboration in medium to large enterprises with more than 250
employees. The study, carried out between October and November 2009, surveyed 2,023 end
users and 1,011 information technology decision makers from 10 countries around the world. It
found that 96% of IT managers and end users recognise that collaboration tools have a role to
play in the future success of their business. Of those surveyed, 77% of IT managers expected
investment in collaboration tools to increase between the time of the study and October 2010,
and 56% expected their spending on collaboration tools to increase by 10% or more.
Productivity and efficiency were identified as the primary benefits of increased
collaboration by 69% of regular users of advanced collaboration tools such as video and Web
conferencing, as these were considered to help them complete tasks at work more efficiently.
While around 52% of surveyed organisations prohibit the use of social media applications or
similar collaboration tools at work, 50% of users admitted to ignoring such prohibition at least
once a week. Around 27% of users admitted to changing the settings on corporate devices to get
access to prohibited applications. In terms of collaboration benefits, 45% of users pointed to
238
improved productivity and efficiency, 40% stated that they received assistance in solving
pending issues, and 31% gained faster decision making. The three most desired attributes of a
device or application were ease of use (58%), the ability to communicate anywhere and at any
time (45%), and finally, features and functionality (37%). Users mentioned that elements of
corporate culture can inhibit their ability to collaborate successfully. While around 46 % felt that
all decisions were made by people at the top of their organisations, 39% declared that colleagues
were not willing to share information.
Collaboration Tools
In a previous research carried out in December 2008, Cisco conducted the first formal
segmentation study of users of collaboration tools. The main objective was to understand how
workers collaborate, which tools they use, and how they believe those tools affect productivity,
innovation, and cost savings. The study surveyed 800 people in a wide variety of U.S. medium-
sized and enterprise organisations, who spent at least 20% of time at work using a network-
connected computer, used a mobile phone or handheld device and had participated in two
collaborative activities within the past month.
The study revealed, first, that organisational culture is as important to successful
collaboration as are the collaboration tools themselves. Important success factors, for about 40%
of study participants, include formal collaboration processes, such as weekly group conference
calls or blogging requirements, and effectiveness tracking. In addition, the study found that
collaboration is directly correlated with rewards, as 50% of respondents said that their company
rewards collaboration with bonuses and other rewards. Not surprisingly, respondents were
wholly in favour of tools and training, stating that successful organisations provide collaboration
tools and the training needed to use them effectively.
Second, the study found that employees regard collaboration as influencing success. The
vast majority of respondents said that collaboration is critical or important to their success at
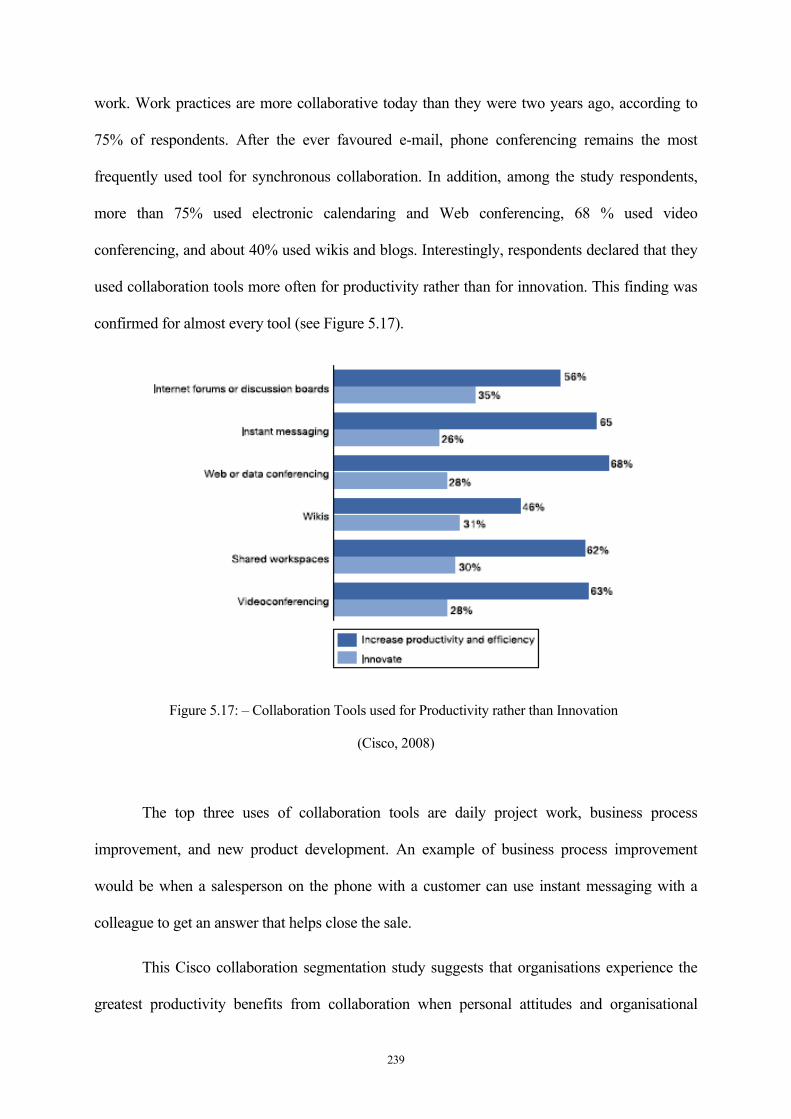
239
work. Work practices are more collaborative today than they were two years ago, according to
75% of respondents. After the ever favoured e-mail, phone conferencing remains the most
frequently used tool for synchronous collaboration. In addition, among the study respondents,
more than 75% used electronic calendaring and Web conferencing, 68 % used video
conferencing, and about 40% used wikis and blogs. Interestingly, respondents declared that they
used collaboration tools more often for productivity rather than for innovation. This finding was
confirmed for almost every tool (see Figure 5.17).
Figure 5.17: – Collaboration Tools used for Productivity rather than Innovation
(Cisco, 2008)
The top three uses of collaboration tools are daily project work, business process
improvement, and new product development. An example of business process improvement
would be when a salesperson on the phone with a customer can use instant messaging with a
colleague to get an answer that helps close the sale.
This Cisco collaboration segmentation study suggests that organisations experience the
greatest productivity benefits from collaboration when personal attitudes and organisational
240
culture are considered as important as collaboration tools. Another important criterion is that the
people and groups to whom collaboration tools are introduced should share positive
collaboration characteristics. In this study, these people were managers or supervisors, had held
their job position for 3 to 10 years, and were already using Web 2.0 tools at home. Organisations
must encourage executives to model the desired collaboration practices. Another crucial aspect is
the rewarding of collaboration by including it in performance reviews, offering rewards for
successful outcomes, or both. Management should also implement formal collaboration
processes. Finally, organisations must provide the tools, IT support, and training needed to
support collaboration.
5.14 Summary
This chapter has presented the analysis of the survey on collaboration barriers and
comparative cases, and the correlation between them. While the survey reveals the top six
barriers to be a mix of factors belonging to the different dimensions, the comparative cases show
that distance factors of the structural dimension can be satisfactorily bridged by applying
collaboration techniques and methods, plus the necessary training. The other collaboration
surveys reported in this chapter confirm the anticipated importance of shared understanding,
leadership, interaction process and tools, social translucence and training. Those studies reinforce
the finding that the overall effect of dispersion is not necessarily detrimental. It is also
recommended that managers should carefully consider the social skills and self-sufficiency of the
potential members of a virtual team.
It should be stated here that all the technical solutions used for the different collocation
modes are already available. However, a number of problems related to distance factors remain
unresolved. In particular there are concerns about the current unbalanced IPR approach, lack of
training, interoperable collaboration tools, security and privacy issues, contextual awareness, and
socio-emotional intelligence. Not surprisingly, e-mail is still the most mentioned collaboration
241
tool, far ahead of other synchronous or asynchronous interaction tools. Unfortunately, the
experimentation of group blogging to set up a project blog does not provide sufficient evidence
to predict whether it could supplant e-mail for communicating within a distributed collaboration
project. However, this question is definitely worth a new experimentation, as it could support
more social translucence. Finally, collaboration practice and experience sharing appear to be as
important as collaboration tools.

242
243
Chapter 6. Conclusion
W e c a n ' t s o l v e p r o b l e m s b y u s i n g t h e s a m e k i n d
o f t h i n k i n g w e u s e d w h e n w e c r e a t e d t h e m . –
A l b e r t E i n s t e i n
This chapter recaps the goals of the study and responds to the research questions,
revisiting the initial propositions in order to evaluate the resulting achievements. It lists the
contributions made to the body of knowledge, based on adapting existing models (Johari
Window model, IPO model) and on new elaborated models (CD holistic model, collaboration
process model, mutual understanding process model). Finally, it presents the lessons learned and
recommendations, outlines the limitations of this study and makes suggestions for future
research.
244
6.1 Introduction
This thesis has discussed the need to disambiguate the concepts used to represent
distance factors and to group them into valid classes, and has found that the herein elaborated
Collaborative Distance Framework (CDF) appears to fill this identified gap. The main idea
behind the development of the CDF was to increase the level of knowledge and understanding of
distance factors and their respective impacts on collaboration performance. As such, the CDF
allowed us to categorise previously published empirical studies on distance factors and
concurrently to identify which existing, or emerging concepts, and related technological artefacts
were compressing or bridging specific collaboration distance types.
As already mentioned in the literature review, individuals entering into collaboration are
facing a kind of paradox. On the one hand, close proximity among team members speeds up the
process of reaching a mutual understanding; on the other hand, it simultaneously reduces the
potential for creativity and innovativeness due to a lower level of diversity (Pallot, 2005).
However, the comparative cases confirmed that a higher diversity level demands more cognitive
effort and absorptive capacity on the part of team members in order to reach a satisfying level of
mutual understanding, enabling an effective collaborative innovation.
Interestingly, this survey clearly indicates that the most significant factors affecting
collaboration performance impede collaboration effectiveness rather than efficiency. The four
factors rated in this survey as ‘less significant’ impacted efficiency more than effectiveness.
However, two of them require ICT to solve the effectiveness aspect, while one of them improves
efficiency, as in the case of a potential conflict arising when emotion intrudes too much in
business activities. It seems logical that effectiveness factors are rated as the most significant, as
they condition the readiness for collaboration. For example, it is well known in the international
project arena that gathering participants from different countries, who have their own regional
and institutional culture and mainly use their respective mother tongues, creates such a distance
245
that collaboration effectiveness will not be ensured until they collectively decide to build a
common culture and use a common language (Pallot & Hof, 1999; Pallot et al., 2000).
6.2 Responding to the Research Questions
With regard to the main question addressing the way eProfessionals maintain a satisfying
collaboration performance whatever the operating mode (physical, virtual or mixed collocation),
this study confirms the paramount importance of using appropriate techniques, methods and
tools to sustain team effectiveness and efficiency in bridging or compressing various
collaborative distance types.
Turning to the sub questions, evidence of several dimensions emerged during the
literature review. While Knoben and Oerlemans (2006) pointed out the existing overlap and
ambiguity among proximity concepts used in the literature of inter-organizational collaboration,
this study established four dimensions and 18 collaborative distance types in the broader domain
of distributed collaboration, grouped into a specific Collaborative Distance Framework (CDF).
Such a conceptual framework is intended to provide a holistic view in order to disambiguate and
disentangle all the distance factors through their categorisation into several types, corresponding
to the 18 collaborative distance types. Distance factors do not necessarily negatively impact
collaboration effectiveness and efficiency.
In this study, it was seen that ICT support provided through the software platform
contributed greatly to overcoming collaboration barriers by bridging or compressing different
distance types, such as spatial and temporal distances. Other distance types were partially
bridged by the use of collaboration technology. However, the use of ICT also induces a specific
distance type, ‘technological distance’, which depends on the individual participants’ degree of
technology background, skill, training and absorptive capacity and technology maturity level
(e.g. user friendliness, interoperable collaboration services, etc).
246
The crucial role of mutual understanding has been revealed through the use of techniques
such as OBS, WBS and IDEF0 which, as proposed by Neumann et al. (2006), greatly contribute
to the development of shared mental models. Espinosa et al. (2002) demonstrated the positive
effect of shared mental models on task coordination success and reduced development time. In
the Johari Window model, mutual understanding appeared as the enabler of the interaction space
known as ‘the arena’ (Luft and Ingham, 1955). The collaboration mechanics have been
deciphered as an open spiral process of human activities, such as shared meaning, sense-making
and knowledge sharing. These activities contribute to the increase of mutual understanding,
which then enables the creation of new knowledge. This is said to be the essence of collaboration
(Roschelle, 1992; Roschelle & Teasley, 1995).
In this research, a tentative generic model of team interaction processes was designed,
based on the literature review and the above description of collaboration mechanics, where
several distance factors appeared to have a specific impact on the team activities. In the case
study the extended Johari Window model was presented in advance to the project participants to
explain the crucial role of exposing knowledge and seeking feedback to enlarge the arena of
mutual understanding, which also controls interpersonal productivity. All project cases except
one (P08) reported the usefulness of this model and its power to stimulate all project team
members to share knowledge and spend time on sense-making and creating shared meaning. It
seems to operate like the above described shared mental models by increasing the capacity to
efficiently coordinate tasks within a team (Neumann et al., 2006).
The study shows that the use of the collaboration techniques, methods and tools on social
mechanisms (conversation, online presence and awareness, translucence) provided the student
participants with an appropriate platform to interact successfully. The comments made by them
during the focus group interviews provide evidence of participant engagement in the process of
247
virtual team building and project knowledge sharing and address many of the distance factors
identified earlier in the literature.
Positive participant feedback on personal satisfaction and team collaboration
effectiveness collected during the focus group interviews provided evidence that team building
and relationship development did occur properly. It is also worth noting that the relationships
among the used techniques, methods and tools, appear to act as a platform for interaction,
highlighting the socio-emotional processes that build team relationships, cohesion and trust.
Furthermore, the general theme for successful virtual team characteristics integrates an
understanding of the social mechanisms of communication and collaboration.
It is therefore suggested that, based on this participant data, that the two research
questions are answered positively. The virtual team environment was perceived by the student
participants to be more successful when they applied the three social mechanisms of
communication and collaboration to their team building. Personal logs build stronger team
relationships and engage participants in more effective teamwork, creating a balance between
task achievement and working cohesively.
6.3 Propositions Revisited
A number of issues (see section 2.16) were investigated during this empirical study with
regard to increasing the level of knowledge on the role of mutual understanding in the
collaboration mechanics. All these issues are related to the research questions, specifically
addressing the correlations between:
1. Distance factors and mutual understanding
2. Collaboration technology and mutual understanding
3. Collaboration technology and collaboration performance
4. Mutual understanding and collaboration performance
248
5. Mutual understanding and mutual trust.
6.3.1 Distance Factors and Mutual Understanding
Mutual understanding was reported by the focus group participants as a crucial ingredient
for enabling knowledge creation. Within the social dimension it is directly affected by a number
of distance factors, such as background, interpersonal relationships, usages and norms, diversity,
group cognition, absorptive capacity, emotional behaviour, empathy and affectivity. As for the
structural dimension, it was stated that collaboration technology allows satisfactory compression
of spatial distance, and bridges temporal, configurational and organisational distances in such a
way that they do not impede mutual understanding. However, it was recognised that specific
training was crucial to overcome the technology induced barrier. It was also mentioned that
technology could help in reducing the ambiguity in the terminology used, hence overcoming
technical distance factors such as conceptual and semantic distances.
6.3.2 Collaboration Technology and Mutual Understanding
In terms of shared techniques and methods enforcing a shared understanding among team
members in the comparative cases, in addition to the use of SADT and IDEF0 for process
modelling, all project teams used WBS and OBS for the structuration of their respective projects
(see Figure 4.7). According to the boundary object theory (Star and Griesemer, 1989), shared
practices based on the use of common techniques and tools help team members to build a mutual
understanding. During the focus group interviews, project participants reported that during the
modelling sessions they had discussed and argued their views of the project according to their
own expertise. Finally, they had agreed on an integrative common view of the project process
that constituted the mutual understanding of the whole project process from mission statement to
deliverables. They also reported the usefulness of the software platform for structuring all
content objects according to the shared understanding of their project process. Similarly, the

249
versioning feature was reported as important for avoiding any misunderstanding that could
potentially be introduced by the use of wrong versions of content objects. Collaboration
technology, more particularly the modelling techniques and tools, were recognised by project
stakeholders as a crucial instrument for speeding-up mental model sharing and the reaching of
mutual understanding. However, they also mentioned that it requires specific training in order to
avoid the technological distance that depends on each individual’s technology skill. In
conclusion, there is strong correlation between collaboration technology and mutual
understanding, as techniques and tools allow the design of shared mental models, inducing a
larger and faster mutual understanding among team members. It appears that when team
members develop a common model, this leads to shared mental models that clarify the shared
understanding of tasks. Previous studies have illustrated the positive role of shared mental
models on shared understanding and team performance (Cannon-Bowers et al., 1993; Mathieu et
al., 2000; Espinosa et al., 2002; Levesque et al., 2001).
6.3.3 Collaboration Technology and Collaboration Performance
This empirical study reveals that while structural distances contribute to the inhibition of
shared purpose, vision, goals and objectives among distributed group members, techniques,
methods and tools used in the comparative cases were reported to be effective for compressing
and bridging these distance types. Lack of clear leadership, a factor within the structural
dimension, was confirmed by the survey respondents as the top collaboration barrier. As Lipnack
and Stamps (1997, page 173) pointed out, ‘virtual teams and networks demand more leadership
not less’. The survey results for the structural dimension confirm previous conclusions on the
paramount importance of leadership and trust in face-to-face as well as distributed collaboration.
However, the comparative case study of the 14 project cases demonstrated that appropriate
training on distributed project management and leadership helped all project teams to overcome
this collaboration barrier. Finally, it should be noted that all project cases, except P08, used the

250
same SW platform. They also had the same type of project within the same context of techniques
and methods, and attended the same training on IDEF0, OBS & WBS and distributed project
management and leadership.
Notwithstanding the above, the collaboration performance resulting from the different
project cases was rather heterogeneous, with a first group of five projects outperforming a second
group of nine projects. The main differentiation between the two was that the first group shared
practice and experience among projects, while all the projects belonging to the second group
operated in isolation. In fact, this was a first real project experience for the students involved, and
it appears that the project teams in the latter group made the same mistakes and wasted time on
finding solutions, while the teams of the first group avoided these traps through sharing practice
and experience. Another possibility is that the first group of projects might have included more
students with higher technology skills. This could explain their outperforming the second group,
especially on collaboration efficiency. This argument could still be valid even if only a few
technology skilled students were involved in the first group of projects, since they had this
informal community of practice and experience for disseminating performing practices. Finally,
the fact that there was no specific SW platform training provided could explain the
heterogeneous result in terms of collaboration efficiency performance.
The resulting collaboration effectiveness performance of all project teams, except P08,
appears to be more homogeneous, with a smaller difference between a first group of four projects
and another group of nine projects (excluding P08), which they outperformed. In the first group,
project P03 emerged as having the highest effectiveness performance; this was also the project
team that claimed a satisfying user experience with their project blog (use of group blogging
instead of e-mailing). The second group of projects had an average level of collaboration
effectiveness performance. This more homogeneous result could be explained by the techniques,
methods and tools put in place for the structuration of their project through the use of IDEF0,

251
OBS and WBS techniques, as well as the specific coaching for the functional modelling of their
project process and training on distributed project management and leadership.
6.3.4 Mutual Understanding and Collaboration Performance
Project participants very much appreciated the use of the extended Johari Window
model; this made them conscious of the important role of the interaction space and the fact that it
is conditioned by the amount of shared knowledge and mutual understanding. Participants in the
FGI declared that they perceived the direct relation between ability to reach a mutual
understanding and interpersonal productivity, as claimed by Luft and Ingham (1955). However,
participants also recognised that knowledge sharing implies a collaborative attitude and a certain
level of trust among team members, because there is no guarantee that someone will not claim as
his own an interesting idea expressed by a colleague. They explained that tools are helpful in that
when an idea is written down and saved in an archive then it is much more difficult for someone
else to claim ownership.
6.3.5 Mutual Understanding and Mutual Trust
Lack of mutual trust was described as increasing relational distance, which leads to weak
ties among group members. Leadership and trust are collaboration factors often mentioned in the
literature. According to Lipnack and Stamps (1997, page 225): ‘In the networks and virtual
teams of the Information Age, trust is a need to have quality in productive relationships.’ In the
literature, leadership and trust appear quite often as conditioning collaboration effectiveness and
efficiency. This is probably due to the fact that trust has a greater impact on collaboration
effectiveness, while task and process leadership has a greater impact on the efficiency of the
collaboration process. However, the level of trust greatly depends on the ability and amount of
shared knowledge and strategic information (e.g. purpose, vision, goals and objectives) among
distributed team members. Participants in the FGI stated that when team members uploaded
252
content objects on the SW platform, this contributed both to broadening the knowledge sharing
and to increasing the level of trust. They declared that in this kind of CWE the retention of
information becomes obvious, as it is easy to see who is not contributing by sharing their
collected and/or elaborated content objects (explicit knowledge). One might infer from this that
the larger the knowledge sharing, the higher the mutual trust. Mutual trust is also affected by
interpersonal relationships and frequency of face-to-face meeting, in compliance with the rule,
‘out of sight, out of mind’. However, when collaborating with other people for the first time,
there is no pre-existing interpersonal relationship. In this case, trust is progressively built through
individual behaviour in terms of collaborative attitude, openness and reciprocity in the sharing.
Even if it is not specifically recognised by project participants as evidence, the ability to share
knowledge implies the ability to understand each other. Therefore, it seems logical to claim that
mutual understanding increases the capacity of mutual trust. Nonetheless, the ability to
understand team members from other disciplines requires a demanding absorptive capacity,
which means a necessary level of empathy to care for and listen to others (e.g. voice of the
customers).
6.4 Contribution to Knowledge
While the main objective of this study lies in characterising a holistic model of
collaborative distance and providing a specific framework for researchers and ICT developers,
namely the Collaborative Distance Framework (CDF), it is our hope that this framework will
also help in identifying newly emerging artefacts which are able to reduce some collaboration
barriers by compressing, or bridging, one or several distance types. The medium to long term
goal is to achieve a collaborative distance phenomenology, relating different empirical
observations of distance phenomena to one another. In reality, one distance factor might also
affect other distance factors, such as interpersonal relationships impact trust and vice-versa.
Therefore, networking distance factors among themselves and with observed phenomena would
253
greatly contribute to increasing the level of understanding and would lead to a more effective and
consolidated body of knowledge in this area. Furthermore, the literature review allowed us to
identify a clear lack of a generic collaboration process and mechanics, which implies a need to
formalise a generic collaboration process (Pallot et al., 2004) or meta-process which individuals
apply when they are collaborating online. This kind of generic process would provide an
opportunity to define proper metrics for better measuring the impact of distance factors on
collaboration performance.
The main contributions to the body of knowledge lie in the CDF components, and
comprise the following:
A holistic model of collaborative distance showing the relationships between
collaboration barriers, distance factors, distance types and collaboration technology (see
Figure 2.6);
A holistic view of collaborative distance, including four dimensions and 18 distance
types for classifying all distance factors (see Figure 2.7);
A social interaction model, based on an extended version of the Johari Window model
(Luft and Ingham, 1955) that explains how to enlarge the area of mutual understanding,
determining the level of interpersonal productivity for increasing creativity and
innovativeness (see Figure 2.8, Figure 2.9 and Figure 2.10);
A generic collaboration process model describing the interrelated layers of activities (see
Figure 2.11);
A logical model of the collaboration mechanics articulating the role of awareness,
responsiveness, sense-making and mutual understanding (see Figure 2.12);
A structural model integrating the generic collaboration process activities with the
mechanics of collaboration (see Figure 2.13);
254
A revised IPO model for the collaborative distance experiment through 14 comparative
cases (see Figure 3.8);
A generic model of a group interaction process based on the collaboration mechanics
(see Figure 3.9). This model further introduces distance factors in the knowledge creation
process that are intended to decipher the role of mutual understanding on collaboration
performance and the way it is impacted by distance factors.
6.4.1 The Collaborative Distance Holistic View and Model
As presented in Chapter 2, the lack of a holistic view of all distance types and factors
affecting collaboration effectiveness and efficiency constituted the most important gap in the
existing literature that was filled by the issued CD holistic view and model. Hence, we claim that
based on this CD holistic view and model it becomes possible to disentangle all factors in order
to better understand their interrelationships. Furthermore, the CD holistic view and model greatly
contribute to reducing the conceptual ambiguity among different concepts used in the literature,
in order to facilitate the task of identifying the different types of distance and their respective
roles. Finally, they allow both researchers and technology developers to compare findings among
the published case studies while facilitating the study of the potential capacity of new practices
and new tools for compressing or bridging distances.
6.4.2 The Collaborative Distance Framework (CDF)
The resulting CDF, through the use of its different components, enables the study of
distance factors within collaboration projects, as was done with the 14 project cases through
interviewing project participants and interpreting traces (log-data) issued during the use of
collaboration technology.
255
The first step consists of identifying, classifying and relating the distance factors
expressed by project participants during the interviews, using the CD holistic view and model.
This step allows researchers to make some comparisons with published case studies.
The second step consists of evaluating the collaboration process and mechanics. During
this step, activity traces recorded in log-data are interpreted to assess the level of social
interaction among project participants, using the extended Johari Window Model. Further, the
interpreted collaboration process is compared with the generic collaboration process model and
then compared with the collaboration mechanics model in order to see whether the collaboration
mechanics is properly articulated.
The third step consists of evaluating the project team performance in terms of
collaboration effectiveness and efficiency in order to see whether collaboration barriers raised by
distance factors are properly compressed or bridged by the used collaboration technology. First
of all, the Input-Process-Output (IPO) model should be updated according to the collaboration
tools used by the project team. If the project team uses an online Shared Workspace tool to
support project activities and a Group Blogging tool to support the project communication then
the IPO model would fit without any necessary modification. However, project communication
could also be handled by the use of an online synchronous communication tool (e.g. Skype) to
support live interactions among distributed team members. In this case, the socio-emotional
process of the IPO model should be revised to take into account interpretation of the traces
generated by the online synchronous communication tool. Secondly, the Group Interaction
Process Model allows the researcher to interpret the impact of distance factors on the level of
achieved mutual understanding according to the traces generated by the use of the collaboration
tools.
The interpretation of traces generated by the use of collaboration tools (log-data)
provides a satisfying quantitative evaluation. As for the qualitative evaluation, we recommend
256
assessment of the quality of the content objects produced by the project team. During this study
project reviews appeared to be the appropriate instrument to evaluate the quality of the team
production as well as team members’ relationships and team cohesiveness.
Finally, a project team could use the CDF for concurrent monitoring of the collaboration
effectiveness and efficiency among team members and to introduce time-to-time new
collaboration methods, techniques and tools in order to make valuable observations on their
capacity to contribute to overcoming collaboration barriers that are induced by distance factors.
6.5 Lessons Learned and Recommendations
A Living Lab user-centred research and innovation approach was introduced in order to
provide student participants with a user experience of collaborative distance and Shared
Workspace platforms and to evaluate the corresponding impact on collaboration performance.
While a large amount of data was collected through the SW platform log data and focus group
interviews, it is too early to come to a conclusion on the use of the Living Lab approach
regarding the ideas brought by users (the students) for improving the SW technology. However,
it was clear that there is a need for specific ICT based research instruments to support dynamic
user profiling and modelling, multi-modal collection of data and multi-source data analysis in
order to speed up the overall analysis process. This is especially true because collecting more
data with finer granularity enhances the overall quality, but also requires more time spent on
analysis and interpretation. In addition to the traditional features found in a collaborative
platform, the results of this empirical study confirm that intuitive user interface (e.g. drag and
drop), and social and personalisation features are crucial ingredients for user adoption. Good
examples of expected features include the display of real-time information about what colleagues
are doing, including project logo and photos in the webpage background. These, along with
members’ profiles with photos, all contribute to providing a human touch, not only ‘humanising’
collaborative platforms, but also improving the way people can perceive online collaboration.
257
Another interesting aspect is that right from the beginning, most of the participants
thought that collaborative platforms are useful if and only if project team members are in a
distributed situation. However, during the focus group interviews they became progressively
more conscious of types of collaborative distance other than the famous geographical one, and of
the fact that such a collaborative platform has also been experienced to be useful in a physically
collocated mode.
The next stage would be the involvement of a more diverse group of users, engaging
participants from different countries and regions. This would bring onboard more institutional,
configurational, cognitive, cultural and lingual distance factors than those already observed in
this empirical study.
6.6 Limitations and Future Research
While this empirical study was intentionally designed for student projects with real
customers and external experts within a mixed mode of physical and virtual collocation, one
limitation is the inherent natural open organisation mode of the university compared to the closer
organisation mode of business. Hence project structuration and operation were not ruled by strict
business organisation norms and policies (hierarchical directives). This situation could rightly be
considered as a limitation because in the real working world, every project would have its own
collaboration techniques, methods and tools. A worst possible scenario would consist of all
partners in the same project using their own collaboration environment.
However, it would have been impossible to identify 14 projects with a similar topic of
innovation in industry that would accept the use of common collaboration techniques, methods
and tools for the sake of an empirical study. This empirical study was prepared with several
invariants, such as the topic of the project cases, collaboration techniques, methods and tools, the
size of the teams and the mixed mode of collocation. Other invariants included the incentive for
258
students to gain an experience of a real innovation project with a real customer, to apply the
various techniques, methods and tools they had studied in the classroom, and to check their
performance. Finally, the project debriefing and ranking during the final review, which was
translated into a collective mark, constituted another common incentive. The variables were the
different backgrounds, cultures, disciplines, skills, behaviours and motivations of project
participants, as well as social abilities, such as empathy (caring about others). Team composition,
in terms of disciplines, was imposed according to the four Master’s classes in Innovation
(Strategic Information, European Venture, Agro-biology, and Virtual Reality). Collaboration
attitude, cultural usages and norms did not differ greatly among project participants. The types of
projects were quite similar (collaborative innovation). However, the project contents differed
because they were related to customers’ specific needs. The summary variables were the level of
interaction among project participants and the level of contribution effort and coordination by
team members. Indeed, all students were properly instructed in advance about potential
collaboration barriers raised by various distance factors and distance types that could be partially
or fully bridged or compressed by collaboration techniques, methods and tools. They were given
a document on collaborative distance including the full list of distance types and their
descriptions, and the list of distance factors.
This study has several other limitations. Notwithstanding the impressive number of
papers selected for the literature review, it might still be possible to identify other distance types
and related factors that would need to be included in this CDF. The different collaboration styles,
from teamwork to mass collaboration, were properly identified, but owing to a lack of time they
were not examined in-depth to compare the impact of various factors between structured and
unstructured collaboration. An attempt was made to disambiguate concepts used to represent
various distance types and related factors, and to reduce the number of concepts by identifying
synonymous labels. Nonetheless, disambiguating and disentangling completely all distance types
259
and related factors is still a challenge that would merit the setting-up of a specific research
community dedicated to collaborative distance. Deciphering the relationships among all distance
types and related factors within the four dimensions proposed in this study requires contributions
from a dedicated researcher community that could take place in the newly initiated collaborative
distance wiki pages.
Furthermore, this empirical study needs to be replicated in other project types besides
collaborative innovation, with heterogeneous disciplines involved in this kind of virtual
teamwork, to determine whether the outcome remains valid. The same model of guided students’
projects with the same social mechanisms of interaction (extended Johari Window model) can be
applied in other discipline areas in order to validate the holistic CD model.
However, it should be noted that a mass collaboration scenario (e.g. Wikipedia) was not
considered in any of the comparative cases. In this specific case, the notion of team does not
really exist, because contributors operate within a stigmergy or emergence approach. It would be
valuable in the near future to design the domain landscape of eCollaboration in order to better
locate mass collaboration and collaborative distance with other related research areas, as
mentioned in section 2.1 (see Figure 2.1). The size of the different areas would depend on the
respective volume of published papers.
In terms of future work, there is a need to enrich and complement the CDF by
contributing results from other empirical studies that involve distance factors and collaboration
barriers, in order to better correlate the findings. It would also be worthwhile to investigate the
collateral impact of distance factors within the various dimensions and the role of new ICT in
compressing or bridging the various distance types. The correlation among distance factors,
collaboration barriers and ICT support is viewed as an important step towards the design of more
effective and efficient collaborative working environments.

260
The medium to long term goal is to achieve a collaborative distance phenomenology,
relating different empirical observations of distance phenomena to one another. In reality, one
distance factor might also affect other distance factors, such as interpersonal relationships
impacting trust and vice-versa. Therefore, networking distance factors among themselves and
with observed phenomena would greatly increase the level of understanding and lead to a more
effective and consolidated body of knowledge in this area.
This proposed CDF could be used for further empirical studies that would select an
integrative approach, as offered with the four dimensions, instead of looking at certain factors in
isolation. It could also be used by practitioners and ICT managers as a Collaboration Capability
Assessment Framework to evaluate the collaboration capabilities or readiness of distributed
project teams, online collaborative environments, collaborative infrastructures and collaboration
tools. Developers could also use it to evaluate new collaboration artefacts and tools for
compressing or bridging one or several distance types, in terms of features to be developed.
The survey results on the structural dimension confirm previous conclusions on the
paramount importance of leadership and trust in both face-to-face and distributed collaboration.
As a first conclusion, it would make sense to investigate how CWE can better support leadership,
in terms of the shared purpose, vision, goals and objectives that are essential elements of
distributed project management. However, the level of trust depends on the ability and amount of
shared knowledge and strategic information (e.g. purpose, vision, goals and objectives) among
distributed team members. Hence, it would also be worthwhile to investigate the potential
connection between leadership and trust, in a CWE in which were embedded appropriate trust
models for supporting eCollaboration.
Future work could address virtual or online proximity, which allow a wide spectrum of
cultural and organisational diversity, together with the necessary supporting technologies and
where and when to apply them in order to quickly reach the most appropriate level of mutual

261
understanding while ensuring a high level of creativity and innovation. It is also intended that the
proposed CDF will raise awareness of emerging concepts and artefacts that will, sooner or later,
lead to the development of socially enabled technologies, allowing groups of users to create or
personalise their own eCollaboration environment according to their specific needs.
Concerning the legal and ethical dimension of the CDF, there is currently a clear lack of
ICT support, revealing numerous opportunities to create innovative tools. One example of this is
the tracking of idea ownership, which would make project stakeholders more confident in
sharing knowledge. As for the technical dimension, the two factors rated as the most significant
are shared knowledge and shared meanings. Both contribute to reaching a mutual understanding,
described by Roschelle & Teasley (1995) as the essence of collaboration. Meanwhile, Van den
Bossche et al. (2010) state that shared mental models mediate the relationship between team
learning behaviours and team effectiveness. In their recent empirical study they conclude that a
shared mental model of task environment among team members leads to improved performance.
This conclusion correlates with the comparison of collaboration performance among the 14
project cases obtained in this study, especially in terms of effectiveness. Now, it becomes
obvious that the use of collaborative modelling techniques, methods and tools enabled team
members to build shared mental models of their project tasks and process, which led to a mutual
understanding and hence to an increased collaboration performance. Further research on
experiencing different generic collaboration process and collaboration mechanics alternatives,
including indicators for measuring the impact of distance factors on collaboration performance,
would help to reach a deeper level of understanding on the embedded mechanics (instant
learning among team members and across project teams, construction of shared mental models,
shared cognition and cognitive mapping).
Some years ago, new technologies such as wiki and blogging opened the door to mass
participation and collaboration. Such technologies allow individuals freely to create content and

262
to share their views and concerns on the Web, and can potentially lead to some sort of collective
intelligence and participative democracy. Furthermore, wiki has enabled mass collaboration,
where thousands of individuals together create valuable content for the society at large (e.g.
Wikipedia). Last but not least, online social networking has unleashed the power of individuals’
social curiosity in such a way that millions of people spend time every day on people
networking. Today, the challenge is to create new ICT artefacts, enabling a wide diversity of
individuals to quickly build a minimum level of mutual understanding to support broader social
interactions and hence deeper knowledge creation, leading to successful innovation, which is the
desired outcome of any collaboration project.
263
References Adams, B.N. (1967) Interaction Theory and the Social Network. Sociometry, 30(1): 64-78.
Ahuja, G. (2000) Collaboration networks, structural holes and innovation: a longitudinal study. Administrative Science Quarterly, 45: 425-455.
Alexander, S. (2000) Virtual Teams Going Global. InfoWorld, 22(46): 55-56.
Allen, T.J. (1977) Managing the Flow of Technology. Cambridge, MA: MIT Press.
Al-Rawas, A. and Easterbrook, S.M. (1996) A Field Study into the Communications Problems in Requirements Engineering. Proceedings, Conference on Professional Awareness in Software Engineering (PACE-96), London, February 1996.
Ancona, D.G. and Caldwell, D.F. (1992) Bridging the boundary: External activity and performance in organizational teams. Administrative Science Quarterly, 37(4): 634-665.
Antoniac, P. and Pulli, P. (2000) The Trust Factor in the Virtual Enterprise. A Mobile Broadband Service Approach. In: Proceedings of the 6th International Conference on Concurrent Enterprising (ICE 2000) F. Weber and K. Pawar (eds), Toulouse, France, (University of Nottingham, Nottingham), pp. 287-294.
Antoniac, P., Pallot, M. and Pulli, P. (2006) Virtual and augmented reality supporting people consciousness within collaborative working environments. In: Proceedings of the 12th International Conference on Concurrent Enterprising ICE 2006, K.D. Thoben, K. S. Pawar, M. Taisch and S. Terzi (eds), 26-28 June 2006, Milan, Italy, University of Nottingham, Nottingham. (ISBN 0 85358 228 9). pp. 213-220.
Appelt, W., Pajo, S. and Prinz, W. (2007) Supporting trust building in distributed groups by appropriate security technology. In: Proceedings of the 2007 International ACM Conference on Supporting Group Work (Sanibel Island, Florida, USA, November 04 - 07, 2007). GROUP '07. ACM, New York, pp. 391-398.
Arias, E.G., Eden, H., Fischer, G., Gorman, A. and Scharff, E. (2000) Transcending the Individual Human Mind—Creating Shared Understanding through Collaborative Design. ACM Transactions on Computer Human-Interaction, 7(1): 84-113.
Armstrong, D. and Cole, P. (2002) Managing distances and differences in geographically distributed work groups. In: P. Hinds and S Kiesler (eds), Distributed Work. The MIT Press, Cambridge, MA, pp. 167-186.
Baird, F., Moore, C.J. and Jagodzinski, A.P. (2000) An ethnographic study of engineering design teams at Rolls-Royce Aerospace. Design Studies, 21(4): 333-355.
Baker, D.F. (2001) The Development of Collective Efficacy in Small Task Groups. Small Group Research, 32(4):451-474.
Bal, J. and Foster, P. (2000) Managing the Virtual Team and Controlling Effectiveness. International Journal of Production Research, 38: 40-54.
Barkema, H.G., Shenkar, O., Vermeulen, F. and Bell, J.H.J. (1997) Working abroad, working with others: How firms learn to operate international joint ventures. Academy of Management Journal 40: 426-442.
Basili, V.R. (1996) The Role of Experimentation in Software Engineering: Past, Current, and Future. In: Proceedings of the 18th International Conference on Software Engineering. Berlin, Germany, March 25-30, 1996), pp. 442-449.
264
Batagelj, V. and Mrvar, A. (2000) Some analyses of Erdős collaboration graph. Social Networks, 22 (2): 173-186.
Biggs, J. (1996) Western misperceptions of the Confucian-heritage learning culture. In: D.A. Walkins and J.B. Biggs (eds), The Chinese Learner: Cultural Psychological and Contextual Influences. Hong Kong: University of Hong Kong, Comparative Education Research Center, pp. 45-68.
Birnholtz, J.P. (2005) When do Researchers Collaborate? Towards a Model of Collaboration Propensity in Science and Engineering Research. PHD Thesis, The University of Michigan.
Bodker, K. and Pedersen, J. (1991) Workplace Cultures: Looking at Artifacts, Symbols and Practices, in J. Greenbaum and M. Kyng (eds.), Design at Work: Cooperative Design of Computer Systems, Lawrence Erlbaum Associates, Hillsdale, NJ, pp. 121-136.
Boix Miralles, R. (2001) Study of Company Networks. Master Thesis, School of Engineering, Jönköping University, Sweden/ Universitat Politècnica de Catalunya, Barcelona, Spain.
Boland, R.J. and Tenkasi, R.V. (1995) Perspective making and perspective taking in communities of knowing. Organization Science, 6: 350-372.
Bonifacio, M. and Molani, A. (2003) The Richness of Diversity in Knowledge Creation: An Interdisciplinary Overview. Proceedings of IKNOW' 03, Graz, Austria, pp. 379-388.
Borghoff, U.M. and Schlichter, J.H. (2000) Computer-Supported Cooperative Work. Springer.
Boschma. R.A. (2005) Proximity and innovation: a critical assessment, Regional Studies, 39(1): 61-74.
Bowers, J. (1993) Understanding Organization Performatively. In: L. Bannon and K. Schmidt (eds), Issues of Supporting Organizational Context in CSCW Systems, COMIC, Esprit Basic Research Project 6225, Computing Department, Lancaster University, Lancaster, UK, pp. 49-72.
Bowker, G.C. and Star, S. L. (2000) Sorting Things Out — Classification and Its Consequences. MIT Press, Cambridge, MA.
Bradner, E. and Mark, G. (2002) Why Distance Matters: Effects on Cooperation, Persuasion and Deception. In: Proceedings of Computer Supported Cooperative Work CSCW 2002, New Orleans, Louisiana, USA.
Bradshaw, M. (2001) Multiple proximities: Culture and geography in the transport logistics of newsprint manufactured in Australia. Environment and Planning A, 33 (10): 1717-1739.
Broom, M. (2002) From effective groups to powerful teams. Incentive, 176 (11): 65-7.
Brouthers, K.D. and Brouthers, L.E. (2001) Explaining the National Cultural Distance Paradox. Journal of International Business Studies 32 (1): 177-189.
Brown, J.S. and Duguid, P. (1991) Organizational Learning and Communities-of-Practice: Toward a Unified View of Working, Learning, and Innovation. Organization Science, 2(1): 40-57.
Brown, J.S. and Duguid, P. (2000) The Social Life of Information. Harvard Business School Press, Boston, MA.
Brown, J.S., Duguid, P. and Haviland, S. (1994) Toward Informed Participation: Six Scenarios in Search of Democracy in the Information Age. The Aspen Institute Quarterly, 6(4): 49-73.
Bryman, A. and Burgess, R. (1999) Introduction. In: Qualitative Research Methodology: A Review. London: Sage.
Bucciarelli, L.L. (1994) Designing Engineers. MIT Press, Cambridge MA.
Büchel, B. and Denison, D.R. (2003) Knowledge Density and Success of New Product Development Teams. IMD – International Institute for Management Development.
Byron, D. K. and Stoia, L. (2003) An Analysis of Proximity Markers in Collaborative Dialogs. The Ohio State University, Computer Science and Engineering.
265
Cairncross, F. (1997) The Death of Distance: How the Communications Revolution Will Change Our Lives. Harvard Business School Press: Cambridge, MA.
Cannon-Bowers, J.E., Salas, E. and Converse, S. (1993) Shared Mental Models in Expert Team Decision-Making. In: J. Castellan (ed.), Individual and Group Decision-Making: Current Issues. Mahwah, NJ: Lawrence Earlbaum and Associates, Inc.,1993, p. 221-246.
Carley, K.M. (1997) Extracting team mental models through textual analysis. Journal of Organizational Behavior, 18: 533–558..
Carroll, J.M., Rosson, M.B. and Zhou, J., (2005) Collective efficacy as a measure of community. In Proceedings of the SIGCHI Conference on Human Factors in Computing Systems, April 02-07, Portland, Oregon, USA.
Chakrabarti, S., Srivastava, S., Subramanyam, M. and Tiwari, M. (2000) Memex: A Browsing Assistant for Collaborative Archiving and Mining of Surf Trails. In: Proceedings of the 26th international Conference on Very Large Data Bases. Morgan Kaufmann Publishers, San Francisco, CA, pp. 603-606.
Chatzkel, J.L. (2003) Knowledge Capital. New York, NY: Oxford University Press.
Cherniss, C. (2001) Emotional intelligence and organizational effectiveness. In: C. Cherniss and D. Goleman (eds), The Emotionally Intelligent Workplace. San Francisco: Jossey-Bass.
Chesbrough, H.W. (2003) Open Innovation: The New Imperative for Creating and Profiting from Technology. Boston, Harvard Business School Press.
Child, J., Ng, S.H. and Wong, C. (2002) Psychic distance and internationalization: A critical examination. International Studies of Management and Organization, 32: 36–56.
Citera, M., McNeese, M.D., Brown, C.E., Selvaraj, J.A., Zaff, B.S. and Whitaker, R.D. (1995) Fitting Information Systems to Collaborating Design Teams. Journal of the American Society for Information Science, 46(7): 551-559.
Clark, H. (1996) Using Language. Cambridge: Cambridge University Press.
Clark, H.H. and Brennan, S.E. (1991) Grounding in Communication. In: L.B. Resnick, J.M. Levine and S.D. Teasley (eds), Perspectives on Socially Shared Cognition. American Psychological Association, pp. 127-149.
Clark, K.B. and Fujimoto, T. (1991) Product Development Performance: Strategy, Organization, and Management in the World Auto Industry. Boston: Harvard Business School Press.
Coenen, L., Moodysson. J. and Asheim. B.T. (2004) Nodes, networks and proximities: on the knowledge dynamics of the Medicon Valley biotech cluster. European Planning Studies, 12(7): 1003-1018.
Cohen, W.M. and Levinthal, D.A. (1990) Absorptive Capacity: A New Perspective on Learning and Innovation. Administrative Science Quarterly, 35 (1): 128-152.
Cohendet, P. (2005) On Knowing Communities. Proceedings of the Conference Advancing Knowledge and the Knowledge Economy, 10-11 January 2005, National Academies, Washington, DC.
Coleman, D. (ed.) (1997) Groupware: Collaborative Strategies for Corporate LANs and Intranets. Prentice Hall.
Constant, D., Kiesler, S., and Sproull, L. (1994) What's mine is ours, or is it? A study of attitudes about information sharing. Information Systems Research, 5(4): 400-421.
Constant, D., Sproull, L., & Kiesler, S. (1996) Kindness of strangers: The usefulness of electronic weak ties for technical advice. Organization Science, 7(2), 119-135.
Cooper, R.G. and Kleinschmidt, E.J (1995) Benchmarking the Firm’s Critical Success Factors In New Product Development. Journal of Product Innovation Management, 12(5), November 1995: 374-391.

266
Coutu, D.L. (1998) Trust in virtual teams. Harvard Business Review, May-June, 76(3): 20-22.
Coviello, N. and McAuley, A. (1999) Internationalisation and the small firm: a review of contemporary empirical research. Management International Review, 39 (3): 223–256.
Cramton, C.D. (2001) The Mutual Knowledge Problem and Its Consequences for Dispersed Collaboration. Organization Science, 12(3): 346-371.
Créplet, F., Dupouët, O. and Vaast, E. (2003) Communities, communication, teaching and technology. Humanist Discussion Group, Vol. 17, No. 191, 2003.
Croft, W.B. and Turtle, H.A. (1989) Retrieval Model Incorporating Hypertext Links. Proceedings of Hypertext '89. ACM Press.
Csikszentmihalyi, M. (1996) Creativity - Flow and the Psychology of Discovery and Invention. HarperCollins Publishers, New York, NY.
Cummings, J.N. and Kiesler, S.B. (2003) Coordination and Success in Multidisciplinary Scientific Collaborations. ICIS, pp. 296-303.
Cunningham, J.B. (1997) Case study principles for different types of cases. Quality and Quantity, 31: 401-423.
Daft, R.L. and Lengel, R.H. (1984) Information Richness: A New Approach to Managerial Behavior and Organizational Design. In: Research in Organizational Behavior, L.L. Cummings and B.M. Staw (eds), JAI Press, Homewood, IL, pp. 191-233.
Daft, R.L. and Lengel, R.H. (1986) Organizational information requirements, media richness and structural design. Management Science 32(5): 554-571.
Daft, R.L., Lengel, R.H. and Trevino, L.K. (1987) Message Equivocality, Media Selection, and Manager Performance: Implications for Information Systems. MIS Quarterly 11(3):355-366.
Damian, D. (2002) An empirical study of requirements engineering in distributed software projects: is distance negotiation more effective? Faculty of Information Technology, University of Technology, Sydney, Australia.
Dana, L.P., Etemad, H. and Wright, R.W. (2001) Toward a paradigm of symbiotic entrepreneurship. International Journal of Entrepreneurship and Small Business, 5 (2): 109–126.
Das, T.H. (1983) Qualitative research in organizational behaviour. The Journal of Management Studies, 20 (3): 301-314.
Davenport, T.H. (2005) Thinking for a Living: How to Get Better Performances and Results from Knowledge Workers. Boston: Harvard Business School Press.
Demetriadis, S.N., Papadopoulos, P. and Tsoukalas, I. (2005) Bridging the contextual distance: The e-CASE learning environment for supporting students' context awareness. Pan-Hellenic Conference on Informatics No10, Volos, GRECE, vol. 3746, pp. 523-533.
DeSanctis, G., Wright, M. and Jiang, L. (2001). Building a global learning community. Communications of the ACM, 44(12): 80-82.
Dey, A., Salber, D. and Abowd, G. (2001) A conceptual framework and a toolkit for supporting the rapid prototyping of context-aware applications. Human-Computer Interactions, 16(2-4): 97-166.
Dong, A. (2005) The latent semantic approach to studying design team communication. Design Studies, 26(5): 445-461.
Donnellan, B. and Fitzgerald, B. (2003) Developing Systems to Support Organisational Learning in Product Development Organisations. Electronic Journal of Knowledge Management, paper 4 issue 2, Academic Conferences International Limited.
Dorigo, M. and Stützle, T. (2004) Ant Colony Optimization. MIT Press, 2004. ISBN 0-262-04219-3.
267
Druskat, V.U. and Wolff, S.B. (2001) Group emotional competence and its influence on group effectiveness. In: C. Cherniss and D. Goleman (eds), The Emotionally Intelligent Workplace. San Francisco: Jossey-Bass, pp. 132-155.
Eccles, D.W. and Tenenbaum, G. (2004) Why an expert team is more than a team of experts: A social-cognitive conceptualization of team coordination and communication in sport. Journal of Sport and Exercise Psychology , 26: 542-560.
Efimova, L. (2004). Discovering the iceberg of knowledge work: A weblog case. In Proceedings of The Fifth European Conference on Organisational Knowledge, Learning and Capabilities (OKLC 2004), April 2-3, 2004.
Egea, K. (2006) Relationship building in virtual teams: An academic case study. In: Proceedings for Informing Science and Information Technology Education Joint Conference (InSite’02), pp.25-28.
Elliott, M. (2006) Stigmergic Collaboration: The Evolution of Group Work. M/C Journal, 9(2). Retrieved Jun. 2008 from http://journal.media-culture.org.au/0605/03-elliott.php
Ellis, C.A., Gibbs, S.J. and Rein, G.L. (1991) Groupware: Some Issues and Experiences. Communications of the ACM, 1991, 34(1): 38-58.
Erickson, T. (2008) ‘Social’ systems: designing digital systems that support social intelligence. AI Soc. 23 (2): 147-166.
Erickson T. and Kellogg W.A. (2000) Social Translucence: An Approach to Designing Systems that Mesh with Social Processes. Transactions on Computer-Human Interaction 7(1):59-83.
Erickson, T., Huang, W., Danis, C. and Kellogg, W.A. (2004) A Social Proxy for Distributed Tasks: Design and Evaluation of a Working Prototype. The Proceedings of CHI 2004, 559-566.
Erickson, T., Kellogg, W.A., Laff, M., Sussman, J., Wolf, T.V., Halverson, C.A. and Edwards, D.A. (2006) A Persistent Chat Space for Work Groups: The Design, Evaluation and Deployment of Loops. The Proceedings of DIS 2006, 331-340.
Espinosa, J. A., Cummings, J. N., Wilson, J. M. and Pearce, B. M. (2003) Team Boundary Issues Across Multiple Global Firms. Journal of Management Information Systems, 19(4): 157–190.
Espinosa, J. A., Kraut, R. E., Slaughter, S. A., Lerch, F. J, Herbsleb, J. D. and Mockus, A. (2002) Shared Mental Models, Familiarity, and Coordination: A Multi-Method Study of Distributed Software Teams. In Proceedings of the International Conference in Information Systems, Barcelona, Spain, December 2002.
Filippi, M. and Torre, A. (2003) Local organisations and institutions. How can geographical proximity be activated by collective projects? International Journal of Technology Management, 26(2-4): 386-400.
Finholt, T.A., Sproull, L. and Kiesler, S. (2001) Outsiders on the inside: Sharing know-how across space and time. In: P. Hinds and S. Kiesler, Distributed Work, Cambridge, MA: MIT Press.
Finke, R.A., Ward, T.B. and Smith, S.M. (1992) Creative Cognition: Theory, Research, and Applications. Cambridge, MA: Bradford-MIT Press.
Fischer, G. (2001) Communities of Interest: Learning through the Interaction of Multiple Knowledge Systems. In Proceedings of the 24th Annual Information Systems Research Seminar in Scandinavia (IRIS'24), Ulvik, Norway, pp. 1-14.
Fischer, G. (2004) Social Creativity: Turning Barriers into Opportunities for Collaborative Design. In: F. deCindio and D. Schuler (eds), Proceedings of the Participatory Design Conference (PDC’04), CPSR, P.O. Box 717, Palo Alto, CA 94302, University of Toronto, Canada, July, pp. 152-161.
Fischer, G. (2005a) From Reflective Practitioners to Reflective Communities. Proceedings of the HCI International Conference (HCII), Las Vegas, July 2005.
268
Fischer, G. (2005b) Social Creativity: Turning Barriers into Opportunities for Collaborative Design. Proceedings of the Eighth Conference on Participatory Design, ISBN 1581138512, pp. 152-161.
Fischer, G. (2005c) Distances and diversity: sources for social creativity. Proceedings of the 5th Conference on Creativity and Cognition, New York: ACM Press, pp.128-136.
Foroohar R. and Roll, A.S. (2005) Newsweek special issue - Issues 2006: The Knowledge Revolution.
Fuchs-Kittowski, F. and Köhler, A. (2005) Wiki Communities in the Context of Work Processes. In proceedings of WiKiSym’05, October 16-18, San Diego, CA, U.S.A.
Fuller, M., Hardin, A. and Davison, R. (2006) Efficacy in Technology-Mediated Distributed Teams, Journal of Management Information Systems, 23(3): 209-235.
Furst, S., Blackburn, R. and Rosen, B. (1999) Virtual Team Effectiveness: A Proposed Research Agenda. Information Systems Journal, 9: 249-270.
Fussell, S. R., Kiesler, S. , Setlock, L. D. , Scupelli, P. (2004) Effects of instant messaging on the management of multiple project trajectories. In Proceedings of the SIGCHI conference on Human factors in computing systems, p.191-198, April 24-29, 2004, Vienna, Austria .
Gartner and MIT (2001) The Agile Workplace: Supporting People and their Work. A Research Partnership between Gartner, MIT and 22 Industry Sponsors: Stamford, CT, December 2001.
Gasson, S. (2004) The Management of Distributed Organizational Knowledge. In Proceedings of the 37th Hawaii International Conference on System Sciences, Hawaii, USA.
Gaudes, A., Hamilton-Bogart, B., Marsh, S. and Robinson, H. (2007). A Framework for Constructing Effective Virtual Teams. The Journal of E-working 1(2): 83-97.
Gentner D. (1983) Structure-mapping: A theoretical framework for analogy. In Cognitive Science, 7 (2), pp. 155-170.
Gertler M.S. (1995) Being there - proximity, organization, and culture in the development and adoption of advanced manufacturing technologies. Economic Geography, 71(1): 1-26.
Ghemawat, P. (2001) Distance still matters: the hard reality of global expansion. Harvard Business Review, 79 (9): 137–147.
Gibson, C.B. (1999) Do they do what they believe they can? Group efficacy and group effectiveness across tasks and cultures. Academy of Management Journal, 42 (2): 138-152.
Gibson, C.B., Randel, A.E. and Earley, P.C. (2000) Understanding group efficacy: An empirical test of multiple assessment methods. Group & Organization Management, 25(1): 67-97.
Gill, J. and Butler, R.J. (2003) Managing instability in cross-cultural alliances. Long Range Planning, 36(6), December 2003: 543-563.
Glaser, B. and Strauss, A. (1967) The Discovery of Grounded Theory. Chicago: Aidine.
Glover, K. (2000) Proximal and distal deixis in negotiation talk. Journal of Pragmatics, 32: 915-926.
Goleman, D. (1998) Working with Emotional Intelligence. N.Y.: Bantam.
Goleman, D. (2006) Social Intelligence: The New Science of Social Relationships. Bantam Books. ISBN 978-0553803525.
González, M.G., Burke, M.J., Santuzzi, A.M. and Bradley, J.C. (2003) The impact of group process variables on the effectiveness of distance collaboration groups. Computers in Human Behavior, 19 (5): 629-648.
Goodall, K. and Roberts, J. (2003) Repairing Managerial Knowledge-Ability over Distance. Organization Studies 24 (7): 1153-1175.
Grabher, G. (2004) Learning in Projects, Remembering in Networks? Communality, Sociality and Connectivity in Project Ecologies. European Urban and Regional Studies, 11(2): 103-123.
269
Greunz, L. (2003) Geographically and technologically mediated knowledge spillovers between European regions. Annals of Regional Science, 37 (4): pp. 657-680.
Griffin, A. (1996) PDMA Research on New Product Development Practices: Updating Trends and Benchmarking Best Practices. The Journal of Product Innovation Management, 14(6): 429-458.
Griffin, R. and Kacmar, K. M. (1991) Laboratory research in management: Misconceptions and missed opportunities. Journal of Organizational Behavior, 12: 301–311.
Grinter, R.E., Herbsleb, J.D. and Perry, D.E. (1999) The Geography of Coordination: Dealing with Distance in R&D Work, Proceedings of the GROUP 99 Conference of the ACM, Phoenix, AZ, 306-315.
Gross, T. and Prinz, W. (2003) Awareness in context: a light-weight approach. In: Proceedings of the Eighth Conference on European Conference on Computer Supported Cooperative Work (Helsinki, Finland, September 14 - 18, 2003), K. Kuutti, E. H. Karsten, G. Fitzpatrick, P. Dourish and K. Schmidt (eds), ECSCW. Kluwer Academic Publishers, Norwell, MA, 295-314.
Gross, T., Wirsam, W. and Gräther, W. (2003) AwarenessMaps: visualizing awareness in shared workspaces. In Proceedings of CHI03 Extended Abstracts, pp.784-785.
Grossman, S. J. and Hart, O. D. (1986) The Costs and Benefits of Ownership: A Theory of Vertical and Lateral Integration. Journal of Political Economy, University of Chicago Press, 94(4): 691-719, August.
Gully, S.M., Incalcaterra, K.A., Joshi, A. and Beaubien, J.M. (2002) A meta-analysis of team-efficacy, potency, and performance: Interdependence and level of analysis as moderators of observed relationships. Journal of Applied Psychology, 87(5): 819-832.
Gundel, J., Hedberg, N. and Zacharski, R. (1993) Cognitive Status and the Form of Referring Expressions in Discourse. Language 69(2): 274-307.
Gupta, R. and Landry, J. (2000). Profiting from Open Source. Harvard Business Review. doi:10.1225/F00503.
Gutwin, C. and Greenberg, S. (1999) A Framework of Awareness for Small Groups in Shared-Workspace Groupware. Technical Report 99-1, Department of Computer Science, University of Saskatchewan, Canada.
Gutwin, C. and Greenberg, S. (2000) The Mechanics of Collaboration: Developing Low Cost Usability Evaluation Methods for Shared Workspaces. In: Proceedings of the 9th IEEE international Workshops on Enabling Technologies: Infrastructure for Collaborative Enterprises (June, 2000), WETICE. IEEE Computer Society, Washington, DC, pp. 98-103.
Gutwin, C., Greenberg, S. (2002) A Descriptive Framework of Workspace Awareness for Real-Time Groupware, Computer Supported Cooperative Work, 11(3): 411-446.
Hackman, J.R. and Morris, C.G. (1975) Group tasks, group interaction process, and group performance effectiveness: A review and proposed integration. In: L. Berkowitz (ed.), Advances in Experimental Social Psychology (Vol. 8). New York: Academic Press.
Hall, Edward T. (1966) The Hidden Dimension. Anchor Books. ISBN 0-385-08476-5.
Halliday, M. and Hasan, R. (1976) Cohesion in English. Longman.
Harary, F. (1979) Topics in Graph Theory. New York Academy of Sciences, 1979. ISBN:0897660285.
Hardin, A. M., Fuller, M. A. and Davison, R. M. (2007) I Know I Can, but Can We? Culture and Efficacy Beliefs in Global Virtual Teams. Small Group Research, 38 (1): 1-25.
Hardin, A.M., Fuller, M.A. and Valacich, J. (2006) Group Efficacy in Virtual Teams: New Questions in an Old Debate. Small Group Research, 37(1): 65-85.

270
Hart, O. and Moore, J. (1990) A Theory of Corporate Financial Structure Based on the Seniority of Claims. STICERD - Theoretical Economics Paper Series 217, Suntory and Toyota International Centres for Economics and Related Disciplines, LSE.
Hill, A., Song, S., Dong, A. and Agogino, A. M. (2001) Identifying Shared Understanding in Design Teams Using Document Analysis. Proceedings of the 13th International Conference on Design Theory and Methodology, DETC2001/DTM-21713, Pittsburgh, PA, USA.
Hofstadter D.R. and Mitchell M. (1995) The copycat project: A model of mental fluidity and analogy-making. In: D. Hofstadter and the Fluid Analogies Research Group, Fluid Concepts and Creative Analogies. Basic Books, Chapter 5, pp. 205-267.
Hofstede, G. (1980) Culture's Consequences: International Differences in Work-related Values. Sage, Beverly Hills, CA.
Hofstede, G. (1994) Cultural constraints in management theories. International Review of Strategic Management, Vol. 5, 27-49.
Hoinville, G. and Jowell, R. (1978) Survey Research Practice. Heinemann, London, UK.
Hollan, J., Hutchins, E. and Kirsch, D. (2001) Distributed Cognition: Toward a New Foundation for Human-Computer Interaction Research. In: J. M. Carroll (ed.), Human-Computer Interaction in the New Millennium. ACM Press, New York, pp. 75-94.
Hoschka, P. (1998) CSCW Research at GMD-FIT: From Basic Groupware to the Social Web. In Newsletter ACM SIGGROUP Bulletin Volume 19 Issue 2, Aug. 1, 1998
Howells, J.R.L. (2002) Tacit knowledge, innovation and economic geography. Urban Studies, 39(5-6): 871-884.
Hurley, R.F. and Hult, T.M. (1998) Innovation, market orientation, and organizational learning: an integration and empirical examination. Journal of Marketing, 62(3): 42-54.
Hutchins, E. (1990) The Technology of Team Navigation. In J. Galegher, R. Kraut and C. Egido (eds.): Intellectual Teamwork: Social and Technological Foundations of Cooperative Work. Hillsdale, NJ: Lawrence Erlbaum, pp. 191–220.
Hymes, C. M. and Olson, G. M. (1992) Unblocking Brainstorming through the Use of a Simple Group Editor. In: Proceedings of the ACM Conference on Computer Supported Cooperative Work (CSCW’92), pp. 99-106.
Hyypiä, M. and Kautonen, M. (2005) Dimensions of Proximity in Relationships between Knowledge Intensive Business Service Firms and Their Clients. In: Regional Studies Association International Conference on Regional Growth Agendas Aalborg, Denmark, May 28 – 31.
Introna, L. (2005) Strangers and hospitality: on the social and ethical conditions of virtual communities. In: Ethics of New Information Technologies. Proceedings of the 6th Computer Ethics: Philosophical Enquiries Conference. University of Twente, The Netherlands, pp. 229-240.
Jarvenpaa, S. L. and Leidner, D. E. (1999) Communication and Trust in Global Virtual Teams. Organization Science, 10(6): 791-815.
Johanson, J. and Wiedersheim-Paul, F. (1975) The Internationalisation of the Firm-Four Swedish Cases. Journal of Management Studies, 12(3): 305-322.
Jones, P., Pawar, K.S., Riedel, J. and Pallot, M. (1999) Electronic Commerce for Programme management Information sharing in the Concurrent Enterprise (EPICE): Opening up the black box. Proceedings of the 5th International Conference on Concurrent Enterprising, ICE’99 The Concurrent Enterprise in Operation. The Hague, the Netherlands.
Jung, D.I. and Sosik, J.J. (2003) Group potency and collective efficacy: Examining their predictive validity, level of analysis, and effects of performance feedback on future group performance. Group & Organization Management, 28(3): 366-391.
271
Kapor, M. (2005) Content Creation by Massively Distributed Collaboration. Distinguished lecture at UC Berkeley. Retrieved from: http://www.sims.berkeley.edu/about/events/dls11092005
Katz-Navon, T.Y. and Erez, M. (2005) When Collective- and Self-Efficacy Affect Team Performance: The Role of Task Interdependence. Small Group Research, 36(4): 437-465.
Kayworth, T. R. and Leidner, D. E. (2002) Leadership Effectiveness in Global Virtual Teams. Journal of Management Information Systems, 18, 7-41.
Ketchen, D.J. Jr., Combs, J.G., Russell, C.J. and Shook, C. (1997) Organizational configurations and performance: A meta-analysis. Academy of Management Journal, 40(1): 223-240.
Kiesler, S. and Cummings, J.N. (2002) What Do We Know about Proximity and Distance in Work Groups? A Legacy of Research. In: P. Hinds and S. Kiesler (eds), Distributed Work. Cambridge: MA: MIT Press.
Kilker, J. (1999) Conflict on Collaborative Design Teams. IEEE Technology and Society Magazine, Fall, 12-21.
Kirat, T. and Lung, Y. (1999) Innovation and proximity - Territories as loci of collective learning processes. European Urban and Regional Studies, 6 (1): 27-38
Kleinsmann, M. (2006) Understanding Collaborative Design. Delft University of Technology, Delft.
Kleinsmann, M. and Dong, A. (2007) Investigating the Affective Force on Creating Shared Understanding. ASME 2007 Int'l Design Engineering Technical Conferences and Computers and Information in Engineering Conference, IDETC/CIE 2007, Las Vegas, Nevada, USA.
Kleinsmann, M. and Valkenburg, R. (2005). Learning from collaborative new product development projects. Journal of Workplace Learning, 17(3), 146-156.
Kleinsmann, M., Valkenburg, R. and Buijs, J. (2007) Why do actors in collaborative design understand each other? An empirical study towards a better understanding of collaborative design. CoDesign, 5(1): 1-15.
Knoben J. and Oerlemans L.A.G. (2006) Proximity and Inter-Organizational Collaboration: A Literature Review. International Journal of Management Reviews, 8(2):71-89.
Kock, N. (2005). Media Richness or Media Naturalness? The Evolution of our Biological Communication Apparatus and its Influence on our Behavior Toward E-Communication Tools. IEEE Transactions on Professional Communication, 48(2): 117-130.
Kock, N. and D'Arcy, J. (2002) Resolving the e-collaboration paradox: The competing influences of media naturalness and compensatory adaptation. Information Management and Consulting, 17(4): 72-78.
Koch, M. and Gross, T. (2006) Computer-Supported Cooperative Work – Concepts and Trends. Proceedings of the Conference of the Association Information and Management (AIM).
Kock, N. and Nosek, J. (2005) Expanding the Boundaries of E-Collaboration. IEEE Transactions on Professional Communication, 48(1), March 2005.
Koen, P., Ajamian, G., Burkart, R., Clamen, A., Davidson, J., D'Amore, R., Elkins, C., Herald, K., Incorvia, M., Johnson, A., Karol, R., Seibert, R., Slavejkov, A. and Wagner, K. (2001) Providing Clarity and a Common Language to the Fuzzy Front End. Research-Technology Management. Industrial Research Institute, Inc., 44(2): 46-55.
Kraut R., Fussell, S., Brennan, S. and Siegel, J. (2002) Understanding Effects of Proximity on Collaboration: Implications for Technologies to Support Remote Collaborative Work. In: P. Hinds and S. Kiesler (eds), Distributed Work. Cambridge: MA: MIT Press, pp. 137-162.
Kriplean, T., Beschastnikh, I., McDonald, D.W. and Golder, S.A. (2007) Community, consensus, coercion, control: cs*w or how policy mediates mass participation. In: Proceedings of the 2007

272
International ACM Conference on Supporting Group Work. GROUP '07. ACM, New York, NY, pp. 167-176.
Kristensen K. (2003) Physual Designing – A Supportive Framework for Dispersed Engineering Design. Doctoral dissertation, Department of Machine Design and Materials Technology, NTNU, Trondheim, Norway, 2003.
Kristensen K., Røyrvik J. (2005) Applications of the Physual Designing Network in Extended Teams. Proceedings of the 11th International Conference on Concurrent Enterprising, Munich, Germany, 2005.
Kristensen, K., Hildre, H.P., Sivertsen, O.I.. and Røyrvik, J. (2004) Physual Designing Network - Addressing Inter-layer Collaboration in Dispersed Teams. Proceedings of the 10th International Conference on Concurrent Enterprising. Seville, Spain, pp. 19-26.
Langdridge, D. (2004) Introduction to Research Methods and Data Analysis in Psychology. Pearson/Prentice Hall.
Latané, B., Liu, J. H., Nowak, A., Bonevento, M. and Zheng, L. (1995) Distance Matters: Physical Space and Social Impact. Personality and Social Psychology Bulletin, 21(8): 795-805.
Lave, J. and Wenger, E. (1991) Situated Learning: Legitimate Peripheral Participation. Cambridge University Press, New York.
Levesque, L.L., Wilson, J.M. and Wholey, D.R. (2001) Cognitive Divergence and Shared Mental Models in Software Development Project Teams. Journal of Organizational Behavior, (22), March 2001, 135-144.
Levina, N. and Vaast, E. (2005) Turning Collaboration into Transaction: A Case of Intranet Use in Boundary-Spanning Practices. Proceedings of the 38th Hawaii International Conference on System Sciences – 2005.
Lindkvist, L. (2005) Knowledge communities and knowledge collectivities: A typology of knowledge work in groups. Journal of Management Studies, 42: 1189-1210.
Lipnack, J. and Stamps, J. (1997) Virtual Teams. Reaching Across Space, Time and Organizations with Technology. Canada: John Wiley & Sons.
Liu, H. and Singh, P. (2004) ConceptNet - a practical commonsense reasoning tool-kit. BT Technology Journal, 22(4): 211-226.
Lloyd, P. (2000) Storytelling and the development of discourse in the engineering design process. Design Studies, 21: 357-373.
Lu, M., House, C.H., Watson-Manheim, M.B. and Matzkevich, T. (2005) Does Distance Matter? - Bridging the Discontinuities in Distributed Organizations. In: Proceedings of the 38th Annual Hawaii International Conference on System Sciences (Hicss'05) - Track 1 - Volume 01 HICSS. IEEE Computer Society, Washington, DC.
Luft, J. and Ingham, H. (1955) The Johari window, a graphic model of interpersonal awareness. Proceedings of the Western Training Laboratory in Group Development. Los Angeles: UCLA.
Malhotra, A., Majchrzak, A., Carman, R. and Lott, V. (2001) Radical innovation without collocation: A case study at Boeing-Rocketdyne. MIS Quarterly, 25: 229.
Malone, T.W., Yates, J. and Benjamin, R.I. (1987) Electronic Markets and Electronic Hierarchies. Communications of the ACM, 30: 484-497.
Marks, M.A., Mathieu, J.E. and Zaccaro, S.J. (2001) A temporally based framework and taxonomy of team processes. Academy of Management Review, 26: 356–376.
Mårtensson, P. (2001) Management Processes: An Information Perspective on Managerial Work. Stockholm, Sweden: The Economics Research Institute.
273
Martins, L.L., Gilson, L.L. and Maynard, M.T. (2004) Virtual teams: What do we know and where do we go from here? Journal of Management, 30(6): 805-835.
Mathieu, J., Goodwin, G.F., Heffner, T.S., Salas, E. and Cannon-Bowers, J.A. (2000)The Influence of Shared Mental Models on Team Process and Performance. Journal of Applied Psychology, 85(2):273-283.
Maxim, P. (1999) Quantitative Research Methods in the Social Sciences. Oxford University Press.
Mayben R., Nichols S. and Wright V.H. (2003) Distance Technologies in Collaborative Research: Analyzing the Successes and Barriers. The Journal of Interactive Online Learning, 2(2).
Mayer, J.D., Salovey, P. and Caruso, D. R. (2000) Models of emotional intelligence. In: R.J. Sternberg (ed.), Handbook of Human Intelligence (2nd ed., 396-420). N.Y.: Cambridge University Press.
Maznevski, M.L. and Chudoba, K.M. (2000) Bridging space over time: Global virtual team dynamics and effectiveness. Organization Science, 11(5): 473-492.
McDonough, III, E.F., Kahn, K.B. and Barczak, G. (2000) An investigation of the use of global, virtual, and collocated new product development teams. The Journal of Product Innovation Management, 18(2): 110-120.
McGrath, J.E. (1964) Social Psychology: A Brief Introduction. New York: Holt.
Meisters, C. and Werker, C. (2004) Physical and organizational proximity in territorial innovation systems: introduction to the special issue. Journal of Economic Geography 4(1): 1-2.
Meyer, A.D., Tsui, A.S. and Hinings, C.R. (1993) Configurational approaches to organizational analysis. Academy of Management Journal, 36(6): 1175-1195.
Miller, D. (1987) The Genesis of Configuration. Academy of Management Review, 12(4): 686-701.
Moon, Y. (1999) The Effects of Physical Distance and Response Latency on Persuasion in Computer-Mediated Communication and Human-Computer Communication. Journal of Experimental Psychology: Applied, 5(4): 379-392.
Moon, Y. and Sproull, L. (2002) Essence of distributed work: The case of the Linux kernel. In: P.J. Hinds and S. Kiesler (eds.), Distributed Work, MIT Press, Cambridge, MA, pp. 381-404.
Moran, T.P. and Carroll, J.M. (eds.) (1996) Design Rationale: Concepts, Techniques, and Use, Lawrence Erlbaum Associates, Inc., Hillsdale, NJ.
Morello, D. and Burton, B. (2006) Future Worker 2015: Extreme Individualization. Gartner Research Report, Gartner Research.
Morosini P., Shane, S. and Singh, H. (1998) National cultural distance and cross-border acquisition performance. Journal of International Business Studies, 29(1): 137-158.
Morris, M. (2005) How do users feel about technology? Forrester Research, April 2005. Massachusetts: Forrester Research, Inc,
Mulder, I. (2002) A didactic model for learning and working together in global virtual teams. In: Purdue, D. and Stewart, M. (eds), Understanding Collaboration. Bristol, England: University of the West of England, Faculty of the Built Environment, pp. 159-162.
Murray, B. (1999) Schools unready for technology boom. APA Monitor on Psychology, 30(9): 22.
Nachum L. and Zaheer S. (2005) The persistence of distance? The impact of technology on MNE motivations for foreign investments. Strategic Management Journal, 26: 747-767.
Nardi, B. and Whittaker, S. (2002) The Role of Face-to-Face Communication in Distributed Work. In: P. Hinds and S. Kiesler (eds), Distributed Work: New Research on Working across Distance Using Technology, MIT Press, Cambridge, MA, pp. 83-112.
Neck, C.P. and Manz, C.C. (1994) From groupthink to teamthink: Toward the creation of constructive thought patterns in self-managing work teams, Human Relations, 47(8): 929-952

274
Neumann, A., Badke-Schaub, P. and Lauche, K. (2006) Measuring the development of shared mental models in product design teams. In: 16th World Congress of Ergonomics, Maastricht. Netherlands, July 10-14
Noble, D. and Letsky, M. (2003) Cognitive-based Metrics to Evaluate Collaboration Effectiveness. Retrieved from: http://www.au.af.mil/au/awc/awcgate/navy/onr_metrics_on_collab.pdf
Nonaka, I. (1994) A Dynamic Theory of Organizational Knowledge Creation. Organization Science, 5(1): 14-38.
Nonaka, I. and Konno, N. (1998) The Concept of ‘Ba’: Building a Foundation for Knowledge Creation. California Management Review, 40: 40-54.
Nonaka, I. and Takeuchi, H. (1995) The Knowledge-Creating Company: How the Japanese Companies Create the Dynamic of Innovation. Oxford University Press.
Nooteboom, B. (1992) Towards a dynamic theory of transactions. Journal of Evolutionary Economics, 2: 281-99.
Nooteboom, B. (1999) Inter-Firm Alliances: Analysis and Design. London: Routledge
Nooteboom, B. (2000) Learning by interaction: Absorptive capacity, cognitive distance and governance. Journal of Management and Governance, 4: 69-92.
Nordstrom, K.A. and Vahlne, J.E. (1992) Is the globe shrinking? Psychic distance and the establishment of Swedish sales subsidiaries during the last 100 years. Paper presented at the International Trade and Finance Association’s Annual Conference, April 22-25, Laredo, Texas.
Norman, D. (1993) Things That Make Us Smart. Reading, MA: Addison-Wesley.
Norman, D.A. and Hutchins, E.L. (1988) Computation via Direct Manipulation. Technical Report N00014-85-C-0133, Institute for Cognitive Science, University of California, San Diego, La Jolla, California, 1 August 1988.
North, D. C. (1997) The American Economic Review, Vol. 87(2), Papers and Proceedings of the Hundred and Fourth Annual Meeting of the American Economic Association (May, 1997), pp. 412-414
Nova, N. (2003) Socio-cognitive functions of space in collaborative settings: a literature review about Space, Cognition and Collaboration. Retrieved from: http://tecfa.unige.ch/perso/staf/nova/CRAFT_report1.pdf .
Novak, J. and Wurst, M. (2005) Collaborative Knowledge Visualization for Cross-Community Learning. In: Tergan, Sigmar-Olaf and Keller, Tanja (eds), Knowledge and Information Visualization, Springer LNCS, 2005, pp.95-116.
Odda, T. (1979) On properties of a well-known graph or what is your Ramsey number? Topics in graph theory. Annals of the New York Academy of Sciences, 328: 166–172.
O'Donnell, F.J. and Duffy, A.H. (2001a) Design Activity Modeling: A Performance Viewpoint. International Conference on Engineering Design. Glasgow.
O'Donnell, F.J. and Duffy, A.H. (2001b) Performance Management at Design Activity Level. In Proceedings of the International Conference on Engineering Design. Glasgow.
Oerlemans, L.A.G., Meeus, M.T.H. and Boekema. F.W.M. (2000) On the spatial embeddedness of innovation networks: an exploration of the proximity effect. Paper presented at the 40th European Congress of the European Regional Science Association, Barcelona, 2000. Regional Studies, 39(1): 89-104.
O’Kelly, P. and Gotta, M. (2006) Microsoft Versus IBM Lotus: Comparative Analysis. In Proceedings of the Collaborative technologies conference, Burton Group.
O’Leary, M.B. and Cummings, J.N. (2002) The spatial, temporal and configurational characteristics of geographic dispersion in work teams. Working paper #148, MIT E-Business Center, Cambridge, MA.
275
Oldham, G. R., Cummings, A. and Zhou, J. (1995) The Spatial Configuration of Organizations: A Review of the Literature and Some New Research Directions. Research in Personnel and Human Resource Management, 13: 1-37.
Olson, G. M. and Olson, J. S. (2001) Distance Matters. In: J. M. Carroll (ed.), Human-Computer Interaction in the New Millennium, ACM Press, New York, pp. 397-417.
Orlikowski, W.J. (2002) Knowing in practice: Enacting a collective capability in distributed organizing. Organization Science, 13(3): 249–273.
Ortiz de Guinea, A., Webster, J. and Staples, S. (2005) A meta-analysis of the virtual teams literature. Presented October 12, 2005 at the Symposium on High Performance Professional Teams, Queen’s University, Kingston, ON, Canada.
Pallot, M. (2007) Why Webergence and Webergic Collaboration? A blog entry of the Webergence blog. Retrieved from: http://www.cwe-projects.eu/pub/bscw.cgi/737753?id=715404_737753
Pallot, M. and Bergmann, U. (2010) Collaborative Virtual Environments and Immersion in Distributed Engineering Contexts. In: H. Kühnle (ed.), Distributed Manufacturing: Paradigm, Concepts, Solutions and Examples. Springer. ISBN: 978-1-84882-706-6.
Pallot, M., Bergmann, U., Kühnle, H., Pawar, K. S., Riedel, J. CKH (2010), Collaborative Working Environments: Distance Factors Affecting Collaboration. In: Proceedings of the 16th International Conference on Concurrent Enterprising, ICE'2010 "Collaborative Environments for Sustainable Innovation", Lugano, Switzerland, 21-23 June 2010, Centre for Concurrent Enterprise, University of Nottingham, Nottingham. ISBN 9780853582 700. www.ice-proceedings.org.
Pallot M. and Hof, K. (1999) FREE - Fast Reactive Extended Enterprise, The Results. In: K-D Thoben, PM Wognum, KS Pawar, (Eds) Proceedings of the 5th International Conference on Concurrent Enterprising, ICE’99 The Concurrent Enterprise in Operation. 14-17 March 1999, The Hague, The Netherlands. University of Nottingham, Nottingham.
Pallot, M. and Sandoval, V. (1998) Concurrent Enterprising: Toward the Concurrent Enterprise in the era of the Internet and Electronic Commerce. Kluwer Academic Publishers, USA. ISBN: 0-7923-8172-6.
Pallot, M., Maigret, J.P., Boswell, J. and de Jong, E. (2000) EPICE: Realising the Virtual Project Office. Proceedings of the e-Business for Industry Conference, Flagship Conference of UK Council for Electronic Business. Kensington, London, United Kingdom.
Pallot, M., Pawar, K., Salminen, V. and Pillai, B. (2004) Business Semantics: The Magic Instrument Enabling Plug and Play Collaboration? In: Thoben, K-D; Pawar, K.S. & Weber, F. (Eds) Proceedings of the 10th International Conference on Concurrent Enterprising - "Adaptive Engineering for Sustainable Value Creation", 16-18 June 2003, Sevilla, Spain. www.ice-conference.org, University of Nottingham, Nottingham. (ISBN: 0 85358 128 2).
Pallot M., Prinz, W. and Schaffers, H. (2005) Future Workplaces, Towards the Collaborative Web. Proceedings of the AMI@Work Communities Forum Day, Munich, June 2005.
Pallot, M., Prinz, W. and Pawar, K.S. (2006) Stimulating Creativity and Innovation through People - Concepts Connectivity within On-line Collaborative Workspaces. IRMA 2006 Conference Proceedings. Washington May 2006.
Pallot, M., Ruland, R., Traykov, S. and Kristensen K. (2006) Integrating Shared Workspace, Wiki and Blog. In: Thoben, K-D; Pawar, KS; Taisch, M; & Terzi, S. Proceedings of the 12th International Conference on Concurrent Enterprising: Innovative products and services through collaborative networks, 26-28 June 2006, Milan, Italy, University of Nottingham, Nottingham. (ISBN 0 85358 228 9).
Pallot, M., Richir, S. and Samier, H. (2008) Shared Workspace and Group Blogging Experimentation through a Living Lab Approach. In: Thoben, K-D; Pawar, KS & Goncalves, R. (2008) Proceedings of the 14th International Conference on Concurrent Enterprising, ICE'2008 "A new wave of
276
innovation in Collaborative Networks", Lisbon, Portugal, 23-25 June 2008, Centre for Concurrent Enterprise, University of Nottingham, ISBN 978 0 85358 244 1.
Pankoke-Babatz, U., Prinz, W. and Schäfer, L. (2004) Stories about Asynchronous Awareness. In: F. Darses, R. Dieng, C. Simone and M. Zacklad, IOS Press (eds.) et al. (eds.) Cooperative Systems Design - Scenario-Based Design of Collaborative Systems. IOS Press, pp. 23-38.
Parker, L.E. (1994) Working together: Perceived self- and collective-efficacy at the workplace. Journal of Applied Social Psychology, 24(1): 43-59.
Patton, M.Q. (1990) Qualitative Evaluation and Research Methods. (2nd ed.). London: Sage.
Pauleen, D. and Yoong, P. (2001) Facilitating virtual team relationships via Internet and conventional communication channels. Internet Research: Electronic Networking Applications and Policies, 11(3): 190-202.
Pawar, K. and Sharifi, S. (1997) Physical or Virtual Team Collocation: Does It Matter? International Journal of Production Economics, 52(3), December: 283-290.
Pawar, K. and Sharifi, S. (2000) Physical or Virtual Team Co-location: Speed versus Co-ordination. International Journal of Agile Management Systems, 2(2): 104-113.
Pawar, K., Haque, B. and Barson, R.J. (1999) Establishing Concordance within Concurrent Engineering Teams. Concurrent Engineering Research and Applications, 7 (3): pp. 215-229.
Pawar, K., Menon, U. and Riedel, J. (1994) Time to Market. Integrated Manufacturing Systems, 5 (1): 14-23.
Perttula, M.K. and Sääskilahti, M.T. (2004) Product Concept Development as a Conscious Resource. NordDesign 2004 – Product Design in Changing Environment, 18-20 August 2004, Tampere, Finland.
Pescosolido, A.T. (2001) Informal leaders and the development of group efficacy. Small Group Research, 32(1): 74-93.
Phillips, D.C. (1987) Philosophy, Science, and Social Inquiry. Oxford: Pergamon Press.
Piccoli, G., Powell, A. and Ives, B. (2004) Virtual teams: team control structure, work processes, and team effectiveness. Information Technology and People, 17(4): 359–379.
Piwek, P.L.A., Bean, R.J. and Cremers, A.H.M. (1995) Deictic use of Dutch Demonstratives. In: IPO Annual Progress Report 30, Eindhoven University of Technology.
Powell, A., Piccoli, G. and Ives, B. (2004) Virtual teams: a review of current literature and directions for future research. SIGMIS Database, 35(1): 6-36.
Prante, T., Magerkurth, C. and Streitz, N. (2002) Developing CSCW tools for Idea Finding - Empirical Results and Implications for Design. In: Proceedings of the ACM Conference on Computer Supported Cooperative Work (CSCW 2002), New Orleans, Louisiana, USA, ACM Press, November 16–20, pp. 106-115.
Prasad B. (1998) Decentralized co-operation: a distributed approach to team design in a concurrent engineering organization. Team Performance Management: An International Journal, 4(4): 138-167.
Prinz, W. (1999) NESSIE: An Awareness Environment for Cooperative Settings. In: S. Bødker, M. Kyng, and K. Schmidt (eds), ECSCW'99: Sixth Conference on Computer Supported Cooperative Work. Copenhagen: Kluwer Academic Publishers, pp. 391-410.
Prinz, W., Pankoke-Babatz, U., Gräther, W., Gross, T., Kolvenbach, S. and Schäfer, L. (2004) Presenting activity information in an inhabited information space. In: E. Churchill, D. Snowdon, and F. Frecon (eds), Inhabited Information Spaces: Living with your Data. Springer Verlag, UK, pp. 181-208.
Prinz, W., Loh, H., Pallot, M., Schaffers, H., Skarmeta, A. and Decker, S. (2006) ECOSPACE Towards an Integrated Collaboration Space for eProfessionals. In Proceedings of CollaborateCom 2006 “Collaborative Computing: Networking, Applications and Worksharing”. 17-20 Nov. 2006, pp. 1 - 7

277
Prussia, G.E. and Kinicki, A.J. (1996) A Motivational Investigation of Group Effectiveness Using Social-Cognitive Theory. Journal of Applied Psychology, 81(2): 187-198.
Pulli, P., Pyssysalo, T., Metsävainio, J.P. and Komulainen, O. (1998) CyPhone – Experimenting Mobile Real-Time Telepresence. Proceedings of the 10th Euromicro Workshop on Real-Time Systems, Berlin, Germany, pp. 10-17.
Putnam, R. D. (2000) Bowling Alone. The Collapse and Revival of American Community. New York: Simon and Schuster. http://www.infed.org/biblio/social_capital.htm
Puybaraud M. (2004) The Flexible Working Survey. Johnson Controls, University of the West of England and Facilities Innovation Programme, Bristol, UK.
Puybaraud, M. (2005) Work Loneliness: The Impact of Flexible Working. MOSAIC Newsletter, issue 3, January 2005.
Rafii F. (1995) How important is physical co-location to product development success? Business Horizons, Jan-Feb, 78-84.
Raymond, E.S. and Young, B. (2001) The Cathedral and the Bazaar: Musings on Linux and Open Source by an Accidental Revolutionary. O'Reilly & Associates, Sebastopol, CA.
Reagans, R. and McEvily, B. (2003) Network Structure and Knowledge Transfer: The Transfer Problem Revisited. Working paper, Columbia University, New York.
Reed, D. (1999) That Sneaky Exponential - Beyond Metcalfe's Law to the Power of Community Building. Context, Spring 1999, retrieved from http://www.reed.com/gfn/docs/reedslaw.html
Resnick, L.B., Levine, J. and Teasley, S.D. (1991) Perspectives on Socially Shared Cognition. American Psychological Association, Washington, DC.
Rice, R.E. and Aydin, C. (1991) Attitudes toward new organizational technology: network proximity as a mechanism for social information-processing. Administrative Science Quarterly, 16(2): 219-244.
Richardson, M. and Domingos, P. (2003) Building large knowledge bases by mass collaboration. In: Proceedings of the 2nd International Conference on Knowledge Capture (Sanibel Island, FL, USA, October 23 - 25, 2003), K-CAP '03. ACM, New York, NY, pp. 129-137.
Ristau Baca, M. (2006) Barriers To Innovation: Intellectual Property Transaction Costs In Scientific Collaboration, Harvard Law School.
Robinson, M. and Bannon, L. (1991) Questioning Representations. In: L. Bannon, M. Robinson and K. Schmidt (eds), Proceedings of ECSCW'91: 2nd European Conference on Computer-Supported Collaborative Work. Kluwer, Amsterdam Sept 25-27, pp. 219-233.
Roschelle, J. (1992) Learning by collaborating: Convergent conceptual change. Journal of the Learning Sciences, 2(3): 235-276.
Roschelle, J. and Teasley, S.D. (1995) The construction of shared knowledge in collaborative problem solving. In: C.E. O’Malley (ed.), Computer Supported Collaborative Learning. Berlin: Springer-Verlag, pp. 69-97.
Ross, D.T. (1985) Applications and Extensions of SADT. IEEE Computer, 18(4): 25-34.
Ross, D.T. (1989) The NATO Conferences form the Perspective of an Active Software Engineer. ICSE 1989: 101-102.
Ross, D.T. and Schoman Jr., K.E. (1976) Structured Analysis for Requirements Definition. ICSE 1976: 1.
Sackmann, S. (1992) Cultural Knowledge in Organizations. Sage, Newbury Park.
Sakiroglu, M, Riedel, J.C.K.H. and Pawar, K. (2002) Computer Based Human Readiness Assessment Tool for Virtual Organizations. In: B. Stanford-Smith, E. Chiozza and M. Edin (eds) Challenges and Achievements in eBusiness and eWork, Conference Proceedings, 16-18th October 2002, Prague, Czech Republic, www.ebew.net, IOS Press, Amsterdam, pp. 940-947.
278
Saunders, C.S. (2000) Virtual Teams: Piecing Together the Puzzle. In: R.W. Zmud (ed.) Framing the Domain of IT Management: Projecting the Future through the Past. Cincinnati, OH: Pinnaflex.
Sawhney, N (2002) The Sociological Nature of Intellectual Property Rights Emerging from Open Collaborative Design in University Settings. Preliminary Analysis of Student Projects in MIT Design Studios. retrieved from http://web.media.mit.edu/~nitin/thesis/nitin-ipr-study.pdf
Schäfer, L., Valle, C. and Prinz, W. (2004) Group storytelling for team awareness and entertainment. In: Proceedings of the Third Nordic Conference on Human-Computer Interaction (Tampere, Finland, October 23 - 27, 2004). NordiCHI '04, vol. 82. ACM, New York, NY, pp. 441-444.
Schaffers, H., Brodt, T., Pallot, M. and Prinz, W. (eds) (2006) The Future Workspace: Perspectives on Mobile and Collaborative Working. Telematica Instituut, The Netherlands, ISBN 10: 90-75176-00-7, ISBN 13: 978-90-75176-00-1.
Schamp, E.W., Rentmeister, B. and Lo. V. (2004) Dimensions of proximity in knowledge-based networks: the cases of investment banking and auto-mobile design. European Planning Studies, 12(5): 607-624.
Scharff, E. (2002) Open Source Software, a Conceptual Framework for Collaborative Artefact and Knowledge Construction. Ph.D. Dissertation, University of Colorado at Boulder.
Schein, E.H. (1985) Organizational Culture and Leadership. Jossey-Bass, San Francisco.
Schmidt, K. (1994) Social Mechanisms of Interaction. The COMIC project, Esprit Basic Research Action 6225, ISBN 0 901800 55 4, Lancaster University.
Schön, D. A. (1983) The Reflective Practitioner: How Professionals Think in Action. Basic Books, New York.
Schrage, M. (1990) Shared Minds: The New Technologies of Collaboration. NY: Random House.
Schunn, C., Crowley, K. and Okada, T. (2002) What makes collaborations across a distance succeed? The case of the cognitive science community. In: P. Hinds and S. Kiesler (eds), Distributed Work, pp. 407-430.
Segal, L. (1995) Designing Team Workstations: The Choreography of Teamwork. In P. Hancock, J. Flach, J. Caird and K. Vicente (eds.): Local Applications of the Ecological Approach to Human- Machine Systems. Hillsdale, NJ: Lawrence Erlbaum, pp. 392–415.
Shane, S. (1994) Championing change in the global corporation. Research-Technology Management, 29–35.
Sharifi, S. and Pawar, K. S. (2001) Product Development Strategies for Agility. In: Gunasekaran, A. (ed.), Agile Manufacturing: The 21st Century Competitive Strategy, Elsevier, 2001.
Sharifi, S. and Pawar, K.S. (2002) Virtually Co-located Product Design Teams: Sharing teaming experiences after the event? International Journal of Operations and Production Management, 22(6): 656 - 679.
Shenkar O. (2001) Cultural distance revisited: Towards a more rigorous conceptualization and measurement of cultural differences. Journal of International Business Studies, 32 (2): 519-35.
Shipman, F. (1993) Supporting Knowledge-Base Evolution with Incremental Formalization. Ph.D. Dissertation, University of Colorado at Boulder.
Siebdrat, F., Hoegl, M. and Ernst, H. (2009) How to Manage Virtual Teams. MIT SLOAN Management Review, 50(4): 63-68.
Silverman, D. (1997) The Logics of Qualitative Research. London: Sage.
Silverston, R. (2004) Proper distance: Toward an ethics for cyberspace. In: G. Liestøl, A. Morrison and T. Rasmussen (eds), Digital Media Revisited, MIT Press, Cambridge, Mass, pp. 469-490.
279
Slagter, R., Vicente D., Buitrago, G., Klöckner, K., Prinz, W., Schaffers, H., Villa, M. and Wang, Y. (2006) State of the Art of Collaboration Infrastructure. ECOSPACE Report D1.2.
Smircich, L. (1983) Organization as shared meaning. In: L.R. Pondy, P.J. Frost, G. Morgan and T.C. Dandridge (eds.), Organizational Symbolism. JAI Press, Greenwich Conn., pp. 55-65.
Smith-Jentsch, K.A., Mathieu, J. and Kraiger, K. (2005) Investigating linear and interactive effects of shared mental models on safety and efficiency in a field setting. Journal of Applied Psychology, 90(3): 523-535.
Sommer, R. (1969) Personal Space. Englewood Cliffs, NJ: Prentice Hall.
Staples, D.S., Hulland, J.S. and Higgins, C.A. (1999) A Self-Efficacy Theory Explanation for the Management of Remote Workers in Virtual Organizations. Organization Science, 10(6): 758-776.
Star, S.L. and Griesemer, J.R. (1989) Institutional ecology, 'translations' and boundary objects: amateurs and professionals in Berkeley's Museum of Vertebrate Zoology, 1907-39. Social Studies of Science, 19(3): 387-420.
Sternberg, R.J. (ed.) (1988) The Nature of Creativity. Cambridge University Press, Cambridge.
Stewart, D.W. and Shamdasani, P.N. (1990) Focus Groups: Theory and Practice. London: Sage.
Suchman, L.A. (1987) Plans and Situated Actions. The Problem of Human - Machine Communication. Cambridge University Press, Cambridge.
Swan, J., Scarbrough, H. and Robertson, M. (2002) The construction of 'communities of practice' in the management of innovation. Management Learning, 33(4): 479-496.
Tang, J. (1991) Findings from Observational Studies of Collaborative Work. International Journal of Man-Machine Studies, 34(2): 143–160.
Terveen, L. G. Selfridge, P. G. and Long, M. D. (1995) Living design memory: framework, implementation, lessons learned. In Human.-Computer Interaction. 10(1): 1-37.
Thimbleby, H., Anderson, S. and Witten, I.H. (1990) Reflexive CSCW: Supporting Long-Term Personal Work. Interacting with Computers, 2(3): 330-336.
Thompson, S. (1992) Sampling. London: Wiley.
Tihanyi L., Griffith D.A. and Russell C.J. (2005) The effect of cultural distance on entry mode choice, international diversification, and MNE performance: a meta-analysis. Journal of International Business Studies, 36 (3): 270-283.
Torre, A. and Gilly, J.P. (2000) On the analytical dimension of proximity dynamics. Regional Studies, 34(2): 169-180.
Torre, A. and Rallet, A. (2005) Proximity and localization. Regional Studies, 39(1): 47-59.
Toye, G., Cutkosky, M.R., Leifer, L.J. and Glicksman, J. (1993) SHARE: A Methodology and Environment for Collaborative Product Development. Proceedings of IEEE Infrastructure for Collaborative Enterprises Revue d'Economic Region-tile et Urhaine (5): 835-852.
Tsai, W. (2001) Knowledge Transfer in Intraorganizational Networks: Effects of Network Position and Absorptive Capacity on Business Unit Innovation and Performance. Academy of Management Journal, 5: 996-1004.
Vahlne, J.E. and Wiedersheim-Paul, F. (1977) Psychic distance – an inhibiting factor in international trade, Working Paper, Center for International Business Studies, Department of Business Administration, University of Uppsala, Sweden, pp.1-19.
Vaidyanathan, G. (2006) Networked Knowledge Management Dimensions in Distributed Projects. International Journal of eCollaboration, 2 (4): 19-36.
Valkenburg, R.C. (1998) Shared understanding as a condition for team design. Automation in Construction, 7(2-3): 111-121.
280
Valkenburg, R.C. (2000) The Reflective Practice in Product Design Teams. Delft University of Technology, Delft.
Van den Bossche, P., Gijselaers, W., Segers, M., Woltjer, G. and Kirschner, P. (2010) Team learning: building shared mental models. Instructional Science, 2010-03-16. Springer, Netherlands, 0020-4277,.
Vendramin, P., Valenduc, G. (1998), “Telework in the scenarios of the future of work”, Proceedings of the Fifth European Assembly on Telework and New Ways of Working, DG XIII, Brussels and APTD, Lisbon.
Walther, J.B. (2002) Time Effects in Computer-Mediated Communication: Past, Present, and Future. In: P. Hinds and S. Kiesler (eds), Distributed Work. Cambridge, MA: MIT Press, pp. 235-258.
Wasserman, S. and Galaskiewicz, J. (1994) Advances in Social Network Analysis: Research in the Social and Behavioral Sciences. Sage Publications, Thousand Oaks, CA.
Watson-Manheim, M.B., Chudoba, K.M. and Crowston, K. (2005) The Paradox of Discontinuities and Continuities: Toward a More Comprehensive View of Virtuality. Retrieved from http://crowston.syr.edu/system/files/paradox2004.pdf.
Watson-Manheim, M.B., Chudoba, K.M. and Crowston, K. (2002) Discontinuities and continuities: a new way to understand virtual work. Information Technology and People, 15(3): 191-209.
Webster, J. and Staples, S. (2006) Comparing virtual teams to traditional teams: An identification of new research opportunities. Research in Personnel and Human Resource Management, 25: 183-218.
Weick, K.E. (1979) The Social Psychology of Organising. Reading, MA: Addison-Wesley.
Weick, K.E. (1995) Sensemaking in organisations. Thousands Oaks CA: Sage.
Wenger, E. (1998) Communities of Practice - Learning, Meaning, and Identity. Cambridge University Press, Cambridge, UK.
Wertsch, J. (1991) Voices of the Mind, A Sociocultural Approach to Mediated Action. Harvard University Press, Cambridge, MA., pp. 47-92.
West J. and Graham L. (2004) A linguistic-based measure of cultural distance and its relationship to managerial values. Management International Review 44 (3): 239-260.
Whiteoak, J.W., Chalip, L. and Hort, L.K. (2004) Assessing group efficacy: Comparing three methods of measurement. Small Group Research, 35(2): 158-173.
Wilkof, M.V., Brown, D.W. and Selsky, J.VV. (1995) When the stories are different: the influence of corporate culture mismatches on interorganizational relations. The Journal of Applied Behavioral Science, 31: 373-388.
Wilson, J. (2001) The development of trust in distributed groups. Unpublished doctoral dissertation, Carnegie Mellon University.
Wilson, J. M., Boyer O'Leary, M., Metiu, A. and Jett, Q. (2005) Subjective Distance in Teams. Working papers series, INSEAD.
Winroth, M. and Danilovic, M. (2002) Manufacturing Networks: Critical factors to successful collaboration. The 35th CIRP-Insternational Seminar on Manufacturing Systems, 12-15 May 2002, Seoul, Korea.
Wong, L.F. and Trinidad, S.G. (2004) Using Web-based distance learning to reduce cultural distance. The Journal of Interactive Online Learning, 3 (1), retrieved from http://www.ncolr.org/jiol/issues/pdf/3.1.2.pdf.
Zellars, K.L., Hochwarter, W.A., Perrewe, P.L., Miles, A.K. and Kiewitz, C. (2001) Beyond self-efficacy: Interactive effects of role conflict and perceived collective efficacy. Journal of Managerial Issues, 13(4): 483-499.

281
Zeller, C. (2004) North Atlantic innovative relations of Swiss pharmaceuticals and the proximities with regional biotech arenas. Journal of Economic Geography, 80(1): 83–111.
Zhang, J., Scardamalia, M., Reeve, R. and Messina, R. (2006) Collective cognitive responsibility in knowledge building communities. In: American Educational Research Association Annual Meeting, 2006, San Francisco, CA.
Zheng M., Pawar K. and Riedel J. (2006) Evaluation of communication patterns during NPD within European and Chinese context. In: Thoben, K-D; Pawar, KS; Taisch, M; & Terzi, S. Proceedings of the 12th International Conference on Concurrent Enterprising: Innovative products and services through collaborative networks, 26-28 June 2006, Milan, Italy, University of Nottingham, Nottingham. (ISBN 0 85358 228 9). pp449-458.
282
Appendix A
Collaborative Distance: Detailed Table
I m a g i n a t i o n i s m o r e i m p o r t a n t t h a n k n o w l e d g e . –
A l b e r t E i n s t e i n

283
Ref Distance types
Dimensio
ns
Synonymous distance types
Distance-creating factors
Distance compressing
factors
Distance bridging factors Description References
St1 Configurational Globalisation
Activities context and globalisation trend; dispersed teams; lack of leadership, incentive, cohesiveness and vision.
Online groups, communities and social networking; online project office.
Clustering of members at sites, Role Index and External Index, clear leadership, shared vision, collaboration incentive, balanced power and expertise in decision making
In this context, configuration is the arrangement of group members across sites, whatever the distances among them. Such configurations include: a ‘fully dispersed’ team with only one member at each of several sites, a team with multiple members at multiple sites, or a team split across only two sites. Sub-group configurations can lead to conflict and members who are isolated from the rest of the team tend to be left out of group communications and interactions.
Grinter et al., 1999; Oldham et al., 1995; Ancona & Caldwell, 1992; Armstrong & Cole, 2002; O’Leary & Cummings, 2002; Cramton, 2001; Ketchen et al., 1997; Meyer et al., 1993.
St2 Institutional
Stru
ctur
al
Globalisation
Globalisation; contextual factors such as investment rules, legal framework, political climate (instability), lack of interoperability (e.g. institutional incompatibility).
Migration tides; colonial heritage; institutional presence; modern transportation.
Internationalisation experience; local political stability; overseas education; professional management training; institutional convergence; globalisation set of business policies & regulations.
Institutional distance is generated by differences among individuals according to their historical, political, economical and cultural/social environments, which drive formal rules to be applied by those individuals. For example the EU is minimising the national regulation divergence amongst member states as a kind of uniformisation of the business competition rules.
Kirat & Lung, 1999; North, 1997; Zeller, 2004; Child et al., 2002; Orlikowski, 2002; Johanson & Wiedersheim-Paul, 1975; Nordstrom and Vahlne, 1992.
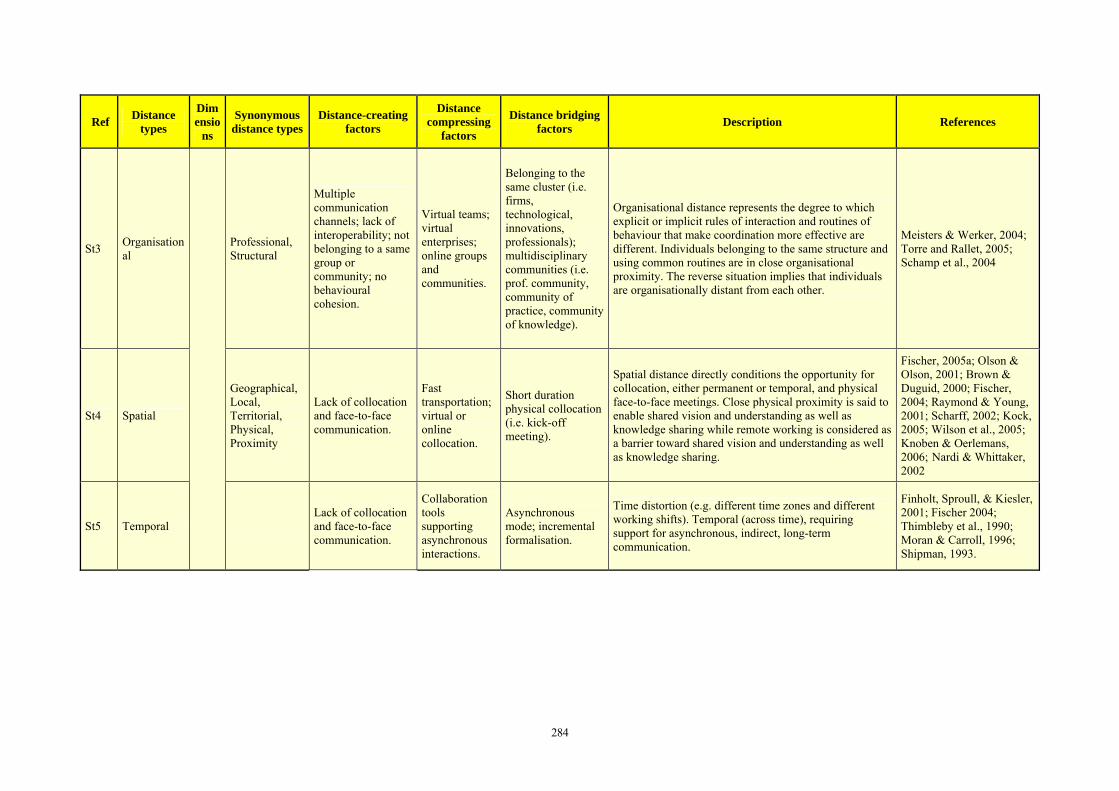
284
Ref Distance types
Dimensio
ns
Synonymous distance types
Distance-creating factors
Distance compressing
factors
Distance bridging factors Description References
St3 Organisational
Professional, Structural
Multiple communication channels; lack of interoperability; not belonging to a same group or community; no behavioural cohesion.
Virtual teams; virtual enterprises; online groups and communities.
Belonging to the same cluster (i.e. firms, technological, innovations, professionals); multidisciplinary communities (i.e. prof. community, community of practice, community of knowledge).
Organisational distance represents the degree to which explicit or implicit rules of interaction and routines of behaviour that make coordination more effective are different. Individuals belonging to the same structure and using common routines are in close organisational proximity. The reverse situation implies that individuals are organisationally distant from each other.
Meisters & Werker, 2004; Torre and Rallet, 2005; Schamp et al., 2004
St4 Spatial
Geographical, Local, Territorial, Physical, Proximity
Lack of collocation and face-to-face communication.
Fast transportation; virtual or online collocation.
Short duration physical collocation (i.e. kick-off meeting).
Spatial distance directly conditions the opportunity for collocation, either permanent or temporal, and physical face-to-face meetings. Close physical proximity is said to enable shared vision and understanding as well as knowledge sharing while remote working is considered as a barrier toward shared vision and understanding as well as knowledge sharing.
Fischer, 2005a; Olson & Olson, 2001; Brown & Duguid, 2000; Fischer, 2004; Raymond & Young, 2001; Scharff, 2002; Kock, 2005; Wilson et al., 2005; Knoben & Oerlemans, 2006; Nardi & Whittaker, 2002
St5 Temporal Lack of collocation and face-to-face communication.
Collaboration tools supporting asynchronous interactions.
Asynchronous mode; incremental formalisation.
Time distortion (e.g. different time zones and different working shifts). Temporal (across time), requiring support for asynchronous, indirect, long-term communication.
Finholt, Sproull, & Kiesler, 2001; Fischer 2004; Thimbleby et al., 1990; Moran & Carroll, 1996; Shipman, 1993.
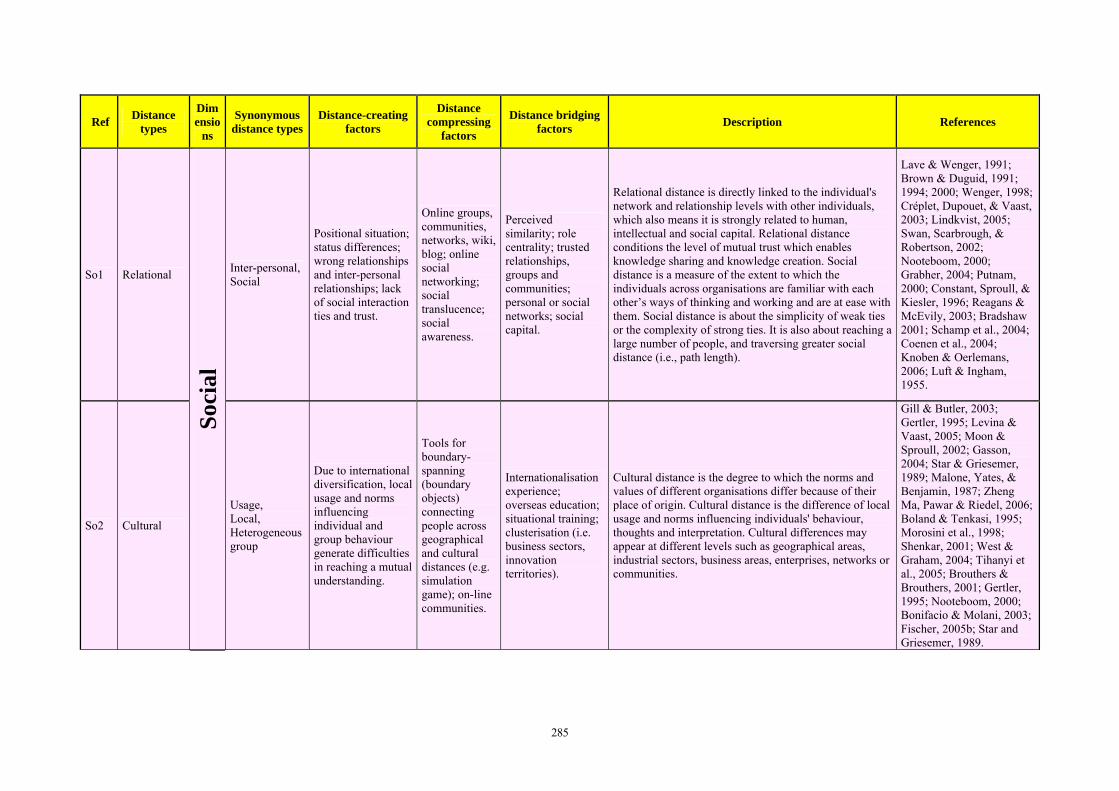
285
Ref Distance types
Dimensio
ns
Synonymous distance types
Distance-creating factors
Distance compressing
factors
Distance bridging factors Description References
So1 Relational Inter-personal, Social
Positional situation; status differences; wrong relationships and inter-personal relationships; lack of social interaction ties and trust.
Online groups, communities, networks, wiki, blog; online social networking; social translucence; social awareness.
Perceived similarity; role centrality; trusted relationships, groups and communities; personal or social networks; social capital.
Relational distance is directly linked to the individual's network and relationship levels with other individuals, which also means it is strongly related to human, intellectual and social capital. Relational distance conditions the level of mutual trust which enables knowledge sharing and knowledge creation. Social distance is a measure of the extent to which the individuals across organisations are familiar with each other’s ways of thinking and working and are at ease with them. Social distance is about the simplicity of weak ties or the complexity of strong ties. It is also about reaching a large number of people, and traversing greater social distance (i.e., path length).
Lave & Wenger, 1991; Brown & Duguid, 1991; 1994; 2000; Wenger, 1998; Créplet, Dupouet, & Vaast, 2003; Lindkvist, 2005; Swan, Scarbrough, & Robertson, 2002; Nooteboom, 2000; Grabher, 2004; Putnam, 2000; Constant, Sproull, & Kiesler, 1996; Reagans & McEvily, 2003; Bradshaw 2001; Schamp et al., 2004; Coenen et al., 2004; Knoben & Oerlemans, 2006; Luft & Ingham, 1955.
So2 Cultural
Soci
al
Usage, Local, Heterogeneous group
Due to international diversification, local usage and norms influencing individual and group behaviour generate difficulties in reaching a mutual understanding.
Tools for boundary-spanning (boundary objects) connecting people across geographical and cultural distances (e.g. simulation game); on-line communities.
Internationalisation experience; overseas education; situational training; clusterisation (i.e. business sectors, innovation territories).
Cultural distance is the degree to which the norms and values of different organisations differ because of their place of origin. Cultural distance is the difference of local usage and norms influencing individuals' behaviour, thoughts and interpretation. Cultural differences may appear at different levels such as geographical areas, industrial sectors, business areas, enterprises, networks or communities.
Gill & Butler, 2003; Gertler, 1995; Levina & Vaast, 2005; Moon & Sproull, 2002; Gasson, 2004; Star & Griesemer, 1989; Malone, Yates, & Benjamin, 1987; Zheng Ma, Pawar & Riedel, 2006; Boland & Tenkasi, 1995; Morosini et al., 1998; Shenkar, 2001; West & Graham, 2004; Tihanyi et al., 2005; Brouthers & Brouthers, 2001; Gertler, 1995; Nooteboom, 2000; Bonifacio & Molani, 2003; Fischer, 2005b; Star and Griesemer, 1989.
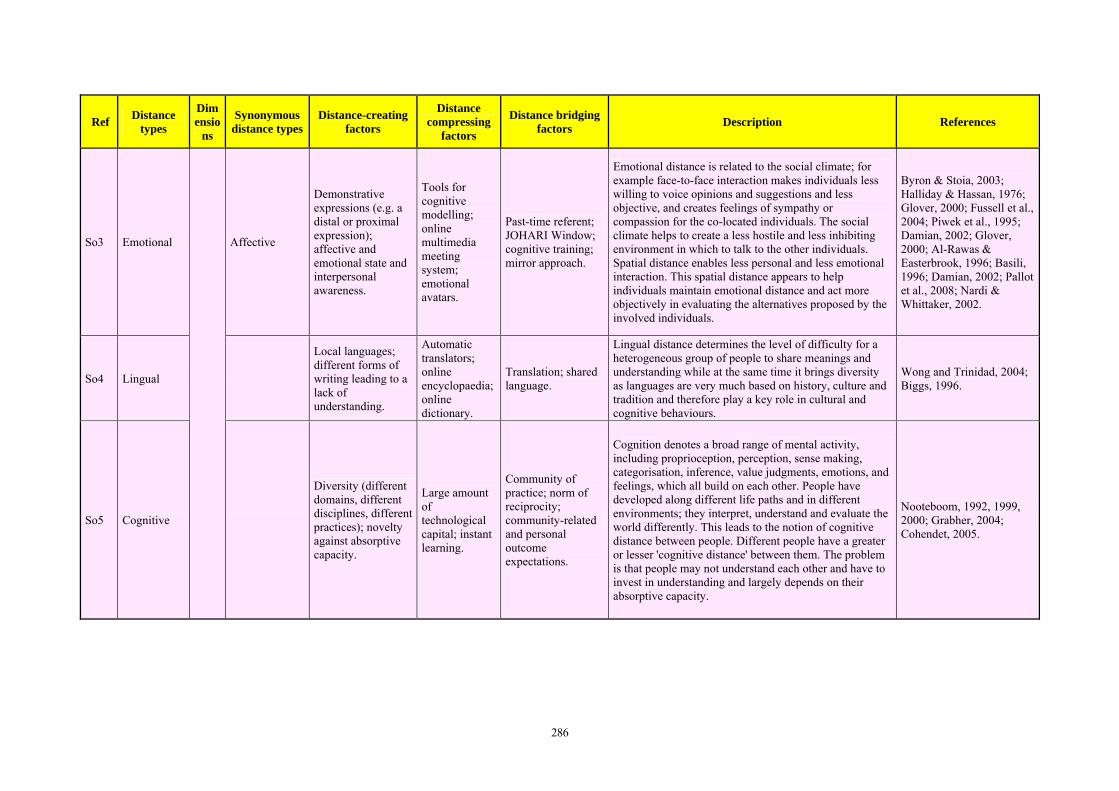
286
Ref Distance types
Dimensio
ns
Synonymous distance types
Distance-creating factors
Distance compressing
factors
Distance bridging factors Description References
So3 Emotional Affective
Demonstrative expressions (e.g. a distal or proximal expression); affective and emotional state and interpersonal awareness.
Tools for cognitive modelling; online multimedia meeting system; emotional avatars.
Past-time referent; JOHARI Window; cognitive training; mirror approach.
Emotional distance is related to the social climate; for example face-to-face interaction makes individuals less willing to voice opinions and suggestions and less objective, and creates feelings of sympathy or compassion for the co-located individuals. The social climate helps to create a less hostile and less inhibiting environment in which to talk to the other individuals. Spatial distance enables less personal and less emotional interaction. This spatial distance appears to help individuals maintain emotional distance and act more objectively in evaluating the alternatives proposed by the involved individuals.
Byron & Stoia, 2003; Halliday & Hassan, 1976; Glover, 2000; Fussell et al., 2004; Piwek et al., 1995; Damian, 2002; Glover, 2000; Al-Rawas & Easterbrook, 1996; Basili, 1996; Damian, 2002; Pallot et al., 2008; Nardi & Whittaker, 2002.
So4 Lingual
Local languages; different forms of writing leading to a lack of understanding.
Automatic translators; online encyclopaedia; online dictionary.
Translation; shared language.
Lingual distance determines the level of difficulty for a heterogeneous group of people to share meanings and understanding while at the same time it brings diversity as languages are very much based on history, culture and tradition and therefore play a key role in cultural and cognitive behaviours.
Wong and Trinidad, 2004; Biggs, 1996.
So5 Cognitive
Diversity (different domains, different disciplines, different practices); novelty against absorptive capacity.
Large amount of technological capital; instant learning.
Community of practice; norm of reciprocity; community-related and personal outcome expectations.
Cognition denotes a broad range of mental activity, including proprioception, perception, sense making, categorisation, inference, value judgments, emotions, and feelings, which all build on each other. People have developed along different life paths and in different environments; they interpret, understand and evaluate the world differently. This leads to the notion of cognitive distance between people. Different people have a greater or lesser 'cognitive distance' between them. The problem is that people may not understand each other and have to invest in understanding and largely depends on their absorptive capacity.
Nooteboom, 1992, 1999, 2000; Grabher, 2004; Cohendet, 2005.

287
Ref Distance types
Dimensio
ns
Synonymous distance types
Distance-creating factors
Distance compressing
factors
Distance bridging factors Description References
T1 Conceptual Expertise
Expertise gaps (i.e. novice v. expert); same concept name and different meanings leading to interpretations.
Integrating diversity through online multidisciplinary groups and communities; building-up online folksonomy, tagsonomy, concept mapping and topic maps within use of wiki for shared meanings.
Integrating diversity through multidisciplinary groups and communities; making all voices heard; establishing a common ground and shared meanings.
Conceptual distance is the degree to which disciplines' views and concepts are compatible. Conceptual barriers are often mentioned as being expertise gaps. Gentner’s structure-mapping theory of analogy emphasises formal, shared syntactic relations between concepts. In contrast, Hofstadter and Mitchell’s ‘slipnets’ project emphasises semantic similarities and employs connectionist notions of conceptual distance and activation to make analogy more dynamic and cognitively plausible. Conceptual distance across different communities of practice requires support for common ground and shared understanding.
Gentner, 1983; Liu and Singh, 2004; Hofstadter and Mitchell, 1995; Fischer, 2001, 2004, 2005b; Resnick et al., 1991.
T2 Contextual
Local and situational arrangements; conditions and rules are leading to cognitive overload.
Online context awareness automatically deducted from shared events and meta-data.
Collecting information for building-up context awareness.
Contextual distance is the degree to which local and situational arrangements, availability conditions and rules differ from one to one another. A common feature of situations leading to creative results lies in the contextual distance to the problem-relevant domain.
Demetriadis et al., 2005; Gross & Prinz, 2003; Prante, Magerkurth, & Streitz, 2002; Hymes & Olson, 1992; Finke, Ward & Smith, 1992.
T3 Referential
Tec
hnic
al
Correlation Unevaluated degree of relevance.
Computerised formulation of relevance.
Correlation; calculation.
The referential distance corresponds to the distance between the point of origin and the correlating document measured by the number of minimally necessary references. In this way it is possible to describe the potential relevance of a document compared to the origin of referencing. If the referential distance increases, the relevance can be expected to decrease.
Fuchs-Kittowski & Köhler, 2005; Chakrabarti, Srivastava, Subramanyam & Tiwari 2000; Croft & Turtle, 1989.
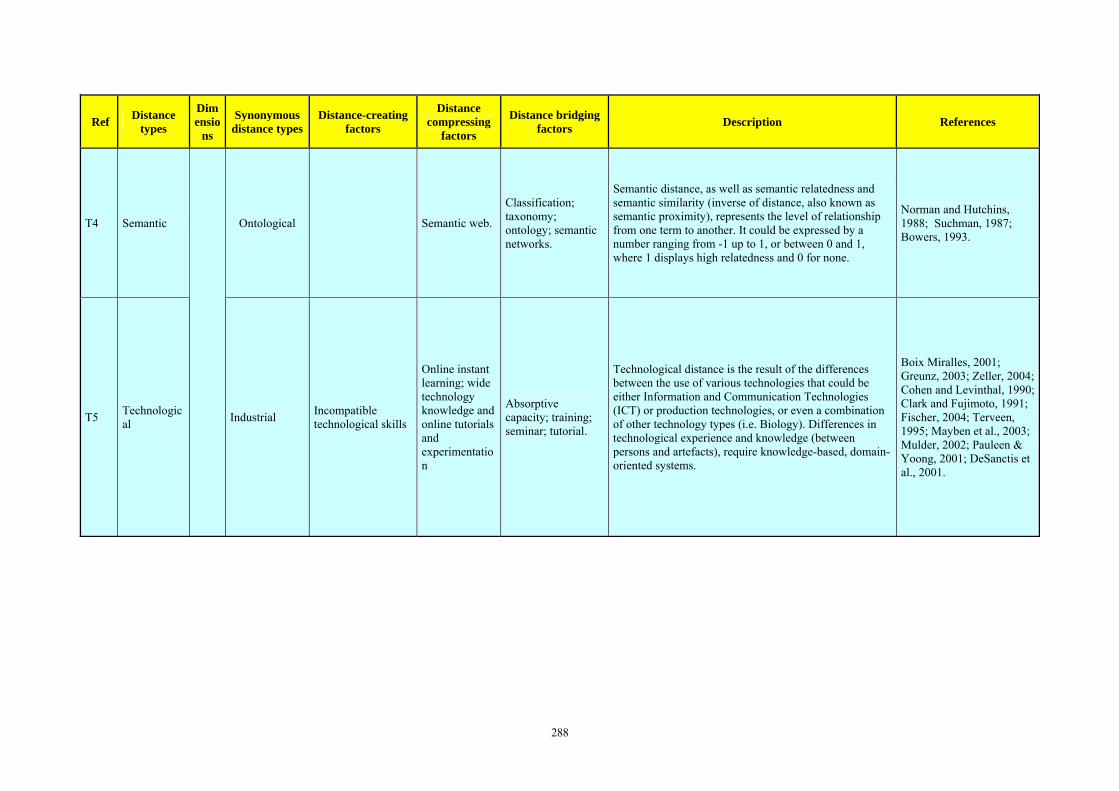
288
Ref Distance types
Dimensio
ns
Synonymous distance types
Distance-creating factors
Distance compressing
factors
Distance bridging factors Description References
T4 Semantic Ontological Semantic web.
Classification; taxonomy; ontology; semantic networks.
Semantic distance, as well as semantic relatedness and semantic similarity (inverse of distance, also known as semantic proximity), represents the level of relationship from one term to another. It could be expressed by a number ranging from -1 up to 1, or between 0 and 1, where 1 displays high relatedness and 0 for none.
Norman and Hutchins, 1988; Suchman, 1987; Bowers, 1993.
T5 Technological Industrial Incompatible
technological skills
Online instant learning; wide technology knowledge and online tutorials and experimentation
Absorptive capacity; training; seminar; tutorial.
Technological distance is the result of the differences between the use of various technologies that could be either Information and Communication Technologies (ICT) or production technologies, or even a combination of other technology types (i.e. Biology). Differences in technological experience and knowledge (between persons and artefacts), require knowledge-based, domain-oriented systems.
Boix Miralles, 2001; Greunz, 2003; Zeller, 2004; Cohen and Levinthal, 1990; Clark and Fujimoto, 1991; Fischer, 2004; Terveen, 1995; Mayben et al., 2003; Mulder, 2002; Pauleen & Yoong, 2001; DeSanctis et al., 2001.
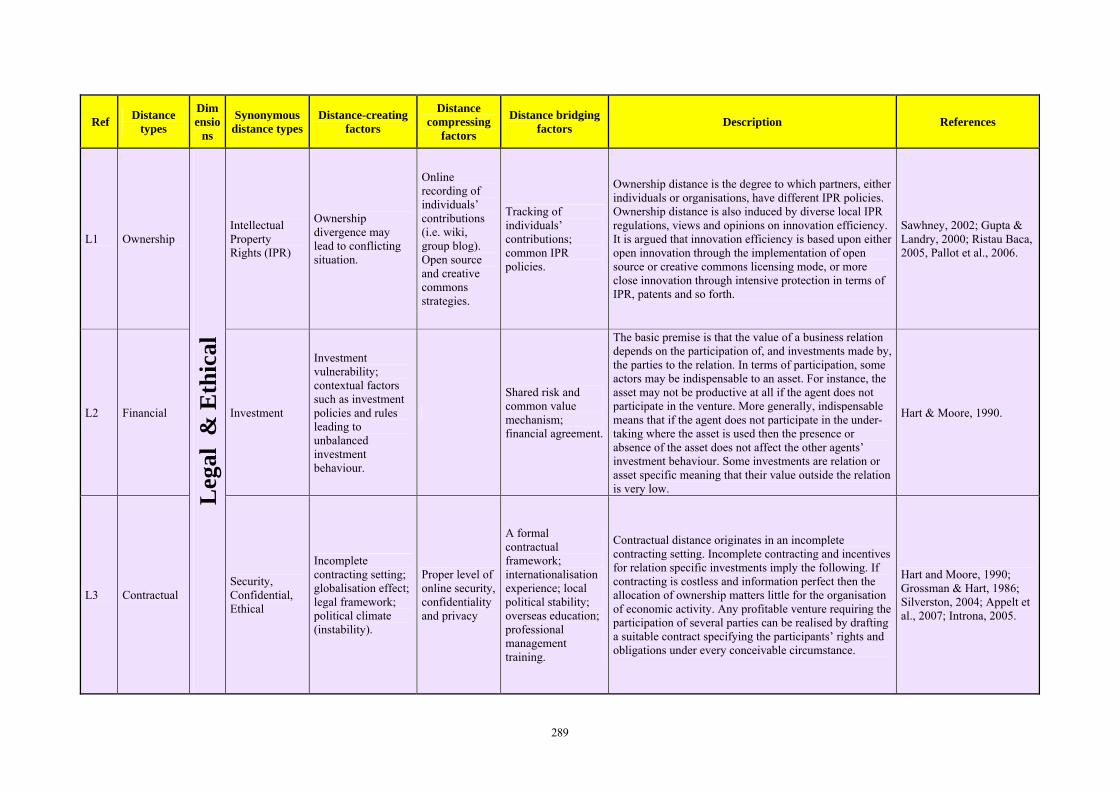
289
Ref Distance types
Dimensio
ns
Synonymous distance types
Distance-creating factors
Distance compressing
factors
Distance bridging factors Description References
L1 Ownership Intellectual Property Rights (IPR)
Ownership divergence may lead to conflicting situation.
Online recording of individuals’ contributions (i.e. wiki, group blog). Open source and creative commons strategies.
Tracking of individuals’ contributions; common IPR policies.
Ownership distance is the degree to which partners, either individuals or organisations, have different IPR policies. Ownership distance is also induced by diverse local IPR regulations, views and opinions on innovation efficiency. It is argued that innovation efficiency is based upon either open innovation through the implementation of open source or creative commons licensing mode, or more close innovation through intensive protection in terms of IPR, patents and so forth.
Sawhney, 2002; Gupta & Landry, 2000; Ristau Baca, 2005, Pallot et al., 2006.
L2 Financial Investment
Investment vulnerability; contextual factors such as investment policies and rules leading to unbalanced investment behaviour.
Shared risk and common value mechanism; financial agreement.
The basic premise is that the value of a business relation depends on the participation of, and investments made by, the parties to the relation. In terms of participation, some actors may be indispensable to an asset. For instance, the asset may not be productive at all if the agent does not participate in the venture. More generally, indispensable means that if the agent does not participate in the under-taking where the asset is used then the presence or absence of the asset does not affect the other agents’ investment behaviour. Some investments are relation or asset specific meaning that their value outside the relation is very low.
Hart & Moore, 1990.
L3 Contractual
Leg
al &
Eth
ical
Security, Confidential, Ethical
Incomplete contracting setting; globalisation effect; legal framework; political climate (instability).
Proper level of online security, confidentiality and privacy
A formal contractual framework; internationalisation experience; local political stability; overseas education; professional management training.
Contractual distance originates in an incomplete contracting setting. Incomplete contracting and incentives for relation specific investments imply the following. If contracting is costless and information perfect then the allocation of ownership matters little for the organisation of economic activity. Any profitable venture requiring the participation of several parties can be realised by drafting a suitable contract specifying the participants’ rights and obligations under every conceivable circumstance.
Hart and Moore, 1990; Grossman & Hart, 1986; Silverston, 2004; Appelt et al., 2007; Introna, 2005.
Appendix B
Focus Group Interviews: Synthesis Tables
T h e i m p o r t a n t t h i n g i s n o t t o s t o p
q u e s t i o n i n g . C u r i o s i t y h a s i t s o w n r e a s o n f o r
e x i s t i n g . – A l b e r t E i n s t e i n
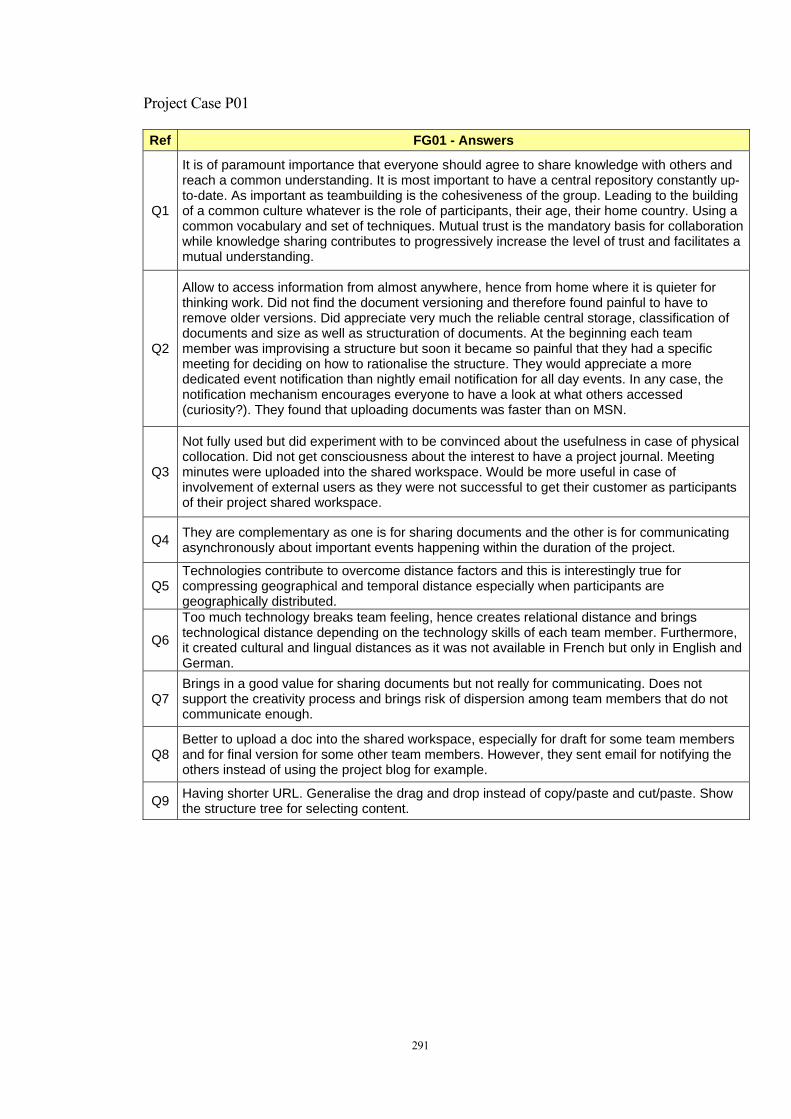
291
Project Case P01
Ref FG01 - Answers
Q1
It is of paramount importance that everyone should agree to share knowledge with others and reach a common understanding. It is most important to have a central repository constantly up-to-date. As important as teambuilding is the cohesiveness of the group. Leading to the building of a common culture whatever is the role of participants, their age, their home country. Using a common vocabulary and set of techniques. Mutual trust is the mandatory basis for collaboration while knowledge sharing contributes to progressively increase the level of trust and facilitates a mutual understanding.
Q2
Allow to access information from almost anywhere, hence from home where it is quieter for thinking work. Did not find the document versioning and therefore found painful to have to remove older versions. Did appreciate very much the reliable central storage, classification of documents and size as well as structuration of documents. At the beginning each team member was improvising a structure but soon it became so painful that they had a specific meeting for deciding on how to rationalise the structure. They would appreciate a more dedicated event notification than nightly email notification for all day events. In any case, the notification mechanism encourages everyone to have a look at what others accessed (curiosity?). They found that uploading documents was faster than on MSN.
Q3
Not fully used but did experiment with to be convinced about the usefulness in case of physical collocation. Did not get consciousness about the interest to have a project journal. Meeting minutes were uploaded into the shared workspace. Would be more useful in case of involvement of external users as they were not successful to get their customer as participants of their project shared workspace.
Q4 They are complementary as one is for sharing documents and the other is for communicating asynchronously about important events happening within the duration of the project.
Q5 Technologies contribute to overcome distance factors and this is interestingly true for compressing geographical and temporal distance especially when participants are geographically distributed.
Q6
Too much technology breaks team feeling, hence creates relational distance and brings technological distance depending on the technology skills of each team member. Furthermore, it created cultural and lingual distances as it was not available in French but only in English and German.
Q7 Brings in a good value for sharing documents but not really for communicating. Does not support the creativity process and brings risk of dispersion among team members that do not communicate enough.
Q8 Better to upload a doc into the shared workspace, especially for draft for some team members and for final version for some other team members. However, they sent email for notifying the others instead of using the project blog for example.
Q9 Having shorter URL. Generalise the drag and drop instead of copy/paste and cut/paste. Show the structure tree for selecting content.
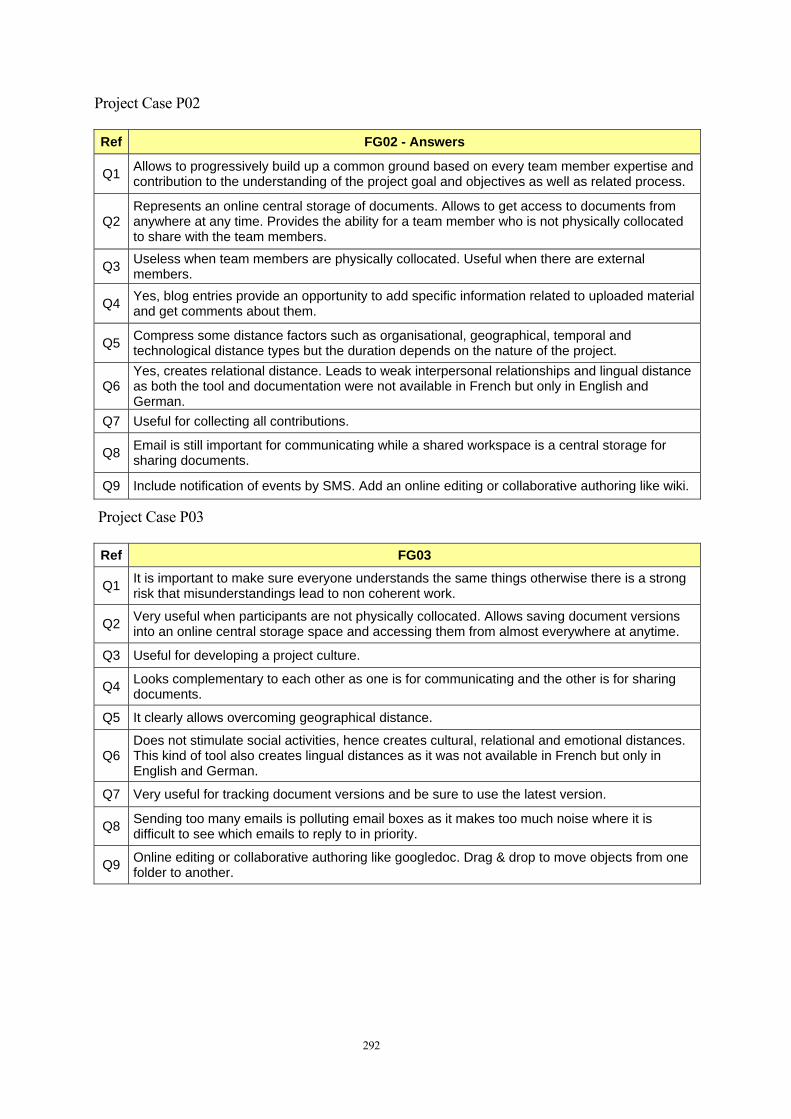
292
Project Case P02
Ref FG02 - Answers
Q1 Allows to progressively build up a common ground based on every team member expertise and contribution to the understanding of the project goal and objectives as well as related process.
Q2 Represents an online central storage of documents. Allows to get access to documents from anywhere at any time. Provides the ability for a team member who is not physically collocated to share with the team members.
Q3 Useless when team members are physically collocated. Useful when there are external members.
Q4 Yes, blog entries provide an opportunity to add specific information related to uploaded material and get comments about them.
Q5 Compress some distance factors such as organisational, geographical, temporal and technological distance types but the duration depends on the nature of the project.
Q6 Yes, creates relational distance. Leads to weak interpersonal relationships and lingual distance as both the tool and documentation were not available in French but only in English and German.
Q7 Useful for collecting all contributions.
Q8 Email is still important for communicating while a shared workspace is a central storage for sharing documents.
Q9 Include notification of events by SMS. Add an online editing or collaborative authoring like wiki.
Project Case P03
Ref FG03
Q1 It is important to make sure everyone understands the same things otherwise there is a strong risk that misunderstandings lead to non coherent work.
Q2 Very useful when participants are not physically collocated. Allows saving document versions into an online central storage space and accessing them from almost everywhere at anytime.
Q3 Useful for developing a project culture.
Q4 Looks complementary to each other as one is for communicating and the other is for sharing documents.
Q5 It clearly allows overcoming geographical distance.
Q6 Does not stimulate social activities, hence creates cultural, relational and emotional distances. This kind of tool also creates lingual distances as it was not available in French but only in English and German.
Q7 Very useful for tracking document versions and be sure to use the latest version.
Q8 Sending too many emails is polluting email boxes as it makes too much noise where it is difficult to see which emails to reply to in priority.
Q9 Online editing or collaborative authoring like googledoc. Drag & drop to move objects from one folder to another.
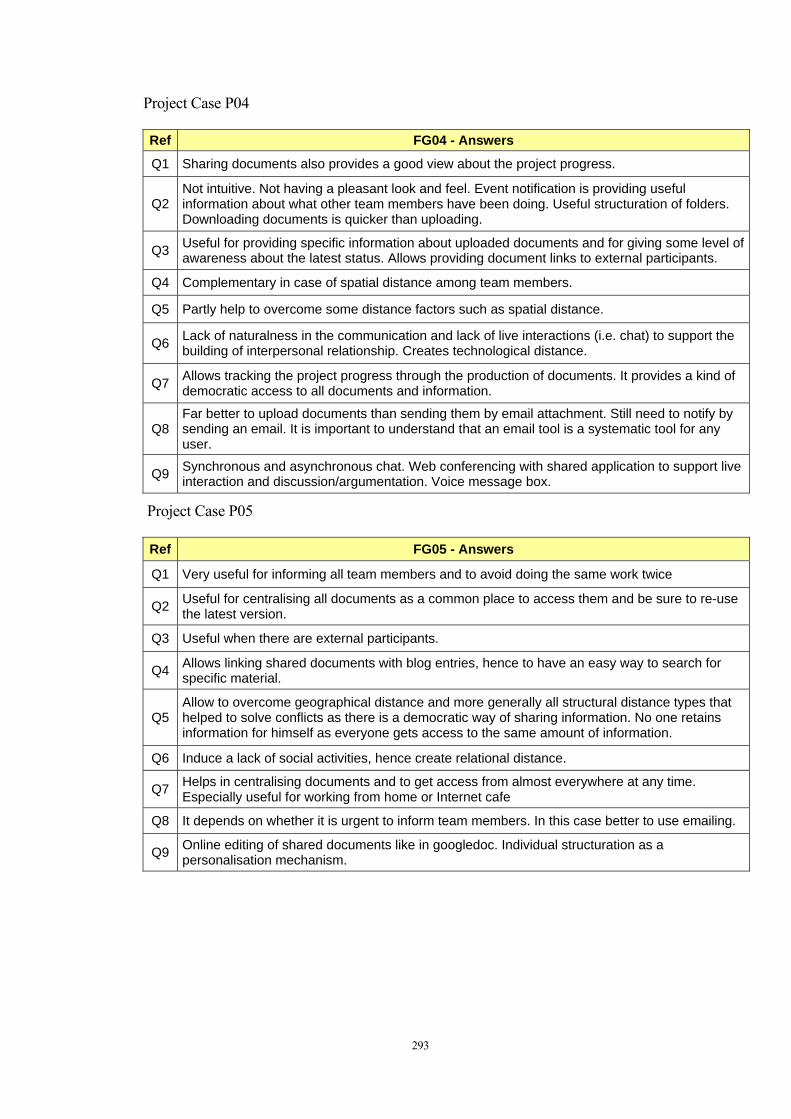
293
Project Case P04
Ref FG04 - Answers
Q1 Sharing documents also provides a good view about the project progress.
Q2 Not intuitive. Not having a pleasant look and feel. Event notification is providing useful information about what other team members have been doing. Useful structuration of folders. Downloading documents is quicker than uploading.
Q3 Useful for providing specific information about uploaded documents and for giving some level of awareness about the latest status. Allows providing document links to external participants.
Q4 Complementary in case of spatial distance among team members.
Q5 Partly help to overcome some distance factors such as spatial distance.
Q6 Lack of naturalness in the communication and lack of live interactions (i.e. chat) to support the building of interpersonal relationship. Creates technological distance.
Q7 Allows tracking the project progress through the production of documents. It provides a kind of democratic access to all documents and information.
Q8 Far better to upload documents than sending them by email attachment. Still need to notify by sending an email. It is important to understand that an email tool is a systematic tool for any user.
Q9 Synchronous and asynchronous chat. Web conferencing with shared application to support live interaction and discussion/argumentation. Voice message box.
Project Case P05
Ref FG05 - Answers
Q1 Very useful for informing all team members and to avoid doing the same work twice
Q2 Useful for centralising all documents as a common place to access them and be sure to re-use the latest version.
Q3 Useful when there are external participants.
Q4 Allows linking shared documents with blog entries, hence to have an easy way to search for specific material.
Q5 Allow to overcome geographical distance and more generally all structural distance types that helped to solve conflicts as there is a democratic way of sharing information. No one retains information for himself as everyone gets access to the same amount of information.
Q6 Induce a lack of social activities, hence create relational distance.
Q7 Helps in centralising documents and to get access from almost everywhere at any time. Especially useful for working from home or Internet cafe
Q8 It depends on whether it is urgent to inform team members. In this case better to use emailing.
Q9 Online editing of shared documents like in googledoc. Individual structuration as a personalisation mechanism.
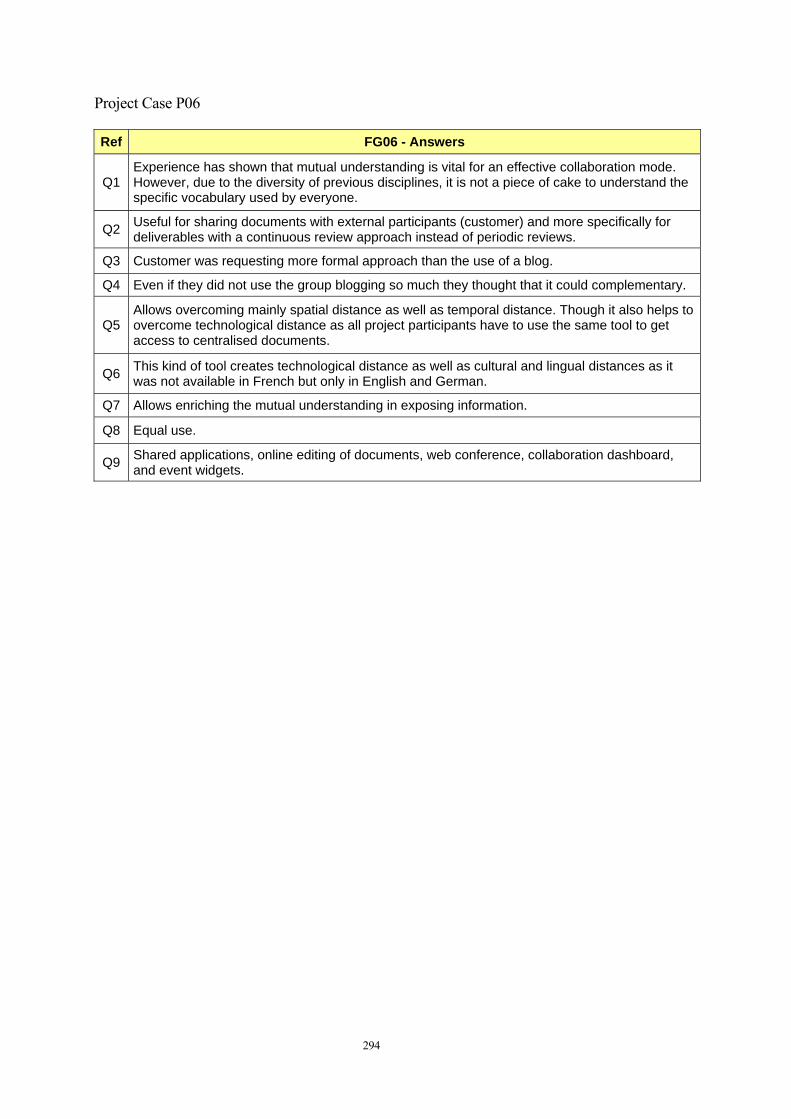
294
Project Case P06
Ref FG06 - Answers
Q1 Experience has shown that mutual understanding is vital for an effective collaboration mode. However, due to the diversity of previous disciplines, it is not a piece of cake to understand the specific vocabulary used by everyone.
Q2 Useful for sharing documents with external participants (customer) and more specifically for deliverables with a continuous review approach instead of periodic reviews.
Q3 Customer was requesting more formal approach than the use of a blog.
Q4 Even if they did not use the group blogging so much they thought that it could complementary.
Q5 Allows overcoming mainly spatial distance as well as temporal distance. Though it also helps to overcome technological distance as all project participants have to use the same tool to get access to centralised documents.
Q6 This kind of tool creates technological distance as well as cultural and lingual distances as it was not available in French but only in English and German.
Q7 Allows enriching the mutual understanding in exposing information.
Q8 Equal use.
Q9 Shared applications, online editing of documents, web conference, collaboration dashboard, and event widgets.

295
Project Case P07
Ref FG07 - Answers
Q1
Mutual understanding is the basis to make sure no-one is going to work in the wrong direction and important for avoiding embedded misunderstandings that often still happen in projects. Sharing permanently information also allows seeing what others are doing and how they progress which is useful to adapt our own contribution in the leanest way. The use of modelling techniques like activity functional modelling is also essential for creating a mutual understanding. It is especially true for discussing everyone's view with the use of a common language or graphic representation (IDEF0) which facilitates the communication and interaction among team members and for coming to a good compromise satisfying all team members.
Q2
Allows to be sure that all team members will get access to the same set of documents wherever they are and whenever they wish (though it requires having an Internet connection available). It is also a secure storage place which avoids the risk of lost documents. It provides a way to follow the project progress through the production of documents and to involve external participants.
Q3 It was quite difficult to evaluate as external participants did not use it.
Q4 Complementarity is quite obvious as each tool has a different purpose. Group or project blog is for people to express their concern or to point colleagues to specific information while shared workspace is for sharing documents.
Q5 Helps to mainly overcome structural distance types such as geographical, organisational and temporal distances.
Q6 Creates distance on social aspects such as cultural and relational distance types.
Q7 Very useful for centralising all documents to be shared but blogging is supplanted by face-to-face interactions.
Q8 Used partly email and partly shared workspace depending on whether there was a need to share a document or not.
Q9 Event notification should be like instant messaging and not as a report grouping all events once per night.

296
Project Case P08
Ref FG08 - Answers
Q1 Creating a mutual understanding is of paramount importance otherwise it is difficult to collaborate if everyone uses his own vocabulary.
Q2 Not something culturally known and accepted. However, the versioning function of the shared workspace is very useful to avoid working on an old dated version.
Q3 Useful when there are people (like the project coach) monitoring the project progress.
Q4 Obviously complementary but do regret that there was no possibility to do online editing of shared documents which means one has to download a document, edit it and then upload it back into the shared workspace.
Q5 Overcame totally geographical and temporal distances and partially contributed to compress configurational and organisational distances.
Q6 Creates technological and relational distance as well as emotional distance. However, in the case of emotional distance it could help a person who is too shy for expressing problems.
Q7 Very useful for sharing documents and keeping a project history. Googledoc has a limited space size.
Q8 Turned from emailing to sharing with the use of the shared workspace tool.
Q9 Collaboration dashboard, web conference, instant messaging, zichio, presence
Project Case P09
Ref FG09 - Answers
Q1 Sharing allows seeing what others are doing and provides a global view on the project progress.
Q2 Having a common place for the project contributed to the group cohesiveness. Sharing and centralising documents that are accessible from almost everywhere is very useful and all team members are up-to-date.
Q3
Found interesting to have a project journal where each participant could react in either creating his own entries or in commenting the ones from other participants. However, reacting by comment without directly talking to the other person might not necessarily be appreciated by the author of the commented entry (cultural problem).
Q4 Complementarity is obvious.
Q5 Helps to overcome partially spatial distance as there is no synchronous communication tool available with this platform. Nonetheless, it is ok for temporal distance as in this case the need is to have asynchronous communication.
Q6 Creates distance in social interaction as it encourages participants to have asynchronous communication with limited level of interaction but at the same time good for someone who is too shy to express his/her feeling.
Q7 At least useful as a central storage even for physically collocated group.
Q8 Emailing is still the most favourite tool especially when there is no attachment.
Q9 Should include online editing like googledoc or wiki style, instant messaging, visio-conference, and dashboard.
Project Case P10

297
Ref FG10 - Answers
Q1
Mutual understanding is a key element of collaboration as demonstrated by the modelling of the project process to make sure all project team members have the same understanding of their process. Sharing knowledge allows reaching a mutual understanding when the vocabulary becomes common to every participant.
Q2 Sharing documents is a good point but having the opportunity to add comments directly online and give a rating to contribution would be more effective.
Q3 Did not have time to experiment the project blog.
Q4 Complementarity is obvious, though too much personal feeling entries might be disturbing to the cohesiveness of the group.
Q5
It has contributed to overcome most of the structural type of distances and more particularly distance related to the shared workspace structuration as a kind of standard for all participants was very much appreciated by the team especially for enhancing team cohesiveness. However, spatial distance type was not fully compressed due to the lack of synchronous communication such as web conferencing tool or VoIP (i.e. Skype).
Q6
Creates relational distance and technological distance (everyone does not have the same ICT skill) as well as cultural distance, though it might be, in some cases, creating a specific online culture among project participants hence contributes to overcome cultural distance. It has the same effect on overcoming technological distance due to the fact that all project participants are using the same central storage always accessible from whenever located participants are and whenever they wish. However, in this case the technological distance among participants could be due to the fact that the Internet is not available everywhere, hence not all participants necessarily have Internet access.
Q7 Useful for sharing documents and especially with external participants. Structuration with folders and sub-folders is also very helpful and appreciated as it looks like almost the same way as PC folders structure.
Q8 Partly use emailing and partly use shared workspace since they had the opportunity to experiment the use of a shared workspace.
Q9
Should include instant messaging, a more ergonomic and user friendly user interface. Google doc and adobe share are in comparison more intuitive. A collaboration dashboard providing events notification in real time would be very much appreciated as it would help to foresee what others are doing.
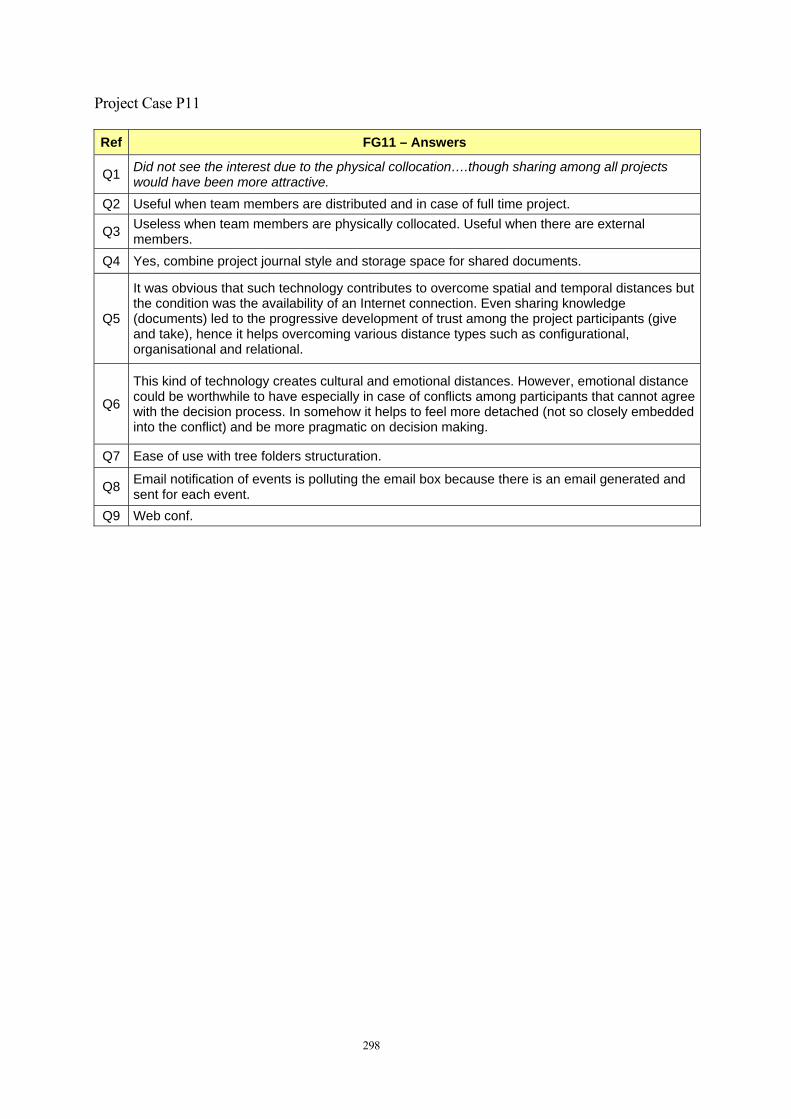
298
Project Case P11
Ref FG11 – Answers
Q1 Did not see the interest due to the physical collocation….though sharing among all projects would have been more attractive.
Q2 Useful when team members are distributed and in case of full time project.
Q3 Useless when team members are physically collocated. Useful when there are external members.
Q4 Yes, combine project journal style and storage space for shared documents.
Q5
It was obvious that such technology contributes to overcome spatial and temporal distances but the condition was the availability of an Internet connection. Even sharing knowledge (documents) led to the progressive development of trust among the project participants (give and take), hence it helps overcoming various distance types such as configurational, organisational and relational.
Q6
This kind of technology creates cultural and emotional distances. However, emotional distance could be worthwhile to have especially in case of conflicts among participants that cannot agree with the decision process. In somehow it helps to feel more detached (not so closely embedded into the conflict) and be more pragmatic on decision making.
Q7 Ease of use with tree folders structuration.
Q8 Email notification of events is polluting the email box because there is an email generated and sent for each event.
Q9 Web conf.
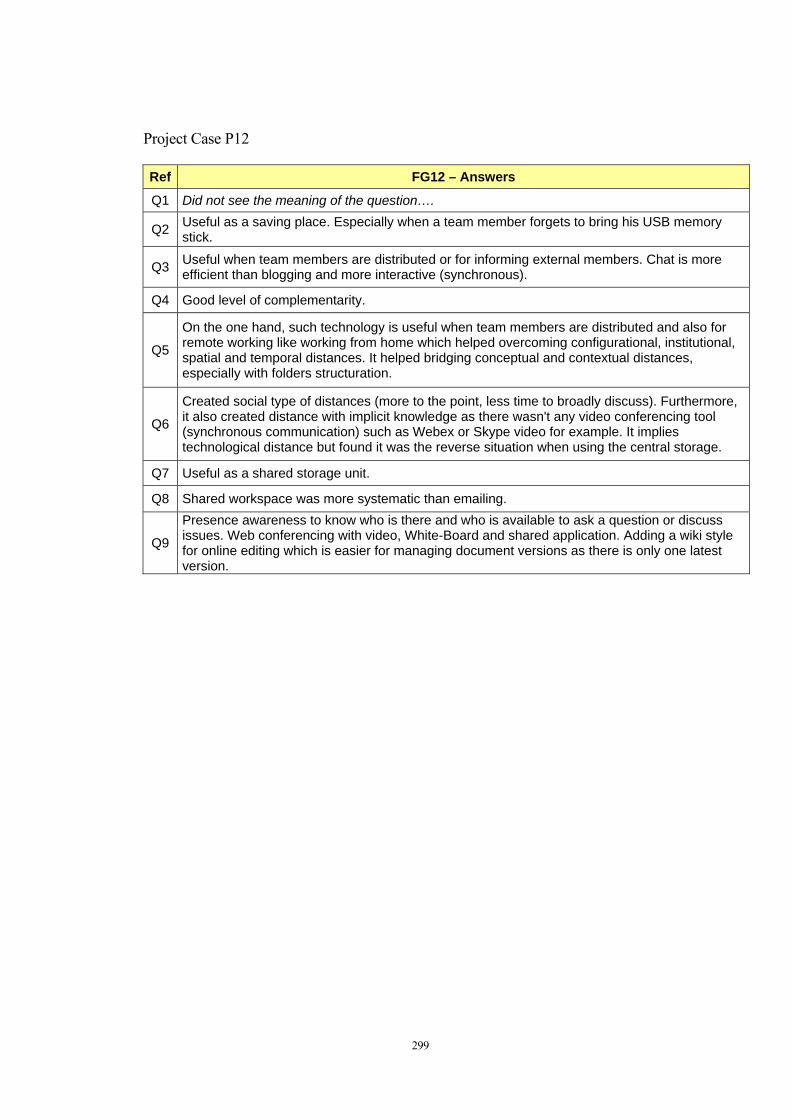
299
Project Case P12
Ref FG12 – Answers
Q1 Did not see the meaning of the question….
Q2 Useful as a saving place. Especially when a team member forgets to bring his USB memory stick.
Q3 Useful when team members are distributed or for informing external members. Chat is more efficient than blogging and more interactive (synchronous).
Q4 Good level of complementarity.
Q5
On the one hand, such technology is useful when team members are distributed and also for remote working like working from home which helped overcoming configurational, institutional, spatial and temporal distances. It helped bridging conceptual and contextual distances, especially with folders structuration.
Q6
Created social type of distances (more to the point, less time to broadly discuss). Furthermore, it also created distance with implicit knowledge as there wasn't any video conferencing tool (synchronous communication) such as Webex or Skype video for example. It implies technological distance but found it was the reverse situation when using the central storage.
Q7 Useful as a shared storage unit.
Q8 Shared workspace was more systematic than emailing.
Q9
Presence awareness to know who is there and who is available to ask a question or discuss issues. Web conferencing with video, White-Board and shared application. Adding a wiki style for online editing which is easier for managing document versions as there is only one latest version.

300
Project Case P13
Ref FG13 – Answers
Q1 Experiences are showing that mutual or common understanding is fundamental ingredient of collaboration. The project process modelling exercise through the use of IDEF0 has revealed this fact as well as sharing the same model.
Q2 Allows all group members to access the same information and documents. Reduce time spent for finalising a document where several participants have to contribute.
Q3
Group blogging appears to be a less formal way of communicating spontaneously which provides to the other participants a good idea about the cognitive situation and feelings of the author. It also allows drawing the attention of the project team members to some external resources through the provision of a short article and links.
Q4 Complementarity is quite obvious. Shared workspace for sharing documents and group blogging for sharing information and feelings as well as drawing the attention to external resources.
Q5
Experience has shown that such technology contributed to overcome most of the structural type of distances. However, spatial distance was partly compressed due to the lack of synchronous communication. Referential distance was also bridged in inserting URL in the folders and in blog entries.
Q6 Creates emotional distance which is not necessarily a bad point. In case of problem faced in the shared workspace then it is pushing to set-up a physical meeting.
Q7 Usefulness is also quite obvious and not questionable…only question is what happens when all project members are not using the same shared workspace tool.
Q8 They prefer to use a shared workspace for exchanging documents when a group is already set-up but still intensively use emailing when the group is less formal.
Q9 Would be necessary to improve the socio-ergonomic aspect. Mandatory is to have online editing capability, on demand notification, and second life style for creating competences spaces.

301
Project Case P14
Ref FG14 - Answers
Q1 Sharing documents is partly contributing to the sharing of knowledge as most of the sharing of information and knowledge is done via speech mode.
Q2 Useful for sharing with MRV group until tasks were complementary.
Q3 Useful for interaction with external participants.
Q4 Good complementarity between shared workspace and group blogging.
Q5
It was clear that this technology compressed temporal, organisational and spatial distance among team members. However, other distance types such as conceptual, referential and cultural were progressively less and less affecting the team effectiveness due to the use of a common vocabulary for structuring folders in the shared workspace and for URL as a kind of a new online culture of standardising concepts for avoiding cognitive load among team members.
Q6
As the duration was not so long, it is quite difficult for experimenting whether this technology really creates social type of distances (except for the emotional distance). In contrast, it was clear at the beginning of the project that depending on each participant's ICT skill then it was more or less easy to use, hence it was creating some kind of technological distance. This kind of distance was progressively not so present after using this tool for some time and even helped team cohesiveness through the emergence of a specific culture. There was also some concern with the customer regarding security issues with the use of a shared workspace as well as Intellectual Property Rights (IPR) that were related to ownership distance between the academic and industry approaches.
Q7 Useful for working with external participants. No creativity support.
Q8 Emailing is simpler to access though shared workspace allows seeing what others are producing.
Q9 Improve look and feel of the user interface. Provide a better feeling of team "family" like having a photo gallery.