palembang tanjung enim...introduction 1919 2 mar 1981 1990 23 dec 2002 during the dutch colonial...
TRANSCRIPT

www.ptba.co.id
Reuters: PTBA.JK Bloomberg: PTBA IJ Exchange: JKT Ticker: PTBA
Our Vision: To be “An Environmentally Conscious World Class Energy Company”
Corporate Presentation, NOVEMBER 2014
Palembang
Tanjung Enim
Lampung

1. Introduction2. Operational Review3. Commercial Review4. Financial Review5. Project Development
Appendices
Contents
01

Introduction
1919 2 Mar 1981
1990
23 Dec 2002
During the Dutch colonial period, the first open-pit
at Airlaya mine, in Tanjung Enim, South
Sumatera started operating.
PN TABA was converted into a limited corporation and its name changed to
PT Tambang Batubara Bukit Asam (PTBA). This
date is officially considered as the base of
the commemoration of the company’s
anniversary.
The company changed into an Indonesian state
owned company which was called “PN Tambang
Arang Bukit Asam” (TABA). PN is
abbreviation of Perusahaan Negara,
means “State Company”.
PTBA was publicly listed on the Jakarta Stock
Exchange with 35% of shares held by the public.
It traded with the initial stock price of IDR575 under the code PTBA.
Another state owned coal company, “Perusahaan
Umum Tambang batubara” merged with PT Bukit Asam (PTBA).
Since then, PTBA become the only state owned coal
mining in Indonesia.
Company’s Key Milestones
1950Coal Mine in Ombilin,
West Sumatera, started in operation.
1876
During the period 1991-1995, on the behalf of the Indonesian government, PTBA acted as the
domestic coal regulator for Coal Contract of Works (CCoW).
02
Indonesia’s Oldest and Most Experienced Coal Producer
Coal Business
Coal TradingPower
GenerationLogistic CBM GasSubsidiaries:

2009 2010 2011 2012 2013 2014 (F)
Sales Volume (Mn ton)
1.8
2.72.01
3.08 2.9
2009 2010 2011 2012 2013
Net Profit (IDR Trillion)
7.99.010.6
11.6
2009 2010 2011 2012 2013
Revenue (IDR Trillion)
2009 2010 2011 2012 2013 2014 (F)
Railway Capacity (Mn ton)17.9
10.5 10.8
12.5 12.911.5
13.5
FY13(A)a
FY14(F)b
%c=b/a
9M13d
9M14e
%f=e/d
SALES VOLUME (MT) 17.8 24.7 139% 13.2 13.2 100%
PRODUCTION (MT) 15.1 19.8 131% 10.9 12.5 115%
COAL PURCHASE (MT) 2.7 3.9 144% 2.3 1.4 61%
RAILWAY (MT) 12.8 17.9 140% 9.6 11.0 115%
REVENUES (IDR TN) 11.2 8.1 9.6 119%
NET PROFIT (IDR TN) 1.8 1.2 1.6 127%
11.9
17.8
15.312.8
Operational Highlights
Operational Review
03
24.7
11.2
50% 50%45%
60% 60%55% 55%
164.97
371.05533.4
523.12
803.56
720.75
461.97
0
200
400
600
800
1000
0%
20%
40%
60%
80%
2007 2008 2009 2010 2011 2012 2013
Dividend Payout RatioDividend per share (IDR)
Padang
Palembang
SamarindaPekan Baru
Tanjung EnimLampung
Jakarta
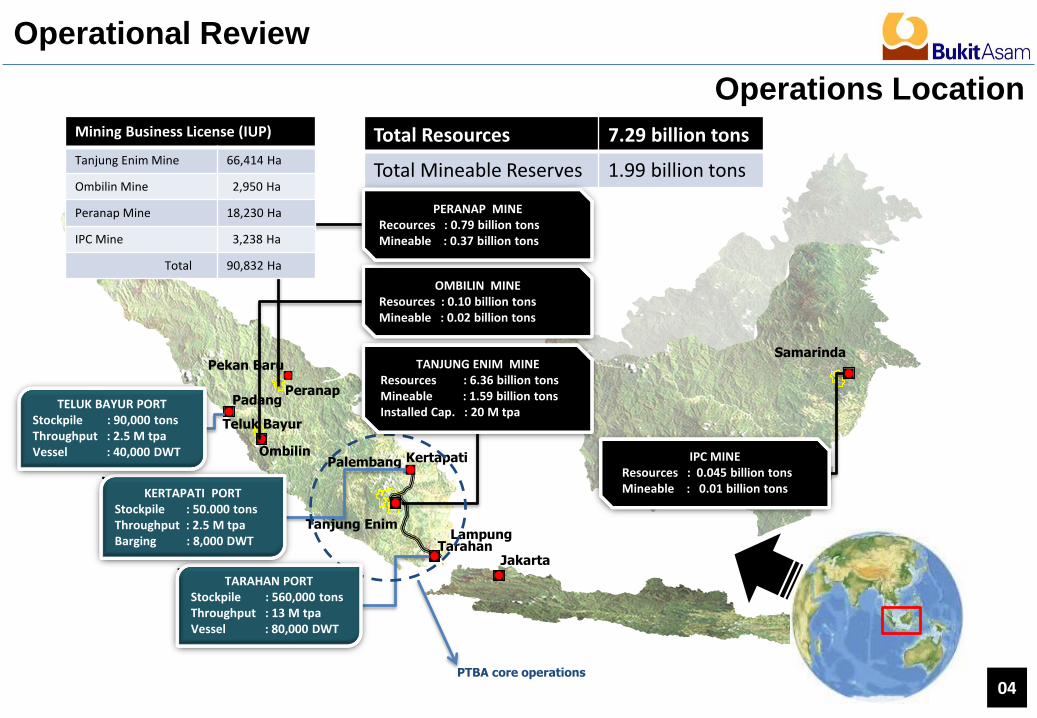
Total Resources 7.29 billion tons
Total Mineable Reserves 1.99 billion tons
Tarahan
KertapatiOmbilin
Teluk Bayur
Mining Business License (IUP)
Tanjung Enim Mine 66,414 Ha
Ombilin Mine 2,950 Ha
Peranap Mine 18,230 Ha
IPC Mine 3,238 Ha
Total 90,832 Ha
Peranap
PTBA core operations
Operations Location
Operational Review
TARAHAN PORTStockpile : 560,000 tonsThroughput : 13 M tpaVessel : 80,000 DWT
KERTAPATI PORTStockpile : 50.000 tonsThroughput : 2.5 M tpaBarging : 8,000 DWT
TELUK BAYUR PORTStockpile : 90,000 tonsThroughput : 2.5 M tpaVessel : 40,000 DWT IPC MINE
Resources : 0.045 billion tonsMineable : 0.01 billion tons
OMBILIN MINEResources : 0.10 billion tonsMineable : 0.02 billion tons
TANJUNG ENIM MINEResources : 6.36 billion tonsMineable : 1.59 billion tonsInstalled Cap. : 20 M tpa
PERANAP MINERecources : 0.79 billion tonsMineable : 0.37 billion tons
04

Parameter BITUMINOUS SUB BITUMINOUS LIGNITE
TM (% ar) < 18 18 -30 > 35
CV (KCal/Kg adb) > 6,400 4,900 – 6,400 < 4,900
(KCal/Kg ar) 5,800 – 7,950 4,400 – 5,800 < 4,400
0.20 bn tons
3.58 bn tons
0.68 bn tons
1.25 bn tons
0.06 bn tons
3.51 bn tons
Resources & Reserves
Operational Review
05
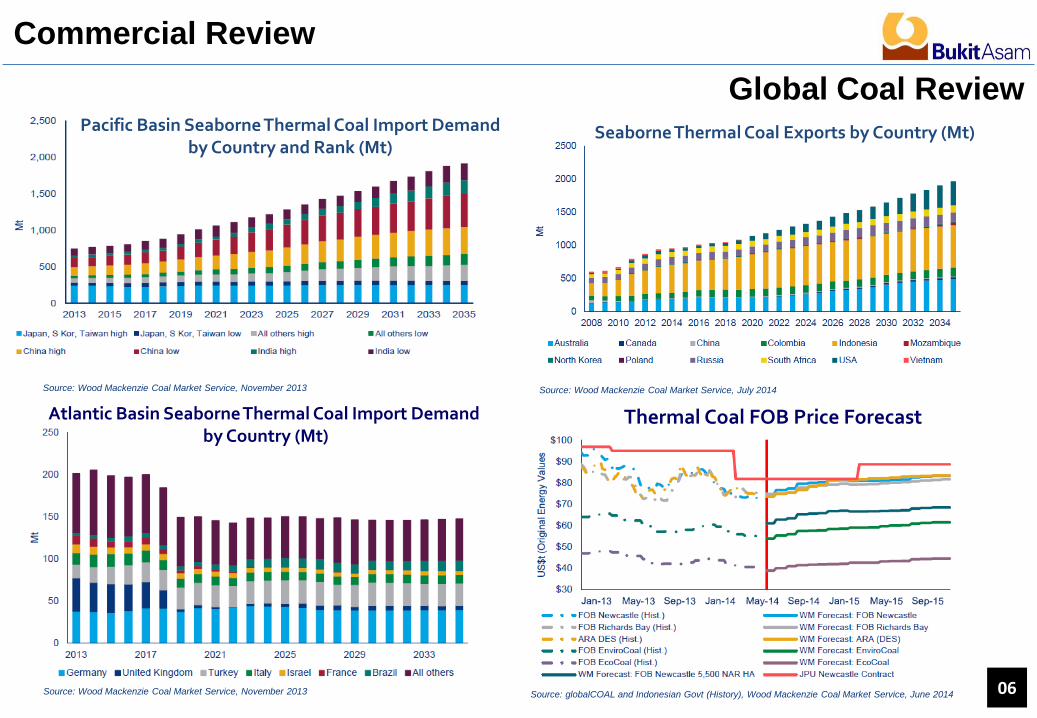
Source: Wood Mackenzie Coal Market Service, November 2013 Source: Wood Mackenzie Coal Market Service, July 2014
Source: Wood Mackenzie Coal Market Service, November 2013
Global Coal Review
Commercial Review
06
Atlantic Basin Seaborne Thermal Coal Import Demand by Country (Mt)
Pacific Basin Seaborne Thermal Coal Import Demandby Country and Rank (Mt)
Source: globalCOAL and Indonesian Govt (History), Wood Mackenzie Coal Market Service, June 2014
Thermal Coal FOB Price Forecast
Seaborne Thermal Coal Exports by Country (Mt)

Indonesian Domestic Demand Vs Exports (Mt)
Coal Consumption Guidance for Electricity
Primary Energy Mix (%)
Source : PLN, 2014
Source: Agency For The Assessment And Application Of Technology, Dec 2013
Fuel Mix 2005-2021 : For Power Generation
Source : PLN, 2014
National Coal Review
Commercial Review
07
Source: Wood Mackenzie Coal Market Service, November 2013

Total Cash Cost (FOB)
Weighted Average Strip Ratio
9M14 Total Cost Breakdown
*) Note: Total cash cost include COGS,G&A, Selling Expenses, Inventory
3.6 3.5 4.2 4.0
4.4 4.4
2009 2010 2011 2012 2013 2014 (f)
Tanjung Enim System *)9M13 9M14 YoY
Ex Royalty (IDR) 556,121 584,281 +5%
Total (IDR) 598,033 630,544 +5%
FY13 9M13 9M14 YoY
Weighted ASP (IDR/Ton) 631,145 612,046 728,079 +19%
Export (USD/Ton) 74.33 76.25 71.11 -7%
Domestic (IDR/Ton) 582,581 585,800 671,426 +15%
Average Selling Price (ASP)
Costs & Prices
Financial Review
08
4.4 4.5
0123456
9M13 9M14
Salaries & Wages; 12%
Fuel; 1%
Heavy Equipment; 4%
Electricity; 1% Coal Purchase; 8%Mining Service;
31%
Railway Service; 24%
Royalty; 7%
Spareparts; 2%
Depreciation & Amortisation; 2%
Sales Expenses; 3%
Adm & Gen Expenses; 4%
Others; 2%

Domestic50.47%
Cambodia0.21%
Japan5.11%
Malaysia8.99%
India10.07%
Taiwan17.11%
China4.04%
Vietnam3.42%
Sri Lanka0.58%
9M14 Sales Breakdown by Quality
Coal BrandCV TM IM Ash VM FC TS max
HGIKcal/Kg,adb Kcal/Kg,ar %,ar %,adb %,adb %,adb %,adb %,adb
IPC 53 5,300 - 34 15 8 39 40 0.5 -
BA 55 5,500 4,550 30 15 8 39 38 0.8 50
BA 59 5,900 5,000 28 14 6 39 40 0.6 50
BA 61 6,100 5,000 28 12 7 41 40 0.8 50
BA 63 6,300 5,550 21 10 6 41 43 0.8 55
BA 67 6,700 6,100 16 8 6 42 44 0.8 55
BA 70 LS 7,000 6,450 14 7 4 42 47 0.7 55
BA 70 HS 7,000 6,450 14 7 4 42 47 1.2 55
BA 76 7,600 7,400 5 2 8 14 76 1.2 -
9M14 Sales Breakdown by country
Coal Brand & Sales Breakdown
Financial Review
09
Type Of Coal by Quality
Total: 6.68Mt Total: 6.56Mt Total: 13.24Mt
4.36%19.62%
11.92%
55.38%9.10%
32.46%
37.56%
18.96%
1.36%
44.31%
22.63%
0.89%
0.64%
0.76%0.45%
26.33%13.27%
0%
20%
40%
60%
80%
100%
Domestic Export Total
BA55 BA59 BA61 BA63 BA67 BA70

2008 2009 2010 2011 2012 2013 2008 2009 2010 2011 2012 20132008 2009 2010 2011 2012 2013
2% 11% 15% 8% 12% 30% 1% 15% 28% 20% 11% 39% 12% 29% 18% 14% 14% 36%
GROSS PROFIT MARGIN (%) OPERATING PROFIT MARGIN (%) NET PROFIT MARGIN (%)
48.9
54.1
46.2
50
44
35
29.1
39.7
34.6
31
2529
25.4
30.5
23.7
Financial Ratios
Financial Review
10
19 1631
1819
9M13 9M14
2932
9M13 9M14
1516
9M13 9M14

PTBA Versus Global & Local Peers
Financial Review
11
33%
16.959
22%
7.954
17%
-0.692
YZC ACI BYAN BTU BUMI ITMG HRUM BRAU ADRO PTBA AVERAGE
GROSS_MARGIN OPER_MARGIN NET_MARGIN
YZC :Yanzhou Coal Mining
ACI : Arch Coal Inc. – USA (NYSE)
ADRO : PT Adaro Energi – IDX HRUM : PT Harum Energi – IDX
BRAU : PT Berau coal – IDX ITMG : PT Indo Tambangraya Megah – IDX
BTU : Peabody Energy Corp. – USA (NYSE) PTBA : PT Bukit Asam – IDX
BUMI : PT Bumi Resources – IDX
BYAN : PT Bayan Resources – IDX
Source: Bloomberg, 14 October 2014

FY13 9M13 9M14 YoY
Sales 11.209 8.104 9.638 119%
COGS 7.745 5.738 6.589 115%
EBITDA 2.530 1.746 2.241 128%
Net Income 1.826 1.243 1.582 127%
Assets 11.677 11.372 14.049 124%
Cash 3.343 3.266 4.436 136%
Net Margin 16% 15% 16% 107%
Return On Asset 16% 11% 11% 100%
Return On Equity 24% 19% 19% 100%
Return On Investment 21% 18% 18% 100%
Summary Financial Performance
Financial Review
12
(IDR Tn)

Kertapati Palembang
Prabumulih
Muara Enim
Baturaja
Tarahan Lampung
Lahat
TANJUNG ENIM MINEBarging Port
Tarahan Port Expansion- Capacity: From 13.0 to 25.0 Mtpa- Expect. COD : 2014
Ship loading Port
Infrastructures Expansion
Railway (Upgraded)- Capacity : up to 22.7 M tpa- TE – Kertapati : 160.9 Km- TE – Tarahan : 409.5 Km- Expect. COD : 2015
Railway Project (New) - BATR- Capacity : 25.0 M tpa- Distance : 280 Km- Expect. COD : 2018
13
Double Tracks
Single Track with Crossing Sections
Tarahan Port become the largestCoal Terminal on Sumatera since it can accomodate “Capesize” bulkcarrier vessels of upto 210,000DWT. It is fully owned and operated by PTBA
Tanjung Enim Mine with the installed production capacity of 25 Mtpa

Power Plants Projects
2x620MW Power Plant - Location : Central Banko- Coal Cons. : 5.4 M tpa- COD : 2017
3x10MW Power Plant - Usage : Internal Mine Sites- Coal Cons. : 0.15 M tpa- In Operation since Oct 2012
4x65MW Power Plant - Location : Tanjung Enim- Coal Cons. : 1.4 M tpa- In Operation since 1987
2x8MW Power Plant - Usage : Internal Port Sites- Coal Cons. : 0.10 M tpa- In Operation since Dec 2013
14
2x110MW Power Plant - Location : Banjarsari- Coal Cons. : 1.4 M tpa- COD : 2014
3x600MW Sumsel 9&10 PP- Location : Muara Enim- Coal Cons. : 8.4 M tpa- COD : 2018
800-1200MW Power Plant - Location : Peranap Riau- Coal Cons. : 8.4 M tpa- COD : 2018
Palembang
Tanjung Enim
Riau
Existing Projects
Tender / Cooperation Process

Project Development
Production Infrastructure & CBM Projects
15
Project Status
Upgraded ExistingRailway Line
• Tanjung Enim – Tarahan Port (410km), TE – Kertapati Port (161km)• 100% owned by State Railway Company, PT KAI• Capacity of 22.7Mtpa (2015 – 2029)• Currently, it has a total of 3,071 wagons, included 600 new wagons that arrived in April
2014.
BATR – Newly Developed Railway (Bukit Asam Transpacific Railway)
• Tanjung Enim – New Coal Terminal in Lampung (280km)• PTBA (10%), Rajawali Asia Resources (80%), China Railway EC (10%)• Investment of USD2 Bn, EPC Contract of USD1.3 Bn• 18 Nov 2011, Frame Work Agreement funding with China Bank Consortium was signed.• Currently in finalization for mining JV Restructuring• Project will reach its peak capacity of 25 Mtpa by
• Year 1 7.5 Mt• Year 2 15.0 Mt• Year 3 20.0 Mt• Year 4 25.0 Mt
Tarahan Port Expansion • Located at the southern tip of Sumatera Island• Newly developed infrastructures for RCD3 & RCD4, Jetty #2 & Shiploader, Additional
stockpile of 2x150,000Mt, and Office.• By 4Q14, will be in operation with the new Jetty #2 is able to accomodate the giant
‘Capesize‘ bulkcarrier vessels of upto 210,000DWT.• Will be the largest coal terminal on Sumatera
Coal Bed Methane (CBM)
• Located in Tanjung Enim Mine• PTBA (27.5%), Pertamina (27.5%), Dart Energy Australia (45%)• ±40 MMSCF (Million Standard Cubic Feet per Day, with potential reserve of 0.8 Trillion
Cubic Feet (TCF)• Investment of USD14.48 Mn (for the first three years)

Project Development
Power Generation Projects
16
The Plant Status
2x110MW Banjarsari PowerPlant
• PTBA (59.75%), PJB (29.15%), NII (11.10)• Investment of USD320 Mn• Coal Consumption: 1.4 M tpa• Estimated Commercial Date: 4Q14
2x620MW Banko Tengah Plant
• PTBA (45%), China Huadian Hong Kong Company Ltd (55%)• Investment of USD1.6 Bn• Coal Consumption: 5.4 M tpa• PPA signed in September 2012• Currently in the process of Financial Closure • Estimated Commercial Date: 2018
800-1200MW Peranap Power Plant
• PTBA (Majority in Mining), PLN (Majority in Power Plant), TNB (Majority in Transmission)
• Investment of USD1.8 Bn• Coal Consumption: up to 8.4 M tpa• Currently in the process of preparation for the FS of power plant & transmission• Estimated Commercial Date: 2018
3x10MW Power Plant for internal use
• Located at Tanjung Enim Mine• Investment of USD42 Mn• Coal consumption: 0.15 Mtpa• In operation since October 2012
2x8MW Power Plant for internal use
• Located at Tarahan Port• Investment of USD29.12 Mn• Coal consumption: 0.10 Mtpa• In operation since December 2013
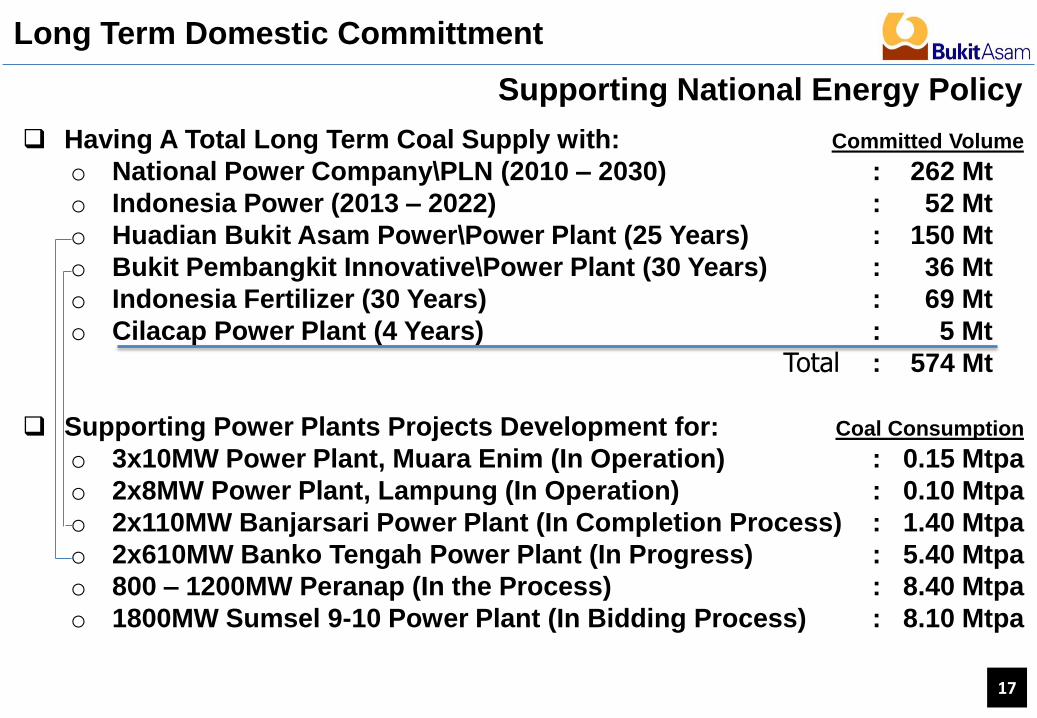
Having A Total Long Term Coal Supply with: Committed Volume
o National Power Company\PLN (2010 – 2030) : 262 Mt
o Indonesia Power (2013 – 2022) : 52 Mt
o Huadian Bukit Asam Power\Power Plant (25 Years) : 150 Mt
o Bukit Pembangkit Innovative\Power Plant (30 Years) : 36 Mt
o Indonesia Fertilizer (30 Years) : 69 Mt
o Cilacap Power Plant (4 Years) : 5 Mt
Total : 574 Mt
Supporting Power Plants Projects Development for: Coal Consumption
o 3x10MW Power Plant, Muara Enim (In Operation) : 0.15 Mtpa
o 2x8MW Power Plant, Lampung (In Operation) : 0.10 Mtpa
o 2x110MW Banjarsari Power Plant (In Completion Process) : 1.40 Mtpa
o 2x610MW Banko Tengah Power Plant (In Progress) : 5.40 Mtpa
o 800 – 1200MW Peranap (In the Process) : 8.40 Mtpa
o 1800MW Sumsel 9-10 Power Plant (In Bidding Process) : 8.10 Mtpa
Long Term Domestic Committment
Supporting National Energy Policy
17

(est operation August 2013)
Note: TOTAL STOCKPILE will be 860,000 tons Stockpile 1 = 60,000 tons Stockpile 4a = 150,000 tonsStockpile 2 = 250,000 tons Stockpile 4b = 150,000 tonsStockpile 3 = 250,000 tons
The New Look of Tarahan Port in 4Q 2014
Appendix
18

PTBA
Coal Trading Power Logistic Gas
• Bukit Kendi (75%), coal mining, South Sumatera
• International Prima Coal (51%), East Kalimantan
• Bukit Asam Banko(65%), South Sumatera
• Bukit Asam Prima (99.99%)
• Bukit PembangkitInnovative (59.75%)
• Huadian Bukit Asam Power (45%)
• Bukit AsamTranspacific Railway (10%)
• Bukit Asam MetanaEnim (99.99%)
• Bukit Asam MetanaOmbilin (99.99%)
• Bukit Asam MetanaPeranap (99.99%)
The Indonesian Government owns 65% of Total Shares
PTBA Structure
The Subsidiaries:
PTBA operates a fully integrated large coal mining in Tanjung Enim (
South Sumatera), Ombilin (West Sumatera), Peranap (Riau), and East
Kalimantan with Total Resources & Reserves are 7.29 billion tons and
1.99 billion tons respectively
Appendix
19

Shareholders InformationThe Top Thirty Shareholders of PTBA ended 30 September 2014
Source: Datindo, 07 October 2014
Note: Total outstanding shares of 2,304,131,850
Appendix
20
Government; 65.02%Foreign; 13.20%
Domestic; 16.14%
Treasury Stock; 5.64%
Share Holders Breakdown
NO Shareholders Number %
1 NEGARA REPUBLIK INDONESIA 1,498,087,500 65.02
2 TAMBANG BATU BARA BUKIT ASAM (PERSERO), 129,997,500 5.64
3 BPJS KETENAGAKERJAAN-JHT 53,376,000 2.32
4 PT TASPEN (PERSERO) - THT 35,516,000 1.54
5 PEMERINTAH PROPINSI SUMATERA SELATAN 21,315,000 0.93
6 BBH BOSTON S/A VANGRD EMG MKTS STK INFD 16,558,825 0.72
7 PT AIA FINL - UL EQUITY 16,495,200 0.72
8 BBH LUXEMBOURG S/A FIDELITY FD SICAV-FID 14,548,100 0.63
9 BPJS KETENAGAKERJAAN - JKK 10,888,000 0.47
10 JP MORGAN CHASE BANK RE ABU DHABI INVEST 9,951,829 0.43
11 PT PRUDENTIAL LIFE ASSURANCE-REF 9,153,000 0.40
12 PAMAPERSADA NUSANTARA, PT 9,000,000 0.39
13 BPJS KETENAGAKERJAAN - BPJS 8,529,900 0.37
14 PEMERINTAH DAERAH KABUPATEN MUARA ENIM 6,946,000 0.30
15 SSB TRLD SSL C/O SSB, BOSTON TRILOGY INV 6,456,644 0.28
16 SSB OBIH S/A ISHARES MSCI EMERGING MARKE 6,452,100 0.28
17 SSB 1BA9 ACF MSCI EQUITY INDEX FUND B-IN 6,164,500 0.27
18 SSB WTAS S/A WISDOMTREE EMERGING MRKTS E 5,884,700 0.26
19 ASURANSI JIWA MANULIFE INDONESIA, PT-494 5,775,800 0.25
20 SSB C021 ACF COLLEGE RETIREMENT EQUITIES 5,670,727 0.25
21 CITIBANK NEW YORK S/A EMERGING MARKETS C 5,453,900 0.24
22 REKSA DANA SCHRODER DANA PRESTASI DINAMI 5,427,400 0.24
23 THE NT TST CO S/A DRIEHAUS EMERGING MKTS 5,333,900 0.23
24 JPMCB-VANGUARD TOTAL INTERNTNL STOCK IND 4,889,100 0.21
25 REKSA DANA ASHMORE DANA PROGRESIF NUSANT 4,885,000 0.21
26 JPMCB-STICHTING DEPOSITARY APG EME MRKT 4,467,000 0.19
27 BNYM SA/EASTSPRING INVESTMENTS-204008408 4,279,100 0.19
28 SSLUX G56K S/A GOLDMAN SACHS FD - 214461 3,617,000 0.16
29 BNYM S/A FLORIDA RETIREMENT SYSTEM-20399 3,574,114 0.16
30 SSB 0BGF S/A ISHARES MSCI INDONESIA ETF- 3,501,550 0.15

Appendix
9.59.8 9.9 9.6 9.9
10.8
12.7 12.4
12.913.4
15.3
17.8
9.5
10.0
9.5 9.1
9.2 9.2
10.8 11.6
12.5 12.9
13.9
15.1
2002 2003 2004 2005 2006 2007 2008 2009 2010 2011 2012 2013Sales Production
0.17 0.21 0.41 0.46 0.48 0.72
1.70
2.72 2.00
3.08 2.90
1.82 2.16 2.28
2.61 2.99
3.53 4.12
7.21
8.94
7.90
10.58
11.59 11.20
2002 2003 2004 2005 2006 2007 2008 2009 2010 2011 2012 2013Net Income Revenues
PTBA Production Vs Sales 2002 - 2013
PTBA Revenues Vs Net Income 2002 - 2013 Coal Price Indexes Dec’02 – Oct’14 (USD/t)
21
15.00
30.00
45.00
60.00
75.00
90.00
105.00
120.00
135.00
150.00
165.00
180.00
195.00
NEX Index JPU Index ICRP Index
Index Movement Dec’02 – Oct’14
0
2500
5000
7500
10000
12500
15000
17500
20000
22500
25000
27500
0
500
1000
1500
2000
2500
3000
3500
4000
4500
5000
5500
6000
Jakmine IHSG PTBA

Projected Sales Volume to 2017
Appendix
12.4 12.9 13.415.3
17.820.0
25.0
30.0
35.0
2009(A) 2010(A) 2011(A) 2012 (A) 2013(A) 2014(F) 2015(F) 2016(F) 2017(F)
TE System Production Total Sales Railways Transportation
In Million Ton
22
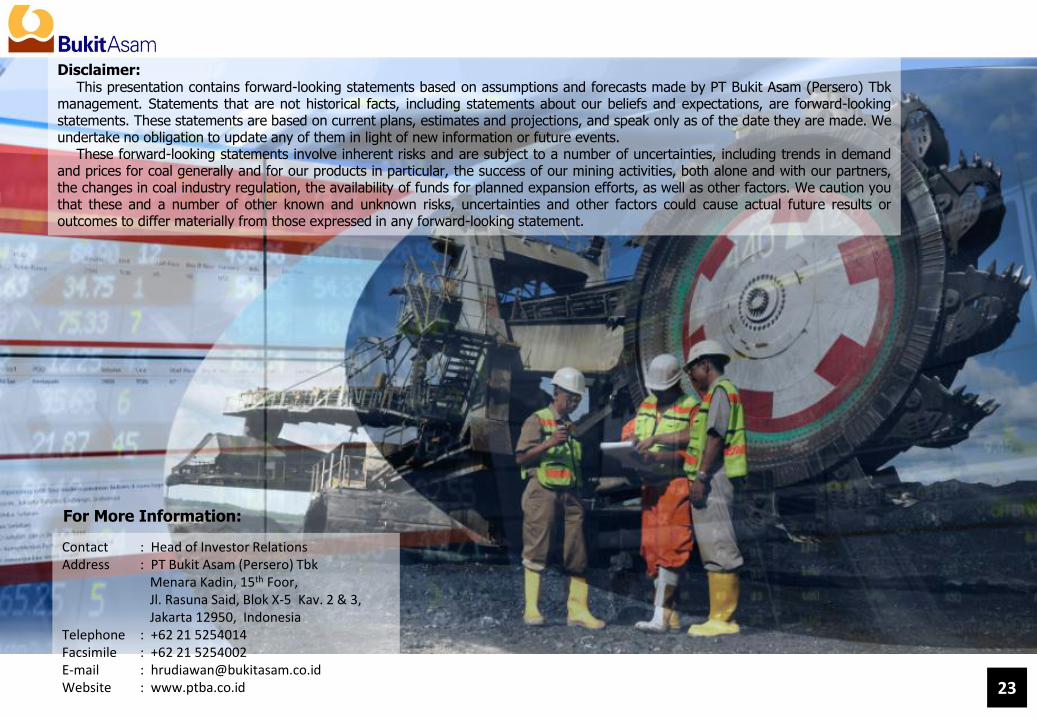
Contact : Head of Investor RelationsAddress : PT Bukit Asam (Persero) Tbk
Menara Kadin, 15th Foor, Jl. Rasuna Said, Blok X-5 Kav. 2 & 3, Jakarta 12950, Indonesia
Telephone : +62 21 5254014Facsimile : +62 21 5254002E-mail : [email protected] : www.ptba.co.id
Disclaimer:This presentation contains forward-looking statements based on assumptions and forecasts made by PT Bukit Asam (Persero) Tbk
management. Statements that are not historical facts, including statements about our beliefs and expectations, are forward-lookingstatements. These statements are based on current plans, estimates and projections, and speak only as of the date they are made. Weundertake no obligation to update any of them in light of new information or future events.
These forward-looking statements involve inherent risks and are subject to a number of uncertainties, including trends in demandand prices for coal generally and for our products in particular, the success of our mining activities, both alone and with our partners,the changes in coal industry regulation, the availability of funds for planned expansion efforts, as well as other factors. We caution youthat these and a number of other known and unknown risks, uncertainties and other factors could cause actual future results oroutcomes to differ materially from those expressed in any forward-looking statement.
For More Information:
23