pal latex software
DESCRIPTION
latex software related notes louding for the preiod of theTRANSCRIPT

Multimodal Person Authentication using
Speech, Face and Visual Speech
S. Palanivel ∗, B. Yegnanarayana
Speech and Vision Laboratory, Department of Computer Science and Engineering,Indian Institute of Technology Madras, Chennai-600 036, India.
Abstract
This paper presents a method for automatic multimodal person authentication us-
ing speech, face and visual speech modalities. The proposed method uses the motion
information to localize the face region, and the face region is processed in Y CrCb
color space to determine the locations of the eyes. The system models the nonlip
region of the face using a Gaussian distribution, and it is used to estimate the cen-
ter of the mouth. Facial and visual speech features are extracted using multiscale
morphological erosion and dilation operations, respectively. The facial features are
extracted relative to the locations of the eyes, and visual speech features are ex-
tracted relative to the locations of the eyes and mouth. Acoustic features are derived
from the speech signal, and are represented by weighted linear prediction cepstral
coefficients (WLPCC). Autoassociative neural network (AANN) models are used
to capture the distribution of the extracted acoustic, facial and visual speech fea-
tures. The evidence from speech, face and visual speech models are combined using
a weighting rule, and the result is used to accept or reject the identity claim of the
subject. The performance of the system is evaluated for newsreaders in TV broad-
cast news data, and the system achieves an equal error rate (EER) of about 0.45%
for 50 subjects.
Key words: Multimodal person authentication, face tracking, eye location, visual
speech, multiscale morphological dilation and erosion, autoassociative neural
network.
Preprint submitted to Elsevier Science 31 October 2006
1 Introduction
Automatic person recognition by machine appears to be difficult, while it is
done effortlessly by human beings. The main reason for this difficulty is that
it is difficult to articulate the mechanism humans use. Person recognition can
be categorized into person identification and authentication. The objective of
a person identification system is to determine the identity of a test subject
from the set of reference subjects. The performance of the person identification
system is quantified in terms of identification rate or recognition rate. On the
other hand, a person authentication system should accept or reject the identity
claim of a subject, and the performance is measured in terms of equal error
rate (EER). Person authentication systems make use of one or more biometric
modalities such as speech, face, fingerprint, signature, iris and hand geometry
to accept or reject the identity claim of an individual. In this paper, speech,
face and visual speech modalities are used for person authentication. The terms
acoustic, facial and visual speech features refer to the features extracted from
the speech, face and mouth image of the person, respectively.
1.1 Related work
A comprehensive survey of still and video-based face recognition techniques
can be found in [1], and a survey of speech-based bimodal speaker recognizers
is given in [2]. The mel frequency cepstral coefficients (MFCC) and weighted
linear prediction cepstral coefficients (WLPCC) are commonly used as acoustic
∗ Corresponding author. Tel.: +91-44-22578356; fax: +91-44-22578352.
Email addresses: [email protected] (S. Palanivel),
[email protected] (B. Yegnanarayana).
2
features [3]. Several techniques have been proposed in the literature for still-
image-based face recognition such as principal component or eigenface analysis
(PCA) [4], linear discriminant analysis (LDA) [5], [6], independent component
analysis (ICA) [7], elastic graph matching [8], [9], line edge map [10], support
vector machine (SVM) [11], [12] and correlation filter [13]. Most of the video-
based face recognition methods apply still-image-based recognition to selected
frames [1]. The radial basis function neural network (RBFNN) [14], proba-
bilistic modeling [15] and hidden Markov model (HMM) [16] are also used for
video-based face recognition. Audio-video based person authentication meth-
ods use either speech and face modalities [17], [18], [19], [20] or speech and
visual speech modalities [21], [22], [23]. The visual speech features such as
discrete cosine transform (DCT) of the lip region [22], eigenlips [21], [23] are
commonly used to represent the mouth image.
The video-based face recognition system called PersonSpotter described in [24]
used elastic graph matching technique. A recognition rate of about 90.0% was
reported (the size of the database is not known). A recent method proposed
in [15] used probalistic modeling of intensity values of the images, and a recog-
nition performance of about 98.0% was reported using the MoBo database [25]
having 25 subjects. The method described in [16] used PCA and HMM, and
it reported 98.8% recognition rate for the MoBo database.
The text-independent audio-video based person recognition system described
in [17] used HMM for modeling the acoustic features (mel-scaled frequency
coefficients) and eigenface for modeling the face image intensity values. The
Bayes Net was used to combine the modalities. The performance was evaluated
for 26 subjects, and the method reported 80.0%, 88.4% and 100.0% recogni-
tion rate for speech, face and combined modalities, respectively. The method
3

described in [18] used GMM for modeling the cepstral feature vectors. The
Gabor filter response at 29 features in the face was used for face recognition.
The weighted sum rule was used to combine the modalities. The performance
was reported for TV broadcast news data (CNN) corresponding to 76 sub-
jects. Recognition performance of 92.9%, 63.6% and 92.2% was reported for
speech, face and combined modalities.
The text-independent audio-video based person recognition method described
in [19] used GMM for modeling the acoustic features (MFCC) and eigenface
for face verification. The modalities were combined using a weighted rule. The
performance was evaluated for 35 subjects with 8 impostors using VidTIMIT
database [26], and the method reported a total error (false acceptance rate +
false rejection rate) of about 24.0%, 13.0% and 6.0% for acoustic, facial and
combined modalities, respectively.
The text-dependent audio-video based person identification system described
in [20] used speaker-dependent speech recognizers to model each speaker, and
SVM was used for face recognition. The linear weighted summation was used
for combining the modalities. The performance was evaluated for 25 authen-
tic and 20 impostor subjects, and method reported 1.63%, 2.57% and 0.15%
EER for speech, face and combined modalities, respectively. A text-dependent
acoustic-labial speaker verification system described in [21] used HMM for
acoustic and labial speaker verification. The shape of the lip contour and
intensity features (PCA) were used as visual speech features and linear pre-
diction cepstral coefficients were used as acoustic features. The weighted sum
rule was used to combine the modalities. The performance was evaluated for
37 subjects in the M2VTS database [27]. The method reported a recogni-
tion rate of 97.2%, 72.2% and 100.0% for speech, visual speech and combined
4

modalities.
A text-dependent audio-visual speaker recognition method proposed in [22]
used MFCC as acoustic features and DCT of mouth region as visual speech
features. The speaker modeling was based on GMM and the weighted rule was
used for combining the modalities. The method reported a recognition rate
of 98.0%, 89.1% and 98.9% for speech, visual speech and combined modali-
tites. Audio-visual speaker recognition system described in [23] used MFCC
and eigenspace of lip images for verification. Bayesian classifier was used for
combining the modalities. The performance was evaluated for 31 subjects, and
the method reported an EER of 2.99%, 20.21% and 2.58% for speech, visual
speech and combined modalities.
1.2 Outline of the work
Most of the existing person authentication methods assume the availability of
cropped face images, and hence the issues such as face and eye localization,
size of the face, face position in the image and its background, orientation
and pose of the face are not addressed. The method proposed in this paper
addresses these issues and it satisfies the following requirements for a person
authentication technique:
(1) Invariant to size of the face, its position in the image and its background.
(2) Invariant to orientation and pose of the face to some extent.
(3) A subject can be enrolled into the system without using the features of
other subjects (discriminating information is not used). Similarly, other
subject models or scores are not used for authentication.
5
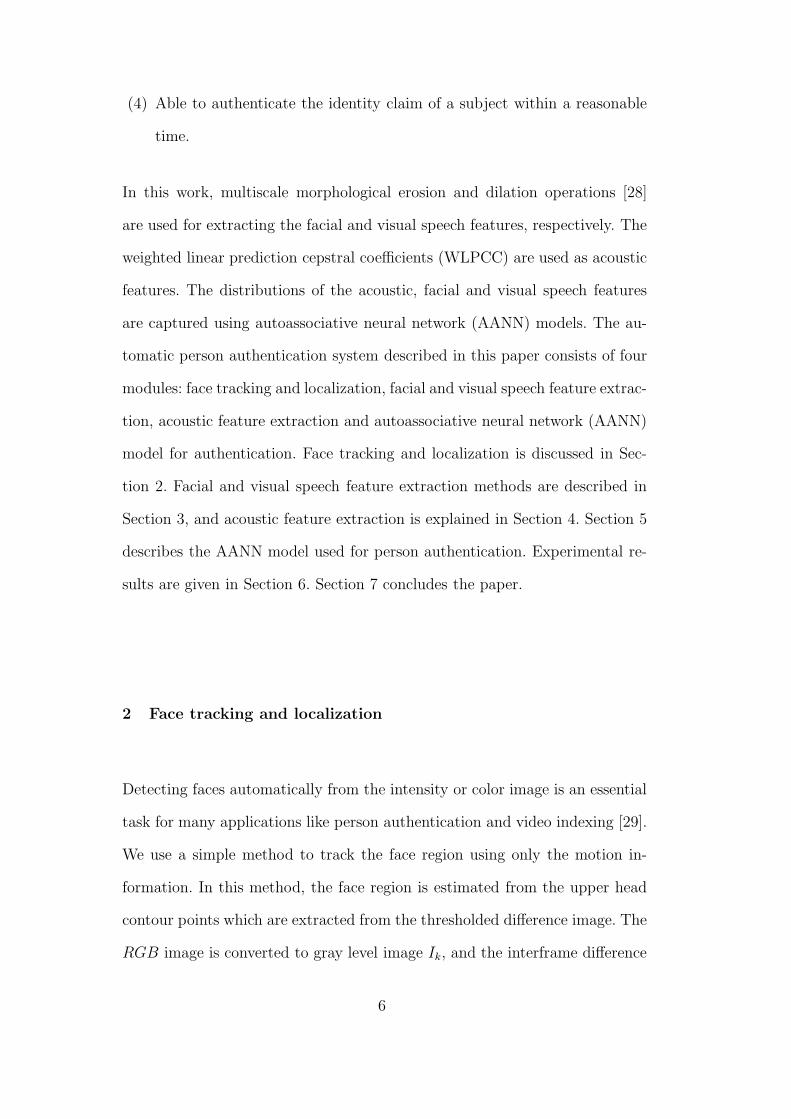
(4) Able to authenticate the identity claim of a subject within a reasonable
time.
In this work, multiscale morphological erosion and dilation operations [28]
are used for extracting the facial and visual speech features, respectively. The
weighted linear prediction cepstral coefficients (WLPCC) are used as acoustic
features. The distributions of the acoustic, facial and visual speech features
are captured using autoassociative neural network (AANN) models. The au-
tomatic person authentication system described in this paper consists of four
modules: face tracking and localization, facial and visual speech feature extrac-
tion, acoustic feature extraction and autoassociative neural network (AANN)
model for authentication. Face tracking and localization is discussed in Sec-
tion 2. Facial and visual speech feature extraction methods are described in
Section 3, and acoustic feature extraction is explained in Section 4. Section 5
describes the AANN model used for person authentication. Experimental re-
sults are given in Section 6. Section 7 concludes the paper.
2 Face tracking and localization
Detecting faces automatically from the intensity or color image is an essential
task for many applications like person authentication and video indexing [29].
We use a simple method to track the face region using only the motion in-
formation. In this method, the face region is estimated from the upper head
contour points which are extracted from the thresholded difference image. The
RGB image is converted to gray level image Ik, and the interframe difference
6

image Dk is obtained by
Dk(i, j) = |Ik(i, j) − Ik+1(i, j)| 1 ≤ i ≤ w, 1 ≤ j ≤ h, 1 ≤ k ≤ m (1)
where m is the number of frames in the video, w and h are the width and height
of the image, respectively. The thresholded difference image Tk is calculated
using
Tk(i, j) =
1, if Dk(i, j) > t
0, otherwise
(2)
where t is the threshold, which is the smallest integer such that Tk(i, j) = 0,
for all i and j, whenever there is no moving region in the camera view.
The thresholded difference image is scanned from top to bottom to find out
an approximate top center pixel (cx, cy) of the moving region. The scanning
process first computes the top most line cy of the moving region and then it
estimate the cx. The head contour points from the pixel (cx, cy) to the left
ear are extracted by scanning the thresholded difference image from the pixel
(cx, cy). The algorithm is given in Table 1. Similarly, the head contour points
from the pixel (cx, cy) to the right ear are extracted. The width of the face (w1)
is determined from the head contour points, and the face region is estimated
using w1 and (cx, cy). Fig. 1(a) shows the thresholded difference image and
Fig. 1(b) shows the extracted head contour points and the face region. This
process is repeated for every two consecutive frames in order to track the face
in the video. The method tracks a single face, and it assumes that there is no
other moving region in the background.
In the case of Indian newsreaders, motion information between successive
7
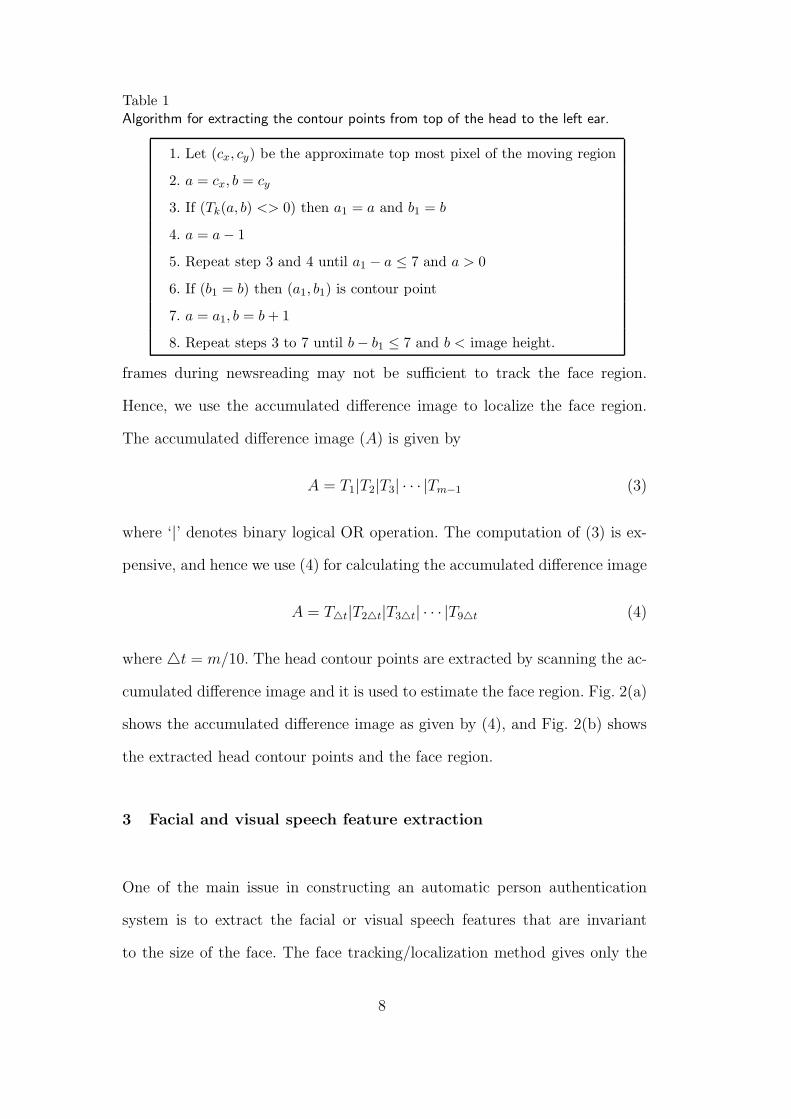
Table 1Algorithm for extracting the contour points from top of the head to the left ear.
1. Let (cx, cy) be the approximate top most pixel of the moving region
2. a = cx, b = cy
3. If (Tk(a, b) <> 0) then a1 = a and b1 = b
4. a = a − 1
5. Repeat step 3 and 4 until a1 − a ≤ 7 and a > 0
6. If (b1 = b) then (a1, b1) is contour point
7. a = a1, b = b + 1
8. Repeat steps 3 to 7 until b − b1 ≤ 7 and b < image height.
frames during newsreading may not be sufficient to track the face region.
Hence, we use the accumulated difference image to localize the face region.
The accumulated difference image (A) is given by
A = T1|T2|T3| · · · |Tm−1 (3)
where ‘|’ denotes binary logical OR operation. The computation of (3) is ex-
pensive, and hence we use (4) for calculating the accumulated difference image
A = T△t|T2△t|T3△t| · · · |T9△t (4)
where △t = m/10. The head contour points are extracted by scanning the ac-
cumulated difference image and it is used to estimate the face region. Fig. 2(a)
shows the accumulated difference image as given by (4), and Fig. 2(b) shows
the extracted head contour points and the face region.
3 Facial and visual speech feature extraction
One of the main issue in constructing an automatic person authentication
system is to extract the facial or visual speech features that are invariant
to the size of the face. The face tracking/localization method gives only the
8
upright rectangular bounding box for the face region, and hence the size of
the face cannot be determined from the bounding box. Size of the face can be
determined if the locations of two or more facial features are identified. Among
the facial features, eyes and mouth are the most prominent features used for
estimating the size and pose of the face [30], [31]. In this section, a method
is proposed for extracting the facial and visual speech features from the face
and mouth image, respectively. The facial features are extracted relative to
the locations of the eyes and the visual speech features are extracted relative
to the locations of the eyes and mouth.
3.1 Eye location estimation
Several techniques have been proposed in the literature for estimating the
locations of the eyes. Template-based approach is commonly used for locating
the eyes [32], [33], and the methods given in [30] and [31] use the gray-scale
morphological operations dilation and erosion [28]. In [30] the morphological
operations are applied on the image to enhance the dark regions, and in [31]
morphological operations are used to emphasize brighter and darker pixels in
the luminance (Y ) component around the eye regions. In addition to luminance
component the red and blue chrominance (Cr and Cb) information is also used
in [31]. The Y CrCb color space is obtained from RGB color space using
Y = 0.299R + 0.587G + 0.114B
Cr = R − Y
Cb = B − Y
(5)
9
where R, G and B are the red, green and blue components of the color image,
respectively. The RGB and Y CrCb representation of the face region is shown
in Fig. 3. The Y , Cr and Cb values are normalized to the range [0, 255]. The
eye regions have low intensity (Y ), low red chrominance (Cr) and high blue
chrominance (Cb) when compared to the forehead region of the face. Using
this fact, the face region is thresholded to obtain the thresholded face image
U , given by
U(i, j) =
255, if Y (i, j) < λ1 and Cr(i, j) < λ2
and Cb(i, j) > λ3
I(i, j), otherwise
(6)
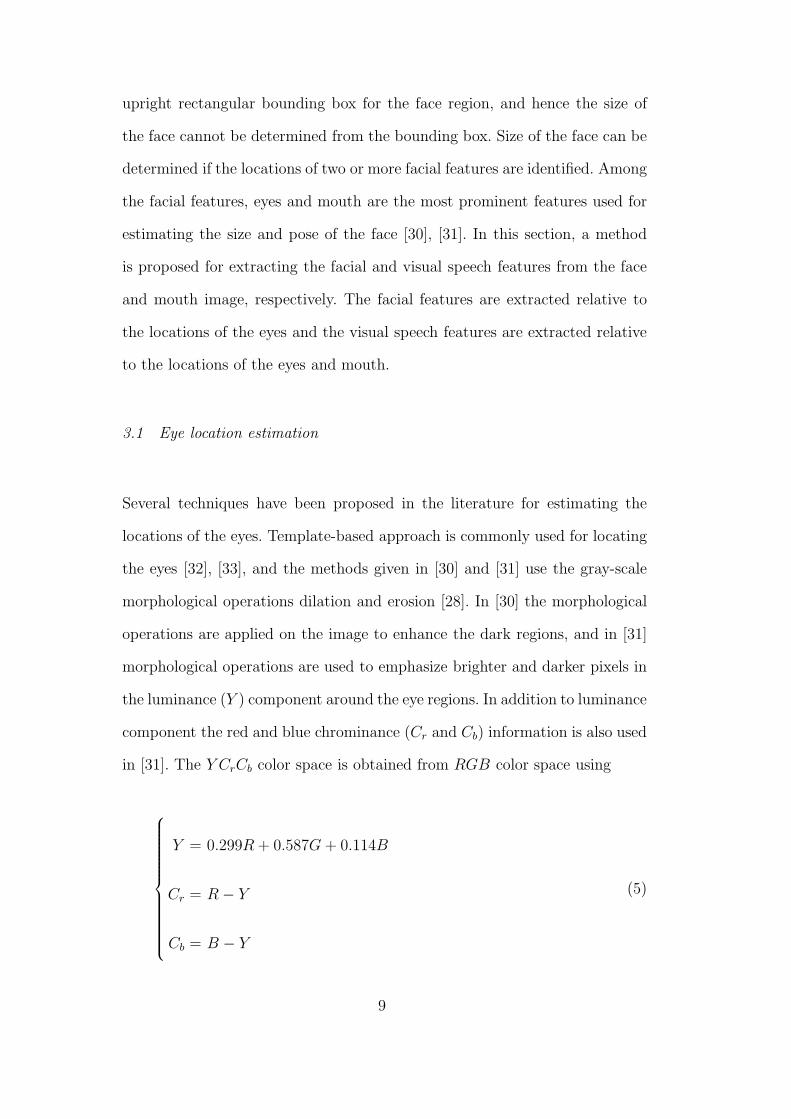
where λ1, λ2 and λ3 are the average Y , Cr and Cb values of the pixels in the
forehead region, respectively. The forehead region is estimated from w1 and
(cx, cy). Fig. 4 shows the construction of the thresholded face image. The white
blobs in Figs. 3(a), (b) and (c) are the low intensity, low red chrominance and
high blue chrominance regions when compared to the forehead region of the
face, respectively. The threshold face image is shown in Fig. 4(d). Morpho-
logical closing operation is applied to the thresholded face image, and the
centroids of the blobs are estimated.
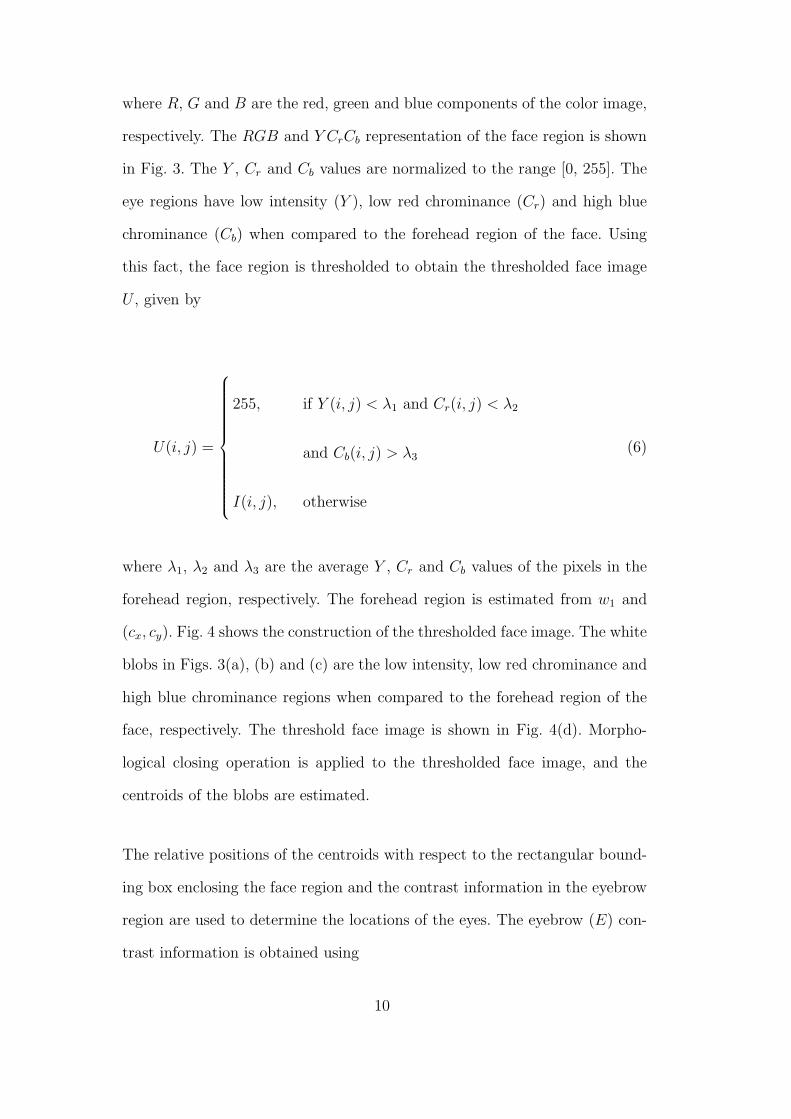
The relative positions of the centroids with respect to the rectangular bound-
ing box enclosing the face region and the contrast information in the eyebrow
region are used to determine the locations of the eyes. The eyebrow (E) con-
trast information is obtained using
10

E(i, j) =
1, if Y (i, j) ≥ λ1 and Y (i, j + 1) ≥ λ1
and Y (i, j + 2) < λ1
0, otherwise
(7)
Fig. 5(a) shows the centroids of the white blobs in the thresholded face image,
and Fig. 5(b) shows the locations of the eyes.
3.2 Mouth center estimation
The mouth or lip image analysis has received considerable attention in the area
of speech recognition and person recognition. Mouth image segmentation is a
necessary step for visual speech feature extraction. Recent methods [31], [34],
[35], [36] use color information to distinguish the lip and nonlip regions in the
face. The term lip image or lip region refers to the lips, teeth, mustache and the
interior of the mouth. For face images with weak color contrast, accurate and
automatic extraction of inner and outer lip boundary remains a challenging
task. Different types of facial hair in the mouth region complicates the lip
contour extraction or the lip contour itself may not be visible. In this work,
the mouth region is used for feature extraction instead of the lip contour
because of robustness and stability. The mouth region is estimated from the
locations of the eyes and the center of the mouth. For estimating the mouth
center, we model the color distribution of the nonlip region of the face using
a Gaussian distribution as given by
P (x, µ, Σ) =1
√
(2π)n|Σ|exp− 1
2(x−µ)T Σ−1(x−µ) (8)
11

where x is the feature vector, n is the dimension of the feature vector, µ is
the mean vector and Σ is the covariance matrix.
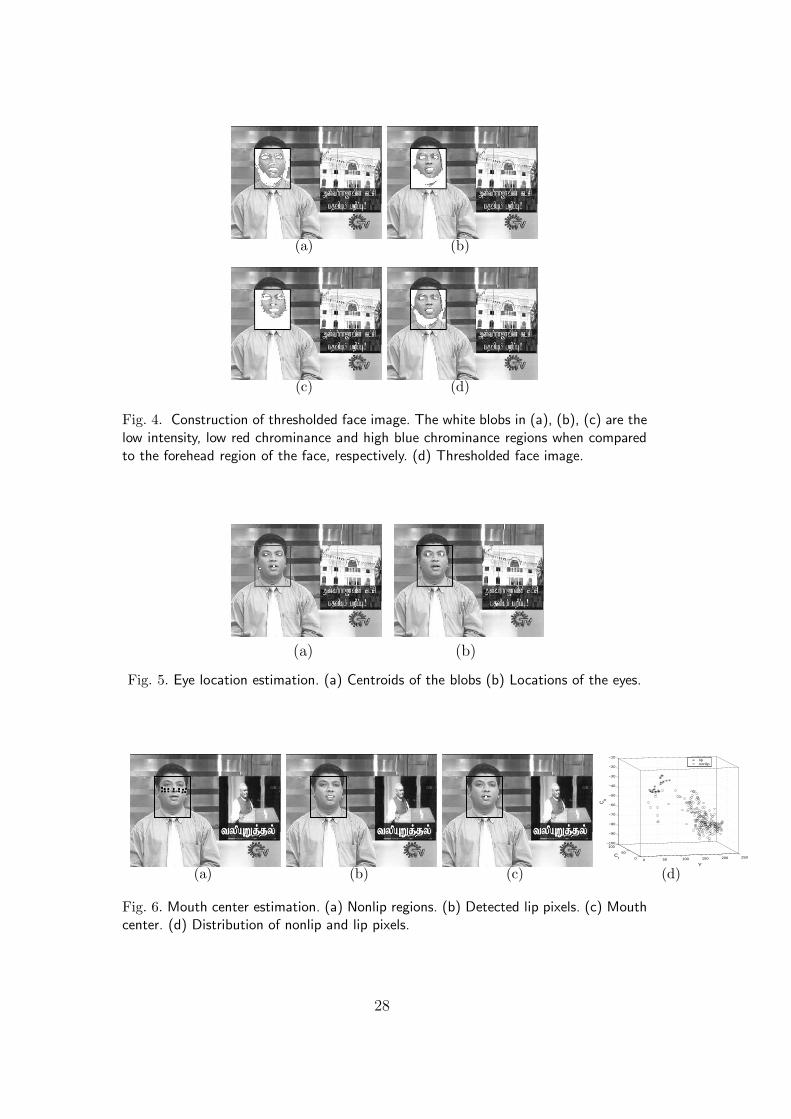
The nonlip regions are extracted relative to the locations of the eyes as shown
in Fig. 6 (a). The Y , Cr and Cb values (feature vector x) of the pixels in these
regions are used to estimate the parameters of the Gaussian distribution. The
Y , Cr and Cb values of the pixels in the lip region may not fall into the
distribution, and hence (8) is used to detect the pixels in the lip region. The
detected lip pixels are shown in Fig. 6 (b). The distribution of Y , Cr and Cb
values of the nonlip and the detected lip pixels are shown in Fig. 6(d). The
center of the mouth is estimated using the pixel coordinates of the detected
lip pixels. The estimated center of the mouth is shown in Fig. 6(c).
3.3 Facial feature extraction
Facial feature extraction is an interesting and challenging task. The facial fea-
tures such as hair, face outline, eyebrows, eyes and mouth plays an important
role in perceiving and remembering faces [1]. A cartoonist extracts the required
information from these features and represent in terms of lines and arcs. These
lines and arcs correspond to the gradient or local extrema (minima and max-
ima) in an image. The local maxima and minima are the largest and smallest
intensity values of an image within some local neighborhood, respectively. The
key facial features such as hair, eyebrows, eyes, nostrils and end points of lips
are associated with local minima, and shape of the lip contour and nose tip
corresponds to local maxima. The local maxima and minima can be extracted
using the gray scale morphological operations dilation and erosion, respec-
tively [28]. The morphological dynamic link architecture (MDLA) method for
12

face recognition described in [37] uses multiscale morphological dilation and
erosion under the elastic graph matching frame work. In our method, an ellip-
tical rigid grid is placed over the face region, and the multiscale morphological
erosion is used for feature extraction. Most of the key facial features are asso-
ciated with the local minima, and hence we use only the erosion operation for
facial feature extraction. The elliptical grid is used instead of a rectangular
grid [37] in order to extract features only from the face region. The face outline
or contour can be captured using a rectangular grid which assumes that the
training and testing images have same background. The performance of the
person authentication technique must be invariant to the position of the face
in the image, and hence we use an elliptical grid instead of a rectangular grid.
The length and the slope of the line connecting the eyes are used to determine
the size and orientation of the grid, respectively. The elliptical grid consists of
73 nodes, and the positions of these nodes are determined relative to the lo-
cations of the eyes. The multiscale morphological erosion operation is applied
at each grid node for extracting the facial features as described below.
The multiscale morphological erosion operation is based on the gray scale
morphology, erosion. Let Z denote the set of integer numbers. Given an image
I: D ⊆ Z2 −→ Z and a structuring function Gσ: Gσ ⊆ Z
2 −→ Z at scale σ, the
erosion of the image I by the structuring function Gσ is denoted as (I ⊖Gσ),
and it is defined by
(I ⊖ Gσ)(i, j) = minx,y
{I(i + x, j + y) − Gσ(x, y)} (9)
where −ma ≤ x, y ≤ mb, with 1 ≤ i ≤ w, 1 ≤ j ≤ h. The size of the
structuring function is decided by the parameters ma and mb, and is given
by (ma + mb + 1) × (ma + mb + 1). The structuring functions such as flat,
13

hemisphere, paraboloid are commonly used in morphological operations [28].
The flat structuring function Gσ(x, y) = 0 is used in this paper. For a flat
structuring function the expression for erosion reduces to
(I ⊖ Gσ)(i, j) = minx,y
{I(i + x, j + y)} (10)
where −ma ≤ x, y ≤ mb. The erosion operation (10) is applied at each grid
node for σ = 1, 2, . . . , p to obtain p facial feature vectors from the face image.
The distance between the eyes (d) is used to determine the parameters ma,
mb and p. The value ma = ⌊d/32⌋ + ⌊σ/2⌋, mb = ⌊d/32 + 0.5⌋ + ⌊(σ − 1)/2⌋
and p = 3 has been used in our experiments. These parameters are chosen in
such a way that ma + mb + 1 for σ = p is less than or equal to the minimal
distance between two nodes of the grid which depends on the number of nodes
in the grid. Fig. 8 (a) shows the eroded images for σ = 1, 2 and 3. Fig. 8 (b)
shows the facial regions used for extracting the feature vectors for σ = 1, 2
and 3. Each facial feature vector f = (f1, f2, . . . , f73) is normalized to [-1, 1]
as follows:
yi =2(fi − fmin)
(fmax − fmin)− 1 (11)
where fmax and fmin are the maximum and minimum values in the feature
vector, respectively. The normalized facial feature vector y = (y1, y2, . . . , y73)
is less sensitive to variation in image brightness.
3.4 Visual speech feature extraction
The static nature of the visual speech or appearance of the mouth image over
a period of time characterizes an individual to some extent. The shape of the
lip contour and shape of the mustache are the dominant visual speech features
in the mouth region. These features are associated with local maxima because
14

the lip, mustache and the interior of the mouth have low luminance (Y ) than
the nonlip region. The local maxima can be extracted using the morphological
dilation [28]. For visual speech feature extraction, a rectangular grid consisting
of 25 nodes is placed over the mouth region. The positions of these nodes
are determined relative to the locations of the eyes and mouth. The features
are extracted at each grid node using the multiscale morphological dilation
operation as described below.
Given an image I: D ⊆ Z2 −→ Z and a structuring function Gσ: Gσ ⊆ Z
2 −→ Z
at scale σ, the dilation of the image I by the structuring function Gσ is denoted
as (I ⊕ Gσ), and it is defined by
(I ⊕ Gσ)(i, j) = maxx,y
{I(i − x, j − y) + Gσ(x, y)} (12)
where −ma ≤ x, y ≤ mb, with 1 ≤ i ≤ w, 1 ≤ j ≤ h. For a flat structuring
function the dilation can be expressed as as
(I ⊕ Gσ)(i, j) = maxx,y
{I(i − x, j − y)} (13)
where −ma ≤ x, y ≤ mb. The dilation operation (13) is applied at each grid
node for σ = 1, 2, . . . , p to obtain p visual speech feature vectors from the
mouth image. The distance between the eyes (d) is used to determine the
parameters ma, mb and p. The value ma = ⌊d/64 + 0.5⌋ + ⌊(σ − 1)/2⌋, mb =
⌊d/64⌋+ ⌊σ/2⌋ and p = 3 has been used in our experiments. Fig. 9 (a) shows
the dilated images for σ = 1, 2 and 3. Fig. 9 (b) shows the visual regions used
for extracting the feature vectors for σ = 1, 2 and 3. Each visual speech feature
vector is normalized to [-1, 1], and the normalized visual speech feature vector
is less sensitive to variation in the image brightness.
15

4 Acoustic feature extraction
Acoustic features representing the speaker information can be extracted from
the speech signal at the segmental level. The segmental features are the fea-
tures extracted from short (10 to 30 ms) segments of the speech signal. Some
of the segmental features are linear prediction cepstral coefficients and mel fre-
quency cepstral coefficients [3]. These features represent the short-time spec-
trum of the speech signal. The short-time spectrum envelope of the speech
signal is attributed primarily to the shape of the vocal tract. The spectral in-
formation of the same sound uttered by two persons may differ due to change
in the shape of the individual’s vocal tract system, and the manner of speech
production.
The differenced speech signal is divided into frames of 20 ms, with a shift
of 5 ms. A 14th order linear prediction (LP) analysis is used to capture the
properties of the signal spectrum. The recursive relation between the predictor
coefficients and cepstral coefficients is used to convert the 14 LP coefficients
into 19 LP cepstral coefficients. The LP cepstral coefficients for each frame are
linearly weighted to get the weighted linear prediction cepstral coefficients. A
19 dimensional WLPCC for each frame is used as a feature vector.
5 Autoassociative neural network model for person authentication
Autoassociative neural network models are feedforward neural networks per-
forming an identity mapping of the input space, and are used to capture the
distribution of the input data [38]. The distribution capturing ability of the
AANN model is described in this section. Let us consider the five layer AANN
16

model shown in Fig. 10, which has three hidden layers. The processing units
in the first and third hidden layer are nonlinear, and the units in the second
compression/hidden layer can be linear or nonlinear. As the error between the
actual and the desired output vectors is minimized, the cluster of points in
the input space determines the shape of the hypersurface obtained by the pro-
jection onto the lower dimensional space. Fig. 11(b) shows the space spanned
by the one dimensional compression layer for the 2 dimensional data shown
in Fig. 11(a) for the network structure 2L 10N 1N 10N 2L, where L denotes
a linear unit and N denotes a nonlinear unit. The integer value indicates the
number of units used in that layer. The nonlinear output function for each
unit is tanh(s), where s is the activation value of the of the unit. The net-
work is trained using backpropagation algorithm [39]. The solid lines shown
in Fig. 11(b) indicate mapping of the given input points due to the one di-
mensional compression layer. Thus, one can say that the AANN captures the
distribution of the input data depending on the constraints imposed by the
structure of the network, just as the number of mixtures and Gaussian func-
tions do in the case of Gaussian mixture models (GMM) [38].
In order to visualize the distribution better, one can plot the error for each in-
put data point in the form of some probability surface as shown in Fig. 11(c).
The error ei for the data point i in the input space is plotted as pi = exp(−ei/α),
where α is a constant. Note that pi is not strictly a probability density func-
tion, but we call the resulting surface as probability surface. The plot of the
probability surface shows a large amplitude for smaller error ei, indicating
better match of the network for that data point. The constraints imposed by
the network can be seen by the shape the error surface takes in both the cases.
One can use the probability surface to study the characteristics of the distri-
17

bution of the input data captured by the network. Ideally, one would like to
achieve the best probability surface, best defined in terms of some measure
corresponding to a low average error.
In this work, a five layer autoassociative neural network model as shown in
Fig. 10 is used to capture the distribution of the feature vectors. The second
and fourth layers of the network have more units than the input layer. The
third layer has fewer units than the first or fifth. The activation functions at
the second, third and fourth layer are nonlinear. The structures of the AANN
models used in our study are 19L 38N 4N 38N 19L, 73L 90N 30N 90N 73L and
25L 40N 10N 40N 25L for capturing the distribution of acoustic, facial and
visual speech features of a subject, respectively. The standard backpropagation
learning algorithm is used to adjust the weights of the network to minimize
the mean square error for each feature vector.
6 Experimental Results
Performance of the person authentication system is evaluated using Indian TV
broadcast news data (Sun Network: Sun TV and Sun News) for 50 subjects,
32 females and 18 males. For enrolling (training) a subject, an AVI file of 60
sec (4 clips, each of 15 sec) duration at 12 fps is recorded with a resolution
of 320 × 240. The speech signal is recorded at 8000 samples per second.
During newsreading, the background around the newsreader is almost constant
accompanied by a small motion of the reader in the foreground. Hence, the
accumulated difference image is used to estimate the face region as described
in Section 2. If there is a significant head movement during newsreading then
the thresholded difference image (T ) can be used to track the face region. The
18

face localization method is computationally efficient and it is not sensitive
to the size of the face, lighting conditions and facial expressions. The method
assumes that there is no other moving object in the background. The locations
of the eyes and mouth are estimated as described in Section 3. The method
can detect the locations of the eyes in the presence of eye glasses as long as
the eye regions are visible. Fig. 7 shows the face region, locations of the eyes
and mouth for a few subjects.
The morphological erosion (dilation) is applied on the face (mouth) image
for three different scales (p=3) and the facial (visual speech) feature vectors
are extracted for 300 face images as described in Section 3. The distance
between the eyes varied from 24 to 33 pixels and hence the value of p=3 is
used in our experiments. The acoustic features are extracted as described in
Section 4. The distribution of acoustic, facial and visual speech feature vectors
are captured using AANN models. The extracted acoustic feature vectors are
given as input to the AANN model 19L 38N 4N 38N 19L, and the network is
trained for 100 epochs as described in Section 5 for capturing the distribution.
The normalized 900 facial feature vectors are given as input to the AANN
model 73L 90N 30N 90N 73L and the network is trained for 200 epochs.
Similarly the distribution of the 900 visual speech feature vectors is captured
using an AANN model 25L 40N 10N 40N 25L, and the network is trained for
50 epochs. One epoch of training is a single presentation of all the training
vectors to the network. The training takes about 3 minutes on a PC with
2.3 GHz CPU. The network structures are chosen based on empirical studies.
For evaluating the performance of the system, an AVI file of 10 sec duration
at 12 fps is recorded, one month after collecting the training data. Most of
the video-based face recognition and audio-video based person recognition
19

methods described in the literature reports identification performance. This
paper deals with authentication rather than identification. But, for the purpose
of performance comparison, the identification performance is also evaluated.
For identification, the feature vector is given as input to each of the model. The
output of the model is compared with the input to compute the normalized
squared error. The normalized squared error (e) for the feature vector y is
given by, e= ‖y−o‖2
‖y‖2 , where o is the output vector given by the model. The
error (e) is transformed into a confidence score (c) using c = exp(−e). The
average confidence score is calculated for each model. The identity of the
subject is decided based on the highest confidence score. The identification
performance is measured in terms of recognition rate. For authentication, the
feature vector is given as input to the claimant model and the confidence score
is calculated. The claim is accepted if the confidence score is greater than
a threshold, otherwise the claim is rejected. In the database of 50 subjects,
there are 50 authentic claims and 49 × 50 impostor claims. The authentication
performance is measured in terms of equal error rate (EER), where the false
acceptance rate (FAR) and false rejection rate (FRR) are equal. The EER
can be found for each subject (person-specific threshold) or considering all
the subjects together (person-independent threshold). In our experiments, the
EER is obtained by employing person-independent thresholds.
The identification and authentication performance of the system is evaluated
for the single and combined modalities. Performance of the system for single
modality is given in Table 1. The EERs are calculated using the unnormalized
confidence scores. Score normalization methods such as Z-norm, T-norm and
ZT-norm are commonly used for estimating EER in speaker verification stud-
ies [3]. The confidence scores from speech, face and visual speech modalities
20

Table 2Person recognition results (single modality)
Speech Face Visual speech
Recognition rate 90.0% 96.0% 88.0%
Equal error rate 9.2% 2.5% 8.1%
Table 3Person recognition results (combined modalities)
Speech+Face Speech+Visual speech Speech+Face+Visual speech
Recognition rate 100.0% 94.0% 100.0%
Equal error rate 1.5% 5.6% 0.45%
are combined using (14) to obtain the multimodal confidence score (cm).
cm =1
m
m∑
i=1
wfcfi + wv(1 − wf)c
vi + (1 − wf)(1 − wv)c
ai (14)
where cai , cf
i and cvi are the acoustic, facial and visual speech confidence scores
for the ith video frame, respectively. The weight for each of the modality is
decided by the parameters wf and wv. In our experiment the modalities are
combined in three ways: 1) wf = 0.5, wv = 0 (speech and face), 2) wf = 0 ,
wv = 0.5 (speech and visual speech) and 3) wf = 0.5, wv = 0.5 (speech, face
and visual speech). The values of the parameters wf and wv are chosen such
that the system gives optimal performance in terms of EER for the combined
modalities. The performance of the system for the combined modalities are
given in Table 2. The proposed system achieves about 0.45% EER for 50
subjects using speech, face and visual speech modalities.
Performance of the proposed text-independent person authentication method
is comparable or better than the existing person identification or authentica-
tion methods discussed in Section 1.1. Most of the existing person authenti-
cation methods use other subject models or scores in order to accept or reject
the identity claim of a subject (i.e., authentication in terms of identification).
In this method, only the claimant model is used for authentication. Fig. 12
21

shows a snapshot of the audio-video based person recognition system. The
system estimates the face region, locations of the eyes and mouth, extracts
the acoustic, facial and visual speech features and calculates the multimodal
confidence score at about 6 frames/s on a PC with 2.3 GHz CPU.
The performance of the method using only facial features is also evaluated in
real time in the laboratory environment for 50 subjects using a camera with a
resolution of 160 × 120. In real time person authentication and identification,
we use the thresholded difference image (T) instead of accumulated difference
image for estimating the face region as described in Section 2. For enrolling a
subject, the facial features are extracted as described in Section 3 for 300 face
images with variations in size, orientation and pose of the face. The distribu-
tion of the facial feature vectors is captured using an AANN model with the
structure 73L 90N 30N 90N 73L, and the network is trained for 200 epochs.
The real time facial feature extraction is shown in Fig. 13.
For identification, 20 facial feature vectors are extracted in real time, and
the average confidence score is calculated for each model. The identity of the
subject is decided based on the highest confidence score. For authentication,
the average confidence score is calculated from the claimant model for 20 facial
feature vectors. The claim is accepted if the confidence score is greater than
a threshold. The system achieves about 98.0% recognition rate and an EER
of about 5.0%. The lighting conditions in the laboratory are not controlled,
and hence there is a slight increase in the EER. However, there is no major
change in the recognition performance, because the highest confidence score
is used to decide the identity.
Fig. 14 shows the real time facial feature extraction for varying size, orientation
22

and background. Fig. 15 shows the snapshot of the real time person recognition
system. The person recognition system tracks the face, estimates the locations
of the eyes, extracts the facial features and calculates the confidence score in
real time at about 9 frames/s on a PC with 2.3 GHz CPU. The performance
of the authentication system must be invariant to size of the face, background,
orientation and pose of the face, and lighting conditions, in order to use it for
commercial applications. The proposed method is not sensitive to the size of
the face, its position in the image and its background, and orientation of the
face. It is also not sensitive to the pose of the face as long as the eye regions
are visible. The method is less sensitive to variation in the image brightness.
However, the method is sensitive to shadows, variation in lighting conditions
and profile view of the face.
7 Conclusion
In this paper, we have proposed an automatic multimodal person authenti-
cation system using speech, face and visual speech modalities. The acoustic
features are represented by WLPCC and the facial and visual speech features
are extracted using the multiscale morphological operations. The distribution
capturing ability of the autoassociative neural network models was exploited
to capture the distribution of feature vectors describing each of the biometric
modalities such as speech, face and visual speech. The method is invariant to
size of the face, its position in the image and its background. The face local-
ization and feature extraction techniques are computationally efficient, and
the system test the identity claim of a subject within a reasonable time.
23

References
[1] W. Zhao, R. Chellappa, A. Rosenfeld, P. Phillips, Face recognition: A literaturesurvey, UMD CAFR, Technical Report, CAR-TR-948, October 2000.
[2] C. C. Yilmaz, F. Deravi, J. Mason, A review of speech-based bimodalrecognition, IEEE Trans. Multimedia 4 (1) (2002) 23–37.
[3] National Institute of Standards and Technology (NIST)- Speaker RecognitionWorkshop Report, University of Maryland, Baltimore, 2003.
[4] M. Turk, A. Pentland, Eigenfaces for recognition, Journal of CognitiveNeuroScience 3 (1991) 71–86.
[5] D. Swets, J. Weng, Using discriminant eigenfeatures for image retrieval, IEEETrans. Pattern Analysis and Machine Intelligence 18 (8) (1996) 831–836.
[6] P. Belhumeur, J. Hespanha, D. Kriegman, Eigenfaces vs. fisherfaces:Recognition using class specific linear projection, IEEE Trans. Pattern Analysisand Machine Intelligence 19 (7) (1997) 711–720.
[7] M. Bartlett, H. Lades, T. Sejnowski, Independent component representationsfor face recognition, in: Proc. SPIE, Vol. 3299, San Jose, CA, 1998, pp. 528–539.
[8] M. Lades, J. Vorbruggen, J. Buhmann, J. Lange, C. Malsburg, R. Wurtz,W. Konen, Distortion invariant object recognition in the dynamic linkarchitecture, IEEE Trans. Computers 43 (3) (1993) 300–311.
[9] L. Wiskott, J. Fellous, C. Malsburg, Face recognition by elastic bunch graphmatching, IEEE Trans. Pattern Analysis and Machine Intelligence 19 (7) (1997)775–779.
[10] Y. Gao, M. Leung, Face recognition using line edge map, IEEE Trans. PatternAnalysis and Machine Intelligence 24 (6) (2002) 764–779.
[11] B. Heisele, Alessandro, T. Poggio, Learning and vision machines, Proc. IEEE90 (7) (2002) 1164–1177.
[12] C. Kotropoulos, I. Pitas, Using support vector machines to enhance theperformance of elastic graph matching for frontal face authentication, IEEETrans. Pattern Analysis and Machine Intelligence 23 (7) (2001) 735–746.
[13] M. Savvides, B. V. Kumar, P. Khosla, Face verification using correlationfilters, in: Proc. 3rd IEEE Automatic Identification Advanced Technologies,Tarrytown, NY, 2002, pp. 56–61.
[14] A.J. Howell and H. Buxton, Towards unconstrained face recognition from imagesequences, in: Proc. Int. Conf. on Automatic face and gesture recognition,Killington, Vermont, 1996, pp. 224–229.
[15] S. Zhou, V. Krueger, R. Chellappa, Probabilistic recognition of human facesfrom video, Computer Vision and Image Understanding 91 (2003) 214–245.
24

[16] X. Liu, T. Chen, Video-based face recognition using adaptive hidden Markovmodels, in: Proc. IEEE Conf. Computer Vision and Pattern Recognition,Madison, Wisconsin, 2003, pp. 340–345.
[17] T. Choudhury, B. Clarkson, T. Jebara, A. Pentland, Multimodal personrecognition using unconstrained audio and video, in: Proc. Audio-and video-based Biometric Person Authentication, Washington, DC, 1999, pp. 176–181.
[18] A. Senior, C. Neti, A. Senior, On the use of visual information for improvingaudio-based speaker recognition, in: Audio-Visual speech processing conference,Santa Cruz, CA, 1999.
[19] C. Sanderson, K. Paliwal, Noise resistant audio-visual verification via structuralconstraints, in: IEEE Int’l Conf. Acoustics, Speech and Signal Processing, HongKong, 2003, pp. 716–719.
[20] T. Hazen, E. Weinstein, B. Heisele, Multi-modal face and speaker identificationon a handheld device, in: Workshop on multimodal user authentication, SantaBarbara, California, 2003, pp. 113–120.
[21] P. Jourlin, J. Luettin, D. Genoud, H. Wassner, Acoustic-labial speakerverification, Pattern Recognition Letters 18 (1997) 853–858.
[22] U. Chaudhari, G. Ramaswamy, G. Potamianos, C. Neti, Audio-visual speakerrecognition using time-varying stream reliability prediction, in: IEEE Int’l Conf.Acoustics, Speech and Signal Processing, Hong Kong, 2003, pp. 712–715.
[23] A. Kanak, E. Erzin, Y. Yemez, A. Tekalp, Joint audio-video processing forbiometric speaker identification, in: IEEE Int’l Conf. Acoustics, Speech andSignal Processing, Hong Kong, 2003, pp. 377–380.
[24] J. Steffens, E. Elagin, H. Neven, Personspotter-fast and robust system forhuman detection, tracking and recognition, in: Proc. Int. Conf. Automatic faceand gesture recognition, Nara, Japan, 1998, pp. 516–521.
[25] R. Gross, J. Shi, The CMU motion of body (MoBo) database, Technical Report,CMU-RI-TR-01-18, Robotics institute, Carnegie Mellon University, June 2001.
[26] VidTIMIT Database, http://www.eleceng.adelaide.edu.au/Personal/csanders/vidtimit/welcome.html.
[27] M2VTS Multimodal Face Database, http://www.tele.ucl.ac.be/PROJECTS/M2VTS/m2fdb.html.
[28] P. Jackway, M. Deriche, Scale-space properties of the multiscale morphologicaldilation-erosion, IEEE Trans. Pattern Analysis and Machine Intelligence 18 (1)(1996) 38–51.
[29] M. Yang, D. Kriegman, N. Ahuja, Detecting faces in images: A survey, IEEETrans. Pattern Analysis and Machine Intelligence 24 (1) (2002) 34–58.
[30] A. Nikolaidis, I. Pitas, Facial feature extraction and pose determination, PatternRecognition 33 (11) (2000) 1783–1791.
25

[31] R. Hsu, M. Abdel-Mottaleb, A. Jain, Face detection in color images, IEEETrans. Pattern Analysis and Machine Intelligence 24 (5) (2002) 696–706.
[32] K. Lam, H. Yan, Locating and extracting the eye in human face images, PatternRecognition 29 (5) (1996) 771–779.
[33] F. Smeralsi, O. Carmona, J. Bigun, Saccadic search with Gabor features appliedto eye detection and real-time head tracking, Image and Vision Computing18 (4) (2000) 323–329.
[34] T. Chen, Audiovisual speech processing, IEEE Signal Processing Magazine(2001) 9–21.
[35] S. Leung, S. Wang, W. Lau, Lip image segmentation using fuzzy clusteringincorporating an elliptic shape function, IEEE Trans. Image Processing 13 (1)(2004) 51–62.
[36] S. Wang, W. Lau, S. Leung, A. Liew, Lip segmentation with the presence ofbeards, in: IEEE Int’l Conf. Acoustics, Speech and Signal Processing, Vol. 3,Montreal, Canada, 2004, pp. 529–532.
[37] C. Kotropoulos, A. Tefas, I. Pitas, Frontal face authentication usingdiscriminating grids with morphological feature vectors, IEEE Trans.Multimedia 2 (1) (2000) 14–26.
[38] B. Yegnanarayana, S. Kishore, AANN: an alternative to GMM for patternrecognition, Neural Networks 15 (2002) 459–469.
[39] S. Haykin, Neural networks: A comprehensive foundation, Prentice HallInternational, New Jersey, 1999.
26

(a) (b)
Fig. 1. Face tracking. (a) Difference image. (b) Face region.
(a) (b)
Fig. 2. Face localization. (a) Accumulated difference image. (b) Face region.
(a)
(b)
Fig. 3. RGB and Y CrCb representation of the face region. (a) From left to right:
Red, green and blue component of the face region (b) Y , Cr and Cb component of theface region.
27
(a) (b)
(c) (d)
Fig. 4. Construction of thresholded face image. The white blobs in (a), (b), (c) are thelow intensity, low red chrominance and high blue chrominance regions when comparedto the forehead region of the face, respectively. (d) Thresholded face image.
(a) (b)
Fig. 5. Eye location estimation. (a) Centroids of the blobs (b) Locations of the eyes.
(a) (b) (c)0 50 100 150 200 2500
50
100−100
−90
−80
−70
−60
−50
−40
−30
−20
−10
Y
Cr
Cb
lipnonlip
(d)
Fig. 6. Mouth center estimation. (a) Nonlip regions. (b) Detected lip pixels. (c) Mouthcenter. (d) Distribution of nonlip and lip pixels.
28

Fig. 7. Face region, locations of the eyes and mouth for a few subjects.
(a)
(b)
Fig. 8. Facial feature extraction. (a) From left to right: Eroded images for σ = 1, 2and 3. (b) Facial regions used for extracting the feature vectors for σ = 1, 2 and 3.
29

(a)
(b)
Fig. 9. Visual feature extraction. (a) From left to right: Dilated images for σ = 1, 2and 3. (b) Visual regions used for extracting the feature vectors for σ = 1, 2 and 3.
Input layer
Layer
.
.......
. ...
...
Compressionlayer
Output layer
1
2
3
4
5
Fig. 10. A five layer AANN model.
30

−4−2
02
4−5
0
5
10
0
0.05
0.1
(a)
−4−2
02
4−5
0
5
10
0
0.05
0.1
(b)
(c)
Fig. 11. Distribution capturing ability of AANN model. From [38]. (a) Artificial2 dimensional data. (b) 2 dimensional output of AANN model with the structure2L 10N 1N 10N 2L. (c) Probability surfaces realized by the network structure2L 10N 1N 10N 2L.
Fig. 12. Snapshot of the audio-video based person recognition system
31

(a) (b)
(c) (d)
Fig. 13. Real time facial feature extraction. (a) Difference image. (b) Contour pointsand the face region. (c) Thresholded face image. (d) Facial regions used for extractingthe feature vector for σ=2.
Fig. 14. Real time facial feature extraction for varying size, orientation and background.
32

Fig. 15. Snapshot of the real time person recognition system
33