pakistan veg value chains 14sept15 mm clean203.64.245.61/fulltext_pdf/eb/2011-2015/eb0235.pdf ·...
TRANSCRIPT

BaselineReport
Vegetable Market Intermediaries in Pakistan
September 2015
Agricultural Innovation Program (AIP) for Pakistan

AVRDC – The World Vegetable Center is the leading international nonprofit research organization committed to alleviating poverty and malnutrition in the developing world through the increased production and consumption of nutritious, health-promoting vegetables.
AVRDC – The World Vegetable Center P.O. Box 42 Shanhua, Tainan 74199 TAIWAN Tel: +886 6 583 7801 Fax: +886 6 583 0009 Email: [email protected] Web: avrdc.org AVRDC Publication No.: 15-792 © 2015 AVRDC – The World Vegetable Center Disclaimer This study was made possible by the support of the American people through the United States Agency for International Development (USAID). The contents are the sole responsibility of the International Maize and Wheat Improvement Center (CIMMYT) and AVRDC – The World Vegetable Center and do not necessarily reflect the views of USAID or the United States Government.
Suggested citation Nasir M. 2015. Baseline Report: Vegetable Market Intermediaries in Pakistan. AVRDC – The World Vegetable Center Publication No. 15-792, AVRDC – The World Vegetable Center, Taiwan. 53 p.

BASELINE REPORT
Vegetable Market Intermediaries in Pakistan
September 2015

i
TableofContents
List of Tables ......................................................................................................................................... iii
List of Figures ........................................................................................................................................ iv
EXECUTIVE SUMMARY .................................................................................................................... v
ACKNOWLEDGMENTS ..................................................................................................................... vi
List of Acronyms and Abbreviations .................................................................................................... vii
Chapter 1: Introduction ........................................................................................................................... 1
1.1 Background ................................................................................................................................... 1
1.2 Objectives and Scope .................................................................................................................... 2
1.3 Presentation Plan ........................................................................................................................... 2
Chapter 2: Methodology ......................................................................................................................... 3
2.1 Research Methodology ................................................................................................................. 3
2.2 Survey Sites .................................................................................................................................. 5
2.2.1 Administrative Locations in Pakistan .................................................................................... 5
2.2.2 Basic Data Information and Enumerators’ Capacity Building ............................................... 6
2.3 Time Frame and Study Team ........................................................................................................ 6
2.4 Data Analyses and Results Presentation ....................................................................................... 7
Chapter 3: Farmers’ Marketing Practices and Perceived Sources of Losses .......................................... 7
3.1 Where and How Vegetables are Sold ........................................................................................... 7
3.2 Preharvest, Harvest, and Postharvest Losses ................................................................................ 8
3.3 Marketing Channels .................................................................................................................... 10
3.3.1 Markets and Sales Channels ................................................................................................ 10
3.3.2 Market Determinants ........................................................................................................... 14
3.4 Summary .................................................................................................................................... 14
Chapter 4: Vegetable Growers .............................................................................................................. 15
4.1 Status of Vegetable Seed Production .......................................................................................... 15
4.2 Fresh Vegetable Production ........................................................................................................ 16
4.3 Grading Fresh Vegetables ........................................................................................................... 16
4.4 Packing Fresh Vegetables ........................................................................................................... 17
4.5 Access to Wholesale Markets for Fresh Vegetables ................................................................... 17
4.5 Satisfaction about Facilities at the Marketplace .......................................................................... 18
4.6 Mode of Payments from Commission Agents ............................................................................ 19
4.7 Satisfaction About Commission Agents’ Behavior .................................................................... 19

ii
4.8 Credit from Commission Agents ................................................................................................ 20
4.9 Commission Agents’ Role in Facilitation ................................................................................... 20
4.10 Summary ................................................................................................................................... 21
Chapter 5: Commission Agents ............................................................................................................ 22
5.1 The Role of Commission Agents ................................................................................................ 22
5.2 Commission Agents’ Business Experience ................................................................................. 22
5.2 Summary ..................................................................................................................................... 26
Chapter 6: Seed Dealers ........................................................................................................................ 27
6.1 Information about Seed Dealers’ Businesses .............................................................................. 27
6.2 Seed Dealers’ Business Types and Levels .................................................................................. 27
6.3 Seed Dealers’ Sale of Varieties ................................................................................................... 28
6.4 Seed Dealers’ Source of Vegetable Seed Purchased ................................................................... 29
6.5 Seed Dealers’ Perceptions of Seed Quality ................................................................................. 30
6.6 Seed Dealers’ Promotional Methods ........................................................................................... 30
6.7 Seed Dealers’ Seed Storage, Sufficiency of Supply and Improvement Efforts .......................... 31
6.8 Seed Dealers’ Knowledge of Vegetable Seeds and Crop Production ......................................... 31
6.9 Seed Dealers’ Financial Needs ................................................................................................... 31
6.10 Summary ....................................................................................................................................... 32
Recommendations ................................................................................................................................. 34
References ............................................................................................................................................. 36
Appendices ............................................................................................................................................ 37
Appendix I: Clusters for Assessing Vegetable Value Chains .......................................................... 37
Appendix II: Area & Production Statistics of Important Vegetables in Pakistan ............................ 38
Appendix III: Questionnaire – Vegetable Value Chains Baseline Information ............................... 39

iii
List of Tables
Table # Title of Table Page #
1 Sample Distribution by Provinces and Key Value Chain Players 4 2 Proportion of Vegetables Sold by Farmers to Different Buyers 7 3 Preharvest, Harvest, and Postharvest Losses 8 4 Growers’ Perceptions for Losses Before Harvesting 9 5 Growers’ Area Allocation for Seed Production 14 6 Growers’ Area Allocation for Fresh Vegetable Production 15 7 Growers’ Level of Grading and Expected Benefits 16 8 Growers’ Packing Preferences 16 9 Growers’ Difficulties in Accessing Markets 17
10 Growers’ Satisfaction About Facilities at Wholesale Marketplaces 18 11 Growers’ Mode of Payments from Commission Agents 18 12 Vegetable Growers’ Satisfaction About Commission Agents Behavior 19 13 Vegetables Growers’ Credit Dealings with Commission Agents 19 14 Commission Agents’ Role in Facilitation 20 15 Commission Agents’ Business Association with Regulatory Bodies 21 16 Commission Agents’ Business Status 22 17 Commission Agents’ Facilitation for Vegetables Growers 22 18 Commission Agents’ Interaction with Vegetables Growers 22 19 Commission Agents’ Business Financial Sources 23 20 Commission Agents’ Financial Shortfall Management 23 21 Male and Female Labor Working for Commission Agents 23 22 Percent Cash Received as Commission 24 23 Various Activities Satisfaction of Commission Agents 24 24 Methods Used by Commission Agents to Attract Vegetable Growers 24 25 Basic Information about Seed Dealers’ Businesses 26 26 Seed Dealers’ Business Types, and Levels 27 27 Seed Dealers’ Sale of Hybrid and Open Pollinated Varieties 28 28 Mean Quantity of Hybrid and Open Pollinated Varieties sold by Seed Dealers 28 29 Seed Dealers’ Source of Vegetable Seeds 29 30 Seed Dealers’ Perceptions About Seed Related Issues 30 31 Seed Dealers’ Seed Promotional Methods 30 32 Seed Dealers’ Storage, Sufficiency of Supply and Improvement efforts 30 33 Seed Dealers’ Knowledge of Vegetable Seeds 31 34 Seed Dealers’ Financial Need Sources 31

iv
List of Figures
Figure # Title of Figure Page #
1 Data collection and grading of vegetables in the vegetable market 5
2 Interviewing commission agents at a fresh vegetable market 5
3 Location of markets where respondents were interviewed 6
4 Marketing channels in Pakistan 10
5 Marketing channels: The Case of Tomato 11
6 Inventory of vegetable market players: The Case of Tomato 12
v
EXECUTIVE SUMMARY Pakistan has a complex and relatively unregulated vegetable marketing system due to the large number of vegetables grown, a diversity of production systems and limited government control. Growers, seed dealers and commission agents along with others play the major roles in the value vegetable chain that operates through more than 200 major markets in Pakistan. A survey was conducted in nine wholesale markets representative of major vegetable production areas across the country. A total of 222 respondents were interviewed, representing about 10% of the growers, seed/input dealers and commission agents operating in these districts. The four-month study started in June 2014 and mainly focused on the value chains for tomato, onion, cucumber, chili and okra.
Farmers generally grow two to five vegetables for home consumption and others are grown for cash sales at local and wholesale markets. Over a third sold their standing crops to agents before harvest to obtain quick cash, repay loans from agents and to minimize postharvest losses. Almost all farmers had preharvest losses that averaged around 25% of anticipated marketable yields. Most graded their crops to obtain higher prices, but less than half used some sort of packing material when sending produce to market. The most popular containers were plastic bags, which provide little protection. More than half of growers received credit from commission agents who not only sold their crops but also provided fertilizer, seeds, pesticides and crop management information. Many commission agents have long-term relationships with farmers and most have operated at a local level for many years. They normally charge 5% commission to both vegetable growers and buyers for their services. Despite many claiming cash shortages in their businesses, very few borrow from banks, but rather from family and friends. They were generally happy with market operations.
Seed dealers sell a wide variety of seeds besides those of vegetables, and some supply fertilizers and pesticides. The seed industry has been relatively unregulated until recently and government inspections are now more common. Unlike commission agents, seed dealers are more likely to be linked to international or national companies rather than working as local level operators. Overall, they sell more seed of open pollinated varieties—particularly for onion and tomato—rather than hybrid vegetables, which are more commonly used for off-season or protected vegetable production. However, many could not distinguish whether a variety was open pollinated or a hybrid. Most dealers obtain their seed from international or national sources but about half obtained it locally and many found problems of mixed seed or poor packaging. Their own seed storage was often not satisfactory and half indicated they had lost a significant quantity of seed in the last year due to weather damage. Many indicated financial problems in managing their businesses but most relied on informal credit sources using family and friends rather than banks.
There were many inefficiencies found within the selected vegetable value chains in Pakistan, and significant sources of losses in the preharvest and postharvest stages, as well as in critical input supplies such as seed. Some of these may be addressed by physical improvements in management, but others are institutional. There is a common problem of access to credit by key players, which limits the investments needed to improve the system. Organizing better sources of finance, and grouping and training key players will be needed to improve value chain operations.

vi
ACKNOWLEDGMENTS
This document is a result of baseline study on vegetable value chains in four provinces of Pakistan, conducted under the vegetable component of the Agricultural Innovation Program (AIP) - Pakistan. The author would like to acknowledge the United States Agency for International Development (USAID), the International Wheat and Maize Improvement Center (CIMMYT), and AVRDC – The World Vegetable Center for commissioning this study as a contribution to the field of agricultural development in general and vegetable value chains in particular. The author is also grateful to AVRDC staff members, enumerators, vegetable growers, commission agents, seed dealers and other stakeholders for their participation during the course of this study. Their generous contributions of time and the valuable information provided to survey teams is highly appreciated.
Mr. Mazullah Khan, Mr. Asrar Sarwar, Dr. Ashgar Ali, Mr. Arif Shahzad, and Mr. Mazhar Hussain Shah provided technical input at various stages of this work, and were instrumental in conceptualizing this study. The author is greatly indebted to Dr. Warwick Easdown, Dr. Pepijn Schreinemachers, Dr. Mansab Ali, and Dr. Mohammad Iqbal, who contributed reviews, critical input, editing and expertise in compiling this study. I would like to thank many others who directly or indirectly contributed to this study.
None of the opinions or comments expressed in this study are endorsed by the organizations mentioned or individuals interviewed. Factual errors or interpretations are exclusively the responsibility of the consultant, Dr. Mohammad Nasir: [email protected]

vii
List of Acronyms and Abbreviations AARI Ayub Agricultural Research Institute
ACP Agricultural Commodities Programme
AIP Agricultural Innovative Program
AMAPSGF Accelerated Microenterprise Advancement Project Small Grant Facility
ANSAB Asia Network for Sustainable Agriculture and Bio-resources
AVRDC AVRDC – The World Vegetable Center
Agents Commission Agents
CBO Community Based Organization
CIMMYT International Wheat and Maize Improvement Center
FAO Food and Agriculture Organization
FGDs Focus Group Discussions
FIAS Freight Investment Advisory Service
GDP Gross Domestic Product
GOs Government Organizations
GOP Government of Pakistan
ha Hectare
IDE International Development Enterprises (WI)
kg Kilogram
MNFSR Ministry of Food Security and Research
NARC National Agriculture Research Center
NGOs Non-Governmental Organizations
NEAT Nepal Economic, Agriculture, and Trade Activity
PARC Pakistan Agriculture Research Council
SAARC South Asian Association for Regional Cooperation
SAC SAARC Agriculture Centre
Dealers Seed Dealers
UNDP United Nations Development Programme
USAID United States Agency for International Development
Growers Vegetable Growers
WAI Weidemann and Associates, Inc.
WI Winrock International

1
Chapter 1: Introduction
1.1 Background The global consumption of vegetables (and fruits) is increasing at 4.5% per annum, which is higher than
world population growth. Sixty percent of global vegetable production comes from Asia; China and
India occupy first and second ranks, respectively. Although Pakistan is not one of the top-ranked Asian
producing countries, it does have a large domestic market for fresh vegetables (FAO, 1989 & 2002).
Fruits and vegetables contribute 12% to Pakistan’s gross domestic product (GDP). Both are cultivated
on an area of 1.24 million ha, while vegetables are cultivated on 0.39 million ha (about 2% of the
country’s cultivated area) with a total production of 6.2 million tonnes (GOP, 2012-13; FIAS, 2007).
The percentage of the total area occupied by major vegetables: tomato (16%), turnip (9%), spinach
(7%), carrot (7%), cauliflower (7%), and radish (5%). Minor vegetables include okra (4%), squash
(3%), brinjal (eggplant; 3%), bitter gourd (2%), bottle gourd (2%), and cabbage (2%), with a combined
total of 16%. The remaining 33% is accounted for by other vegetables (GOP, 2013-14).
Pakistan has a complex vegetable marketing system due to the large number of vegetables grown, and
a diversity of production systems that encompass traditional, off-season (protected) and off-season
(natural) production in different parts of the country. Approximately 203 regulated and un-regulated
markets in the country also make the system more complex. The system faces many deficiencies. These
include a lack of cold storage (without any integrated cold chains), high transport costs, price
fluctuations, the manipulative role of commission agents/middlemen, poor marketing infrastructure,
and high pre- and postharvest losses (Bourne, 1986; Khan et al., 2008).
The traditional market system has prevailed in the country for many decades, and this includes assembly
markets, wholesale markets, and terminal markets. In this system, the major market players are
vegetable growers, input dealers/seed dealers, contractors, commission agents, wholesalers, inter-
market traders/retailers, processors and exporters. The majority of growers have little influence in this
value/supply chain, while agents and dealers dominate the chain since they play more than one role in
the marketing system. For example, seed and input dealers supply vegetable/fruits/flowers/seeds and/or
other inputs including fertilizers and pesticides (weedicides, fungicides, etc.) Traders and Pharia (a
specific person who operates in close collaboration with commission agents in wholesale markets in
South Asian countries) also play an important role in vegetable value chains. Similarly, agents also play
the additional roles of contractors, wholesalers, traders, processors or exporters (SAARC Agriculture
Centre, 2014). Growers, agents, and dealers were selected for this value chain survey as they are the
key players in the system.

2
1.2 Objectives and Scope
The general objective of the study was to determine basic information regarding the activities of
vegetable value chains, and to understand their functioning in the project areas. The following were the
specific objectives:
To highlight existing vegetable marketing practices and price mechanisms
To document the preharvest, harvest, and postharvest losses of vegetables
To identify trends in areas grown and vegetable production constraints in different ecologies of
Pakistan
To understand the role of commission agents in formal and informal vegetable markets
To identify the vegetable seed marketing system and the role of seed dealers in supporting
vegetable growers
1.3 Presentation Plan
Information was collected from three key players in vegetable value chains: vegetable growers
(growers), commission agents (agents), and vegetable seed dealers (dealers). Results will be presented
for each of these groups, and an overview of growers’ vegetable handling practices will precede a
discussion of the activities of the other value chain players.

3
Chapter 2: Methodology
2.1 Research Methodology The AIP vegetable component has three sub-components: protected cultivation of vegetables, improved
mungbean production, and vegetable value chains. This baseline study was conducted to provide a
preliminary understanding of key vegetable value chains using a questionnaire translated into Urdu.
The questionnaire consisted of module 1 [vegetable growers (growers)], module 2 [commission agents
(agents)], and module 3 [seed dealers (dealers)]. Growers were those who are growing fresh vegetables
(e.g. onion, tomato, chilies, okra, and peas) and/or vegetable seed growers in the project areas. Agents
facilitate growers in selling their vegetables through an open bidding process (in which they are
specialized) at their respective wholesale markets. They do not conduct bidding for other commodities.
However, they assist vegetable growers in facilitating the supply of inputs (e.g. seed and fertilizers) and
act as lending agents. Dealers are those who mainly sell vegetable seed to the growers, though they also
may deal in fertilizers and pesticides.
These modules were pretested in the field and amended accordingly. Ten enumerators were selected
throughout the country. Their selection was based on familiarity with their respective wholesale market
areas and experience in conducting formal surveys. One enumerator each was selected from
Bahawalpur, Gujranwala, Faisalabad, Kunri, and Karachi areas, whereas two each were selected from
Swat and Quetta areas. All of the enumerators were provided with training in direct one-on-one
interview sessions with the consultant at their respective wholesale market locations, except for those
who collected data sets at the Kunri and Karachi wholesale markets. Their training sessions were
conducted over extended telephone conversations. The questionnaires were sent to them in advance,
and they were asked to go through them. Each question was explained, clarified, and discussed over the
phone. All enumerators had between 9 and 16 years’ experience in the field of social science research.
All enumerators were sent to their respective wholesale markets to fill in three schedules to pre-test
them, which were then discussed. The schedules were modified, improved, and finalized after
pretesting. Data for growers, agents, and dealers were collected from fresh vegetable markets. However,
some seed dealers were interviewed at their businesses, which were located in the centers of cities or
towns. The distribution of the respondents is provided in Table 1. The data was edited and cleaned after
entering in SPSS and Microsoft Excel Sheets for analysis.

4
Table 1: Distribution of Key Value Chain Players by Province
Provinces
Vegetable Value Chain Players Total Vegetable
Growers Commission
Agents Seed Dealers
Balochistan 5 5 5 15
KPK 20 21 21 62
Punjab 34 37 36 107
Sindh 15 13 10 38
Pakistan 74 76 72 222
Vegetable production in Pakistan is highly diverse and localized in pockets of production, and the work
of this sub-project is focused on six production clusters of locally similar vegetable value chain activities
including seed production. These clusters are situated in different regions and there may be more than
one cluster per province. For example, Cluster 3 (Chenab) is located in the central Punjab rice belt in
the Sheikhupura, Chiniot and Faisalabad districts, while Cluster 4 (ARCO) is in the south Punjab cotton
belt in the Pakpattan district (Annex I). The study focused on five major vegetables; tomato, onion,
chili, okra and peas, but these vegetables are not grown in all clusters. The selection of respondents
sought to be representative of activities within each cluster, but because of the diversity of production
systems, the results cannot be generalized to the whole country. Instead, the results need to be seen as
generalizations across a series of six localized case studies.
Approximately 2000 growers, agents, and dealers operate in the targeted clusters and 222 respondents
were randomly selected for data collection. Agent and dealer respondents were selected from nine
markets; either from one of the eight large wholesale provincial fresh vegetable markets or from the 20
smaller wholesale markets operating within the target clusters.
Important information assessed included marketing channels, vegetable prices, the varieties of open
pollinated and hybrid vegetables used, and sources of seed. The handling of vegetable seed and fresh
produce preharvest, during harvest, and postharvest was assessed. Activities evaluated included
harvesting and picking, grading, packing, transporting, commissioning / bidding, the mode of payment,
and financial assistance available to different actors in the value chains.
5
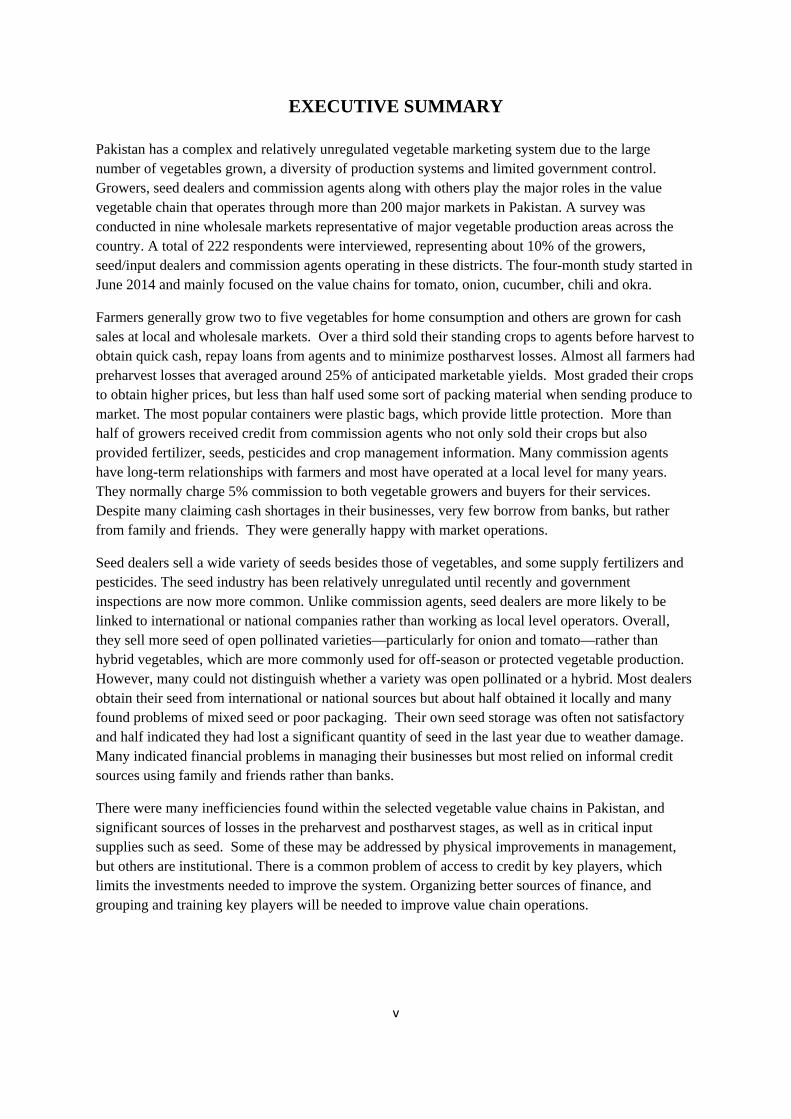
Figure 1: Grading vegetables in vegetable market
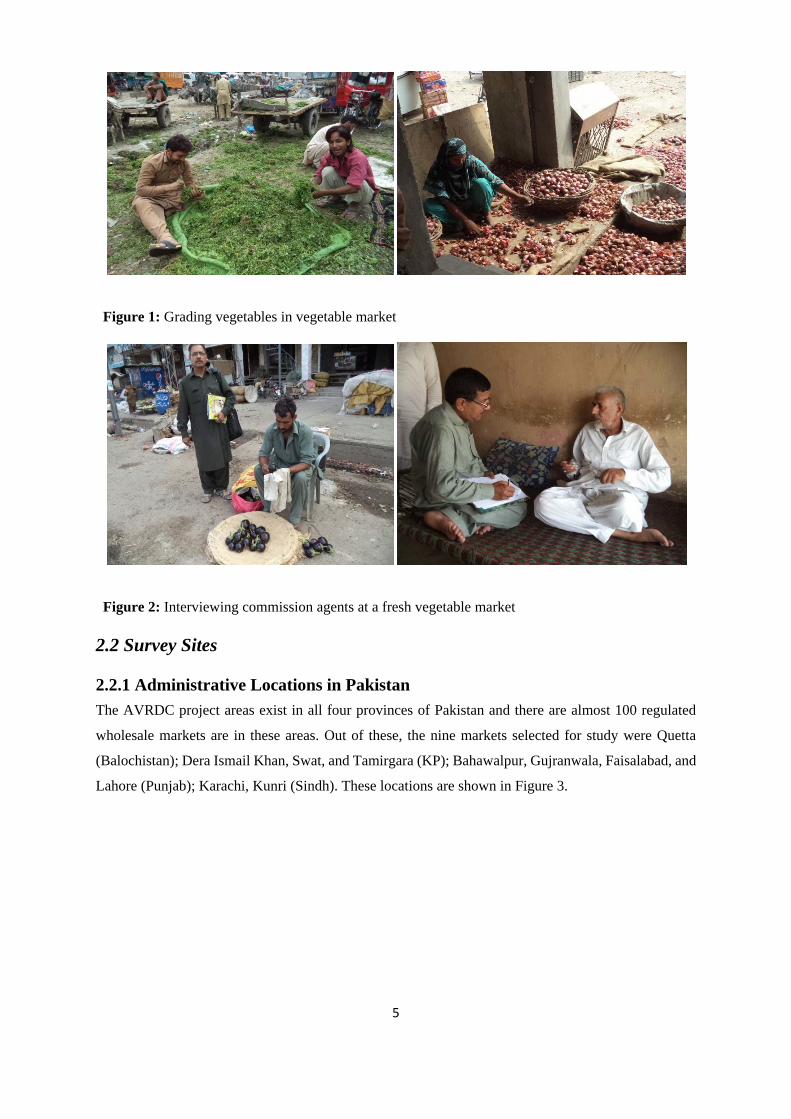
Figure 2: Interviewing commission agents at a fresh vegetable market
2.2 Survey Sites
2.2.1 Administrative Locations in Pakistan
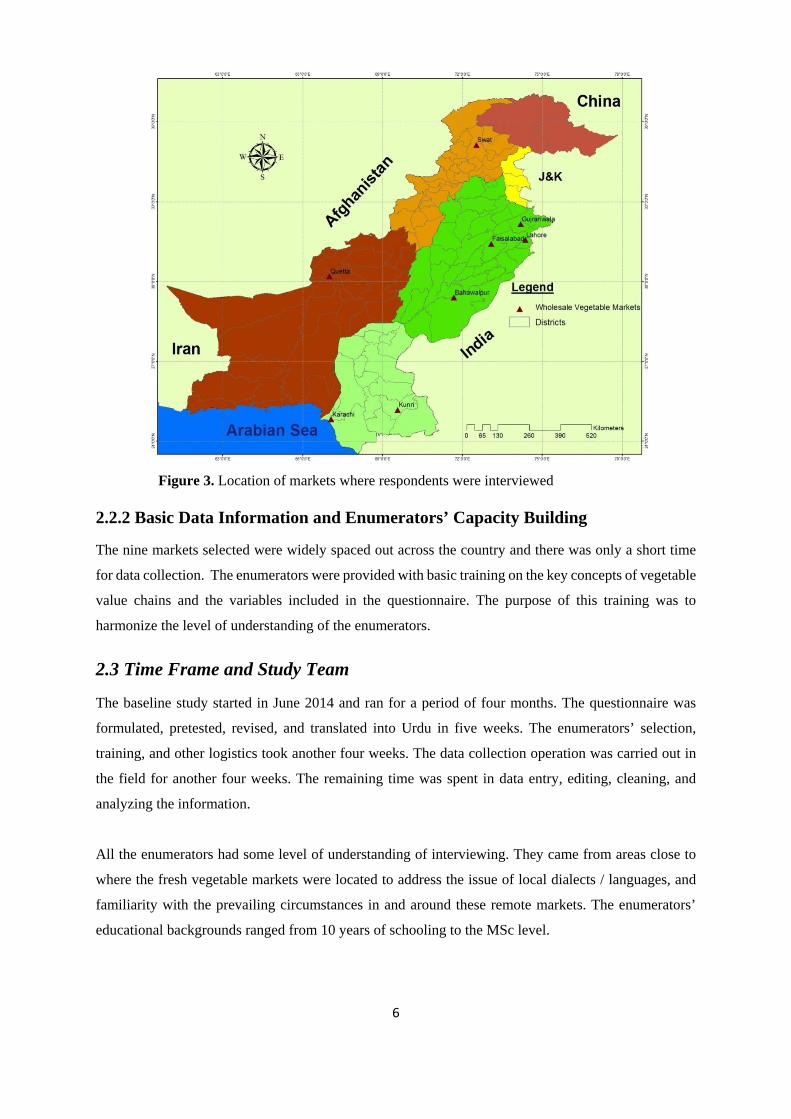
The AVRDC project areas exist in all four provinces of Pakistan and there are almost 100 regulated
wholesale markets are in these areas. Out of these, the nine markets selected for study were Quetta
(Balochistan); Dera Ismail Khan, Swat, and Tamirgara (KP); Bahawalpur, Gujranwala, Faisalabad, and
Lahore (Punjab); Karachi, Kunri (Sindh). These locations are shown in Figure 3.
6
Figure 3. Location of markets where respondents were interviewed
2.2.2 Basic Data Information and Enumerators’ Capacity Building
The nine markets selected were widely spaced out across the country and there was only a short time
for data collection. The enumerators were provided with basic training on the key concepts of vegetable
value chains and the variables included in the questionnaire. The purpose of this training was to
harmonize the level of understanding of the enumerators.
2.3 Time Frame and Study Team
The baseline study started in June 2014 and ran for a period of four months. The questionnaire was
formulated, pretested, revised, and translated into Urdu in five weeks. The enumerators’ selection,
training, and other logistics took another four weeks. The data collection operation was carried out in
the field for another four weeks. The remaining time was spent in data entry, editing, cleaning, and
analyzing the information.
All the enumerators had some level of understanding of interviewing. They came from areas close to
where the fresh vegetable markets were located to address the issue of local dialects / languages, and
familiarity with the prevailing circumstances in and around these remote markets. The enumerators’
educational backgrounds ranged from 10 years of schooling to the MSc level.

7
2.4 Data Analyses and Results Presentation
The data were entered, edited, cleaned and analyzed using SPSS and Microsoft Excel Software. The
results presented in the subsequent chapters focus on vegetable growers, commission agents, and seed
dealers.
Chapter 3: Farmers’ Marketing Practices and Perceived Sources of Losses
3.1 Where and How Vegetables are Sold
In Pakistan, almost all vegetable growers plant more than one vegetable, grow crops over several
seasons, and may use several different types of cultivation method. In the AVRDC project areas,
farmers generally grow two to five vegetables for home consumption and others are grown for cash
sales at local and wholesale markets. Results presented in Table 2 indicate that farmers sold their
vegetables in diverse locations including in the field before harvest, at village shops and local markets,
in the nearest wholesale vegetable markets and at distant wholesale vegetable markets. The percentages
add up to 175, indicating that three-quarters of farmers sold their produce to more than one outlet.
Local markets were the most popular sales outlet for growers with just under two-thirds selling there.
The next most popular outlet for more than half were the nearest wholesale markets. Almost a fifth sold
to distant wholesale markets, which may provide better market prices than local outlets.
Over a third sold their crops before harvest while they were still standing in the fields. The main reasons
for preharvest selling of vegetables were repayment of credit taken from commission agents, to
minimize the risk of late pest and disease damage, to get early cash payment, or to solve the difficulty
of getting timely labor for harvesting.
Generally, growers with the smallest landholdings sold vegetables to their village shop, as they may
have had a very limited amount of produce to sell, or did not anticipate recovering the transportation
costs to local or wholesale markets given abrupt fluctuations in vegetables prices. However the very
low percentage of those surveyed who admitted selling to a local village shop may have been because
interviews were conducted at wholesale markets, which biased results towards larger growers and those
who were prepared to travel considerable distances to sell their crops.

8
Table 2: Proportion of Vegetables Sold by Farmers to Different Buyers
Vegetables Selling Information Yes (%)
Sold Vegetables at Local Market 63
Sold Vegetables at Nearest Wholesale Market 56
Sold Vegetables Before Harvest 36
Sold Vegetables at Long Distance Wholesale Market 19
Sold Vegetables at Village Shop 1
3.2 Preharvest, Harvest, and Postharvest Losses
Vegetables have to go through several stages before reaching the hands of consumers, and the quality
of the final product can be affected by physical, biological, and social factors. For example, selection
of varieties (hybrid or open pollinated), deviation from the right planting time, and the decision to start
harvesting are some of the important factors determined by the vegetable grower. Pests and diseases,
poor weather, and labor available for harvesting can also affect vegetable yields.
An effort has been made to understand the farmers’ actions and strategy in minimizing vegetable losses
before, during, and after harvest. Growers attributed preharvest losses to several causes, while harvest
and postharvest losses were primarily attributed to labor issues. The information is presented in Tables
3 and 4.
Table 3: Preharvest, Harvest and Postharvest Losses
When vegetable losses occur Percent of farmers
acknowledging losses
Estimated percent loss
of expected yield
Before harvest* 97 25
During harvest 74 5
After harvest 18 34
NOTE: The percent responses (in each row) are based on a total number of 74 observations. The column totals will not add up to 100 due to multiple responses by the respondents.
Figure 4. Packing tomatoes on the roadside in Samaro, Sindh.
9
Almost all farmers admitted to losses that occurred before harvest and they estimated these at an average
of 25% loss of anticipated yields. These losses are comparable to those estimated in earlier studies
(PHDEB, 2007). Perhaps because they felt they had more control over these losses, they were also able
to attribute the main causes (Table 4). In general, the major causes of preharvest losses are diseases,
pests, natural disasters, market price fluctuations, lack of labor, and bad weather conditions during
growing and harvesting (Khan et al., 2008 and Zaldivar, 1991). Almost three-quarters of growers (74%)
also perceived losses during harvesting, and they mainly attributed this to the labor involved for the
purpose. It was interesting to note that a small number of farmers (18%) indicated vegetable losses
immediately after harvesting and before transportation to markets. Transportation losses are elaborated
in other sections.
Table 4: Growers’ Perceptions for Losses Before Harvesting**
Vegetables losses due to Percent of farmers
acknowledging losses
Estimated percent loss
of expected yield
Diseases 75 15
Bad weather 75 23
Insects / pests 70 15
Disasters 66 36
Low price 44 12
Lack of labor 34 18
NOTE: The percent responses (in each row) are based on a total number of 74 observations. The column totals will not add up to 100 due to multiple responses / activities of the respondents.** Questions on topics in column 1 were asked independently and separately.
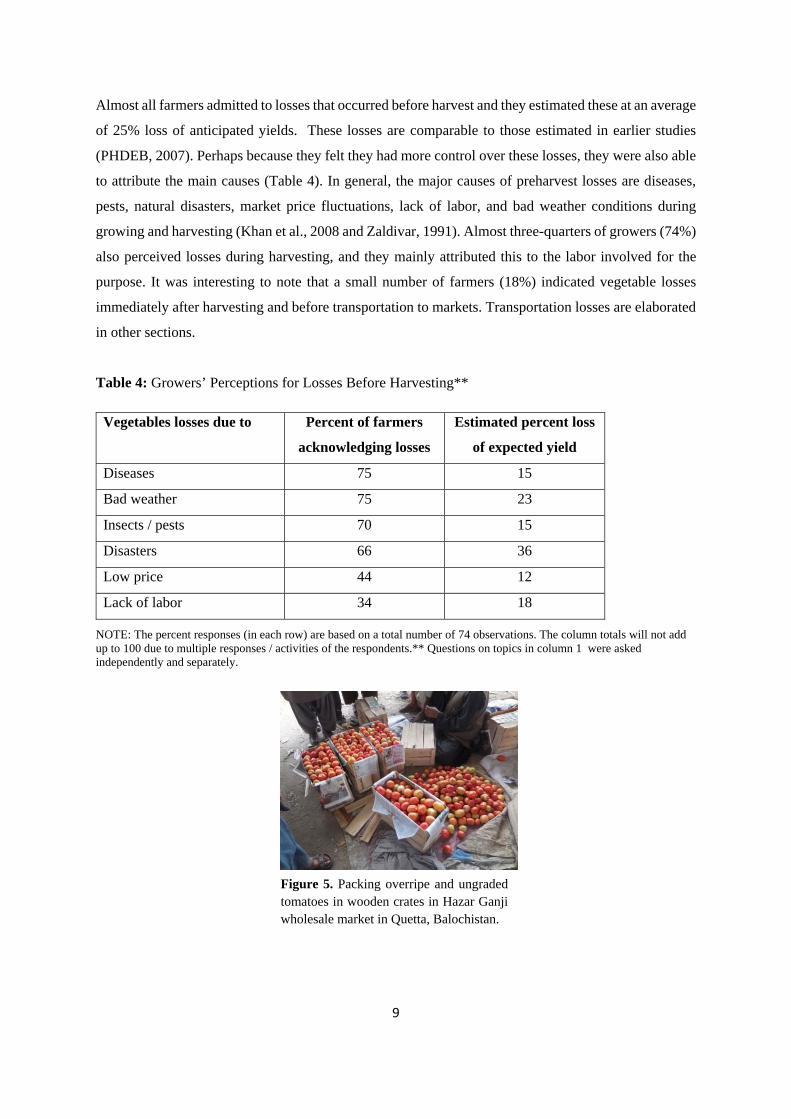
Figure 5. Packing overripe and ungraded tomatoes in wooden crates in Hazar Ganji wholesale market in Quetta, Balochistan.

10
The most commonly recognized sources of preharvest losses were insect pests and diseases along with
poor weather conditions, market uncertainties and natural disasters. Natural disasters were regarded
almost as common a cause of losses as from insects and diseases combined. There also may be some
overlap in definitions of bad weather or disasters. One storm may be a disaster for one grower, but just
bad weather for his neighbor. Poor prices were recognized as a major source of losses, and 12% of crops
were not sent to market. A third of farmers blamed a lack of labor for losses and this exceeded the
estimates for losses from either insects or disease. However, it is much easier to estimate losses in the
field from a lack of labor at the right time. It is much harder to estimate losses due to insects or diseases
that may have occurred early in the crop. Overall, the results indicate a very high degree of risk involved
in vegetable production from factors that many farmers may believe are beyond their control.
3.3MarketingChannels
3.3.1 Markets and Sales Channels
The agro-climatic conditions of Pakistan range from tropical to temperate, allowing the production of
40 different kinds of vegetables across the country (Raja and Khokhar, 1993). These vegetables are sold
in formal and informal markets and the marketing system is complex and problematic for farmers. The
number of vegetables grown, local geography and sociopolitical situations in the markets are also
important. Moreover, the traditional marketing system has poor farm-to-market infrastructure, improper
handling, high transportation costs, lack of refrigerated transportation, the high cost of packing
materials, and poor grading and packing. Other important factors include low prices and fluctuations in
market prices, poor access to market information, preharvest or postharvest technologies, and limited
access to financial resources. Unfortunately, the majority of these factors are biased against the interests
of vegetable growers, particularly to smallholder farmers with less than 5 ha (Bourne, 1986 and Kader,
1992).
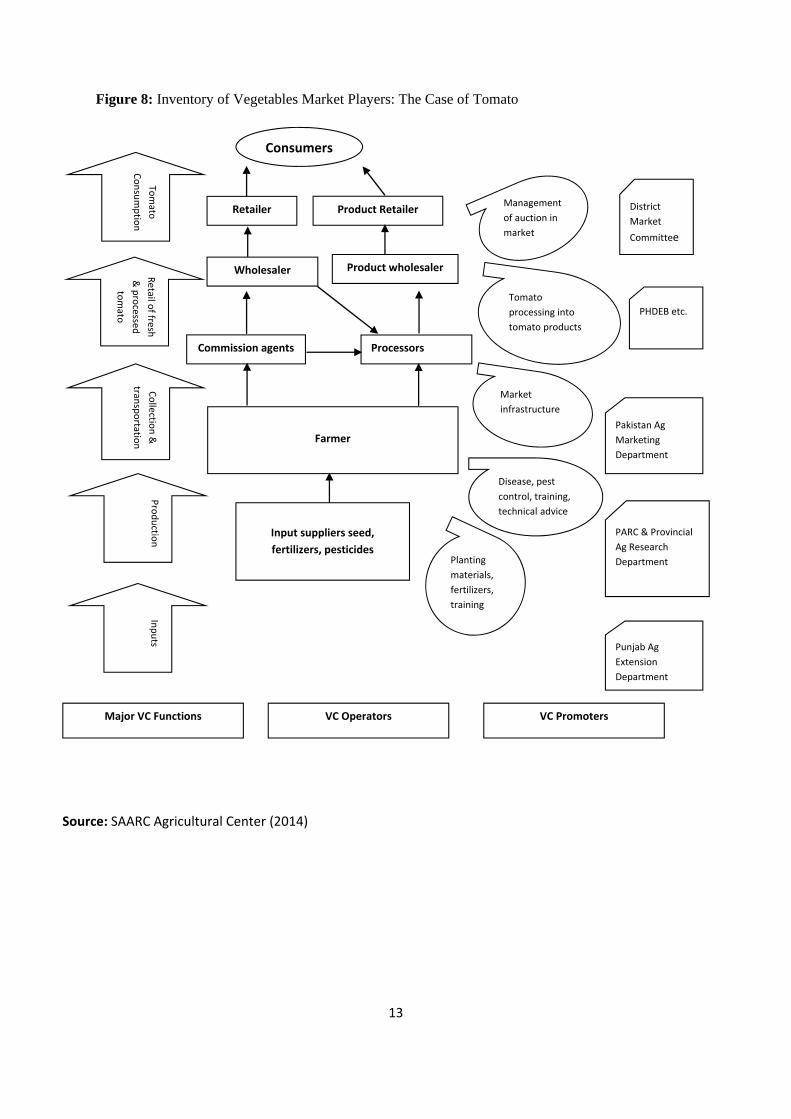
Interviews were conducted with respondents in local, wholesale, and terminal markets. The vast
majority of vegetable produce goes through a complex series of steps involving vegetable growers,
contractors, commission agents, wholesalers, inter-market traders / retailers, processors, and exporters
(Figure 6). These intermediaries’ dominate the marketing system, which leave little scope of
intervention for vegetable growers to directly deal with consumers, as the example of tomato shows in
Figures 7 and 8.

11
Figure 6: Marketing Channels in Pakistan

12
Figure 7: Marketing Channels: The Case of Tomato
1%
CA Wholesale
Other Markets
Commission agent
17% 15% 67%
100%
Local
2%
22% 74% 2%
Wholesaler
99%
Channel-1 Growers
Retailers at
nationalm
Tomato Consumers (Fresh, Products)
Product
Product wholesaler
Processors
1%
Channel-2 Growers
Source: SAARC Agricultural Center (2014)
13
Figure 8: Inventory of Vegetables Market Players: The Case of Tomato
Source: SAARC Agricultural Center (2014)
Consumers
Tomato
Consumption
Retail of fresh &
processed tom
ato
Collection &
transportation
Production Inputs
Retailer Product Retailer
Wholesaler Product wholesaler
Commission agents Processors
Farmer
Input suppliers seed, fertilizers, pesticides
VC Operators
Management of auction in market
Tomato processing into tomato products
Market infrastructure
Disease, pest control, training, technical advice
Planting materials, fertilizers, training
District Market Committee
PHDEB etc.
Pakistan Ag Marketing Department
PARC & Provincial Ag Research Department
Punjab Ag Extension Department
VC Promoters Major VC Functions
14
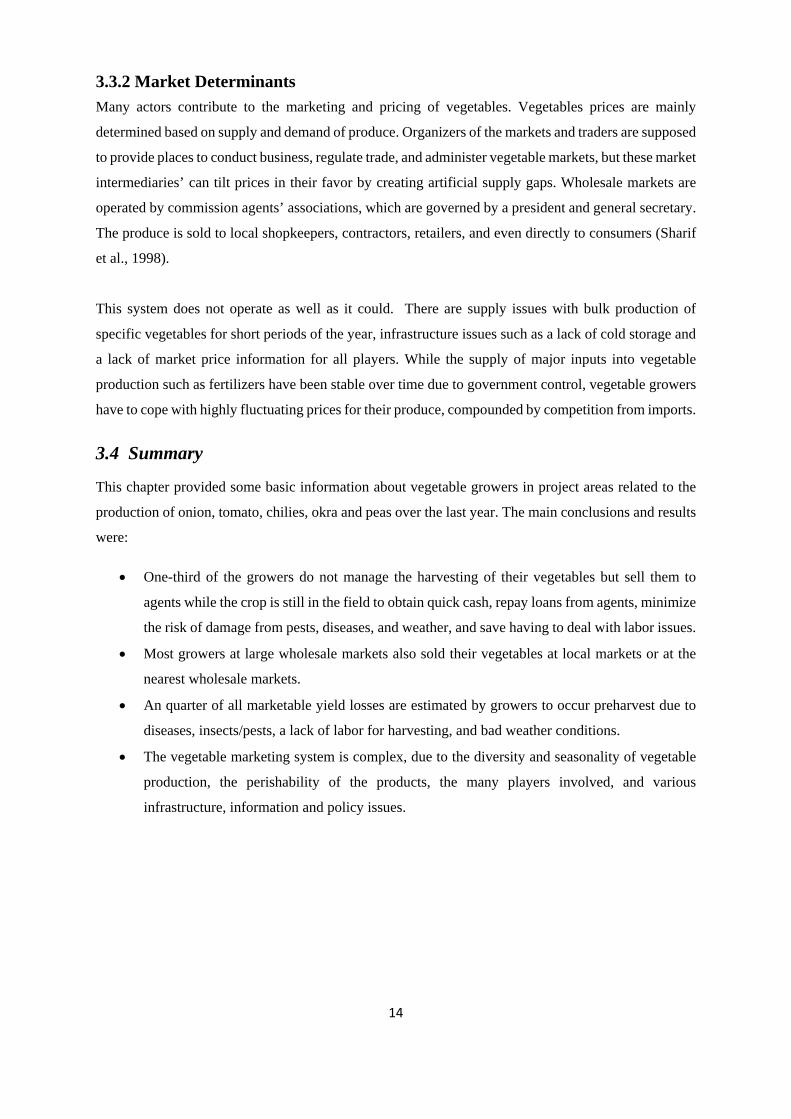
3.3.2 Market Determinants
Many actors contribute to the marketing and pricing of vegetables. Vegetables prices are mainly
determined based on supply and demand of produce. Organizers of the markets and traders are supposed
to provide places to conduct business, regulate trade, and administer vegetable markets, but these market
intermediaries’ can tilt prices in their favor by creating artificial supply gaps. Wholesale markets are
operated by commission agents’ associations, which are governed by a president and general secretary.
The produce is sold to local shopkeepers, contractors, retailers, and even directly to consumers (Sharif
et al., 1998).
This system does not operate as well as it could. There are supply issues with bulk production of
specific vegetables for short periods of the year, infrastructure issues such as a lack of cold storage and
a lack of market price information for all players. While the supply of major inputs into vegetable
production such as fertilizers have been stable over time due to government control, vegetable growers
have to cope with highly fluctuating prices for their produce, compounded by competition from imports.
3.4 Summary
This chapter provided some basic information about vegetable growers in project areas related to the
production of onion, tomato, chilies, okra and peas over the last year. The main conclusions and results
were:
One-third of the growers do not manage the harvesting of their vegetables but sell them to
agents while the crop is still in the field to obtain quick cash, repay loans from agents, minimize
the risk of damage from pests, diseases, and weather, and save having to deal with labor issues.
Most growers at large wholesale markets also sold their vegetables at local markets or at the
nearest wholesale markets.
An quarter of all marketable yield losses are estimated by growers to occur preharvest due to
diseases, insects/pests, a lack of labor for harvesting, and bad weather conditions.
The vegetable marketing system is complex, due to the diversity and seasonality of vegetable
production, the perishability of the products, the many players involved, and various
infrastructure, information and policy issues.

15
Chapter 4: Vegetable Growers
4.1 Status of Vegetable Seed Production
Growers were asked about the vegetable seed they used. Most farmers (62%) depended on external
sources of seed for the next growing season. Any hybrids used came from external sources. Another
reason for the reliance on external sources could be a lack of pure and high quality seed of open
pollinated varieties for growers’ own production. However, a significant number of farmers grew their
own seed of the target crops. Average areas of seed production for each farmer are shown in Table 5:
Table 5: Growers’ Area Allocation for Seed Production
Vegetables % of farmers growing their own seed
Area under seed production (kanals)
Onion 19 2
Okra 15 4
Tomato 14 2
Chilies 7 8
NOTE: The percent responses (in each row) are based on a total number of 74 observations. The column totals will not add up to 100 due to multiple responses / activities of the respondents. 1 Kanal = 490 square meters approximately.
Growers were asked about their own seed production for tomato, onion, chilies, and okra. These
vegetables were grown in the cluster areas for seed production. Onion growers were more dependent
on producing their own seed than chili growers. This may have been due to a higher reliance on hybrid
chili varieties. While over 60% of growers relied on external seed sources, more than a third produced
their own seed. However, the areas grown were small (1000 – 4000 m2) despite the growers having a
range of small, medium and large holdings; this indicates that seed was being produced more for
meeting personal or perhaps local needs than to supply any national market. Other reasons for the lack
of interest and the small amount of local seed production could be a lack of high yielding open pollinated
vegetable varieties, a lack of expertise in vegetable seed production, poorly developed markets for open
pollinated vegetable seed and low prices for seed.
The seed area under chilies was highest at 8 kanals (0.4 ha), which may be due to localized seed
production in one pocket of Sind province where chili is a major crop. Another reason is a better
marketing system due to collaboration between several private-public agencies in that part of the
country. This indicates the potential to increase national seed production of other popular vegetables.
Table 5 reveals that all these vegetables have great scope for seed production in the country, while
cucumber has highest scope among them in terms of highest seed production.

16
4.2 Fresh Vegetable Production
Almost all vegetable growers interviewed grew fresh vegetables or vegetable seeds, but not usually on
the same farm or at the same time. Some grew fresh vegetables, and others grew vegetables for seed
only. The areas of the target vegetables grown were similar on farms throughout the country, and fell
within a narrow range of 12-16 kanals (about 0.6 – 0.8 ha). Based on the available cultivable area for
vegetables across the nation, most vegetable professionals believe there is potential to increase the
productivity of fresh vegetables without making a major shift in the existing cropping systems but with
increased use of IPM and improved crop management techniques. Most farmers interviewed also
believed that vegetable production could be expanded to other areas of the country depending upon the
suitability of land and market opportunities. The question remains whether the risks in vegetable
production shown in Table 4 are so high that they encourage growers to produce only small areas of
any one crop to spread out their risks. The production of fresh vegetables along with areas under various
vegetables are presented in Table 6.
Table 6: Growers’ Area Allocation for Fresh Vegetable Production
Vegetables % of growers producing
fresh vegetables
area under fresh vegetables
(kanals)
Tomato 59 15
Okra 56 12
Onion 55 16
Chilies 52 13
NOTE: The percent responses (in each row) are based on a total number of 74 observations. Column totals will not add up to 100 due to multiple responses / activities of the respondents. 1 Kanal = 490 square meters approximately.
4.3 Grading Fresh Vegetables Farmers were asked about their vegetable grading, and the levels of grades. Eighty-two percent of
growers graded their produce. Among this group, 84 and 81% graded into first, and second classes
respectively. First class meant that only high quality produce was separated for transport to the markets,
and the remainder was not sold. However, it was consumed locally by household members or by the
community. With second-class grading, the remaining produce was sold, but at a lower price. Seventy-
seven percent of farmers also indicated in their responses that grading brought them high prices. Results
in Table 7 indicate that a large majority of vegetable growers were aware of this important value chain
activity, and were using it to fetch better prices. However, considering that the sample of growers
interviewed were those who could be found in large wholesale markets where there would be the best
selection of buyers available, this preference for grading is not unexpected.
17
Table 7: Growers’ Level of Grading and Expected Benefits Growers Information about Grading Yes (%)
Graded their Vegetables 82
Graded their Vegetables into Class 1 84
Graded their Vegetables into Class 2 81
Graded their Vegetables into Class 3 21
Graded their Vegetables into Class 4 3
Obtained Higher Prices due to Grading 77
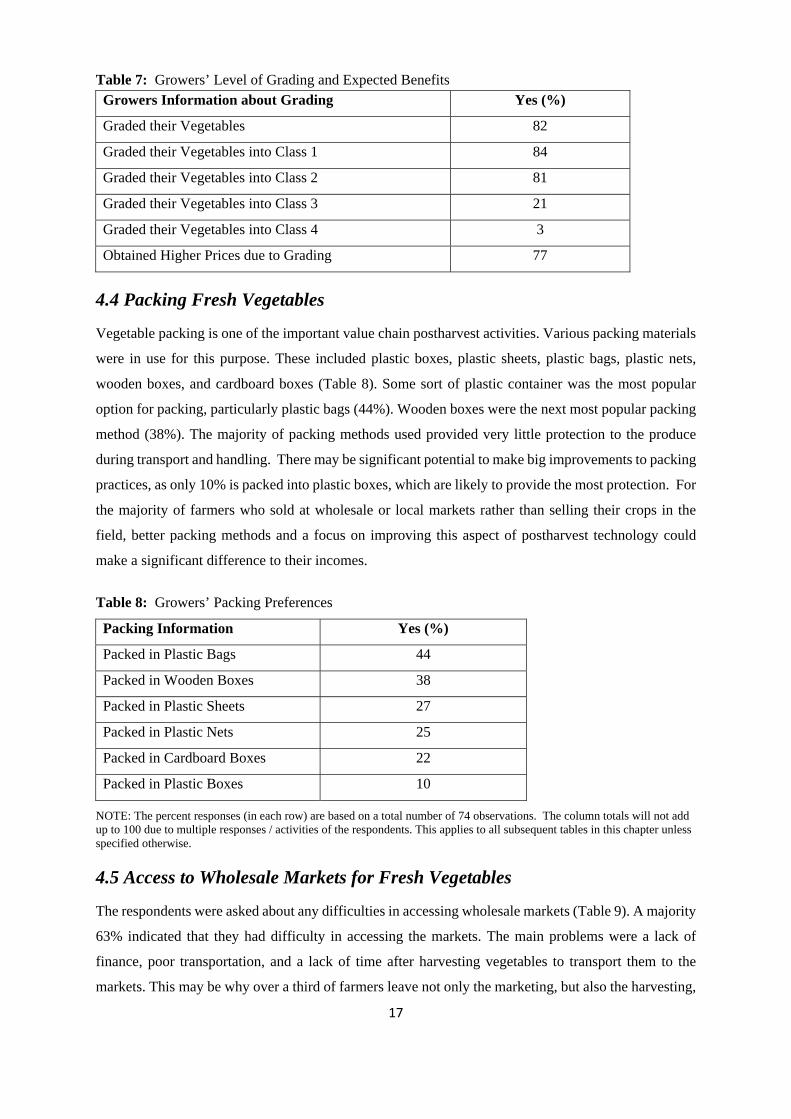
4.4 Packing Fresh Vegetables
Vegetable packing is one of the important value chain postharvest activities. Various packing materials
were in use for this purpose. These included plastic boxes, plastic sheets, plastic bags, plastic nets,
wooden boxes, and cardboard boxes (Table 8). Some sort of plastic container was the most popular
option for packing, particularly plastic bags (44%). Wooden boxes were the next most popular packing
method (38%). The majority of packing methods used provided very little protection to the produce
during transport and handling. There may be significant potential to make big improvements to packing
practices, as only 10% is packed into plastic boxes, which are likely to provide the most protection. For
the majority of farmers who sold at wholesale or local markets rather than selling their crops in the
field, better packing methods and a focus on improving this aspect of postharvest technology could
make a significant difference to their incomes.
Table 8: Growers’ Packing Preferences
Packing Information Yes (%)
Packed in Plastic Bags 44
Packed in Wooden Boxes 38
Packed in Plastic Sheets 27
Packed in Plastic Nets 25
Packed in Cardboard Boxes 22
Packed in Plastic Boxes 10
NOTE: The percent responses (in each row) are based on a total number of 74 observations. The column totals will not add up to 100 due to multiple responses / activities of the respondents. This applies to all subsequent tables in this chapter unless specified otherwise.
4.5 Access to Wholesale Markets for Fresh Vegetables
The respondents were asked about any difficulties in accessing wholesale markets (Table 9). A majority
63% indicated that they had difficulty in accessing the markets. The main problems were a lack of
finance, poor transportation, and a lack of time after harvesting vegetables to transport them to the
markets. This may be why over a third of farmers leave not only the marketing, but also the harvesting,

18
of their crops to others. Such difficulties make it less likely that farmers will deal with consumers or
buyers directly and more likely that they will not receive adequate returns for their investment in
growing the crops.
Table 9: Growers’ Difficulties in Accessing Markets
Access to Markets Yes (%)
Difficulty in Accessing the Markets due to Weather 63
Financial Difficulty in Accessing the Markets 37
Transportation Difficulty in Accessing the Markets 30
Lack of Time Difficulty in Accessing the Markets 14
Other Difficulties in Accessing the Markets 1
The majority indicated that weather hinders vegetable transportation to markets. Weather also causes
significant losses before harvest, since about two-thirds of growers claimed that weather disasters before
harvest reduced their expected yields by around 36% and a third claimed that a lack of labor at harvest
reduced yields by 18% (Table 4). Clearly, weather has a major impact on returns both before and after
harvest. Rain that makes roads impassable and reduce access to markets at a critical time can have a
big impact on returns. Perhaps farmers do not feel ownership of that impact once the produce leaves
their farm, or conceptualize that impact as an on-farm labor problem.
4.5 Satisfaction about Facilities at the Marketplace
Table 10 shows respondents’ approval about the facilities they have to use at the marketplace. A large
majority (85-94%) indicated satisfaction in regard with the essential procedures / facilities available to
them at the wholesale market. They were happy about the space, auction procedures and getting
reasonable prices. However, a considerable proportion were dissatisfied with the weighing procedures
available in the vegetable markets.

19
Table 10: Growers’ Satisfaction about Facilities at Wholesale Marketplaces
Vegetable Growers Information Yes (%)
Satisfaction with Overall Facilities Available at the Marketplace 94
Satisfaction about Space at the Marketplace 85
Satisfaction about Auction Procedure at the Marketplace 89
Satisfaction about Getting a Reasonable Price at the Marketplace 79
Satisfaction about Weight (Scale) Procedures at the Marketplace 25
Satisfaction about Getting the Worst Price at the Marketplace 8
Satisfaction about Getting a Desired Price at the Marketplace 4
4.6 Mode of Payments from Commission Agents
The vegetable growers were asked about the mode of payments when they bring their produce into the
wholesale markets. Most growers received cash upon the sale of their vegetables. A small group of
growers (19%) used the option of credit (part or in full) obtained from the commission agents. This
means some farmers made partial repayment of loans from the agents, while some took part payment
of total payable cash and left the remaining amount for later collection. A similar percentage of agents
and growers were able to make transactions at the time they wanted. Table 11 provides information
about the mode of payments between growers and agents.
Table 11: Growers’ Mode of Payments from Commission Agents
Mode of Payments Yes (%)
Received Cash Payment (Full or Part) 75
Used Credit Facility (Full or Part) 19
Received Payment on Their Own Will 11
Received Payment at Commission Agents’ Will 10
4.7 Satisfaction About Commission Agents’ Behavior
Overall results reveal that a significant percentage of sample farmers were satisfied when dealing with
commission agents in the markets. The question of their satisfaction was bifurcated to probe the role
of commission agents in the fresh vegetable market. Among the respondents 94, 88, and 82 %
reported the commission agent’s personal behavior, vegetable sale behavior, and cash payment
behavior as positive (Table 12).

20
Table 12: Vegetable Growers’ Satisfaction about Commission Agents’ Behavior
Satisfied with Commission Agents’ Behavior Yes (%)
Overall Behavior 94
Personal Behavior 94
Vegetable Sale Behavior 88
Cash Payment Behavior 82
Other Behavior 3
4.8 Credit from Commission Agents
Table 13 provides information about credit dealings between growers and commission agents. In some
cases, these relationships had been going for up to 30 years. Almost two-thirds of growers had received
credit from agents during recent years. About a fifth of growers (21%) were free from any outstanding
debt, and repaid full credit received. However, about two-thirds were not able to pay back their loans
to agents, an indicator of their poor household status. About half repaid their credit in part or in full
with the proceeds of the sale of their vegetables. Only 3% of growers defaulted, but this may be under-
reported because it is considered to have negative social connotations.
Table 13: Vegetables Growers’ Credit Dealings with Commission Agents
Growers’ Credit Dealings Yes (%)
Received Credit from Agents 64
Returned Credit to Agents 21
Returned Credit with Proceeds of Vegetables to Agents 49
Who Did Not Return Credit to Agents 3
Returned Credit Using Other Ways 0
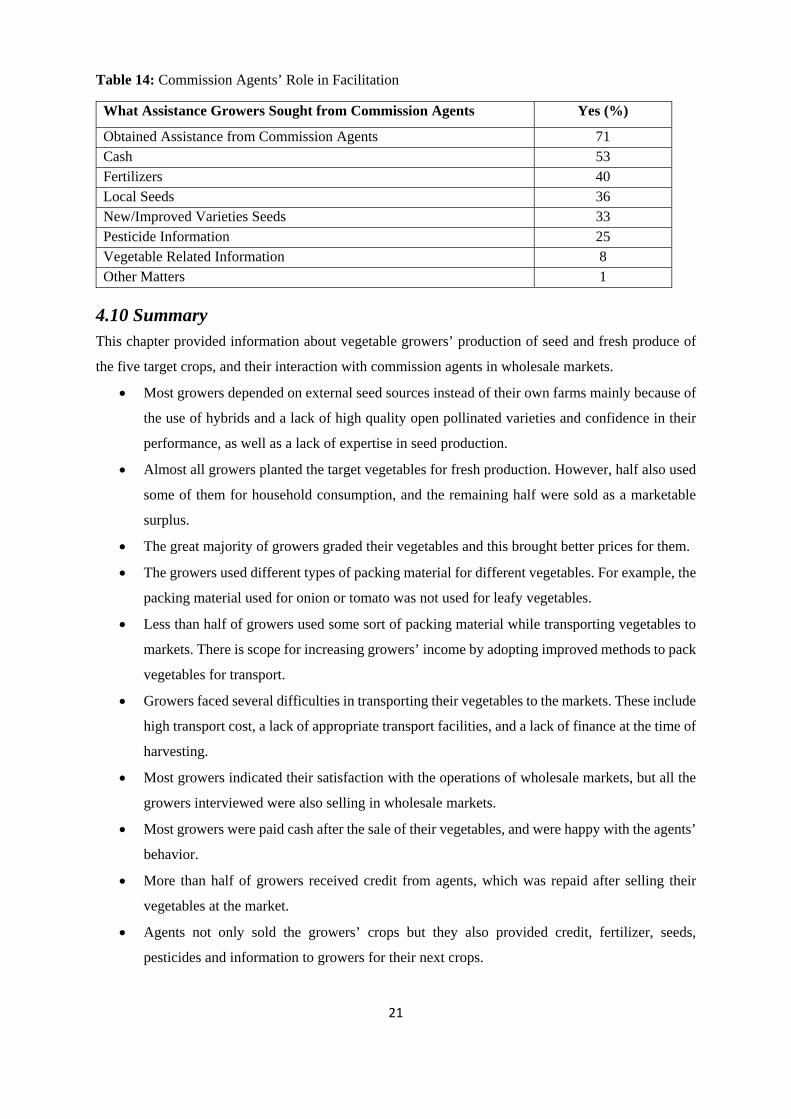
4.9 Commission Agents’ Role in Facilitation
The commission agents play many roles in vegetable markets (Table 14). They make a living by
facilitating the sale of produce for growers. They also provide technical information to vegetable
growers, help to meet their household cash requirements, and can provide seed, new/improved varieties,
fertilizers, and pesticides. Most vegetable growers relied on them for more than just selling their
produce—in particular, for credit and inputs to grow their next crop.
21
Table 14: Commission Agents’ Role in Facilitation
What Assistance Growers Sought from Commission Agents Yes (%)
Obtained Assistance from Commission Agents 71 Cash 53 Fertilizers 40 Local Seeds 36 New/Improved Varieties Seeds 33 Pesticide Information 25 Vegetable Related Information 8 Other Matters 1
4.10 Summary This chapter provided information about vegetable growers’ production of seed and fresh produce of
the five target crops, and their interaction with commission agents in wholesale markets.
Most growers depended on external seed sources instead of their own farms mainly because of
the use of hybrids and a lack of high quality open pollinated varieties and confidence in their
performance, as well as a lack of expertise in seed production.
Almost all growers planted the target vegetables for fresh production. However, half also used
some of them for household consumption, and the remaining half were sold as a marketable
surplus.
The great majority of growers graded their vegetables and this brought better prices for them.
The growers used different types of packing material for different vegetables. For example, the
packing material used for onion or tomato was not used for leafy vegetables.
Less than half of growers used some sort of packing material while transporting vegetables to
markets. There is scope for increasing growers’ income by adopting improved methods to pack
vegetables for transport.
Growers faced several difficulties in transporting their vegetables to the markets. These include
high transport cost, a lack of appropriate transport facilities, and a lack of finance at the time of
harvesting.
Most growers indicated their satisfaction with the operations of wholesale markets, but all the
growers interviewed were also selling in wholesale markets.
Most growers were paid cash after the sale of their vegetables, and were happy with the agents’
behavior.
More than half of growers received credit from agents, which was repaid after selling their
vegetables at the market.
Agents not only sold the growers’ crops but they also provided credit, fertilizer, seeds,
pesticides and information to growers for their next crops.
22
Chapter 5: Commission Agents
5.1 The Role of Commission Agents In Pakistan, vegetable growers sell their produce at several types of markets. Wholesale markets
operating in towns and cities are among the most important, and most growers transport their fresh
vegetables to sell at these venues. The vegetables are sold to the retailers (or sometimes to consumers
directly) in a process of open bidding. Commission agents play a vital role in managing this process.
The commission agents receive a percent cash amount from sellers for their services, termed as a
commission fee. This chapter provides a summary of their roles in facilitating the supply of fresh
vegetables from farm gate to consumers.
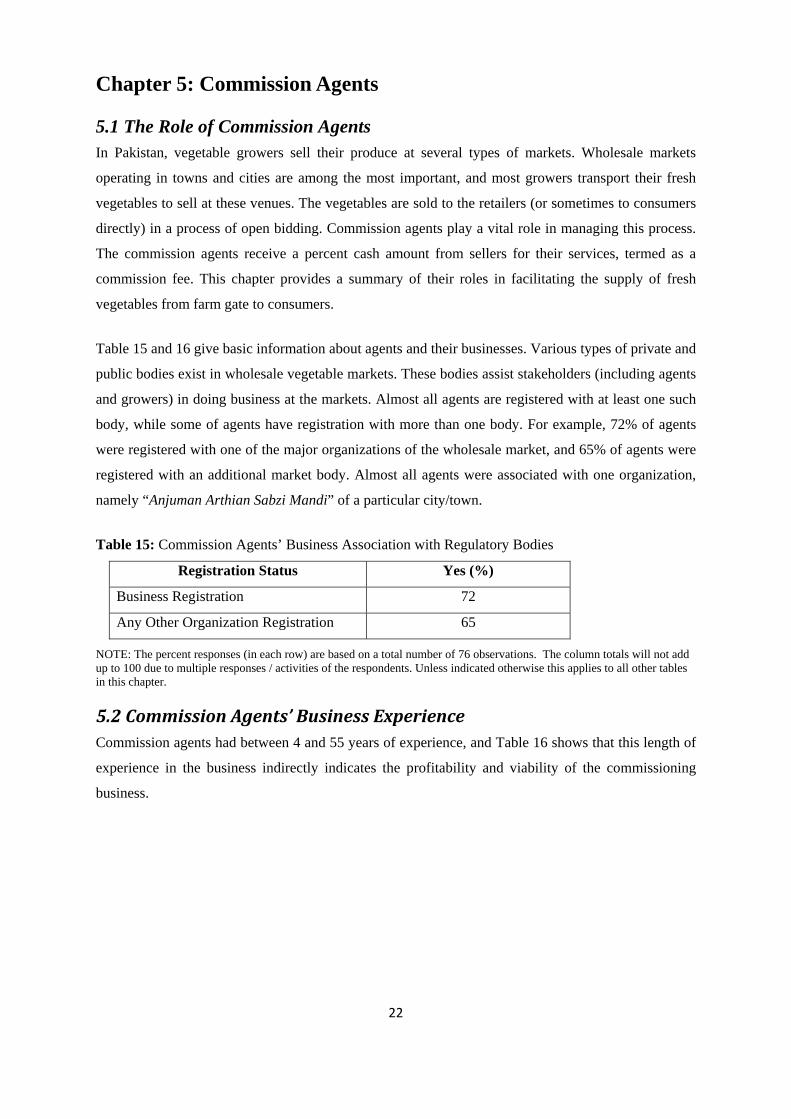
Table 15 and 16 give basic information about agents and their businesses. Various types of private and
public bodies exist in wholesale vegetable markets. These bodies assist stakeholders (including agents
and growers) in doing business at the markets. Almost all agents are registered with at least one such
body, while some of agents have registration with more than one body. For example, 72% of agents
were registered with one of the major organizations of the wholesale market, and 65% of agents were
registered with an additional market body. Almost all agents were associated with one organization,
namely “Anjuman Arthian Sabzi Mandi” of a particular city/town.
Table 15: Commission Agents’ Business Association with Regulatory Bodies
Registration Status Yes (%)
Business Registration 72
Any Other Organization Registration 65
NOTE: The percent responses (in each row) are based on a total number of 76 observations. The column totals will not add up to 100 due to multiple responses / activities of the respondents. Unless indicated otherwise this applies to all other tables in this chapter.
5.2CommissionAgents’BusinessExperienceCommission agents had between 4 and 55 years of experience, and Table 16 shows that this length of
experience in the business indirectly indicates the profitability and viability of the commissioning
business.

23
Table 16: Commission Agents’ Business Experiences
Experience Status Minimum (years) Maximum (years) Mean (years)
Business Experience (BE) 4 55 21
BE at the same premises 3 55 14
These agents operate at several levels. Table 17 shows that most operate locally, about half operate
between districts, about a fifth between provinces, but only a small number worked nationally and
internationally.
Table 17: Commission Agents’ Business Status
Business Status YES (%)
Local Business 85
Inter-district Business 55
Inter-provincial Business 18
International Business 7
Table 18 shows that the commission agents help vegetable growers in several ways when they visit
wholesale markets. These include sanitation and resting facilities while they are waiting, and space to
put their vegetables. While the agents provide satisfactory facilities to growers in general, proper space
for sanitation purposes was reported to be below standard.
Table 18: Commission Agents’ Facilitation for Vegetables Growers
Facilities YES (%)
Proper Space for Vegetable Growers 84
Proper Space for Sale of Produce 68
Proper Space for Sanitation 36
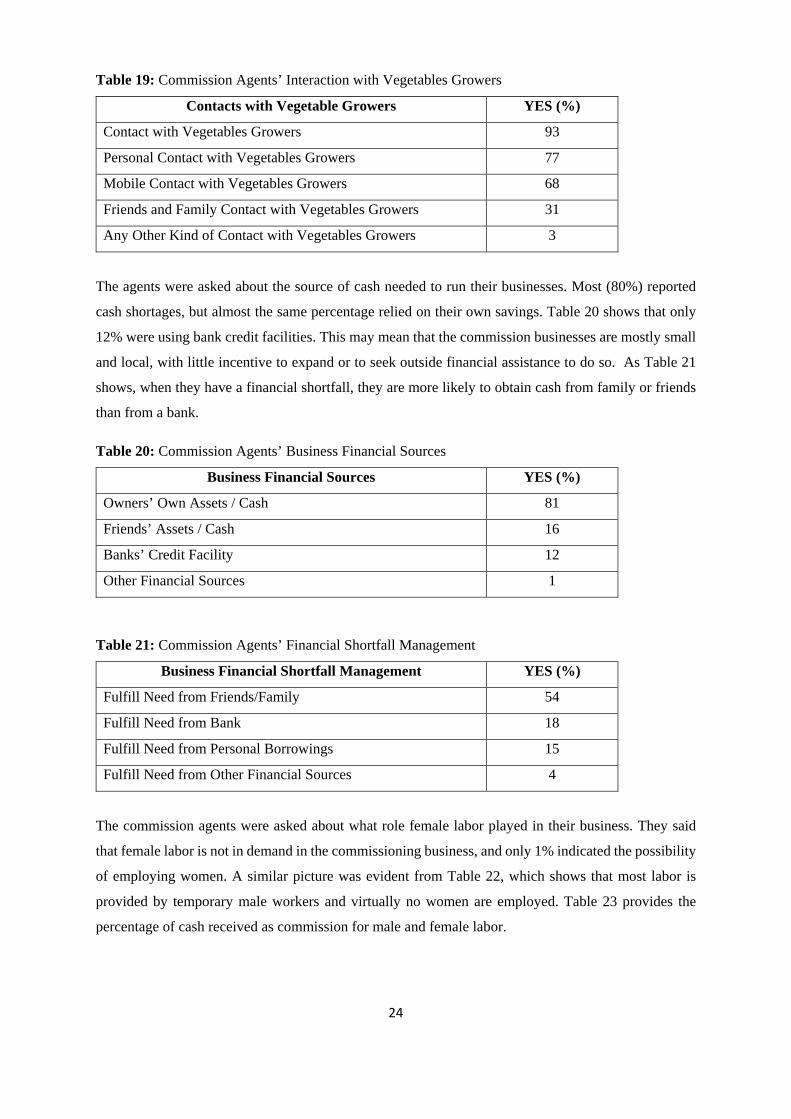
Table 19 shows that agents maintain regular formal and informal contacts with growers. The fact that
almost a third of them are related to each other suggests another source of bias in the selection of farmers
to interview who are visiting wholesale markets. It may be that because they are relatives they are more
likely to be given space, credit and to use the wholesale markets rather than sell into local markets.
24
Table 19: Commission Agents’ Interaction with Vegetables Growers
Contacts with Vegetable Growers YES (%)
Contact with Vegetables Growers 93
Personal Contact with Vegetables Growers 77
Mobile Contact with Vegetables Growers 68
Friends and Family Contact with Vegetables Growers 31
Any Other Kind of Contact with Vegetables Growers 3
The agents were asked about the source of cash needed to run their businesses. Most (80%) reported
cash shortages, but almost the same percentage relied on their own savings. Table 20 shows that only
12% were using bank credit facilities. This may mean that the commission businesses are mostly small
and local, with little incentive to expand or to seek outside financial assistance to do so. As Table 21
shows, when they have a financial shortfall, they are more likely to obtain cash from family or friends
than from a bank.
Table 20: Commission Agents’ Business Financial Sources
Business Financial Sources YES (%)
Owners’ Own Assets / Cash 81
Friends’ Assets / Cash 16
Banks’ Credit Facility 12
Other Financial Sources 1
Table 21: Commission Agents’ Financial Shortfall Management
Business Financial Shortfall Management YES (%)
Fulfill Need from Friends/Family 54
Fulfill Need from Bank 18
Fulfill Need from Personal Borrowings 15
Fulfill Need from Other Financial Sources 4
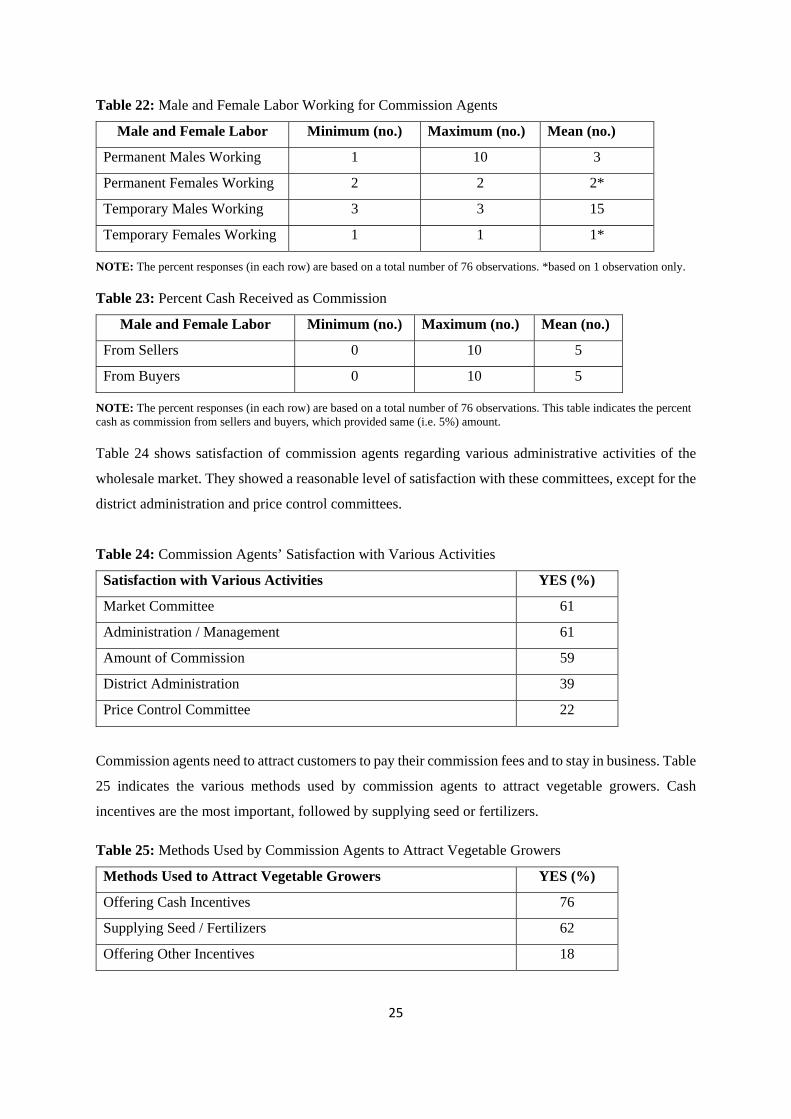
The commission agents were asked about what role female labor played in their business. They said
that female labor is not in demand in the commissioning business, and only 1% indicated the possibility
of employing women. A similar picture was evident from Table 22, which shows that most labor is
provided by temporary male workers and virtually no women are employed. Table 23 provides the
percentage of cash received as commission for male and female labor.
25
Table 22: Male and Female Labor Working for Commission Agents
Male and Female Labor Minimum (no.) Maximum (no.) Mean (no.)
Permanent Males Working 1 10 3
Permanent Females Working 2 2 2*
Temporary Males Working 3 3 15
Temporary Females Working 1 1 1*
NOTE: The percent responses (in each row) are based on a total number of 76 observations. *based on 1 observation only.
Table 23: Percent Cash Received as Commission
Male and Female Labor Minimum (no.) Maximum (no.) Mean (no.)
From Sellers 0 10 5
From Buyers 0 10 5
NOTE: The percent responses (in each row) are based on a total number of 76 observations. This table indicates the percent cash as commission from sellers and buyers, which provided same (i.e. 5%) amount.
Table 24 shows satisfaction of commission agents regarding various administrative activities of the
wholesale market. They showed a reasonable level of satisfaction with these committees, except for the
district administration and price control committees.
Table 24: Commission Agents’ Satisfaction with Various Activities
Satisfaction with Various Activities YES (%)
Market Committee 61
Administration / Management 61
Amount of Commission 59
District Administration 39
Price Control Committee 22
Commission agents need to attract customers to pay their commission fees and to stay in business. Table
25 indicates the various methods used by commission agents to attract vegetable growers. Cash
incentives are the most important, followed by supplying seed or fertilizers.
Table 25: Methods Used by Commission Agents to Attract Vegetable Growers
Methods Used to Attract Vegetable Growers YES (%)
Offering Cash Incentives 76
Supplying Seed / Fertilizers 62
Offering Other Incentives 18

26
5.2 Summary
This chapter provides information about commission agents operating in the AVRDC project areas
based on interviews with 76 agents. This included the role of agents, commission fees, their financial
sources along with shortfalls, and their mode of interaction with growers, which are summarized below:
Most agents operating at the local levels have been in business for many years and were
registered with one or more market bodies that assist growers and agents.
A high level of formal contact existed between agents and growers including personal, family,
and telephone communications.
Most agents indicated a cash shortage for their businesses, but very few borrowed from banks,
preferring to borrow from family and friends.
Agents charged 5% commission from growers and vegetables buyers in fees.
Agents indicated a high level of satisfaction with local administration/management, market
committees, and the levels of commission fees paid to them, but were less satisfied with district
administration and price control committees.
Agents used various methods to attract growers, which include offering cash incentives, and
supplying seed and fertilizers.

27
Chapter 6: Seed Dealers
6.1 Information about Seed Dealers’ Businesses
Quality seed is essential for good production of vegetables and field crops. Farmers use traditional
home-kept seed, improved, certified, and hybrid seed. Because there is a lack of quality seed available
and malpractice in the seed industry further limits the quality of the seed on offer, many farmers still
rely on keeping their own seed. The seed business in Pakistan generally has been operated with loose
monitoring and government regulation. Only in Punjab province have legal requirements been followed
to any significant extent. In 2015, the Government of Pakistan amended the 1976 Seed Act to invigorate
the seed industry and improve legal compliance. All provincial governments are now trying to
institutionalize the seed business, and government inspectors are now making regular visits to inspect
dealers’ businesses. About two-thirds of the dealers had been inspected by the government (Table 26).
However, less than a third have registered their businesses and about this same percentage said that a
permit is needed to sell seeds.
Table 26: Basic Information about Seed Dealers’ Businesses
Seed Dealers Information Yes (%)
Business Inspected by Any Government Agency 68
Seed Sale Permit Required 32
Business Registered 29
Seed Sale Permit Issued 23
NOTE: The percent responses (in each row) are based on 72 interviews. The column totals will not add up to 100 due to multiple responses / activities of the respondents. This applies to all other tables in this chapter unless otherwise specified.
6.2 Seed Dealers’ Business Types and Levels
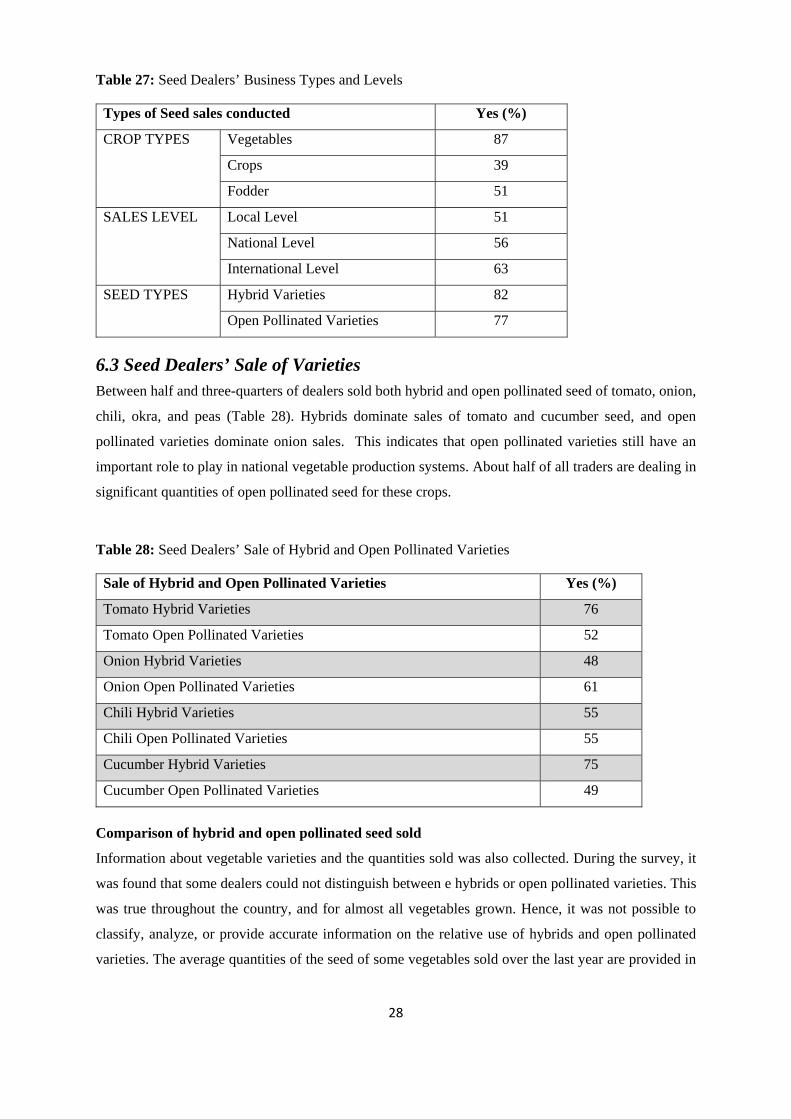
Table 27 gives information about dealers’ businesses and the levels at which they operate. Most sold
vegetable seed, about half sold fodder seed, and more than a third sold crop seeds, and they sold
relatively similar percentages of hybrid or open pollinated varieties. Seed dealers were very different in
some ways from commission agents. The majority also operate at the international level rather than just
at the local level and are importing quality seed from different countries to sell across Pakistan. This is
different from the commission agents, who tend to be more focused at the local market level.
28
Table 27: Seed Dealers’ Business Types and Levels
Types of Seed sales conducted Yes (%)
CROP TYPES Vegetables 87
Crops 39
Fodder 51
SALES LEVEL Local Level 51
National Level 56
International Level 63
SEED TYPES Hybrid Varieties 82
Open Pollinated Varieties 77
6.3 Seed Dealers’ Sale of Varieties Between half and three-quarters of dealers sold both hybrid and open pollinated seed of tomato, onion,
chili, okra, and peas (Table 28). Hybrids dominate sales of tomato and cucumber seed, and open
pollinated varieties dominate onion sales. This indicates that open pollinated varieties still have an
important role to play in national vegetable production systems. About half of all traders are dealing in
significant quantities of open pollinated seed for these crops.
Table 28: Seed Dealers’ Sale of Hybrid and Open Pollinated Varieties
Sale of Hybrid and Open Pollinated Varieties Yes (%)
Tomato Hybrid Varieties 76
Tomato Open Pollinated Varieties 52
Onion Hybrid Varieties 48
Onion Open Pollinated Varieties 61
Chili Hybrid Varieties 55
Chili Open Pollinated Varieties 55
Cucumber Hybrid Varieties 75
Cucumber Open Pollinated Varieties 49
Comparison of hybrid and open pollinated seed sold
Information about vegetable varieties and the quantities sold was also collected. During the survey, it
was found that some dealers could not distinguish between e hybrids or open pollinated varieties. This
was true throughout the country, and for almost all vegetables grown. Hence, it was not possible to
classify, analyze, or provide accurate information on the relative use of hybrids and open pollinated
varieties. The average quantities of the seed of some vegetables sold over the last year are provided in

29
Table 29. Sales of open pollinated onions dominate, followed by sales of tomato and cucumber. Sales
of open pollinated varieties were higher than sales of hybrids.
Table 29: Mean Quantity of Hybrid and Open Pollinated Varieties Sold by Seed Dealers
Sale of Hybrid and Open Pollinated Varieties kg/Season
Tomato Hybrid Varieties 10
Tomato Open Pollinated Varieties 52
Onion Hybrid Varieties 36
Onion Open Pollinated Varieties 403
Chilies Hybrid Varieties 4
Chilies Open Pollinated Varieties 18
Cucumber Hybrid Varieties 10
Cucumber Open Pollinated Varieties 39
NOTE: Mean figures (in each row) are based on a total number of 72 observations.
The diversity of cultivars or varieties sold varied from 16 in tomato, 13 in cucumber and 10 in onion to
only five chili varieties. The 16 tomato cultivars/varieties of tomato sold by seed dealers last season
included Raja, Fransis, Moon Star, Rachna, GVS1010, Sahil, M55, E1359, Poni Express, Green Gold,
Quartz, Yakki, Larika, Dollar, Holland, and Rio Grandi. The latter five varieties were also popular
among vegetable growers, with Rio Grandi the most popular variety. Thirteen cucumber varieties were
sold: Edna, Deep Heat, Yousuf, Internet, March, Alpha, Mehran, Abdullah, Waleed, Saeed, Bilbio,
Market More, and Long Red. Mehran was the most popular among these varieties. Ten
cultivars/varieties of onion were sold including Tikki, Recita, Naserpuri, Red Commander, Flat Globe,
and Phulkara, with Swat-1 being the most popular variety. Five chili varieties were sold, including-6,
410-S, Sun Valley, and Rosy F1, with Sky-2 planted by most farmers interviewed.
6.4 Seed Dealers’ Source of Vegetable Seed Purchased
Dealers were asked about where they sourced their seed and to what extent they discounted seed sales.
Table 30 provides information about their seed purchases from various sources. In keeping with the
international and national connections of most seed dealers, the most common source of seeds were
from international or national companies or seed importers. About half the dealers were sourcing seed
locally from farmers or other seed companies, while only about a third sourced their seed from the
government. Almost all the seed dealers received seed from multiple sources. When asked how many
discounted seed sales, 46% admitted to selling seed at reduced rates.

30
Table 30: Seed Dealers’ Source of Vegetable Seeds
Source of Vegetable Seed Purchase Yes (%)
International Seed Company 62
National Seed Company 59
Seed Importers 57
Local Farmers 51
Local Seed Company 51
Government Seed Producing Department 35
Government Research Department 31
6.5 Seed Dealers’ Perceptions of Seed Quality
The seed dealers were asked about their satisfaction in relation to the quality of seed and the seed
packing material. Over a third expressed dissatisfaction with the packing of seed that was not up to an
acceptable standard. They were almost equally concerned about the attractiveness of packing material.
Overall, the majority of the seed dealers were satisfied with seed quality, but about a third claimed there
were problems of mixing, packing or seed standards that were not satisfactory (Table 31).
Table 31: Seed Dealers’ Perceptions about Seed Related Issues
Perceptions About Seed Related Issues Yes (%)
Seed Packing Not Up to Standard 37
Seed Packing Not Attractive 31
Seed Varieties Mixed 35
Seed Not up to Standard 32
6.6 Seed Dealers’ Promotional Methods
Seed dealers use various methods to promote their seeds to farmers. These included media, exhibitions,
and personal contacts. As Table 32 shows, using personal contacts was by far the most popular method
of seed promotion to farmers.
Table 32: Seed Dealers’ Seed Promotional Methods
Seed Introduction Methods Yes (%)
Personal Contacts 79
Progressive Growers 47
Exhibitions 44
Media 31

31
6.7 Seed Dealers’ Seed Storage, Sufficiency of Supply and Improvement
Efforts
Table 33 provides information about dealers’ satisfaction with their vegetable seed storage, their
abilities to meet seasonal demands for seed, and any efforts they made to improve the quality of seed
before sale (e.g. improved grading or packaging). Two-thirds of dealers were satisfied with the quality
of seed storage that they had available, but only half were satisfied with their ability to provide a
sufficient quantity of vegetable seeds for vegetable growers. Only a third improved the quality of seed
by grading and cleaning. Dealers were also asked to quantify the monetary loss due to weather
conditions while storing their vegetable seeds. Just under half had no losses, but the rest suffered an
average loss of PKR 132879 last season. The maximum loss faced by a seed dealer was PKR 1000000
in the last season due to bad weather conditions. This indicates that a significant number of dealers have
problems with both storage and supply of seeds to meet market demand.
Table 33: Seed Dealers’ Storage, Sufficiency of Supply and Improvement Efforts
Efforts, Storage and Availability Yes (%)
Availability of Vegetable Storage 66
Availability of Sufficient Seed for the Season 51
Efforts to Improve Seeds Before Sale 32
6.8 Seed Dealers’ Knowledge of Vegetable Seeds and Crop Production
Interviews with dealers revealed that three-quarters provide advice on varieties and more than half know
about the seed source, but only about a third provided advice on other production technologies (Table
34).
Table 34: Seed Dealers’ Knowledge of Vegetable Seeds
Knowledge of Vegetable Seeds Yes (%)
Varieties/Hybrid 75
Seed Source 57
Production Technologies 35
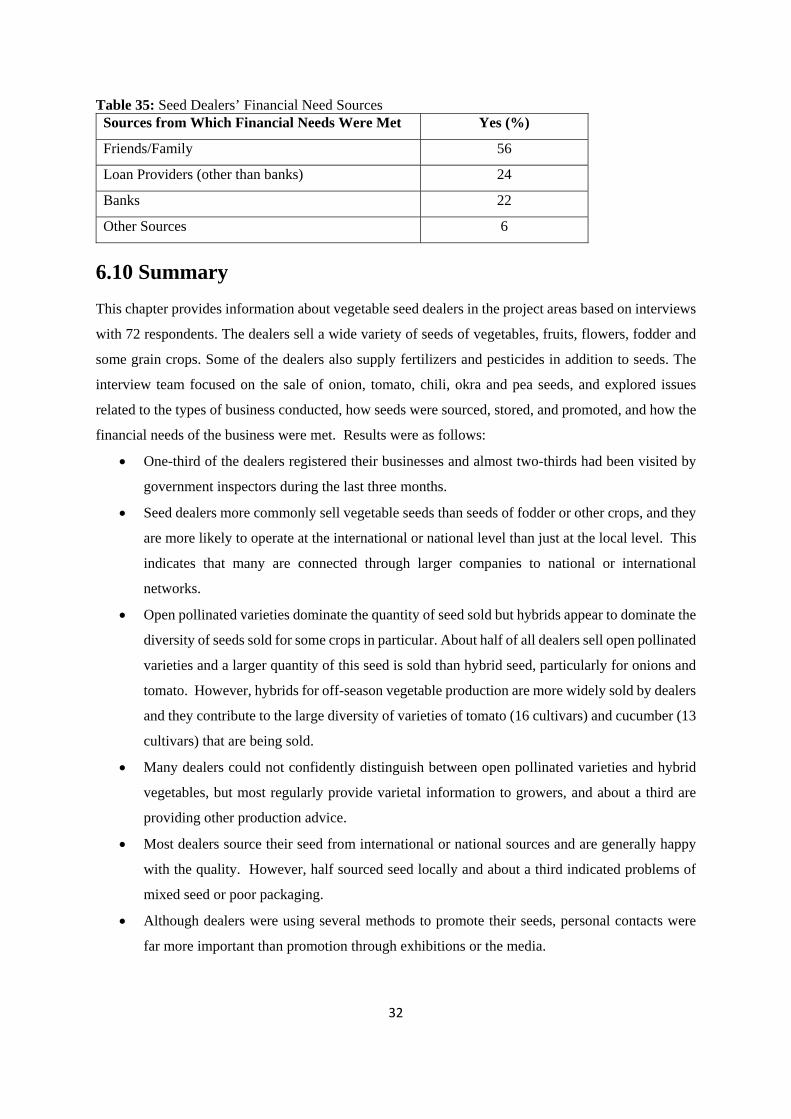
6.9 Seed Dealers’ Financial Needs
Dealers were asked about the financial difficulties in operating their businesses. Most dealers were
facing financial hardships and they required help from formal and informal financial institutions. Table
35 shows how the seed dealers fulfilled their financial needs. Similar to commission agents, most seed
dealers relied on family and friends for finance, while less than a quarter were using moneylenders or
banks.
32
Table 35: Seed Dealers’ Financial Need Sources Sources from Which Financial Needs Were Met Yes (%)
Friends/Family 56
Loan Providers (other than banks) 24
Banks 22
Other Sources 6
6.10 Summary
This chapter provides information about vegetable seed dealers in the project areas based on interviews
with 72 respondents. The dealers sell a wide variety of seeds of vegetables, fruits, flowers, fodder and
some grain crops. Some of the dealers also supply fertilizers and pesticides in addition to seeds. The
interview team focused on the sale of onion, tomato, chili, okra and pea seeds, and explored issues
related to the types of business conducted, how seeds were sourced, stored, and promoted, and how the
financial needs of the business were met. Results were as follows:
One-third of the dealers registered their businesses and almost two-thirds had been visited by
government inspectors during the last three months.
Seed dealers more commonly sell vegetable seeds than seeds of fodder or other crops, and they
are more likely to operate at the international or national level than just at the local level. This
indicates that many are connected through larger companies to national or international
networks.
Open pollinated varieties dominate the quantity of seed sold but hybrids appear to dominate the
diversity of seeds sold for some crops in particular. About half of all dealers sell open pollinated
varieties and a larger quantity of this seed is sold than hybrid seed, particularly for onions and
tomato. However, hybrids for off-season vegetable production are more widely sold by dealers
and they contribute to the large diversity of varieties of tomato (16 cultivars) and cucumber (13
cultivars) that are being sold.
Many dealers could not confidently distinguish between open pollinated varieties and hybrid
vegetables, but most regularly provide varietal information to growers, and about a third are
providing other production advice.
Most dealers source their seed from international or national sources and are generally happy
with the quality. However, half sourced seed locally and about a third indicated problems of
mixed seed or poor packaging.
Although dealers were using several methods to promote their seeds, personal contacts were
far more important than promotion through exhibitions or the media.

33
Two-thirds of dealers were satisfied with the quality of their seed storage, but only half were
satisfied with their ability to meet seasonal seed demands. Half had also lost a significant
quantity of seed in the last year due to weather damage.
Over 80% of dealers indicated financial hardships to meet their business needs, but less than a
quarter were using banks or moneylenders, with most preferring to rely on family and friends
for finance. This may indicate difficulty in accessing commercial finance, or the high costs of
doing so, and possibly indicate limitations to them being able to improve their businesses.

34
Recommendations
There appears to be a major problem of access to credit by key players along the vegetable
value chain that needs to be addressed by organizing groups and by bringing in reputable
finance agencies. More than a third of farmers sell their crop before harvest, losing a significant
proportion of potential income because they need the cash. About two-thirds of growers that
sell in wholesale markets get credit from commission agents and about half use their crop
payments to repay those debts. Although 80% of the agents claim to be in financial difficulty,
only 18% access loans from a bank. A similar percentage of seed dealers are in financial
difficulty, but only 22% access banks rather than relying on friends or family. Organizing better
sources of finance and grouping of key players along the value chain may be needed to improve
its functioning.
Most growers are producing a diversity of crops on very small areas. Many sell their fresh
vegetables without getting the best available prices.
Growers perceive about a quarter of their potential yields are lost in the preharvest stage, mainly
from pests, diseases and weather damage. These can be minimized if appropriate integrated
pest management (IPM) training is provided.
Most growers mainly depend on external sources instead of their own farms for supplies of
vegetable seeds. This may be because of increasing use of hybrids for crops such as tomato and
cucumber or a lack of high quality open pollinated varieties available. However, 15-20% of
growers were producing their own onion, okra and tomato seed, which indicates a significant
supply problem.
Most growers grade their vegetables to receive a higher price and use various packing materials
for different vegetables. Less than half use any sort of packing and the most common method
was plastic bags. Introducing and demonstrating other packing materials in the project areas
may be useful.
Growers face several difficulties in transporting their vegetables to the markets, including high
transport cost, a lack of appropriate transport facilities, and a lack of finance at the time of
harvesting. Once they reached the wholesale markets, they were generally happy with the
facilities provided.
Commission agents provide a range of services to growers in addition to selling their produce
for a fee. The most common are providing credit, fertilizers and seed. Growers were generally
happy with their relationship with agents, who mainly operated on a local rather than on an
inter-district or national basis. In about a third of cases, growers and commission agents in
wholesale markets were related to each other.

35
The amended Seed Act needs continued attention to implement its provisions to improve the
operations of the seed industry and improve services to farmers in Pakistan.
Seed dealers had little understanding of the difference between hybrids and open pollinated
varieties and found it hard to distinguish between them, yet three-quarters provided varietal
advice to growers. The quantity of seed of open pollinated varieties sold appears to be higher
than the quantity of hybrid seed sold, particularly for onions, but there is a greater diversity of
hybrids sold, particularly for tomato and cucumber. As dealers can provide a trusted source of
information to growers, there is a need to provide training to them to enhance their
understanding of varieties and production technology.
Almost half of seed dealers suffered significant loss of seed stocks in the last year. A third were
dissatisfied with the quality of their storage facilities and half had suffered average losses of
over PKR 130,000 in the last year. Only half were able to meet market demand for seed and
only a third did anything to improve the quality of the seed they sold. There is a need for more
training of seed dealers to improve their seed storage.

36
References
Bourne, M. 1986. Overview of Postharvest Problems in Fruits and Vegetables, In: Postharvest Food Losses in Fruits and Vegetables, Bourne, B., Z. Yilt and F.W. Liu. (eds.), National Academy Press, Washington, USA. pp. l-16.
FAO. 2002. http:\ \www.fao.org/decrep/t0073e/t0073e00.htm # Contents (verified January 30, 2015).
FAO. 1989. Prevention of Postharvest Losses: Fruits, Vegetables, and Root Crops, A Training Manual, No. 17/2, Rome.
FIAS. 2007. Moving Towards Competitiveness: A Value Chain Approach, FIAS, The World Bank Group, Washington, USA.
GOP. 2012-13. Fruits, Vegetables, and Condiments Statistics of Pakistan, Agriculture Statistics of Pakistan, Ministry of Food Security, Agriculture and Livestock, Economic Wing, Islamabad, Pakistan.
GOP. 2013-14. Pakistan Economic Survey 2013-14, Economic Advisory Wing, Finance Division, Islamabad, Pakistan.
Kader, A.A. 1992. Postharvest Technology of Horticultural Crops, 2nd Edition, University of California, Division of Agriculture and Natural Resources, USA. 3311p.
Khan M., Tariq R., Muhammad N., Mirkalan S., Yahya B., Mohammad T. 2008. Post Harvest Economic Losses in Peach Production in District Swat, Sarhad J. Agric. Vol.24, No.4
PHDEB (2007). Pre-Feasibility Study; Establishment of Cold Chain System under National Trade Corridor Improvement Project, Volume-1 Horticulture Industry, By Arch Vision Consulting Engineers, Environmentalists and Architects.
Raja, M.B and Khokhar, K.M. 1993. Postharvest horticulture technology and its future prospects (pp.265-277). Proceeding of First International Horticulture Seminar (9-11 January 1992), Pakistan Agricultural Research Council, Islamabad, Pakistan.
SAARC Agricultural Centre. 2014. Value Chain Analysis and Market Studies on Fruits and Vegetable in SAARC Members Countries, BARC Complex, Dhaka, Bangladesh.
Sharif M., Shah N.A., Ali S.I., Alvi A.S., Munir M. 1998. Rapid Appraisal of Illegal Trade Among Pakistan, Afghanistan, and Iran, PARC Scientist, Islamabad, Pakistan.
Zaldivar, C.P. 1991. Postharvest losses: Significance, assessment and control. In: Memorias Simposio Nacional Fisiologiay Tecnologia Postcosecha de Productos Horticolas en Maxico. E.M. Yahia, and I.H. Higuera C. (eds.). Noriega Eds. Mexico. pp. 205-209.

37
Appendices
Appendix I: Clusters for Assessing Vegetable Value Chains
Province Region District Institute Cluster
# Cluster Name
Location
KPK KPK Mingora, Bunir
ARI (N) Mingora
1 Swat Mingora,
Bunir
KPK-Punjab Hazara-Pothwar
Haripur, Attock, ISLD/RWP
NARC, islamabad
2 Pothwar ICT
Punjab Central Punjab (Rice Belt)
Sheikhupura, Chiniot, Faisalabad
VRI Faisalabad
3 Chenab Faisalabad
Punjab South Punjab (Cotton Belt)
Pakpattan Private 4 ARCO Pakpattan
Sindh Upland Sindh
MirpurKhas /UmerKot
Private 5 Kunri Kot GM / Umer Kot
Balochistan Upper/Lower Lands
Quetta, Pishin, Khuzdar, Jafferabad, Mastung
ARI Quetta
6 Ziarat
Quetta, Pishin,
Khuzdar, Jafferabad, Mastung
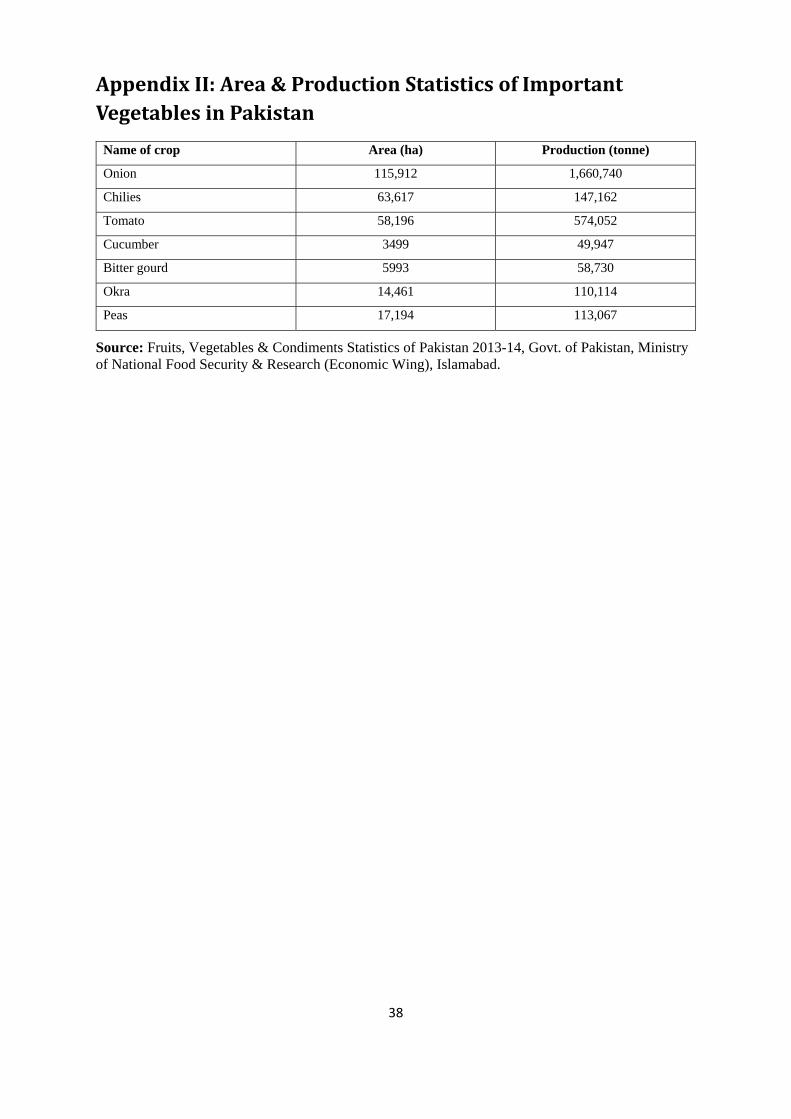
38
AppendixII:Area&ProductionStatisticsofImportantVegetablesinPakistan
Source: Fruits, Vegetables & Condiments Statistics of Pakistan 2013-14, Govt. of Pakistan, Ministry of National Food Security & Research (Economic Wing), Islamabad.
Name of crop Area (ha) Production (tonne)
Onion 115,912 1,660,740
Chilies 63,617 147,162
Tomato 58,196 574,052
Cucumber 3499 49,947
Bitter gourd 5993 58,730
Okra 14,461 110,114
Peas 17,194 113,067

39
AppendixIII:Questionnaire–VegetableValueChainsBaselineInformation
2: Information about household members:
Family member
Relationship with household head
Gender (M/F)
Age (Years)
Education (Schooling Years)
Occupation
Estimated Income
Head of household
2
3
4
5
6
7
a-Cropping systems (rice-wheat/wheat-fallow/ intercropping/double cropping/others) _______________
b-Area (irrigated/rainfed) ___________________________
a-District _______________ b-Tehsil/location __________________________ c-village name ____________________
d-date _________________e-Enumerator names and Cell number/CNIC_____________________________________
f- Respondent name ___________________ g- Respondent cell number _______________ h-Age (years) ______________
i-Education (years) _______________j- Marital status (Single/Married/Widower) ____________________________________
k-Status of Respondent (Beneficiary / non-beneficiary) ______________ l-Farming experience(years) ____-________________
m- Relationship with HH head (Self / Father / Brother / Son / Other) __________________________

40
8
9
10
11
12
13
14
15
Number of labourers (male/female)_______________________
Number of days of employment (cost incurred) ______ /year
Male: _____________ Female: _________
1. In Cash _________ /year 2. In Kind ________/year
3: Source of Vegetable Seed: (last one year)
Source Amount (kg) Source Amount (kg)
Home Seed Research Department
Fellow Farmers Extension Department
Seed Companies Village Shop
Tehsil/District Market
Others ____________
4: Access to Credit
Source Amount (Rs.) Purpose Duration (in months)
Monthly interest rate (%)
Bank
ZTBL
Commission Agent
Input Dealers
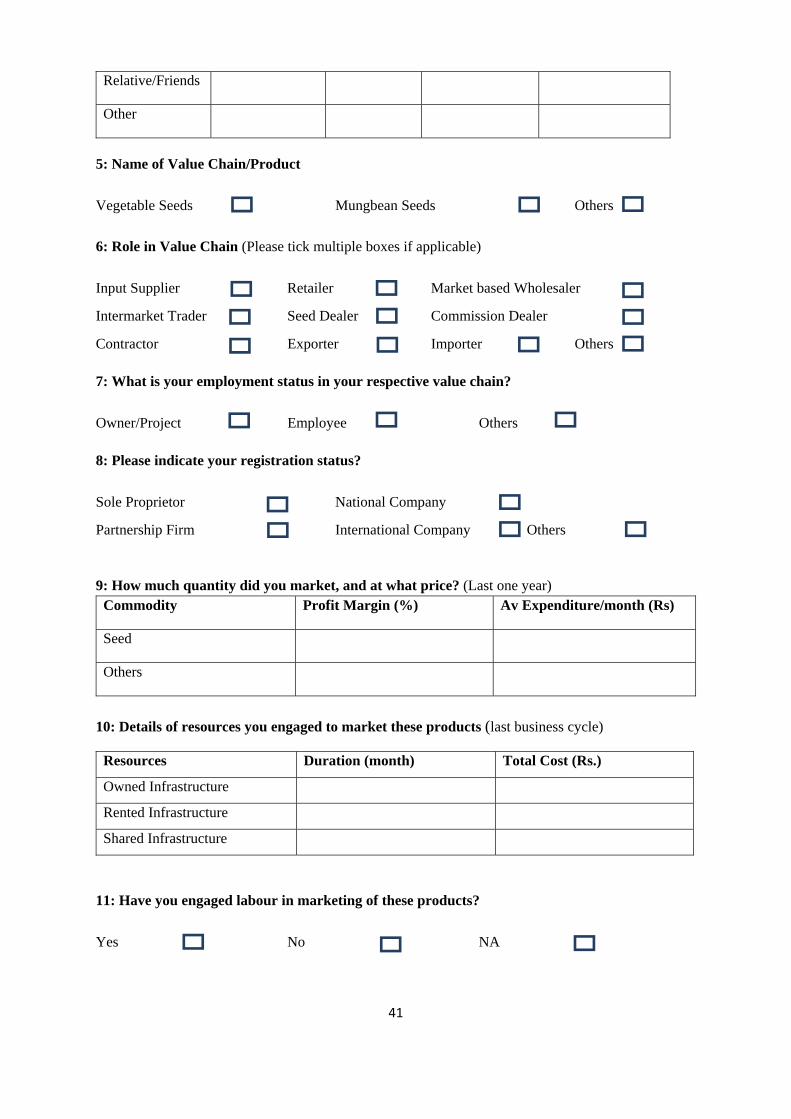
41
Relative/Friends
Other
5: Name of Value Chain/Product
Vegetable Seeds Mungbean Seeds Others
6: Role in Value Chain (Please tick multiple boxes if applicable)
Input Supplier Retailer Market based Wholesaler
Intermarket Trader Seed Dealer Commission Dealer
Contractor Exporter Importer Others
7: What is your employment status in your respective value chain?
Owner/Project Employee Others
8: Please indicate your registration status?
Sole Proprietor National Company
Partnership Firm International Company Others
9: How much quantity did you market, and at what price? (Last one year) Commodity Profit Margin (%) Av Expenditure/month (Rs)
Seed
Others
10: Details of resources you engaged to market these products (last business cycle)
Resources Duration (month) Total Cost (Rs.)
Owned Infrastructure
Rented Infrastructure
Shared Infrastructure
11: Have you engaged labour in marketing of these products?
Yes No NA

42
12: How much labour required during different stages?
Labour No. and Type of Employee Cost
Order Booking
Packaging and distribution
Selling
Marketing
Management
13: Capital (if applicable)
Capital Ownership Status
Building (Godown, shop)
Machinery & Equipment
Vehicles
Others
14: Do you have any Certification to Market your produce?
Certification Respondent
Product Certification
Brand Name
Process Certification
Export License
Import License
15: How much of the produce have you lost while marketing your vegetable seed during last
year?
Vegetable Seed % Losses
16: What are the major challenges you are facing in marketing your seed?
a)
b)
c)
d)

43
17: Where did you sell your produce?
Market % Sold Mode of Payment(Cash/Cheque)
Local Market
National Market
International Market
18: Have you signed any purchase contract with growers?
Purchase Contract Formal Contract
Months Contract still Valid
Proportion of Total Sales
Direct Customers/End Users/Consumers
Retailers Wholesalers Processor / Lead Firms Contractor/Middle Man/Woman
Exporter Any others
19: Have you signed any sale contract with the buyers?
Purchase Contract Formal Contract
Months Contract still Valid
Proportion of Total Sales
Direct Customers/End Users/Consumers
Retailers
Wholesalers
Processor / Lead Firms
Contractor/Middle Man/Woman
Exporter
Any others
20: Do you have information regarding service providers/farmers? (Please encircle)
Information Status Status
Do you give facility to farmers Yes/No Yes/No
Mode of Contract Yes/No Yes/No
Do you have access to IT Tools & Techniques Yes/No Yes/No
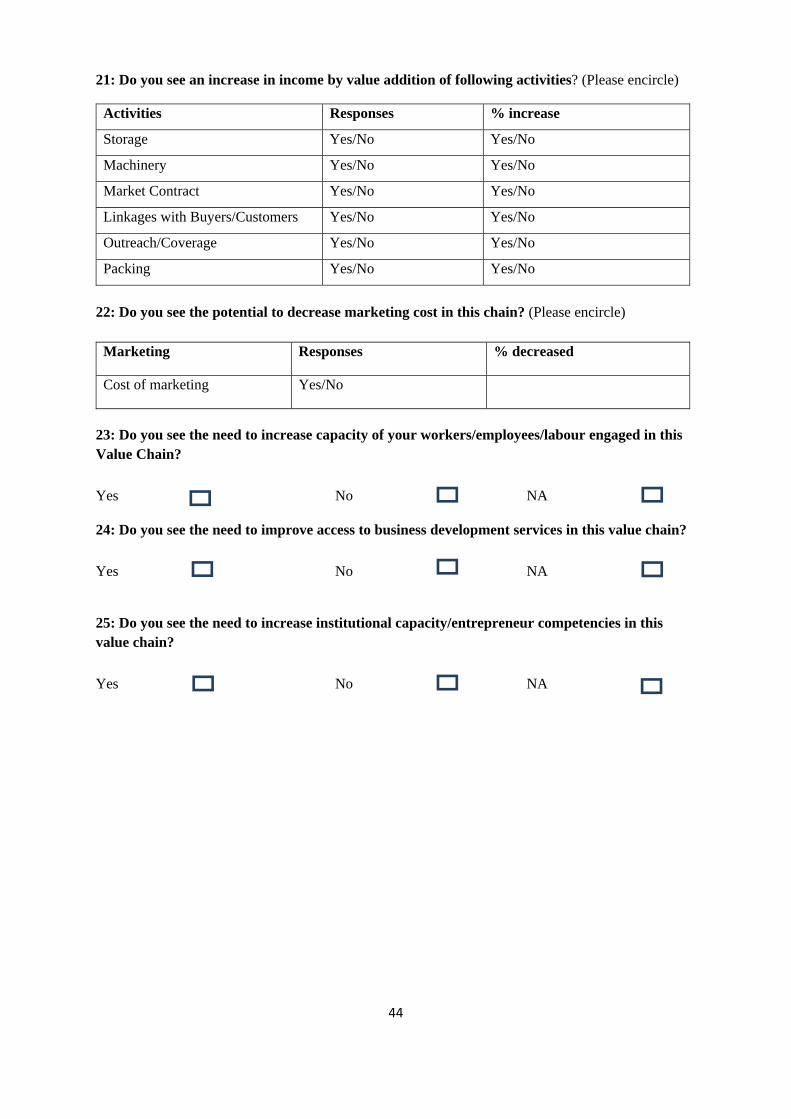
44
21: Do you see an increase in income by value addition of following activities? (Please encircle)
Activities Responses % increase
Storage Yes/No Yes/No
Machinery Yes/No Yes/No
Market Contract Yes/No Yes/No
Linkages with Buyers/Customers Yes/No Yes/No
Outreach/Coverage Yes/No Yes/No
Packing Yes/No Yes/No
22: Do you see the potential to decrease marketing cost in this chain? (Please encircle)
Marketing Responses % decreased
Cost of marketing Yes/No
23: Do you see the need to increase capacity of your workers/employees/labour engaged in this Value Chain?
Yes No NA
24: Do you see the need to improve access to business development services in this value chain?
Yes No NA
25: Do you see the need to increase institutional capacity/entrepreneur competencies in this value chain?
Yes No NA

AVRDC - The World Vegetable CenterUSAID Agricultural Innovation Program (AIP)PGRI Building, NARC Campus, Park RoadIslamabad 45500 Pakistan
avrdc.org