pakistan strategy 2020 - arifhabibltd.com
TRANSCRIPT

Pakistan Strategy 2020 1
Pakistan Strategy 2020Targeting 51,000; Checkmate
AHL Research
D: +92 21 32462742
UAN: +92 21 111 245 111, Ext: 322
F: +92 21 32420742
Best Domestic Equity House Top 25 CompaniesCorporate Finance House of
the Year: 2018Best Equity Research
Analyst: 2017www.jamapunji.pk
REP-300
Pakistan Strategy 2020 2
Total Return
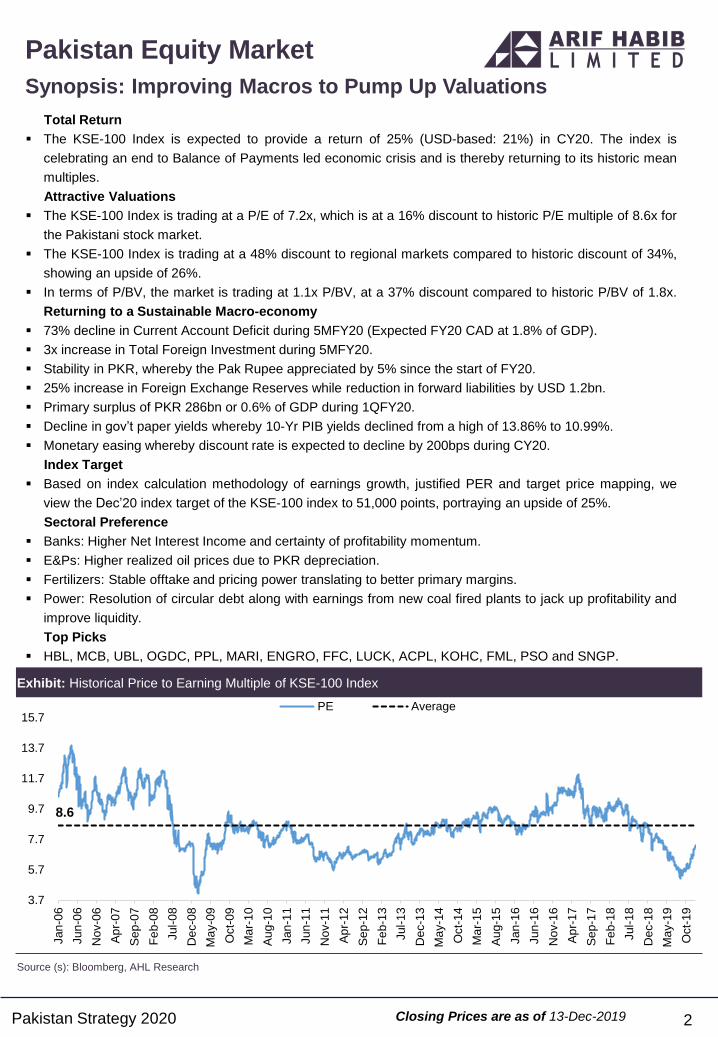
The KSE-100 Index is expected to provide a return of 25% (USD-based: 21%) in CY20. The index is
celebrating an end to Balance of Payments led economic crisis and is thereby returning to its historic mean
multiples.
Attractive Valuations
The KSE-100 Index is trading at a P/E of 7.2x, which is at a 16% discount to historic P/E multiple of 8.6x for
the Pakistani stock market.
The KSE-100 Index is trading at a 48% discount to regional markets compared to historic discount of 34%,
showing an upside of 26%.
In terms of P/BV, the market is trading at 1.1x P/BV, at a 37% discount compared to historic P/BV of 1.8x.
Returning to a Sustainable Macro-economy
73% decline in Current Account Deficit during 5MFY20 (Expected FY20 CAD at 1.8% of GDP).
3x increase in Total Foreign Investment during 5MFY20.
Stability in PKR, whereby the Pak Rupee appreciated by 5% since the start of FY20.
25% increase in Foreign Exchange Reserves while reduction in forward liabilities by USD 1.2bn.
Primary surplus of PKR 286bn or 0.6% of GDP during 1QFY20.
Decline in gov’t paper yields whereby 10-Yr PIB yields declined from a high of 13.86% to 10.99%.
Monetary easing whereby discount rate is expected to decline by 200bps during CY20.
Index Target
Based on index calculation methodology of earnings growth, justified PER and target price mapping, we
view the Dec’20 index target of the KSE-100 index to 51,000 points, portraying an upside of 25%.
Sectoral Preference
Banks: Higher Net Interest Income and certainty of profitability momentum.
E&Ps: Higher realized oil prices due to PKR depreciation.
Fertilizers: Stable offtake and pricing power translating to better primary margins.
Power: Resolution of circular debt along with earnings from new coal fired plants to jack up profitability and
improve liquidity.
Top Picks
HBL, MCB, UBL, OGDC, PPL, MARI, ENGRO, FFC, LUCK, ACPL, KOHC, FML, PSO and SNGP.
Pakistan Equity Market
Synopsis: Improving Macros to Pump Up Valuations
Exhibit: Historical Price to Earning Multiple of KSE-100 Index
Source (s): Bloomberg, AHL Research
8.6
3.7
5.7
7.7
9.7
11.7
13.7
15.7
Jan
-06
Jun
-06
Nov-0
6
Ap
r-07
Se
p-0
7
Fe
b-0
8
Jul-
08
Dec-0
8
Ma
y-0
9
Oct-
09
Ma
r-1
0
Au
g-1
0
Jan
-11
Jun
-11
Nov-1
1
Ap
r-12
Se
p-1
2
Fe
b-1
3
Jul-
13
Dec-1
3
Ma
y-1
4
Oct-
14
Ma
r-1
5
Au
g-1
5
Jan
-16
Jun
-16
Nov-1
6
Ap
r-17
Se
p-1
7
Fe
b-1
8
Jul-
18
Dec-1
8
Ma
y-1
9
Oct-
19
PE Average
Closing Prices are as of 13-Dec-2019

Pakistan Strategy 2020 3
Table of Content
Political Outlook 4
• Government Stability to Bode Well for Market 4
• Reviving Stature on the International Arena 5
Economy of Pakistan 6
• Consolidation for Future Sustainable Growth 7
• Rate Cut Cycle to Initiate in Early 2020 8
• Improving Balance of Payments – CAD down by 74% YoY 9
• Decline in REER has Improved Export Competitiveness… 10
• … While Stabilizing Balance of Payments 11
• Foreign Investment Surges with Improving Confidence 12
• FY20 Current Account Deficit to decline by 64% YoY 13
• FATF – Grey List Status Maintained, Blacklisting Highly Improbable 14
• IMF Agreement 15
• Economic and Financial Policies 16
• Monetary and Exchange Rate Policies 17
• Energy Sector Reforms 18
• Committed to improve SOEs performance 19
• Outlook: Macroeconomic Stability Achieved, Looking for growth 20
Equity Market 21
• Economic Headwinds Weighed in on Index 22
• Ending the Year On a High 23
• Event Graph 24
• Average Volume and Value at Seven Year Low 25
• Foreigners Portray Optimism Post 4-Yr Drought 26
• Earnings Growth Expected at 5-Yr High 27
• KSE-100 vs. Foreign Exchange Reserves 28
• 2020 Outlook 29
Sectoral Strategy
• Banks 30
• Exploration & Production 39
• Fertilizer 52
• Cement 58
• Power 66
• Oil & Gas Marketing 72
• Automobile Assemblers 78
• Textile Composite 82
• Chemical 88
• Engineering (Steel) 94
Recommendation Summary 98
Annexure
• List of Abbreviation 99
• Contact List 101

Pakistan Strategy 2020
A rare feature of the current political set-up that is not a common characteristic of governments (especially
in recent times) is the much-needed synergies between the political and military leaderships.
Whether it is the accountability drive on the domestic front or the reviving of international relations and
image-building on the foreign affairs front, synchronized views have helped and will continue to help the
stability of the government, we view. The army’s keen interest in resolving deeply imbedded obstacles in
the business and economic environment is viewed positively by the investor community as well as leading
businessmen. However, the government has been haunted by a dilapidated economy characterized by
exacerbating inflationary pressure, sharp decline of the PKR-USD parity, and ballooning twin deficits, which
have been/are a source of serious pressure. The government was quick to adopt a proactive stance to
address the looming challenges (as discussed in detail in the economy section).
Opposition parties mainly led by the JUI-F attempted to regain their lost political space through an “Azaadi
March” followed by a sit-in, which proved to be a non-event as far as investor sentiment was concerned, as
the stock market continued its bullish momentum.
Secondly a fragmented opposition has also created further space for the stability of the PTI-led
government. Arrests/physical remands of leading opposition leaders has managed to curtail the
opposition’s political strength. Former PM and ex-CM Punjab’s travel abroad has also added to the vacuum
in the opposition. We view the reduced strength of key opposition members to be beneficial for the stability
of the government which should bode well for sentiment in the equity markets.
4
Politics
Government Stability to Bode Well for Market
Exhibit: Important Political Events During 2019
Source (s): News reports, AHL Research
PML-N President Shahbaz Sharif granted bail in housing scheme case
PPP Co-chairman Asif Zardariarrested by NAB in money laundering case
Notification issued for a 3 year extension to the army chief
JUI-F sit-in ends after 13 days
Nawaz Sharif travels to London for medical treatment
Supreme Court ordered army chief's tenure to continue for another 6 months
Asif Zardarireleased on bail on medical grounds
Ex-President Musharraf handed death penalty in treason case

Pakistan Strategy 2020 5
Politics
Reviving Stature on the International Arena The PTI-led government has concentrated heavily on serving its energy on the international arena to revive
stalled relations and build up rapport in the international community, particularly to shore up support for the
Kashmir cause. The UNGA session where PM Khan made a highly popular speech was the zenith of his
hard-hitting campaign against Indian government’s atrocities and human rights violations in Kashmir. The
PM held meetings with numerous heads of states and the diplomatic community to leave no stone unturned
in highlighting the Kashmir cause and a popular opinion has been broadly developed that the Kashmir issue
was once again brought back to the geopolitical arena. President Trump’s repeated offers to mediate (to
India’s extreme displeasure), even after attending the “Howdy Modi” event and at a joint press conference
with the Indian PM, was a diplomatic success for Pakistan. Furthermore, Pakistan’s diplomatic stature has
been elevated following its recognition as a key force in the US-Taliban peace talks that are set to pave the
way for US troops’ withdrawal from Afghanistan. Furthermore, President Trump asked PM Khan to also
mediate between the US and Iran to deescalate tensions. Although this is work-in-progress, all these
developments have served to elevate Pakistan’s stature after a prolonged period of isolation.
Consolidating relations with the US has undoubtedly created slight turbulence in relations with China.
Moreover, the government has been under heavy criticism for the snail-paced, and in some cases, stalled
progress in CPEC projects. PM Khan made a trip to China especially for the purpose of “reviving” these
stalled projects. Pressure was mounting on the government to address the concerns. Better late than never,
the government created a CPEC authority for active oversight as well as implementation of projects. It is
imperative that Pakistan finds the right balance between Washington and Beijing. Both allies are of utmost
and critical importance to Pakistan’s strategic role in geopolitics, as well as economic well-being.
With persisting tension in Kashmir and economic headwinds in India (5% GDP Growth in 1QFY20 – slowest
since 2013), we do not expect any major improvement in relations with India. In a wave of rising nationalism
and right wing sentiments portrayed by the increasing popularity of the “Hindutva” mindset, PM Modi is
faced with grappling challenges on the economic front. Moreover, the recent self-inflicted blow in the form of
the “Citizenship Amendment Bill” has only added to the woes of PM Modi. Softening approach towards
Pakistan is likely to stimulate anti-government perception, particularly with the economic troubles
characterized by weakening consumer sentiment and contracting demand.
The PTI government has successfully carried the baton of terrific relations with Saudi Arabia. The visit of
Crown Prince in Feb’19 was a high-point in the bilateral relations and was met with grandiose fervor across
the country and culminated in investment deals worth USD 20bn, which includes a USD 10bn oil refinery in
Gwadar. To recall, the Arab nation had earlier provided Pakistan USD 3bn worth of funds for Balance of
Payments support alongside a deferred oil payment facility worth USD 3bn.
Exhibit: Pakistan’s efforts to revive geopolitical importance gain traction
Source (s): News reports, AHL Research
PM Khan visits Turkey on two-day visit on the invitation of President Erdogan
Saudi Crown Prince Mohammed bin Salman visits Pakistan with an investments galore
Combat between India and Pakistan Airforces that included cross-border strikes following the Pulwamaincident
Malaysian PM Mahathir Mohamad arrives on 3-day visit to Pakistan
PM Khan visits Iran on his first 2-day visit to strengthen bilateral ties and improve security situation on the border
PM Khan meets U.S. PresidentTrump, aiming to revive bilateral ties between Pakistan and the United States
PM Khan addressed the 74th session of the United Nations General Assembly in New York
PM Khan addressed the first Global Refugee Forum as a co-convener in Geneva

Pakistan Strategy 2020 6
Economy
Enroute Sustainable Recovery

Pakistan Strategy 2020 7
Pakistan’s GDP growth slowed down during FY19 (3.3% vs. 5.5% in FY18). However, Balance of Payments
improved during the year, and continues to improve during FY20.
Pakistan entered into the IMF program in Jul’19 to counter weak Balance of Payments. With the support of
global multilateral lenders, Pakistan is expected to increase its medium-term economic growth.
32% PKR depreciation (47% USD appreciation) since Dec’17 has led to lower consumer purchasing power
and hence, prompted a compression / moderation in domestic consumption. As household consumption
contributes around 82% to Pakistan’s GDP, a slowdown has been visible.
To confine domestic demand and control macroeconomic imbalances like inflation and CAD (Current
Account Deficit), the SBP has raised interest rates by 750bps since the beginning of CY18 (inflation for
5MFY20 has averaged at 10.8% compared to 6.1% for the same period last year).
Overall, a contractionary monetary policy, a weaker exchange rate along with fiscal consolidation measures
have caused a slowdown in the economy.
Some of these measures have provided relief on the economic front which should translate into sustainable
growth in the following years.
A major decline in the CAD (-73% in 5MFY20) and a stable currency since the start of FY20 (after entering
into the IMF program) have increased the sustainability of Balance of Payments.
Declining imports of goods and services (down by 21% during 5MFY20) has played a major role in curtailing
the CAD.
Exhibit: Historical and Expected GDP Growth
Source (s): Ministry of Finance, AHL Research
3.1%
4.7%
7.5%
9.0%
5.8%5.5%
5.0%
0.5%
2.6%
3.6% 3.8% 3.7%4.0% 4.1%
4.6%
5.4% 5.5%
3.3%
2.4%3.0%
0.0%
1.0%
2.0%
3.0%
4.0%
5.0%
6.0%
7.0%
8.0%
9.0%
10.0%
200
2
200
3
200
4
200
5
200
6
200
7
200
8
200
9
201
0
201
1
201
2
201
3
201
4
201
5
201
6
201
7
201
8
201
9
202
0E
202
1E
Pakistan Economy
Consolidation for Future Sustainable Growth

Pakistan Strategy 2020
Single Digit Inflation Expected Post FY20: We expect inflation to continue remaining elevated during
FY20, at an average of 11.0% while for CY20 it is projected to clock-in at 9.5%. During the year, the
incumbent government rebased CPI from 2007-08 to 2015-16 which increased inflation of FY18 by 80bps to
average at 4.7% compared to 3.9% on previous base of 2007-08, while it decreased inflation for FY19 by
50bps to 6.8% compared to 7.3%. Pertinently, reduction in weight of key group heads with higher inflation
lowers our inflationary readings for FY20. Despite the fact that currency adjustment had majorly been
carried out along with one time shock absorption of change in utility (gas and electricity) prices in the prior
year as well as higher base effect post recent rebasing, CPI reading remained elevated in FY20. This was
due to seasonal factor as prices of perishable food items skyrocketed given supply constraints, extended
monsoon season which affected major crops and ban in trade with India resulting in insufficient supply
throughout the country.
Much Needed Rate Cut Era to Begin Soon: During CY19, the State bank of Pakistan (SBP) adopted a
proactive stance and increased the Policy Rate by 325bps to 13.25% from 10.00% in CY18. We believe that
monetary tightening will be short lived as the real interest rate will remain positive and rate cut cycle is likely
to start from Mar’20 onwards where we expect SBP to cut 200bps in CY20.
SBP’s Outlook on Inflation: Despite rebasing of base year of inflation, State Bank expects inflation to
settle in the range of 11-12% amid higher than expected surge in utility prices and rise in food inflation on
account of temporary supply disruption. If the recent trend persists, inflation expectations could be affected.
However, the SBP sees this recent uptick as temporary and owing to contracting aggregate demand and
appreciation of currency, expects inflationary pressure to recede during 2HFY20. Current monetary policy
according to the SBP is on track to pull down inflation to 5-7% over the next 24 months.
8
Exhibit: Historical and Expected Inflation Exhibit: Historical and Expected Real Interest Rate
Source (s): PBS, AHL Research Source (s): PBS, SBP, AHL Research
Pakistan Economy
Rate Cut Cycle to Initiate in Early 2020
3.3 3.5 2.8
7.5 8.8
7.8 8.6
19.2
14.3 13.3
11.1
7.4 8.6
4.6 2.9
4.2 4.7
6.8
11.0
8.0
-
3.0
6.0
9.0
12.0
15.0
18.0
21.0
2002
2003
2004
2005
2006
2007
2008
2009
2010
2011
2012
2013
2014
2015
2016
2017
2018
2019
2020E
2021E
(%)
0.0%
1.0%
2.0%
3.0%
4.0%
5.0%
6.0%
0.0%
2.5%
5.0%
7.5%
10.0%
12.5%
15.0%
Jan
-19
Ma
r-1
9
Ma
y-1
9
Jul-
19
Se
p-1
9
Nov-1
9
Jan
-20
Ma
r-2
0
Ma
y-2
0
Jul-
20
Se
p-2
0
Nov-2
0
Real Interest Rate (RHS) Policy Rate CPI

Pakistan Strategy 2020
Pakistan’s Balance of Payments recorded a significant improvement during 5MFY20.
Current Account Deficit for 5MFY20 observed a decline of 73% YoY to reach USD 1.82bn, or 1.6% of GDP
from USD 6.7bn or 5.3% of GDP for the same period last year.
For the month of Oct’19, the CA Balance posted a surplus of USD 70mn. This was the first surplus
witnessed after 49 consecutive months.
Major improvement in 5MFY20 as well as monthly basis came on account of declining imports, reflecting in
improved trade deficit. Imports declined by 21% / 13% in 5MFY20 / Nov’19 on a YoY basis.
Imports have declined as a cumulative result of PKR depreciation, imposition of addition regulatory duties,
documentation drive of the government and non-tariff barriers like requirement of halal food certificate for
food imports.
Exhibit: Quarterly Current Account Deficit has declined to USD 1.5bn from USD 6.3bn during 4QFY18
Source: SBP, AHL Research
9
Pakistan Economy
Improving Balance of Payments – CAD down by 73% YoY
(0.6) (1.9) (0.9) (1.5) (1.7)
(3.1)(3.3)
(4.6) (4.5) (4.6) (4.6)
(6.3)
(4.3) (4.3)
(2.1)
(3.2)
(1.5)
(7.0)
(6.0)
(5.0)
(4.0)
(3.0)
(2.0)
(1.0)
-
1Q
FY
16
2Q
FY
16
3Q
FY
16
4Q
FY
16
1Q
FY
17
2Q
FY
17
3Q
FY
17
4Q
FY
17
1Q
FY
18
2Q
FY
18
3Q
FY
18
4Q
FY
18
1Q
FY
19
2Q
FY
19
3Q
FY
19
4Q
FY
19
1Q
FY
20
(USD bn)

Pakistan Strategy 2020 10
Exports are expected to continue their improvement as Pakistan’s REER (Real Effective Exchange Rate)
has become significantly more competitive compared to its competitors. This is also evident in YoY
increase in monthly exports since the start of FY20. In addition, as the currency depreciated, it is also
evident that though the export proceeds did not increase proportionately, export volumes did increase as
REER became more competitive (see exhibit below).
Exhibit: Historical Trend of Exports Volume and Real Effective Exchange Rate
Source (s): PBS, SBP, AHL Research
Exhibit: Real Effective Exchange Rate Exhibit: Increase in Exports Volume is Evident in FY20
Source (s): SBP, AHL Research Source (s): PBS, AHL Research
0%
-5%
3%
1%
-7%
5%4%
-1%
-11%
-2% -2%
-10%
16%
5%
2%
6%
9%
-15%
-12%
-9%
-6%
-3%
0%
3%
6%
9%
12%
15%
18%
Jul-1
8
Au
g-1
8
Se
p-1
8
Oct-
18
Nov-1
8
Dec-1
8
Jan
-19
Fe
b-1
9
Ma
r-19
Ap
r-19
Ma
y-1
9
Jun
-19
Jul-1
9
Au
g-1
9
Se
p-1
9
Oct-
19
Nov-1
9
70.0
80.0
90.0
100.0
110.0
120.0
130.0
Jan
-13
Jun
-13
Nov-1
3
Ap
r-14
Se
p-1
4
Fe
b-1
5
Jul-1
5
Dec-1
5
Ma
y-1
6
Oct-
16
Ma
r-17
Au
g-1
7
Jan
-18
Jun
-18
Nov-1
8
Ap
r-19
Se
p-1
9
REER range of major competitors Pakistan
80.0
85.0
90.0
95.0
100.0
105.0
110.0
115.0
120.0
125.0
130.0 78.0
83.0
88.0
93.0
98.0
103.0
108.0
113.0
118.0
123.0
128.0
Jun
-14
Au
g-1
4
Oct-
14
Dec-1
4
Fe
b-1
5
Ap
r-15
Jun
-15
Au
g-1
5
Oct-
15
Dec-1
5
Fe
b-1
6
Ap
r-16
Jun
-16
Au
g-1
6
Oct-
16
Dec-1
6
Fe
b-1
7
Ap
r-17
Jun
-17
Au
g-1
7
Oct-
17
Dec-1
7
Fe
b-1
8
Ap
r-18
Jun
-18
Au
g-1
8
Oct-
18
Dec-1
8
Fe
b-1
9
Ap
r-19
Jun
-19
Au
g-1
9
Exports Volumes (LHS) Real Effective Exchnage Rate (RHS)
Pakistan Economy
Decline in REER has Improved Export Competitiveness…

Pakistan Strategy 2020 11
With the depreciation of PKR against USD, the Current Account Balance improved and eventually turned
into a surplus during Oct’19. On the other hand, the non-oil Current Account Balance turned into a surplus
since Jul’19, while the overall Current Account generated a surplus in Oct’19. The reason for evaluating
non-oil Current Account surplus is that demand for oil is more or less inelastic and does not correspond to
PKR depreciation or monetary tightening. This shows the impact of adjustment.
Exhibit: Historical Trend of Non Oil CAD (3MMA) and Real Effective Exchange Rate
Source (s): SBP, AHL Research, 3MMA = 3 Month Moving Average
Exhibit: Historical Trend of CAD (3MMA) and Exchange Rate (3MMA)
Source (s): SBP, AHL Research, 3MMA = 3 Month Moving Average
Pakistan Economy
… While Stabilizing Balance of Payments
0.01
0.01
0.01
0.01
0.01
0.01
0.01
0.01
0.01
-
0.3
0.5
0.8
1.0
1.3
1.5
1.8
2.0
2.3
Dec-1
6
Jan
-17
Fe
b-1
7
Ma
r-1
7
Ap
r-17
Ma
y-1
7
Jun
-17
Jul-
17
Au
g-1
7
Se
p-1
7
Oct-
17
No
v-1
7
Dec-1
7
Jan
-18
Fe
b-1
8
Ma
r-1
8
Ap
r-18
Ma
y-1
8
Jun
-18
Jul-
18
Au
g-1
8
Se
p-1
8
Oct-
18
Nov-1
8
Dec-1
8
Jan
-19
Fe
b-1
9
Ma
r-1
9
Ap
r-19
Ma
y-1
9
Jun
-19
Jul-
19
Au
g-1
9
Se
p-1
9
Oct-
19
Nov-1
9
Current Account Deficit (LHS) USD/PKR (RHS)
(USD bn)
85.0
90.0
95.0
100.0
105.0
110.0
115.0
120.0
125.0
130.0 (1.0)
(0.8)
(0.5)
(0.3)
-
0.3
0.5
0.8
1.0
1.3
1.5
1.8
2.0
2.3
Dec-1
6
Jan
-17
Fe
b-1
7
Mar-
17
Ap
r-17
Ma
y-1
7
Jun
-17
Jul-1
7
Au
g-1
7
Se
p-1
7
Oct-
17
Nov-1
7
Dec-1
7
Jan
-18
Fe
b-1
8
Mar-
18
Ap
r-18
Ma
y-1
8
Jun
-18
Jul-1
8
Au
g-1
8
Se
p-1
8
Oct-
18
Nov-1
8
Dec-1
8
Jan
-19
Fe
b-1
9
Mar-
19
Ap
r-19
Ma
y-1
9
Jun
-19
Jul-1
9
Au
g-1
9
Se
p-1
9
Oct-
19
Non Oil Current Account Deficit (LHS) Current Account Deficit (LHS) Real Effective Exchnage Rate
(USD bn)

Pakistan Strategy 2020 12
PKR has appreciated by 3.0% since Jun’19, after depreciating by 32.1% since Dec’17.
REER went below 100 in Dec’18 after remaining higher for a period of 65 months. A REER below 100
suggests that the currency is competitive compared to Pakistan’s trading partners. At present, the REER
hovers at 95.
Foreign Currency Reserves held by SBP have increased by USD 3.6bn since June end i.e. after entering the
IMF program.
Pakistan has retired short swaps amounting USD 1.95bn since the start of Jul’19. This has also helped
currency parity achieve stability.
Moreover, the country has attracted USD 1.2bn of foreign investment in its treasury bills, which is the highest
in the industry and is showing the confidence of foreign investors in its currency parity and economic
reforms.
Foreign Direct Investment has surged by 78% YoY during 5MFY20 to USD 850mn, showing confidence of
foreign investors in Pakistan’s economy. Norway remained the largest investor in Pakistan (Telenor’s license
payment) whereas, China remained the second largest investor.
Exhibit: REER and PKR/USDExhibit: Net Foreign Investment in T.Bills has crossed
1.2bn
Source (s): SBP, AHL Research Source (s): SBP, AHL Research
80.00
90.00
100.00
110.00
120.00
130.00
140.00
150.00
160.00
Jan
-13
Jun
-13
Nov-1
3
Ap
r-14
Se
p-1
4
Fe
b-1
5
Jul-1
5
Dec-1
5
Ma
y-1
6
Oct-
16
Ma
r-17
Au
g-1
7
Jan
-18
Jun
-18
Nov-1
8
Ap
r-19
Real Effective Exchange Rate Avg. PKR/USD
Exhibit: Foreign Direct Investment went up by 78% during 5MFY20
Source (s): SBP, AHL Research
USD mn Nov-19 Nov-18 YoY 5MFY20 5MFY19 YoY
Inflow 249 392 -37% 1,176 1,446 -19%
Outflow 48 107 -55% 326 969 -66%
Net 200 285 -30% 850 477 78%
15 71
246
108
713
49 15 86
333 441
1,154 1,203
-
200
400
600
800
1,000
1,200
1,400
Jul-19 Aug-19 Sep-19 Oct-19 Nov-19 Dec'19TD
Monthly Cumulative FY20TD(USD mn)
Pakistan Economy
Foreign Investment Surges with Improving Confidence

Pakistan Strategy 2020 13
The impact of adjustment in exchange rate and prior overvaluation of PKR (REER down to 94.7 from a
high of 123.5) is now visible in the Current Account Balance, which entered into surplus on monthly basis
in Oct’19 and continues to remain muted (CAD at USD 319mn in Nov’19) from a high of USD 2bn per
month.
Decline in imports (21% in 5MFY20) has played a major role in stabilization of Balance of Payments.
The government’s drive or documentation has also played a major role in curtailing imports. In addition,
certain non-tariff barriers on food imports like requirement of halal certification etc. has also helped subdue
imports.
This shows that PKR depreciation has helped curtail imports and reduced uncertainty regarding Balance of
Payments.
Weak economic growth (GDP growth declined from 5.5% during FY18 to 3.3% during FY19),
documentation of economy (implementation of condition for CNIC), higher interest rates (+750bps since
Jan’18) and weak exchange rate parity (PKR down by 32% since Dec’17) have helped curtail imports and
control the Current Account Deficit. Consequently, as we transcend past the consolidation phase, the
Current Account Deficit is expected to be restricted at USD 5.0bn during FY20.
Exhibit: Historical and Expected Current Account Deficit
Source (s): SBP, AHL Research
Pakistan Economy
FY20 Current Account Deficit to Decline by 64% YoY
(USD mn) FY15A FY16A FY17A FY18A FY19A YoY FY20F YoY
Current Account Balance -2,795 -4,867 -12,621 -19,897 -13,830 -30% -5,020 -64%
Exports of Goods 24,090 21,972 22,003 24,768 24,251 -2% 25,949 7%
Imports of Goods 41,357 41,255 48,683 56,592 52,768 -7% 47,000 -11%
Trade Balance (Goods) -17,267 -19,283 -26,680 -31,824 -28,517 -10% -21,051 -26%
Exports of Services 5,878 5,459 5,555 5,288 5,260 -1% 5,000 -5%
Imports of Services 8,848 8,865 9,894 11,356 9,527 -16% 8,000 -16%
Trade Balance (Services) -2,970 -3,406 -4,339 -6,068 -4,267 -30% -3,000 -30%
Trade Balance (Total) -20,237 -22,689 -31,019 -37,892 -32,784 -13% -24,051 -27%
Primary Income Balance -4,599 -5,347 -5,048 -5,484 -5,709 4% -6,643 16%
Workers' Remittances 18,721 19,917 19,351 19,914 21,838 10% 22,538 3%
Secondary Income Balance 22,041 23,169 23,446 23,479 24,663 5% 25,674 4%

Pakistan Strategy 2020 14
In Oct’19, the FATF (Financial Action Task Force) handed out another extension to Pakistan, maintaining its
status on the grey list until Feb’20. While significant progress has been made as identified by the Asia
Pacific Group (APG) - a regional affiliate body for the Asia-Pacific region of the FATF – certain loopholes still
exist such as the nonexistence of a formal framework to combat money laundering and eliminate terrorist
financing.
When it comes to ratings, Pakistan was assigned low on nine out of ten (9/10) Effectiveness Ratings of the
APG and moderate on one. Whereas the APG also acknowledged that with respect to Technical
Compliance Ratings, Pakistan was only fully compliant with one recommendation, largely compliant with
nine (9), partially compliant with twenty-six (26) and non-compliant with four (4) recommendations of the
FATF.
To recall, Pakistan was placed on FATF’s Grey List in Jun’18 whereby it was found non-compliant with
recommendations of the FATF which targeted areas of risk assessment, national cooperation, targeted
sanctions, preventative measures, due diligence, internal and third party controls, law enforcement,
regulation and supervision for money laundering and terror financing, amongst others. Thereafter, the
incumbent government made a commitment to combat such risks to the financial system of the country and
adhere to 40 key recommendations of the FATF.
We view that the government has been proactive in addressing the major concerns of the FATF in an
attempt to combat money laundering and terrorist financing. For example, the National Risk Assessment
Framework 2019 has included various elements that were not included in the 2017 document. Recently the
Governor SBP spoke of the freezing of numerous bank accounts by the SBP. We view that blacklisting is a
highly improbable scenario and Pakistan should be able to get another extension in Feb’20.
Pakistan Economy
FATF – Grey List Status Maintained, Blacklisting Highly Improbable

Pakistan Strategy 2020
Exhibit: Performance Criteria
Source (s): IMF Staff Report, AHL Research
15
On July 3, 2019, the Executive Board of the IMF program approved a 39-month arrangement under the
Extended Fund Facility (EFF) for an amount of USD 6 billion to support the Government of Pakistan’s
economic reform program. Major highlights of the program include:
Sustainable and balanced growth.
Increased per capita income.
Fiscal consolidation to reduce public debt, expansion of social spending and safety net for the most
vulnerable segments of the society.
Adoption of Budget FY20 is an important step towards this objective
o Multi year revenue mobilization strategy to include broadening of tax base and raising tax revenue in an
equitable manner.
o Strong commitment from provinces to support consolidation effort, effective public financial management
and improving the quality and efficiency of public spending.
o Significant increase in resources allocated to key social assistance programs, supporting measures for
economic empowerment of women and investment in poverty stricken areas.
A flexible and market determined exchange rate
o This will help restore competitiveness, rebuild official reserves and provide a buffer against external
shocks.
Adequate tight monetary policy to correct imbalances.
Strengthening of SBP’s autonomy to deliver on its mandate of price and financial stability.
Elimination of financing of fiscal deficit by the SBP.
The fund’s immediate disbursement was USD 1 billion, with another ~USD 453mn expected soon.
The approval has unlocked ~USD 38 billion from Pakistan’s international partners over the program period.
Performance CriteriaTarget
Sep’19 End
Actual
Sep-19 EndCurrent
Target
Dec’19 End
Target
Mar’20 End
Target
Jun’20 End
Floor on net international reserves of the SBP
(USD mn)-18,478 -16,000 -13,023 -16,311 -12,844 -10,790
Ceiling on net domestic assets of the SBP
(PKR bn)8,911 6,611 6,577 8,800 8,445 8,727
Ceiling on SBP's stock of net foreign currency
swaps/forward position (USD mn)8,055 6,770 5,022 8,055 8,055 7,555
Ceiling on general government primary budget
deficit (PKR bn)102 286 na 145 193 276
Ceiling on net government budgetary borrowing
from the SBP (PKR bn)7,756 5,105 6,829 7,756 7,756 7,187
Ceiling on the amount of government
guarantees (PKR bn)1,611 1,611 1,611 1,611 1,611 1,611
Pakistan Economy
IMF Agreement
Pakistan Strategy 2020
Background
Pakistan faced a challenging macroeconomic situation including slowdown in growth, unsustainable fiscal
and Balance of Payment deficits despite implementation of several stabilization programs.
The current juncture called for coordinated decisive measures to stabilize the economy and lay the
foundation for robust and balanced growth.
Fiscal Policy – Fiscal Consolidation to Reduce Public Debt and Build Resistance
The key pillar of Pakistan’s fiscal strategy is to generate revenue resources to support human capital
development while ensuring debt sustainability.
o Pakistan aims to increase its tax to GDP ratio by 4-5%, to comply with FRDLA (Fiscal Responsibility and
Debt Limitation Act) while creating fiscal space to increase spending on key sectors like health, education,
infrastructure without crowding out private sector. To put in perspective, the target revenue collection is
estimated to increase from present PKR 5.5trn during FY20 to PKR 10.5trn by FY24.
o The recent adoption of budget will bring a primary fiscal adjustment on 1.2% of GDP by increasing
revenue from various means while allocating additional social spending to protect the poor.
o Fiscal consolidation and revenue expansion by provinces will be a key component of Pakistan’s fiscal
strategy.
o To rebalance inter-governmental relationships in the context of NFC which includes progress on
Passing on additional responsibilities from federal to provincial governments including additional
contributions for higher education, health, social protection, agricultural subsidies and regional
public infrastructure.
Reducing the scope of divisible pool in the context of the ongoing NFC award.
Increase in tax collection efforts by provinces focusing on sales tax on services, property tax and
agricultural income tax.
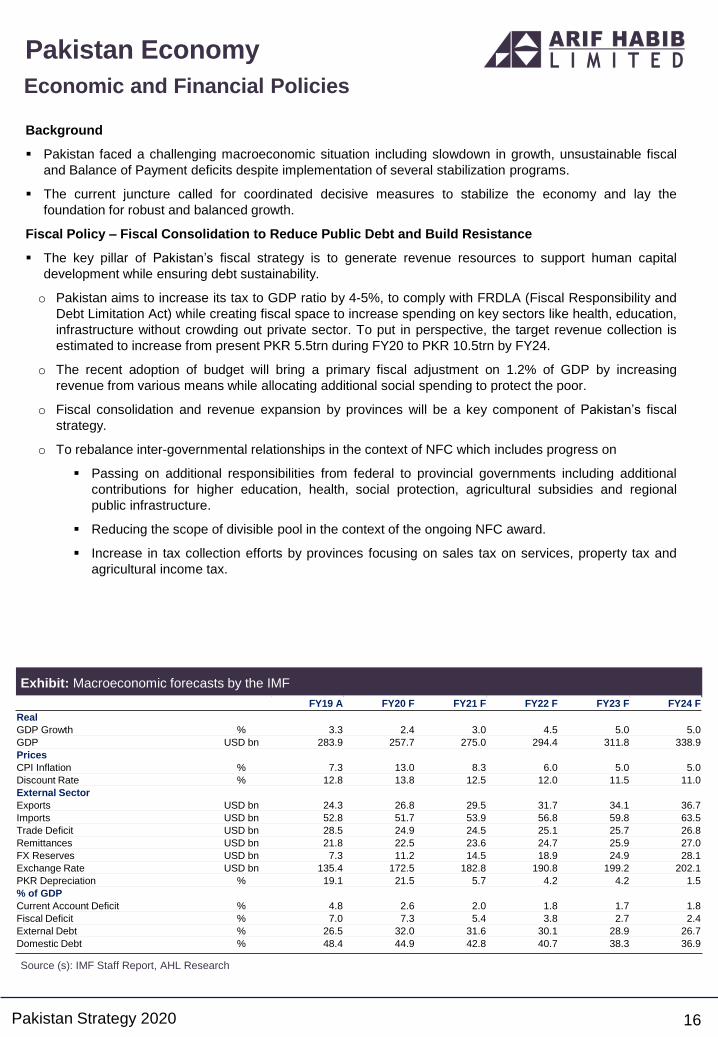
Exhibit: Macroeconomic forecasts by the IMF
Source (s): IMF Staff Report, AHL Research
16
FY19 A FY20 F FY21 F FY22 F FY23 F FY24 F
Real
GDP Growth % 3.3 2.4 3.0 4.5 5.0 5.0
GDP USD bn 283.9 257.7 275.0 294.4 311.8 338.9
Prices
CPI Inflation % 7.3 13.0 8.3 6.0 5.0 5.0
Discount Rate % 12.8 13.8 12.5 12.0 11.5 11.0
External Sector
Exports USD bn 24.3 26.8 29.5 31.7 34.1 36.7
Imports USD bn 52.8 51.7 53.9 56.8 59.8 63.5
Trade Deficit USD bn 28.5 24.9 24.5 25.1 25.7 26.8
Remittances USD bn 21.8 22.5 23.6 24.7 25.9 27.0
FX Reserves USD bn 7.3 11.2 14.5 18.9 24.9 28.1
Exchange Rate USD bn 135.4 172.5 182.8 190.8 199.2 202.1
PKR Depreciation % 19.1 21.5 5.7 4.2 4.2 1.5
% of GDP
Current Account Deficit % 4.8 2.6 2.0 1.8 1.7 1.8
Fiscal Deficit % 7.0 7.3 5.4 3.8 2.7 2.4
External Debt % 26.5 32.0 31.6 30.1 28.9 26.7
Domestic Debt % 48.4 44.9 42.8 40.7 38.3 36.9
Pakistan Economy
Economic and Financial Policies

Pakistan Strategy 2020
Flexible and Market determined Exchange Rate to Restore Competitiveness
Monetary Policy will be focused on gradually reducing and keeping inflation low and stable.
Maintaining a flexible market determined exchange rate will
o Modernize the foreign exchange regime and functioning of financial markets.
o Contribute to better allocation of resources in the economy.
o Help reduce accumulated external imbalances.
o Provide a buffer against shocks.
o Help rebuild foreign exchange reserves.
Monetary Policy Would Remain Tight to Shore Up Confidence and Reach the Inflation Objective
o Keep the real policy rate positive to control inflation in the future.
o Proactive policy response to control inflation from exogenous shocks while keeping monetary aggregates
under control.
o Eliminate deficit financing from SBP, reduce SBP stock of net government borrowing gradually over time.
Sell stock of SBP borrowing in the form of tradeable instruments of various maturities.
o Amendment in SBP Act to strengthen its autonomy, governance and mandate.
Strengthen the AML/CFT framework in line with international standards to support the country’s exit from
FATF list of jurisdictions with serious deficiencies.
Exhibit: Improving External Finances
Source (s): SBP, AHL Research
17
Pakistan Economy
Monetary and Exchange Rate Policies
(20.0)
(15.0)
(10.0)
(5.0)
-
5.0
10.0
15.0
-
0.00
0.00
0.01
0.01
0.01
0.01
0.01
0.02
0.02
Jan
-07
Ma
y-0
7
Se
p-0
7
Jan
-08
Ma
y-0
8
Se
p-0
8
Jan
-09
Ma
y-0
9
Se
p-0
9
Jan
-10
May-1
0
Se
p-1
0
Jan
-11
Ma
y-1
1
Se
p-1
1
Jan
-12
Ma
y-1
2
Se
p-1
2
Jan
-13
Ma
y-1
3
Se
p-1
3
Jan
-14
Ma
y-1
4
Se
p-1
4
Jan
-15
Ma
y-1
5
Se
p-1
5
Jan
-16
Ma
y-1
6
Se
p-1
6
Jan
-17
Ma
y-1
7
Se
p-1
7
Jan
-18
Ma
y-1
8
Se
p-1
8
Jan
-19
Ma
y-1
9
Se
p-1
9
USD/PKR (Month End) Net Foreign Currency Swaps (RHS) Net International Reserves (RHS)
(USD bn)

Pakistan Strategy 2020 18
Energy Sector Reforms to Eliminate Quasi Fiscal Losses and Encourage Investment
Pakistan is launching comprehensive energy sector reforms to address long standing inefficiencies in the
power sector .
o Stock of circular debt stands at PKR 1.6trn, in addition to PKR 806bn parked in PHPL.
o PKR 350bn worth of circular debt was accumulated in FY19.
Steps to ensure a successful reform
o Adjusting tariffs in line with regulator’s (NEPRA) determination. Electricity tariff schedule as determined by
the regulator was notified by end Sep’19.
o Develop a strategy to address circular debt in the power sector
o Prepare a comprehensive plan to reduce circular debt in collaboration with international partners with
quarterly targets for losses, collection and accumulation of arrears.
o Ensure regular and timely notifications for end-consumer tariffs in the electricity sector
o Changes in the NEPRA Act to
o Ensure full automaticity of the quarterly tariff adjustments.
o Eliminate the gap between regular annual tariff determination and notification by the government.
Following measures are being taken to improve the performance of the gas sector
o Adoption of the FY20 gas tariff adjustment as proposed by the regulator (OGRA).
o Reduction in UFG losses from present level of 13%.
o Invite private sector investment in the gas sector
o Unbundle of SSGC and SNGPL by integrating the transmission segment and creating multiple
DISCOS.
o Review petroleum policy to incentivize domestic exploration of oil and gas.
o Operationalize third party access rules enabling customers to buy gas directly from the terminal.
Exhibit: CPP* to Reach at PKR 6.67/KWh Exhibit: CPP will be 55% of Total Tariff* by 2020
Source (s): CPPA (G), AHL Research, * Capacity Purchase Price Source (s): CPPA (G), AHL Research, *Generation Stage
62%
38%45%
55%
EPP CPP
FY20E FY16
4.6 5.36.2 6.2 5.4
2.83.1
3.54.6 6.7
-
2.00
4.00
6.00
8.00
10.00
12.00
14.00
FY16 FY17 FY18 FY19 FY20E
EPP CPP
(PKR / KWh)
Pakistan Economy
Energy Sector Reforms

Pakistan Strategy 2020 19
Committed to Improve SOEs Performance Via Enhancement of Productivity
Privatization of 2 RLNG fired power plants, SME Bank and First Women Bank, Jinnah Convention Centre
and Services International Hotel.
Strengthen monitoring of SOEs.
Increase SOE transparency
o Audits of PSM and PIA by international reputed auditors.
Establish a holding company to manage SOEs.
The government’s efforts to minimize losses of SOE’s are visible. In particular, the government wants to
turnaround SOE’s like PSM and PIA. For PSM, the government is planning to engage a strategic partner
while for PIA, new management is being hired and empowered to improve operational efficiency.
Exhibit: Top Ten Profit Making Companies (SOEs) Exhibit: Top Ten Loss Making Companies (SOEs)
Source (s): MoF, AHL ResearchSource (s): MoF, AHL Research, *Pakistan Railways, **Sindh
Engineering
133.5
40.7 39.6 37.4 27.3
19.4 19.3 18.7 17.9 14.9
-
20.0
40.0
60.0
80.0
100.0
120.0
140.0
160.0
NH
A
PR
*
PIA
C
LE
SC
O
HE
SC
O
PE
SC
O
SE
**
QE
SC
O
ME
PC
O
PS
M
(PKR bn)
63.8
35.7
20.3 19.1 18.2 17.0 10.6 8.6 7.5
3.7
-
10.0
20.0
30.0
40.0
50.0
60.0
70.0
OG
DC
PP
L
GH
PL
PA
RC
O
PS
O
WA
PD
A
NT
DC
SN
GP
L
GE
PC
O
GE
NC
O –
II
(PKR bn)
Pakistan Economy
Committed to improve SOEs performance

Pakistan Strategy 2020 20
BOP/CAD Improvement to Continue, Reserves to Improve
Going forward, we believe the situation on the Balance of Payments front would continue to improve as
narrowing CAD controls outflow of foreign exchange while planned inflows to retire predetermined
obligations along with Foreign portfolio investment, strengthens foreign exchange reserves. We believe
foreign exchange reserves would continue to increase and the SBP reserves will cross USD 11bn by
Jun’20 and USD 13bn by Dec’20.
Foreign Direct Investment and Exports are Key for Future Economic Growth
The economic growth is expected to improve from FY21, whereby results of the government’s steps such
as supporting exports, agriculture, documentation, import substitution, housing are expected to yield
results. Elimination of under-invoicing and smuggling is expected to support domestic industry and will
result in foreign and domestic investment into import replacement sectors i.e. Electronics, Food
Processing, Steel, Poultry, Tyre Manufacturing, Auto Assembling and Dairy Processing.
Inflation is expected to come down to a single digit from Apr’20 onwards as the impact of currency
depreciation as well as increase in utility prices dilutes. However, prices of gas are expected to rise by 15-
135% as demanded by SNGPL, therefore, slight inflationary pressure may persist.
We believe Interest rates would start declining from Mar’20 as inflation is expected to recede to an average
of 10% for 4QFY20.
In order to retain export competitiveness, we expect exchange rate to depreciate to PKR 157.5 by Jun’20
and to PKR 160/USD by Dec’20.
Exhibit: Key Economic Indicators
Source (s): SBP, PBS, MoF, AHL Research
FY13A FY14A FY15A FY16A FY17A FY18A FY19A FY20F FY21F
Real
GDP 3.7% 4.0% 4.1% 4.6% 5.4% 5.5% 3.3% 3.8% 3.8%
GDP (USD bn) 236.4 246.7 270.0 283.7 303.8 314.6 283.9 275.4 299.0
Prices
CPI (% YoY) 7.4% 8.6% 4.6% 2.9% 4.2% 3.9% 7.3% 11.0% 8.0%
Discount Rate - Period end 9.00% 10.00% 7.00% 6.25% 6.25% 7.00% 12.75% 12.75% 11.00%
External Sector (USD bn)
Exports 24.8 25.1 24.1 22.0 22.0 24.8 24.3 25.9 26.8
Imports 40.2 41.7 41.4 41.3 48.7 56.6 52.8 47.0 51.7
Trade Deficit 15.4 16.6 17.3 19.3 26.7 31.8 28.5 21.1 24.9
Remittances 13.9 15.8 18.7 19.9 19.4 19.9 21.8 22.5 22.5
FX Reserves (Period End) 11.0 14.1 18.7 23.1 21.4 16.4 14.5 18.0 20.0
Exchange Rate (Period End) 99.7 98.8 101.8 104.8 104.9 121.5 160.1 157.5 167.1
PKR Depreciation (%) (5.1) 0.9 (3.0) (2.8) (0.1) (13.7) (24.1) 1.6 (5.7)
(% of GDP)
Current Account Deficit 1.1% 1.3% 1.0% 1.7% 4.1% 6.3% 4.9% 1.8% 1.8%
Trade Deficit 6.5% 6.7% 6.4% 6.8% 8.8% 10.1% 10.0% 7.6% 8.3%
Fiscal Deficit 8.0% 5.5% 5.3% 4.6% 5.8% 6.6% 8.9% 7.1% 5.1%
External Debt 25.8% 26.5% 24.1% 26.1% 27.5% 30.3% 37.4% 39.9% 37.9%
Domestic Debt 40.4% 44.8% 44.3% 45.8% 46.6% 42.9% 45.6% 54.2% 53.3%
Pakistan Economy
Outlook: Macroeconomic Stability Achieved, Looking for growth

Pakistan Strategy 2020 21
Equity Market
Back on its Feet

Pakistan Strategy 2020
Barring the last couple of months, CY19 was nothing short of a horror story for the equity market
with a dominating bearish trend. During the year, the KSE-100 index crashed to a 5-Yr low of
28,765pts on 16th Aug’19, which was a 22% contraction since Dec’18 and a 31% decline on a
YoY basis.
The despondency in the investment climate was encapsulated by the PTI gov’t severely
struggling to grapple with the economic headwinds that it was hammered with immediately upon
taking charge. Although the external account had begun showing signs of moderation, during
2QCY19, the CAD had widened by 54% QoQ as imports had ballooned 5% while exports
remained stagnant. Total FX reserves hovered at USD 14.5bn at the end of FY19 (down by 12%
YoY) which consequently stressed the currency with the PKR/USD parity rocketing to a high of
164 on 27th Jun (26% YoY depreciation). On the fiscal front, the budget deficit had clocked-in at a
28-Yr high of 8.9% of GDP for FY19 as total expenditure had ballooned 11% YoY with domestic
debt servicing increasing by a mammoth 38% YoY. Inflationary pressure in the economy was
exacerbating following the multiple rounds of depreciation and other cost-push factors, settling at
8% in Jun’19 compared to 5.7% in Jun’18. Monetary tightening continued until Jul’19 with interest
rates increasing by 300 bps since Jan’19 as the SBP’s efforts to arrest aggregate demand
continued. Higher interest rates were a double edged sword – compressing cash cycles, creating
liquidity constraints for companies on one side, whilst making fixed income instruments attractive
leading to redemptions from equity portfolios in mutual funds on the other. All the aforementioned
economic troubles led to subdued economic activity with GDP growth settling at 3.3% for FY19
(FY18: 5.5%).
Furthermore, stringent conditions attached with the USD 6bn IMF bailout package such as 40%
higher FBR tax revenue target and cap on sovereign guarantees were sources of further
pessimism. Meanwhile, tension on the border with India following the air combat in Feb’19 had its
own adverse effects on the overall sentiment.
Exhibit: Historical Trend of Price to Earning and 10Y PIB
Source: Bloomberg, AHL Research
22
Pakistan Equity Market
Economic Headwinds Weighed in on Index
-
2.00
4.00
6.00
8.00
10.00
12.00
14.00
16.00
4.00%
6.00%
8.00%
10.00%
12.00%
14.00%
16.00%
18.00%
Jan
-06
Jun
-06
Nov-0
6
Ap
r-07
Se
p-0
7
Fe
b-0
8
Jul-
08
Dec-0
8
Ma
y-0
9
Oct-
09
Ma
r-1
0
Au
g-1
0
Jan
-11
Jun
-11
Nov-1
1
Ap
r-12
Se
p-1
2
Fe
b-1
3
Jul-
13
Dec-1
3
Ma
y-1
4
Oct-
14
Ma
r-1
5
Au
g-1
5
Jan
-16
Jun
-16
No
v-1
6
Ap
r-17
Se
p-1
7
Fe
b-1
8
Jul-
18
Dec-1
8
Ma
y-1
9
Oct-
19
10Y PIB PE

Pakistan Strategy 2020
The domestic equity bourse showed a sharp inflection post its low in Aug’19. Till date, since its low the
market has shown a remarkable rebound of 39%, and in effect turning the CY return positive. Undoubtedly,
dirt cheap valuations across the index and over-selling were pivotal factors for the impressive market
performance but we see the economy entering into stabilization mode as a more sustainable and important
reason.
In this regard, we think the Jul’19 SBP MPS was very crucial in which the SBP spoke of all adjustments
related to interest rate and exchange rate from previously accumulated imbalances that had taken place.
The statement gave birth to expectations of monetary easing from 3QFY20 when the SBP expects
inflationary pressure to recede. This led to the start of decline in fixed income yields and an inversion of the
yield curve. Rates on National Saving Certificates also faced a cut. The decline in yields of these asset
classes spurred jubilance in the stock market.
Furthermore, FX reserves started building up with the advent of the new fiscal year and have increased by
USD 3.2bn to settle at USD 17.7bn till the second week of Dec’19. The reserves build-up was led primarily
by diffusion of uncertainty over the external account as the CAD has contracted by 73% YoY during
5MFY20 with a surplus in Oct’19 of USD 70mn – a first in 49 months.
In addition to this, SBP’s liabilities in lieu of futures and swaps also started declining. Lucrative yields on
fixed income instruments have also managed to lure in foreign investments in T-Bills which has crossed the
USD 1.2bn mark in FYTD – a major boost for reserves. The consolidation of reserves and critically needed
contraction in imports has boosted import cover to 2.2 months compared to 1.3 at the start of CY19.
Exhibit: Historical Trend of KSE-100 and SBP Reserves
Source: SBP, PSX, AHL Research
23
Pakistan Equity Market
Ending the Year On a High
-
5.0
10.0
15.0
20.0
25.0
-
10,000
20,000
30,000
40,000
50,000
60,000
Jul-
12
Oct-
12
Jan
-13
Ap
r-13
Jul-
13
Oct-
13
Jan
-14
Ap
r-14
Jul-
14
Oct-
14
Jan
-15
Ap
r-15
Jul-
15
Oct-
15
Jan
-16
Ap
r-16
Jul-
16
Oct-
16
Jan
-17
Ap
r-17
Jul-
17
Oct-
17
Jan
-18
Ap
r-18
Jul-
18
Oct-
18
Jan
-19
Ap
r-19
Jul-
19
Oct-
19
KSE100 Index SBP Reserves (RHS) (USD bn)

Pakistan Strategy 2020 24
KSE100 IndexEvent Graph
-
100
200
300
400
500
600
700
800
900
1,000
20,000
25,000
30,000
35,000
40,000
45,000
Jan-1
9
Feb
-19
Ma
r-1
9
Apr-
19
Ma
y-1
9
Jun-1
9
Jul-1
9
Aug-1
9
Sep-1
9
Oct-
19
No
v-1
9
De
c-1
9
KSE Volume KSE100 Index(mn Shares)
Commitment from Crown Prince to
support Pakistan in financial crisis
Approval of State Fund which
will buy scrips of SOEs.
Concerns over ambitious
economic targets amid
agreement of IMF Program
Tensions on the Pak-India
border
Decline in Fixed Income Yields
Current Account turns Surplus after
49 months
Moody changes
Pakistan's outlook from
negative to stable
Supreme Court of
Pakistan grants
six months
extension to
COAS
FATF retains Pak on Grey
List until Feb'20
Cut in National Savings
Schemes
Developments on the
opposition’s Azadi March

Pakistan Strategy 2020 25
Lowest Average Volume and Value since CY11: During CY19TD, while the domestic bourse crashed to
the 28k mark (lowest 5-Yr level) on account of reasons discussed earlier, average volumes dropped to a 7-
Yr low (last observed in CY11) at 155mn shares, down 16% YoY compared to CY18 average volumes of
185mn shares. This year volumes registered a high of 557mn shares on 2nd Dec’19 - highest volumes since
MSCI Emerging Market inclusion on 24th May’17 of 607mn shares. On the other hand, this year the market
witnessed decade low volumes of 39mn shares on 10th May’19. Likewise, average value traded plunged by
42% YoY to USD 38mn (this level was last observed in CY10) compared to USD 66mn in CY18. The
decline in market activity was primarily a result of: i) Further monetary tightening by 325bps during CY19,
making fixed income instruments more attractive, and ii) Documentation drive by the government which
adversely affected the flow of undocumented money in the market. Pertinently, highest value traded value
on a single day arrived at USD 130mn on 5th Dec’19.
Rally in Second Half Aided Volumes: We do highlight that volumes have shown relative recovery in
2HCY19 (avg. volumes in 2H arrived at 184mn shares vs. 132mn shares in 1H) as investor confidence in
the market recovered. Evidently, volumes in Nov’19 (at 305mn shares) were the highest since May’17 (at
337mn shares).
Sectors-wise Volume Breakup: Sectors that attracted major volumes during the year were Cements,
Commercial Banks, Technology & Communication, Power Generation, and Chemicals registering average
volumes of 22.0mn, 19.2mn, 15.6mn, 12.2mn and 12.1mn, respectively. Whereas on a scrip-wise basis,
volumes were led by BOP (9.52mn), LOTCHEM (8.97mn) and KEL (8.64mn).
Index Contribution: Gainers dominating the index contributions included Commercial Banks (1,942pts,
50% of total increase in index) followed by Fertilizer (1,464pts, 38% of total increase), Oil & Gas Exploration
Companies (704pts, 18% of total increase), Automobile Assembler (126pts, 3% of total increase), and
Technology & Communication (91pts, 2% of total increase). Meanwhile, scrip wise top contributions to the
upside were led by HBL (655pts, 17% of total increase), UBL (611pts, 16% of total increase), and ENGRO
(607pts, 16% of total increase) primarily attributable to: i) HBL’s non-recurring expenses/losses (Business
Transformation/NY remediation, compliance costs and revaluation loss on open FX position) tapering off,
and ii) Reduced overseas provisioning and build-up of international coverage by UBL, and iii)
Commencement of Engro’s long-awaited Thar Coal Project. Scrip wise negative contributors were i)
KAPCO (-125 pts), ii) HASCOL (-111 pts), and iii) FFBL (-95 pts) on account of i) KAPCO’s low dividend
payout during the year, ii) HASCOL’s inventory and exchange losses leading to significant losses in 9M
period as well as in CY19E, and iii) FFBL’s low DAP offtakes/primary margins.
Exhibit: ADTV Declined by 41% YoY during CY19 Exhibit: Index contribution of Top 5-Sectors
Source (s): PSX, AHL Research Source (s): PSX, AHL Research
79
173
223 209
247 282
237
185 155
-
20
40
60
80
100
120
140
-
50
100
150
200
250
300
CY
-11
CY
-12
CY
-13
CY
-14
CY
-15
CY
-16
CY
-17
CY
-18
CY
-19T
D
Avg. Traded Volume Avg. Traded Value (RHS)
(mn Shares) (USD mn) 1,942
1,464
704
126 91
-
500
1,000
1,500
2,000
2,500
Banks Fertilizer E&Ps Autos Telecom
Pakistan Equity Market
Average Volume and Value at Seven Year Low

Pakistan Strategy 2020 26
Intensified Foreign Selling Comes to an End: After four consecutive years of foreign outflows from PSX
(beyond USD 1.6bn in aggregate - fully absorbed by local investors and institutions), this year we witnessed
foreigners cashing in on the revival in economic fortunes in Pakistan and accumulating stocks worth USD
59mn compared to net sell of USD 537mn in CY18, which was a despondent year for PSX in terms of
foreign selling. Sentiment of foreign investors improved on the back of i) Cheap Valuations, ii) Market
determined exchange rate helping stability of the PKR/USD parity, and iii) Reduction in CAD and build-up of
foreign exchange reserves. On the local front, major offloading was led by Mutual Funds (USD 168mn) and
Insurance companies (USD 65mn) in CY19.
Sector-wise Accumulation: Major foreign buying was witnessed in i) Commercial Banks (USD 69mn)
given expanding NIMs from higher interest rates, ii) Cements (USD 34mn) due to lower coal prices, higher
dispatches in FYTD and expectation of a rate cut cycle starting in CY20 iii) Fertilizer (USD 29mn) amid
stable offtake and higher pricing power, iv) Oil and Gas Marketing Companies (USD 7mn), and v) All Other
Sectors (USD 4mn).
Individuals Led the Rally Since Market Low: Since the market touched its low in Aug’19, Individuals have
bought equities worth USD 103mn. Following this, Other Organizations and Funds were the largest
accumulators with net buying set at USD 21mn and USD 10mn, respectively. On the flipside, selling was
undertaken by Banks, Insurance Companies and Foreigners at USD 74mn, USD 44mn and USD 18mn,
respectively.
China Witnessed Significant Capital Outflow in the Region During CY19: China witnessed massive
outflow of USD 320bn as foreign investors continuously pulled out their capital due to escalated trade war
between US and China, along with Chinese government’s proposed extradition bill, whereby protests in
Hong Kong triggered a recession (capital flight) as a number of sectors have come under pressure. Further,
data of the Asia-Pac region reveals that outflows were also witnessed in Malaysia, Thailand, and Japan at
USD 2,679mn, USD 1,212mn and USD 908mn, respectively. However, India, Taiwan, Indonesia, Vietnam,
South Korea and Pakistan managed to attract massive foreign inflows of USD 13,295mn, USD 10,388mn,
USD 2,946mn, USD 280mn, USD 130mn, USD 59mn, respectively.
Outlook: We expect foreign investors to continue their buying momentum. With volatility in the exchange
rate parity minimized and stability majorly achieved, alongside continuous improvements on the external
account, we view the consolidation on the macroeconomic front as a key catalyst for foreign interest. We
also highlight political stability as a key component to foreign investors’ confidence in local markets and the
dynamics of the present ruling government should provide that. Moreover, expectation of a decline in
interest rates by 200bps in CY20 should make valuations across the equity market more enticing compared
to debt markets. The KSE-100 index is currently trading at an attractive PE of 7.2x (2020) compared to
regional (Asia-Pac) average of 13.6x, while offering DY of ~7.8% versus~2.6% offered by the region.
Exhibit: Net Foreign Flows (USD mn) Exhibit: Sector Wise Foreign Flows CY19TD* (USD mn)
Source (s): NCCPL, AHL Research, *13-Dec-2019 Source (s): NCCPL, AHL Research, *13-Dec-2019
126
398 383
(315)(361)
(487)(537)
59
(600)
(400)
(200)
-
200
400
600
CY
-12
CY
-13
CY
-14
CY
-15
CY
-16
CY
-17
CY
-18
CY
19
TD
*
(74)
(6)
(5)
(0)2
4
7
29
34
69
(100) (50) - 50 100
E&P
Textile
Food
Power Gen
Telecom
Others
OMC
Fertilizer
Cements
Banks
Pakistan Equity Market
Foreigners Portray Optimism Post 4-Yr Drought

Pakistan Strategy 2020 27
Textiles Lead the Earnings Chart in 2019: Earnings growth of the KSE-100 index in 2019 is expected to
arrive at 7.8%. This was led by the Textile sector, depicting a stunning growth of 57.3% attributable to PKR
depreciation (19% YoY) which aided exchange gains. Following this, the E&P sector underwent a growth of
46.3% in 2019 given a combination of higher crude oil prices (Arab Light was up by 12% YoY) and PKR
depreciation. Finally, we expect the heavy-weight Banking sector to unveil an earnings growth of 20.5% in
lieu of the rising interest rate scenario.
With that said, we project earnings growth of the benchmark index in the upcoming year at a 5-yr high of
14.4%. Top performing sectors are listed below.
I. Power: Power sector is estimated to post an earnings growth of 52.6% on the grounds of HUBC’s
1,320MW imported coal power plant commencing operations in Aug’19.
II. Commercial Banks: Solid profitability growth of the banking sector at 41.1% in 2020, is premised
on the assumption of higher average interest rates and mild recovery in loan growth.
III. Fertilizers: We cite stable offtake alongside pricing power of local manufacturers to translate to
an 11.5% growth in profitability of fertilizer companies in 2020.
IV. E&P: Earnings growth of the E&P sector (9.6% in 2020) is hinged upon average PKR
depreciation on a YoY basis tagged with stable production.
We do highlight that we foresee the Oil and Gas Marketing Companies (OMC’s) to be an outlier in 2020 and
display a massive surge in earnings of 161.4% primarily due to lack of one-time FX and inventory losses
recognized by HASCOL in the outgoing year.
Albeit, underperformance by certain sectors is forecast to contain the otherwise robust earnings growth.
I. Cement: This sector tops the list of dampeners with corporate earnings forecast to decline by
86.9% in 2020 on the back of waning pricing power post inundation of imminent new capacities of
LUCK, KOHC and PIOC (7.3mn tons) together with cost pressures associated with new plants.
II. Automobile Assemblers: Auto companies are expected to exhibit another year of slowdown
(earnings to go down by 27.7% in 2020) marked by cyclical weakness in volumes and inability to
pass on rising cost pressures, which should translate to feeble margins.
III. Textiles: This sector snags the third spot on the laggards list with profitability of the sector likely
to dwindle by 26.8% amid lack of one-off’s (exchange gains).
Exhibit: Corporate Sector Earnings Growth: Trend & Forecast
Source (s): Company Financials, AHL Research
(%) 2014A 2015A 2016A 2017A 2018A 5-Y Avg. 2019E 2020F
E&P 31.6 (29.4) (33.3) 30.7 27.8 5.5 46.3 9.6
Banks 37.2 13.8 0.4 (21.5) 4.8 6.9 20.0 41.1
Fertilizer 0.0 66.4 34.7 (57.1) 41.3 17.1 13.4 11.5
Cement 16.6 15.6 20.3 (2.7) (5.4) 8.8 (32.3) (86.9)
OMCs 46.7 (52.3) 80.0 65.4 (14.6) 25.0 (71.3) 161.4
Autos 12.6 120.7 (1.4) 37.4 8.4 35.5 (37.7) (27.7)
Power (0.4) 29.5 (0.1) (1.2) 9.3 7.4 10.6 52.6
Textiles (1.7) (6.2) 37.1 (13.4) 12.2 5.6 57.3 (26.8)
Chemicals 6.4 20.6 35.4 28.8 64.2 31.1 (1.8) 1.5
Steel 29.4 (21.8) 110.8 148.7 21.7 57.7 (28.7) (16.8)
KSE-100 20.8 7.9 8.3 (9.3) 8.2 7.2 7.8 14.4
Pakistan Equity Market
Earnings Growth Expected at 5-Yr High

Pakistan Strategy 2020 28
Level of the KSE-100 Index is a combination of companies’ performance as well as investors’ confidence in
Pakistan’s economy. Similarly, SBP’s reserves exhibit the country’s ability to finance its imports and other
foreign exchange outflows while maintaining its status as a “Going Concern”.
SBP’s reserves have increased by USD 3.6bn or 50% since the start of FY20. Likewise, the KSE-100 index
has increased by 21% during the same period. Going forward, in the long term, both the indicators which
depict confidence in the economy should move in-tandem with macroeconomic climate accelerating towards
sustainability.
We believe that if the government’s economic reforms (which although are painful for numerous sectors) are
able to bring in foreign inflows on a sustainable basis, investor confidence in the market is likely to sustain
its bullish momentum.
Apart from the timing difference, since the country is under the IMF program, all major outflows/inflows are
already budgeted, planned and adequately funded.
Influx of funds is expected from various sources such as rollover of Saudi Arabia, UAE, Chinese and Qatari
deposits (USD 8.5bn), privatization proceeds (USD 2.0bn), issuance of Eurobonds / Sukuk (USD 3.0bn),
Saudi Oil Facility (USD 1.5bn), and borrowings from multilateral institutions such as ADB, IDB and World
Bank. To recall, debt repayments for the next 12 months starting Sep’19 stand at USD 17.6bn.
Exhibit: KSE-100 and SBP Reserves Exhibit: SBP Reserves and Pakistan Total Reserves
Source (s): SBP, PSX, AHL Research Source (s): SBP, AHL Research
Pakistan Equity Market
KSE-100 vs. Foreign Exchange Reserves
-
2.5
5.0
7.5
10.0
12.5
15.0
17.5
20.0
22.5
25.0
Jun
-99
Jun
-00
Jun
-01
Jun
-02
Jun
-03
Jun
-04
Jun
-05
Jun
-06
Jun
-07
Jun
-08
Jun
-09
Jun
-10
Jun
-11
Jun
-12
Jun
-13
Jun
-14
Jun
-15
Jun
-16
Jun
-17
Jun
-18
Jun
-19
Dec-1
9
Reserves With SBP Reserves With Banks(USD bn)
-
5.0
10.0
15.0
20.0
25.0
-
10,000
20,000
30,000
40,000
50,000
60,000
Jul-1
2
Jan
-13
Jul-1
3
Jan
-14
Jul-1
4
Jan
-15
Jul-1
5
Jan
-16
Jul-1
6
Jan
-17
Jul-1
7
Jan
-18
Jul-1
8
Jan
-19
Jul-1
9
KSE100 Index SBP Reserves (RHS)
(USD bn)

Pakistan Strategy 2020 29
51,000 Index target: Pakistan equity market is expected to generate a total return of 25% during 2020.
We expect the KSE-100 index to reach 51,000 points by Dec’20. Our index target mapping methodology
includes 1) Earnings growth, 2) Justified PER, and 3) Target price mapping.
Sustained FIPI Momentum owing to Macroeconomic Sustainability: We believe that the Balance of
Payments front is quite manageable now with continuous decline in imports, thanks to PKR depreciation
and taxation measures at large to curb imports, along with several inflows planned for the next year tagged
with hot money flows which are expected to lead towards continuous increase in SBP reserves, we view.
Hot Money Flows: The country has successfully managed to attract foreign investment in lucrative short
term government papers. High yields coupled with a strengthening currency have helped lure over USD
1.2bn foreign investment in treasury bills, which is unprecedented in history. This shows the confidence of
foreign investors in local currency parity and economic reforms, and could also trigger equities flows in the
country in 2020.
Earnings Growth: Earnings growth in CY20 is estimated to be 14.4%, the double digit growth is attributable
to earnings growth in heavy weight including Commercial Banks (41%), Power (53%), Fertilizers (12%) and
E&P’s (10%), which have a cumulative ~61.7% weightage in the KSE-100 index. Higher net interest income
coupled with stellar earnings rebound in large banks shall stem growth in the Banking sector, whereas
Power sector profitability mainly stems from CoD of HUBC’s 1,320MW coal-based power plant. Fertilizer
sector growth is premised on stable offtake along with pricing power. While growth of the E&P sector is
driven from PKR depreciation and stable production. Additionally, OMCs should remain in the limelight due
to absences of losses in oil marketing sector i.e. exchange loss and inventory loss.
Reversion to Mean PE: The local bourse is expected to amass strong returns in CY20 supported by
ongoing PER re-rating hypothesis. We view that firmness in external sector, stable foreign currency outlook,
hot money inflows, increase in SBP foreign exchange reserves and strong earnings growth of over 14% will
re-rate the market PE to its mean average of 8.6x (14-Yr). Currently the market is trading at a CY20F PER
of 7.2x, at a discount of 19.4% as compared to mean PE coupled with enticing dividend yield of 6.7% taking
full year return to 26%.
Exhibit: KSE-100 Index Target Estimates 2020 Exhibit: KSE-100 Historical PER
Source (s): AHL Research Source (s): Bloomberg, AHL Research
Pakistan Equity Market
2020 Outlook
Valuation Basis Target
Target Price Based 54,815
Earnings Growth 49,673
Justified PE 48,768
Average Target 2020 51,085
Index Closing 13-Dec-19 40,917
Expected Return 2020 24.9%
Historical Average PE: 8.6x
3.7
5.7
7.7
9.7
11.7
13.7
15.7
Jan
-06
Jan
-07
Jan
-08
Jan
-09
Jan
-10
Jan
-11
Jan
-12
Jan
-13
Jan
-14
Jan
-15
Jan
-16
Jan
-17
Jan
-18
Jan
-19
PE Average

Pakistan Strategy 2020
Sectors
30
Commercial BanksGrowth Story to Continue

Pakistan Strategy 2020 31
Exhibit: Focus on Low-Cost Deposits Exhibit: Strengthening CAR
Source (s): SBP, AHL Research Source (s): SBP, AHL Research
Key Investment Theme
Every Light Has its Shadow: Monetary tightening improved spreads of the sector (6.1% as at Oct’19,
+110 bps YoY) but also compressed cash cycles of companies, squeezed aggregate demand and
adversely impacted loan growth (-8% YoY during Sep’19 vis-à-vis 22% in SPLY). Credit offtake to the
Corporate Sector clocked-in at 10% YoY during Sep’19 (slowing down from 25% during CY18) where
demand for loans was primarily concentrated in working capital financing requirements, which grew by just
16% YoY during Sep’19 (36% during CY18). Loans to SME sector saw a meagre increase of 1% YoY
(CY18: 12%) while commodity financing witnessed a decline of 6.4% (CY18: 17.5%). We expect loan
growth to settle at 2% during CY19 and see an improvement in CY20 (+7% YoY) attributable to increased
demand for working capital financing. Partly some fixed investment through LTFF may be seen from the
textile sector expansion projects as well as new power projects. Additionally, with the economy finally
entering into a phase of stabilization, the gov’t is likely to promote SME financing as part of its National
Financial Inclusion Strategy (NFIS) [aimed to enhance SME financing to 17% of pvt. sector credit (~5%
currently)]. Monetary easing and gradual revival of economic activity in the country are likely to be
catalysts too.
Deposit Growth Revival: With inflation to begin its downhill journey next year, we expect monetary easing
to start which should allow NPL build-up to slow down. Moreover, deposit growth is likely to inflect as well
after a slowdown (5% in CYTD) – a repercussion of the documentation drive, increased KYC requirements
by banks, and banks chasing current accounts/shedding off fixed deposits. Currency in circulation as a
proportion of deposits is currently ~30% and had touched an all-time high of 37% in May’19. We see
deposit growth to pick up and clock-in at 9.3% during CY20 and 12% in CY21. Deposit base expansion of
banks is likely to be mobilized towards investments as banks would lock-in attractive yields in government
papers. Re-profiling of investment book following maturity of legacy bonds coupled with investments in
attractive shorter term securities (inverted yield curve) would help fuel investment yields.
Commercial Banks
Growth Story to Continue
Mkt Cap (USD mn) KSE-100 Index Weight No. of Companies Free Float (%) Sector Stance
9,444 26.5% 20 34.8% Over Weight
5%
10%
15%
20%
25%
30%
35%
40%
6.0
8.0
10.0
12.0
14.0
16.0
CY14 CY15 CY16 CY17 CY18 Sep'19
Deposits Deposits YoY Growth
Fixed Deposits Current Accounts
(PKR Trn)
14.5%
15.0%
15.5%
16.0%
16.5%
17.0%
40.0%
45.0%
50.0%
55.0%
60.0%
65.0%
70.0%
CY14 CY15 CY16 CY17 CY18 Sep'19
CAR (RHS) ADR IDR

Pakistan Strategy 2020 32
Key Investment Theme
NIMs Expansion: NIMs are likely to continue growing with asset re-pricing to be in full force during CY20.
Interest rate cuts during CY20 are likely to be a further catalyst for profitability due to immediate
downwards adjustment of saving deposit rates (lagged impact of asset re-pricing). Moreover, banks started
building up their investment portfolios towards the longer end of the curve – another stimulus for NIMs
going forward. We project earnings of the AHL banking universe to portray a jump of 51% YoY during
CY20 (assuming normal profit for NBP – we have assumed a loss owing to the pension liability), while
NIMs for our coverage universe are expected to expand by ~75 bps.
Key Risks
Aggressive NPL build-up.
Adverse economic developments (continuing inflationary pressure may lead to monetary tightening) could
possibly keep loan growth in-check.
Compliance/KYC short-comings may incur significant penalties.
High provisioning following NPL stock pile-up in CY19.
IFRS-9 implementation (deadline Jan’21) may adversely impact credit costs
Commercial Banks
Growth Story to Continue
Mkt Cap (USD mn) KSE-100 Index Weight No. of Companies Free Float (%) Sector Stance
9,444 26.5% 20 34.8% Over Weight

Pakistan Strategy 2020 33
Exhibit: Improving NIMs Fueling PAT Exhibit: Attractive Valuation
Source (s): Company Financials, AHL Research Source (s): Company Financials, AHL Research
Key Investment Theme
About Time: UBL has accelerated ~43% since its low of PKR 118/share (return of ~39% in CYTD),
outperforming the index (~11% in CYTD), attributable primarily to the valuation gap that had widened massively
(P/B had nosedived to 0.89x). Moreover cleaning up of the overseas book, reduced provisioning expenses (-29%
YoY during 9MCY19) and absence of one-off pension costs this year have helped the bank to post 46% YoY
higher earnings. We believe that higher NIMs [re-pricing of the investment book at higher yields as the bank’s
legacy bonds mature (PKR 110bn maturity in CY20)], alongside a cleaner international book and controlled
Cost/Income (54% during 9MCY19 against 56% in SPLY despite inflationary pressure) will be catalysts for further
upside. UBL currently trades at a P/B of 1.1x, at a ~35% discount to its last 5-Yr avg. and a ~20% discount to our
exit multiple of 1.3x. UBL is operating at a trailing ROE of 11.3% and is expected to accelerate to an avg. of 22%
over the next 5 years.
Impeccable Deposit Franchise: UBL’s domestic business continues to stand on a firm footing (81% / 77% to the
bank’s total deposits / loans). The strong deposit franchise of the bank helped leverage its position during the
year (discount rate up by 325 bps in CY19) and shielded the bank from a drastic increase in domestic cost of
deposits (5.2% against 2.8% in SPLY). UBL’s domestic C/A ratio stands at a concrete 45%. That said, higher
avg. interest rates for CY20 will translate to an uptick in cost of funds by ~139 bps. However, re-profiling of
investment book (investment yields improved from 7.5% in 9MCY18 to 9.6% in 9MCY19, projected to increase to
12% in CY20) and higher spreads is likely to morph into higher yields on assets for the bank by ~173 bps.
Allaying Concerns on Overseas Book: Overseas NPL build-up has settled at 18% in CYTD. Overall infection
has deteriorated to 10.7% (Dec’18: 8.5%) with overseas infection rising to a mammoth 26% (Dec’18: 19.8%).
However, with the corporate sector dominating the bank’s loan book (57%), we do not see NPL build up as major
threat to overall asset quality. Albeit, we project overall infection to increase due to higher interest rates denting
the credit profile of borrowers and settle at an avg. of 10.9% over the next 3 years. Substantial work has been
done on cleaning up the international book through de-risking (focusing on safer business models such as Trade
and Treasury), reducing exposure (avg. loan book down 30% YoY) and adequately providing for the NPL pile up
– primarily from the Gulf region [79% coverage (collateralized coverage: 92%) vis-à-vis 73% as at CY18].
Key Risks
Overseas NPL accretion owing to weaker economic conditions in the Gulf.
Increase in interest rates may incur MTM losses on bond portfolio.
PSX Code Target Price (Dec’20) Market Price Upside Potential Stance
UBL 210.85 169.09 24.7% BUY
United Bank Ltd.
Regaining Lost Glory
10
15
20
25
30
35
40
45
2.0%
4.0%
6.0%
8.0%
10.0%
12.0%
14.0%
CY17A CY18A CY19E CY20F CY21F
PAT NIMs (RHS)
Yield on Investments Cost of deposits
0.00
0.20
0.40
0.60
0.80
1.00
1.20
1.40
1.60
1.80
5.0%
7.5%
10.0%
12.5%
15.0%
17.5%
20.0%
22.5%
CY17A CY18A CY19E CY20F CY21F
P/B ROE

Pakistan Strategy 2020 34
United Bank Ltd.
Regaining Lost Glory
Exhibit: Relative Performance with KSE-100 Index
Source (s): Bloomberg, PSX , AHL Research
PKR mn 2018A 2019E 2020F
Income Statement
Mark-up Income 58,248 65,371 81,850
Non-Mark-up Income 26,644 25,186 26,339
Total Income 85,591 91,436 109,178
Provisioning 13,102 9,350 6,554
OPEX 40,444 43,490 47,355
Post Tax Profit 15,050 20,292 33,715
Balance Sheet
Advances 754,552 688,593 727,637
Deposits 1,448,324 1,519,768 1,669,310
Investments 831,159 1,034,051 1,120,322
Borrowings 279,918 349,547 333,862
Total Equity TIER - II 168,624 181,296 195,121
Source (s): Company Financials, AHL Research
Ratio Analysis 2018A 2019E 2020F
Earnings PKR 12.6 16.4 27.5
Dividend PKR 11.0 11.0 18.0
Book value PKR 137.7 148.1 159.4
Price to Earning x 10.1 10.3 6.1
Price to Book x 0.9 1.1 1.1
ADR % 56.3 50.3 48.7
IDR % 57.4 68.0 67.1
NIMs % 3.1 3.5 4.1
RoE % 9.0 11.5 17.9
RoA % 0.7 1.0 1.5
Source (s): Company Financials, AHL Research
73%
88%
103%
118%
133%
148%
Jan
-19
Fe
b-1
9
Ma
r-1
9
Ap
r-19
Ma
y-1
9
Jun
-19
Jul-
19
Au
g-1
9
Se
p-1
9
Oct-
19
Nov-1
9
Dec-1
9
KSE100 UBL

Pakistan Strategy 2020 35
Key Investment Theme
Infection Should Remain in-check: Despite higher interest rates, we view that MCB’s infection will not face a
major deterioration due to recoveries flowing in from the NIB loan book. MCB has traditionally boasted strong
credit risk management and prudent lending. This is perhaps why MCB trades at a premium valuation to its peers
(last 5-Yr avg. P/B: 1.6x). The bank has recovered ~PKR 4.3bn so far from PKR 29.6bn NPL stock of NIB which
forms 14.5% of total. MCB aims to recover 40-50% of the NPL stock from the NIB book over 3 years since
acquisition. Infection ratio for the bank clocked-in at 8.8% as at 9MCY19 vis-à-vis 8% as at CY18 (3% decline in
loans in CYTD). NIB recoveries, strong credit risk management, corporate sector dominating loan book (~64%)
should keep infection in-check - avg. of 7.8% over the next 3 years. We expect NPL accretion to be limited to
PKR 4bn till CY22. The shining asset quality is expected to compliment the bank’s NIMs expansion which we
expect to accelerate to 6.2% in CY20 (9MCY19: 4.5%). Low exposure to long tenor securities throughout the
rates expansion period positioned the bank’s balance sheet well, ensuring aggressive NIMs expansion.
Limited International Operations - Blessing in disguise: International operations over the past couple of years
have stressed peer banks: HBL and UBL. Major exposure of these banks has been in the GCC region where the
economy has been on a consistent downwards trajectory, culminating in significant NPL accretion and hefty
provisioning expenses (particularly UBL). Tightening global regulations and compliance requirements have forced
the banks to de-scale international operations. International loans contribute a mere 9% to MCB’s total gross
loans (UBL: 23%, HBL: 16%) while international assets comprise a nominal ~3% of total assets (UBL: ~15%,
HBL: ~17%). Limited exposure to overseas operations will prevent any legal/remediation costs (suffered by HBL)
or any hefty provisioning expenses on the overseas book (suffered by UBL) that peer banks have been hit with.
Dividends Galore: Since CY15 MCB has maintained a stellar payout ratio of an avg. 88% which drastically
outperforms its peers’ avg. during the said period – HBL: ~54% and UBL: ~69%. The stock has offered an avg.
DY of 7.3% since CY15 while HBL has offered an avg. yield of 5.5% and UBL has provided an avg. yield of 7.2%.
Standing on a strong capital base (1HCY19 CAR: 18.2%), we can expect the generous pay-out ratio to continue
going forward. We project pay-out ratios to avg. at 75% for the next 3 years, and forecast MCB to provide a
forward dividend yield of 9.9% in CY20, compared to an avg. ~6.5% for AHL banking sector universe.
Key Risks
Slowdown in recoveries from NIB poses a downside risk to asset quality.
More than expected rate cuts may stress NIMs going forward.
PSX Code Target Price (Dec’20) Market Price Upside Potential Stance
MCB 263.65 212.72 23.9% BUY
MCB Bank Ltd.
Safe Fundamental Bet
Exhibit: NIMs Forte Exhibit: Government Securities Mix
Source (s): Company Financials, AHL Research Source (s): Company Financials, AHL Research
0.0%
10.0%
20.0%
30.0%
40.0%
50.0%
60.0%
70.0%
80.0%
90.0%
CY17 CY18 CY19E CY20F CY21F
PIB/Gov't Securities MTBs/Gov't Securities
5.0%
7.0%
9.0%
11.0%
13.0%
15.0%
0.0%
1.0%
2.0%
3.0%
4.0%
5.0%
6.0%
7.0%
CY15 CY16 CY17 CY18 CY19E CY20F
NIMs Infection (RHS) Yield on Advances (RHS)
(PKR bn)

Pakistan Strategy 2020 36
MCB Bank Ltd.
Safe Fundamental Bet
Exhibit: Relative Performance with KSE-100 Index
Source (s): Bloomberg, PSX , AHL Research
PKR mn 2018A 2019E 2020F
Income Statement
Mark-up Income 48,006 68,017 93,135
Non-Mark-up Income 18,066 16,270 18,855
Total Income 66,072 84,288 111,990
Provisioning (822) 2,496 1,350
OPEX 36,534 43,397 52,606
Post Tax Profit 20,353 22,086 35,291
Balance Sheet
Advances 566,792 552,988 593,457
Deposits 1,122,307 1,236,175 1,351,346
Investments 754,386 847,069 938,834
Borrowings 223,216 148,341 189,188
Total Equity TIER - II 150,614 155,740 166,765
Source (s): Company Financials, AHL Research
Ratio Analysis 2018A 2019E 2020F
Earnings PKR 17.2 18.6 29.8
Dividend PKR 16.0 16.0 21.0
Book value PKR 126.5 131.4 140.7
Price to Earning x 11.3 11.4 7.1
Price to Book x 1.5 1.6 1.5
ADR % 54.4 48.6 47.6
IDR % 67.2 68.5 69.5
NIMs % 3.8 4.9 6.3
RoE % 13.3 14.4 21.9
RoA % 1.8 1.4 1.4
Source (s): Company Financials, AHL Research
74%
84%
94%
104%
114%
124%
Jan
-19
Fe
b-1
9
Ma
r-1
9
Ap
r-19
Ma
y-1
9
Jun
-19
Jul-
19
Au
g-1
9
Se
p-1
9
Oct-
19
Nov-1
9
Dec-1
9
KSE100 MCB

Pakistan Strategy 2020 37
Key Investment Theme
Re-rating in Clear Sight: Drags on the bank’s performance from Himalayan OPEX and revaluation losses
from open FX position are likely to fade away during CY20 which should stimulate re-rating. Business
transformation costs (PKR 5.6bn during CY18 - ~80% of the total costs) have been nominal in CY19
compared to last year whereas NY remediation/compliance costs have been on a downwards trajectory
this year (PKR 2.8bn in 9MCY19, PKR 6.4bn in CY18) and should settle 40% YoY lower. The NY branch is
expected to be completely wound down in CY20 which should be a source of respite to the long
overhanging fear of another possible penalty. Revaluation losses on the open FX position have come
down significantly as HBL started the hedging process in 2HCY19 (gain from FX income/derivatives of
PKR 2.3bn in 3Q vis-à-vis loss of PKR 3.3bn in 2Q). The management expects 20-30% of the borrowing in
lieu of NY settlement to be paid off by the end of this year. We expect the bank’s cost/income to come
down to 59% in CY20 compared to 77% in CY19E and alongside the NII momentum from higher spreads
and higher investment yields (yield on assets expected to jump to 10%/11.5% in CY19/CY20 compared to
6.8% in CY18), the bank should post a 160% jump in earnings in CY20. The bank trades at a current P/B
of 1.1x / CY20F P/B of 0.96x – a ~44% / 60% discount from last 5-Yr avg. of 1.5x.
Unmatched Franchise Value: HBL continues to maintain an unmatched brand value in terms of its scale,
recognition and goodwill. HBL is a market leader in CPEC, involved in about USD 6bn worth projects. Its
plans of expansion into the world’s second largest economy are well underway with its application for full-
fledged commercial operations accepted and a branch license can be expected with in 3 months,
according to the CEO. Efforts for financial inclusion and development of digital strategy are areas of key
focus for the bank. The bank recently launched a new digital initiative –“HBL Infinity” which is Pakistan’s
first e-trading platform. The bank has also collaborated with “Visa” to launch a digital payment facility for
mobile phones through QR codes. Customer base of the bank stands at an unassailable, mighty level of
16mn – more than 2x higher than second positioned bank. Konnect customers have doubled since Dec’18
to 3mn. We believe that the brand value attached with HBL’s legacy as Pakistan’s largest bank is a major
catalyst for the stock upside going forward.
Key Risks
Negative developments from ongoing look-backs in NY branch.
Significant PKR depreciation may stress OPEX (NY remediation/compliance costs).
PSX Code Target Price (Dec’20) Market Price Upside Potential Stance
HBL 197.86 156.01 26.8% BUY
Habib Bank Ltd.
Banking on Value
Exhibit: Normalizing Cost/Income Exhibit: : P/B Band
Source (s): Company Financials, AHL Research Source (s): Company Financials, PSX, AHL Research
-
5.00
10.00
15.00
20.00
25.00
30.00
35.00
50.0%
55.0%
60.0%
65.0%
70.0%
75.0%
80.0%
CY17A CY18A CY19E CY20F CY21F
EPS (RHS) Cost/Income
35
70
105
140
175
210
245
280
315
Dec-1
0
Ma
y-1
1
Oct-
11
Ma
r-12
Au
g-1
2
Jan
-13
Jun
-13
Nov-1
3
Ap
r-14
Se
p-1
4
Feb-1
5
Jul-1
5
Dec-1
5
Ma
y-1
6
Oct-
16
Ma
r-17
Au
g-1
7
Jan
-18
Jun
-18
Nov-1
8
Ap
r-19
Se
p-1
9
Price 0.70x 1.05x
1.40x 1.75x 2.10x

Pakistan Strategy 2020 38
Habib Bank Ltd.
Banking on Value
Exhibit: Relative Performance with KSE-100 Index
Source (s): Bloomberg, PSX , AHL Research
PKR mn 2018A 2019E 2020F
Income Statement
Mark-up Income 81,677 106,377 145,827
Non-Mark-up Income 19,894 23,203 28,840
Total Income 101,571 129,581 174,667
Provisioning 5,009 3,410 9,962
OPEX 74,978 99,455 102,582
Post Tax Profit 12,056 15,117 39,311
Balance Sheet
Advances 1,080,440 1,187,526 1,299,579
Deposits 2,137,293 2,326,917 2,591,405
Investments 1,390,052 1,482,943 1,701,399
Borrowings 523,319 465,383 492,367
Total Equity TIER - II 199,252 212,750 237,225
Source (s): Company Financials, AHL Research
Ratio Analysis 2018A 2019E 2020F
Earnings PKR 8.2 10.3 26.8
Dividend PKR 4.3 5.0 13.0
Book value PKR 135.8 145.0 161.7
Price to Earning x 14.6 15.1 5.8
Price to Book x 0.9 1.1 1.0
ADR % 53.9 54.5 53.7
IDR % 65.0 63.7 65.7
NIMs % 3.4 4.0 5.0
RoE % 6.2 7.3 17.5
RoA % 0.4 0.5 1.2
Source (s): Company Financials, AHL Research
73%
86%
99%
112%
125%
138%
Jan
-19
Fe
b-1
9
Ma
r-1
9
Ap
r-19
Ma
y-1
9
Jun
-19
Jul-
19
Au
g-1
9
Se
p-1
9
Oct-
19
Nov-1
9
Dec-1
9
KSE100 HBL

Pakistan Strategy 2020
Sectors
Exploration and ProductionAttractive Discounts Warrant Attention

Pakistan Strategy 2020
Mkt Cap (USD mn) KSE-100 Index Weight No. of Companies Free Float (%) Sector Stance
7,997 14.7% 4 21.5% Over Weight
Exhibit: World Oil Balance and Arab Light Price Exhibit: OPEC Crude Production
Source (s): EIA, AHL Research Source (s): OPEC, AHL Research
-4.0
-3.0
-2.0
-1.0
0.0
1.0
2.0
3.0
4.0
5.0
0
20
40
60
80
100
120
Fe
b-1
2
Au
g-1
2
Fe
b-1
3
Au
g-1
3
Fe
b-1
4
Au
g-1
4
Fe
b-1
5
Au
g-1
5
Fe
b-1
6
Au
g-1
6
Fe
b-1
7
Au
g-1
7
Fe
b-1
8
Au
g-1
8
Feb-1
9
Au
g-1
9
Feb-2
0
Au
g-2
0
Surplus/ (Deficit) - RHS Arab Light
(mn bpd)(USD/bbl)
25
26
27
28
29
30
31
32
33
34
35
Au
g'1
4
Nov'1
4
Fe
b'1
5
Ma
y'1
5
Au
g'1
5
Nov'1
5
Feb'1
6
May'1
6
Au
g'1
6
Nov'1
6
Fe
b'1
7
Ma
y'1
7
Au
g'1
7
Nov'1
7
Fe
b'1
8
Ma
y'1
8
Au
g'1
8
Nov'1
8
Fe
b'1
9
Ma
y'1
9
Au
g'1
9
Nov'1
9
mn bpd
Key Investment Theme
OPEC Meeting: OPEC and Russia (OPEC+) in its Dec’19 meeting decided to enhance production cuts by
0.5mb/d (0.37mb/d from OPEC and 0.13mb/d from non-OPEC) from baseline cut of 1.2mb/d taking total
production cut to 1.7mb/d. Moreover, Saudi Arabia (KSA) also agreed voluntarily to curtail production
beyond its agreed cut. The production cut will be applicable from Jan’20 while OPEC plus is expected to
meet again in Mar’20 to extend the arrangement.
Demand Outlook: In CY20, world oil demand is expected to grow by 1.36mb/d to 102.28mb/d. Growth is
majorly driven by Chinese demand (+0.5mb/d YoY) and from other Asian countries (+0.38mb/d YoY).
Supply Outlook: The non-OPEC oil supply growth for CY20 is expected to clock-in at 68.01mb/d which is
an increase of 2.37mb/d YoY mainly due to growth from OECD countries (+2.12mb/d YoY), US oil
production (+1.71mb/d YoY) and China (+0.34mb/d YoY). Moreover, supply for OPEC in CY20 is expected
to be revised down by 0.67mb/d (2%) to 34.56mb/d as compared to 35.23mb/d in CY19.
Fiscal Breakeven: The IMF’s fiscal breakeven oil prices for 2020 ranges between a high of USD 194.6/bbl
(Iran) to as low as USD 45.7/bbl (Qatar). Moreover, with KSA facing a fiscal deficit amounting USD 49.86bn
(Fiscal breakeven at USD 86.5/bbl) along with higher fiscal breakeven for other middle eastern countries, oil
prices are expected to remain upwards sticky next year.
Oil Prices Drivers: We believe that int’l oil prices are dependent on many factors including: 1) sustainability
of OPEC Plus production cuts along with success of Aramco IPO, 2) Trade war settlement between China
and US which may lead towards economic imbalances in both countries, 3) US oil production which surged
at a 5-Yr CAGR of 9% to 12.29mn bopd in 2019 vs. 8.76mn bopd in 2014, and 4) Further monetary easing
in US which may bolster economic demand in general and oil demand in particular.
Key Risks
The production cut by OPEC can be quickly neutralized by increase in production by US shale oil producers
who are expected to be motivated by the Trump Administration, along with US elections next year.
A slowdown in oil demand from major oil consuming economies.
Exploration and Production
International Oil Price Outlook
40

Pakistan Strategy 2020 41
Exploration & ProductionEvent Graph
50
55
60
65
70
75
80
85
90
Jan
-19
Fe
b-1
9
Ma
r-1
9
Ap
r-19
Ma
y-1
9
Jun
-19
Jul-
19
Au
g-1
9
Se
p-1
9
Oct-
19
Nov-1
9
Dec-1
9
(USD/bbl)
Trump-Kim
Summit at
Vietnam
ended in a
deadlock
U.S Department
of the Treasury
imposes
sanctions on
Venezuela's
state-owned oil
company
U.S demands
that all countries
cease
purchasing oil
from Iran by May
1 or face
sanction
Saudi Oil Capacity
Recovers Faster Than
Expected From Attack
Iranian-
owned oil
tanker was
struck by
missiles in
the Red Sea
Two Saudi Oil Tankers
Attacked near UAE Waters
Iran seizes
Panamanian-
flagged oil
tanker traveling
from UAEImposition of
Tariffs by USA
on Imports
from China
Two Saudi
Aramco oil
pumping
stations are
attacked Iran
backed rebels
Two Saudi
Aramco oil
refineries
attacked
by drones
U.S. President
called off peace
negotiations
with Taliban
over attack in
Kabul.
OPEC &
Russia agree
upon 500,000
bopd
production cut
Brent

Pakistan Strategy 2020
Key Investment Theme
Pakistan’s Hydrocarbon Production: During FY19, Pakistan’s oil production remained stable at 89,030
bopd against 89,197 bopd during FY18. However, gas production portrayed a slight decline of 1.5% YoY
clocking-in at 3,936 mmcfd in FY19 vis-à-vis 3,997 mmcfd in FY18. For FY20, we expect higher production
flows from KPD-TAY, Adhi, Mari and TAL Block.
Exploration Targets: The local E&P companies spud a total of 104 wells out of targeted 129 wells, which
consists of 37 exploratory and 67 development/appraisal wells during FY19. Out of the total wells drilled,
22 oil & gas discoveries were made. That said, 92 wells (52 exploratory and 40 development/appraisal
wells) are planned to be spud by domestic E&P companies in FY20.
Trading at Cheap Valuations: The AHL E&P sector is currently trading at a PER of 5.1x based on FY20E
earnings expectations compared with a PER of 7.2x of the KSE-100 Index and a five year historical PER of
8.5x of the sector. The profitability of the AHL E&P universe is expected to surge by 10% YoY in FY20.
Dependency on PKR/USD parity and Oil Prices Movement: For AHL E&P Universe, Pak Rupee
depreciation against greenback bodes well for profitability. Thus, every 5% Pak Rupee depreciation will
have a 2% positive impact on AHL E&P Universe’s earnings and vice-versa. Meanwhile, companies in the
E&P Universe rely on Arab Light price. Therefore, a USD 5/bbl change in oil price will have a 5% and 7%
impact on the AHL E&P Universe bottom-line for FY20 and FY21, respectively.
Key Risks
Sharp Pak Rupee appreciation against Greenback and drastic fall in oil prices.
Unfavorable decision of windfall levy in court of law.
Inability to expand hydrocarbon reserves and low reverse replacement ratio (RRR).
Prolonged structural issues delaying new discoveries from coming online.
Exhibit: Planned & Spudded Wells and Discoveries Exhibit: Country’s Oil and Gas Production
Source (s): PPIS, AHL Research Source (s): PPIS, AHL Research
0
5
10
15
20
25
30
35
0
20
40
60
80
100
120
140
FY
09
FY
10
FY
11
FY
12
FY
13
FY
14
FY
15
FY
16
FY
17
FY
18
FY
19
Planned Spudded Discoveries
(No. of Wells)
77.0
78.0
79.0
80.0
81.0
82.0
83.0
84.0
85.0
86.0
87.0
88.0
FY15 FY16 FY17 FY18 FY19
Oil & Gas Production - boe(BOE)
Exploration and Production
Attractive Discounts Warrant Attention
Mkt Cap (USD mn) KSE-100 Index Weight No. of Companies Free Float (%) Sector Stance
7,997 14.7% 4 21.5% Over Weight
42

Pakistan Strategy 2020 43
Case-1: Oil Prices Assumption (USD/bbl) and Fair Values
Code Current PriceTP
Upside (%) StanceEPS (PKR) DPS (PKR) P/E (x) DY (%)
Dec-20 2020 2021 2020 2021 2020 2021 2020 2021
PPL 130.6 137.2 5.1 Buy 20.8 16.1 2.00 3.00 6.3 8.1 2% 2%
OGDC 135.2 172.0 27.3 Buy 23.1 22.4 9.25 9.00 5.8 6.0 7% 7%
MARI 1,328.4 1,224.7 (7.8) Hold 223.3 178.3 6.25 6.25 5.9 7.4 0% 0%
POL 440.7 398.5 (9.6) Hold 40.8 42.5 36.00 38.25 10.8 10.4 8% 9%
With USD 40/bbl in FY20 and going forward
Case-2: Oil Prices Assumption (USD/bbl) and Fair Values
Code Current PriceTP
Upside (%) StanceEPS (PKR) DPS (PKR) P/E (x) DY (%)
Dec-20 2020 2021 2020 2021 2020 2021 2020 2021
PPL 130.6 155.9 19.4 Buy 22.7 21.2 2.00 4.00 5.8 6.2 2% 3%
OGDC 135.2 183.4 35.7 Buy 26.3 26.6 10.50 10.75 5.1 5.1 8% 8%
MARI 1,328.4 1,375.1 3.5 Hold 226.7 216.6 6.25 6.25 5.9 6.1 0% 0%
POL 440.7 444.4 0.8 Hold 47.9 51.1 44.00 45.96 9.2 8.6 10% 10%
With USD 50/bbl in FY20 and going forward
Base Case: Oil Prices Assumption (USD/bbl) and Fair Values
Code Current PriceTP
Upside (%) StanceEPS (PKR) DPS (PKR) P/E (x) DY (%)
Dec-20 2020 2021 2020 2021 2020 2021 2020 2021
PPL 130.6 171.9 31.6 Buy 24.7 25.3 3.00 5.00 5.3 5.2 2% 4%
OGDC 135.2 194.8 44.1 Buy 29.9 30.6 12.00 12.25 4.5 4.4 9% 9%
MARI 1,328.4 1,501.8 13.1 Buy 230.5 251.9 6.25 6.25 5.8 5.3 0% 0%
POL 440.7 489.0 11.0 Buy 56.0 59.6 50.00 53.66 7.9 7.4 11% 12%
With USD 60/bbl in FY20 and going forward
Case-4: Oil Prices Assumption (USD/bbl) and Fair Values
Code Current PriceTP
Upside (%) StanceEPS (PKR) DPS (PKR) P/E (x) DY (%)
Dec-20 2020 2021 2020 2021 2020 2021 2020 2021
PPL 130.6 186.5 42.8 Buy 26.2 28.7 3.00 6.00 5.0 4.6 2% 5%
OGDC 135.2 205.6 52.1 Buy 32.7 34.4 13.00 13.75 4.1 3.9 10% 10%
MARI 1,328.4 1,621.2 22.0 Buy 233.4 278.9 6.25 6.25 5.7 4.8 0% 0%
POL 440.7 531.4 20.6 Buy 62.1 67.9 56.00 61.12 7.1 6.5 13% 14%
With USD 70/bbl in FY20 and going forward
Exploration and Production
Oil Price Sensitivity
Mkt Cap (USD mn) KSE-100 Index Weight No. of Companies Free Float (%) Sector Stance
7,997 14.7% 4 21.5% Over Weight

Pakistan Strategy 2020
Exhibit: OGDC’s Circular Debt Position Exhibit: OGDC BoE sold and EPS
Source (s): Company Financials, AHL Research Source (s): Company Financials, AHL Research
Key Investment Theme
Production & Developmental Projects: The company’s historic 3-Yr oil production shows a CAGR of
0.2%, contributed by Adhi, Kunnar Pasakhi Deep, Chanda and Rajian. Whereas, 3-Yr Gas production
CAGR portrays a fall of 1.3%, owing to natural decline at Qadirpur, Bhit, Miano, Dakhni and Manzalai. For
Nashpa Compression project, EPCC contract has been awarded with expected completion target of Jun’20.
Meanwhile, installation of gas processing facilities at Dhok Hussain has been completed while laying of gas
pipeline by SNGP is pending. Additionally, after reallocation of Jhal Magsi gas by the government for third
party sale, the company is in process of finding a buyer.
Planned Operations & Activities for FY20: The company has planned to drill 18 exploratory & appraisal
wells followed by 8 developmental and 4 re-entry wells. At present the company is working on Shale Pilot
Project for which the company will undergo drilling of Shale well in future. Moreover, the company was
awarded 4 blocks (3 operated and 1 non-operated) in a recent offering by the government.
Surge in Gas Reserves: According to PPIS Reserves, gas reserves of OGDC have witnessed a jump of
29% YoY in Jun’19 settling at 7,264 bcf from 5,645 bcf in SPLY. This surge was attributable to a rise in gas
reserves of Mela, Nashpa, Uch, Pasakhi Deep and Qadirpur.
Trading at the Cheapest PE Multiple: The stock is currently trading at an implied oil price of USD
14.45/bbl as compared to Arab Light Price of USD 68.73/bbl with FY20 PER of 4.5x and PB of 0.8x along
with a dividend yield of 9%. We expect the company to post earnings of PKR 29.95/share and PKR
30.59/share in FY20 and FY21, respectively.
Key Risks
Higher exposure to circular debt (PKR 194bn as of FY19).
Drastic decline in oil prices tagged with higher Pak Rupee appreciation against USD.
Higher cost of one-offs such as impairments and dry wells.
Significant drop in production from Nashpa and TAL.
-80%
-60%
-40%
-20%
0%
20%
40%
60%
80%
-
30
60
90
120
150
180
210
Jun'13 Jun'14 Jun'15 Jun'16 Jun'17 Jun'18 Jun'19
Trade Debt % Change(PKR bn)
0
5
10
15
20
25
30
35
76
78
80
82
84
86
88
90
FY12 FY13 FY14 FY15 FY16 FY17 FY18 FY19
EPS (RHS) Total Production(Mn BoE) (PKR)
Oil & Gas Development Co. Ltd.
Old Lion Stands Tall
PSX Code Target Price (Dec’20) Market Price Upside Potential Stance
OGDC 194.83 135.19 44.1% BUY
44

Pakistan Strategy 2020
Exhibit: Relative Performance with KSE-100 Index
Source (s): Bloomberg, PSX , AHL Research
PKR mn 2019A 2020E 2021F
Income Statement
Net Sales 261,481 289,302 302,843
Gross Profit 167,062 191,633 197,727
Operating Profit 150,433 166,646 171,894
Finance Cost 1,693 1,724 1,770
Post Tax Profit 118,386 128,797 131,552
Balance Sheet
Shareholder's Equity 625,365 701,398 786,765
Trade and Other Payables 72,643 79,069 82,770
Total Liabilities 141,232 155,407 166,634
Current Assets 509,786 580,272 652,924
Non-Current Assets 256,811 276,533 300,475
Total Assets 766,597 856,805 953,399
Source (s): Company Financials, AHL Research
Ratio Analysis 2019A 2020E 2021F
Earnings PKR 27.5 29.9 30.6
Dividend PKR 11.0 12.0 12.3
Book value PKR 145.4 163.1 182.9
Price to Earning x 4.8 4.5 4.4
Price to Book x 0.9 0.8 0.7
Net Margins % 45.3 44.5 43.4
Dividend Yield % 8.4 8.9 9.1
Source (s): Company Financials, AHL Research
Oil & Gas Development Co. Ltd.
Old Lion Stands Tall
75%
86%
97%
108%
119%
Jan
-19
Fe
b-1
9
Ma
r-1
9
Ap
r-19
Ma
y-1
9
Jun
-19
Jul-
19
Au
g-1
9
Se
p-1
9
Oct-
19
Nov-1
9
Dec-1
9
KSE100 OGDC
45

Pakistan Strategy 2020
Exhibit: PPL’s Circular Debt Position Exhibit: Arab Light vs. Sui Gas Price
Source (s): Company Financials, AHL Research Source (s): Bloomberg, OGRA, AHL Research
Key Investment Theme
Update on Production & Development Projects: PPL displayed a historic 3-Yr oil production CAGR of
2.7%, contributed by Nashpa, Adhi, Makori East and Maramzai. Similarly, 5-Yr gas production CAGR
showed improvement of 1.2%, amid increased production from Kandhkot, Maramzai, Adhi and Adam. We
expect uptick in oil production by 9% YoY in FY20, amid addition of Benari, Unarpur, Dharian, Adhi South
X-1, Dhok Sultan and Makori Deep-2 to the production system tagged with increase in production from
regular fields like Gambat South, TAL, Nashpa and Adhi Block. However, we expect gas production to
decline slightly by 2% YoY, owing to expectation of a natural decline in gas production from Sui and
Qadirpur. Additionally the company is commissioning phase II of GPV-IV plant in Gambat South Block
after completion of phase I. After completion the plant will produce 45 mmcfd of gas.
Earnings to Increase by 9% YoY in FY20:The company is expected to exhibit a 3-Yr CAGR of 4.1%. The
profitability is expected to clock-in at PKR 24.67/share in FY20 amid i) higher oil production, ii) higher
average oil prices and iii) higher Sui wellhead price. At present, the stock is trading at FY20 PE of 5.3x and
PB 1.0x along with a dividend yield of 2%.
Outlook on Future Operations: During FY20 the company plans to 20 spud wells (10 exploratory and 10
developmental). Furthermore, the company has commenced drilling at Block-8 in Iraq. Moreover, the
company has provisionally been granted Punjab Block in 1QFY20. The company has also farmed-in Pezu
Block from OGDC. However, Bela West was farmed-out partially on account of higher risks and costs.
Furthermore, the company is diversifying into mineral mining projects.
Key Risks
Circular debt continuously rising (PKR 227bn in FY19 vis-à-vis PKR 143bn in FY18) .
Unfavorable terms of mining lease, especially in Sui, Adhi and Kandhkot.
Depletion of exploration portfolio.
-100%
-50%
0%
50%
100%
150%
200%
250%
-
30
60
90
120
150
180
210
240
Jun'13 Jun'14 Jun'15 Jun'16 Jun'17 Jun'18 Jun'19
Trade Debt % Change(PKR bn)
1.2
1.4
1.6
1.8
2.0
2.2
2.4
20
33
46
59
72
85
98
111
124
FY12 FY13 FY14 FY15 FY16 FY17 FY18 FY19
Arab Light Price Sui Gas Price (RHS)
(USD/bbl) (USD/MMBTU)
Pakistan Petroleum Ltd.
Exploring Its Way Forward
PSX Code Target Price (Dec’20) Market Price Upside Potential Stance
PPL 171.94 130.64 31.6% BUY
46

Pakistan Strategy 2020
Exhibit: Relative Performance with KSE-100 Index
Source (s): Bloomberg, PSX , AHL Research
PKR mn 2019A 2020E 2021F
Income Statement
Net Sales 163,890 190,321 196,799
Gross Profit 99,408 118,532 120,075
Other Income 16,528 7,227 8,449
Finance Cost 741 935 1,059
Post Tax Profit 61,632 67,118 68,831
Balance Sheet
Shareholder's Equity 298,609 362,099 417,325
Total Liabilities 159,682 173,888 167,530
Current Assets 252,557 319,069 353,872
Fixed Assets 160,323 171,507 185,572
Non-Current Assets 205,734 216,917 230,983
Total Assets 458,291 535,987 584,855
Source (s): Company Financials, AHL Research
Ratio Analysis 2019A 2020E 2021F
Earnings PKR 22.7 24.7 25.3
Dividend PKR 2.0 3.0 5.0
Book value PKR 109.7 133.1 153.4
Price to Earning x 5.3 5.3 5.2
Price to Book x 1.1 1.0 0.9
Net Margins % 37.6 35.3 35.0
Dividend Yield % 1.4 2.3 3.8
Source (s): Company Financials, AHL Research
Pakistan Petroleum Ltd.
Exploring Its Way Forward
65%
81%
97%
113%
129%
Jan
-19
Fe
b-1
9
Ma
r-1
9
Ap
r-19
Ma
y-1
9
Jun
-19
Jul-
19
Au
g-1
9
Se
p-1
9
Oct-
19
Nov-1
9
Dec-1
9
KSE100 PPL
47

Pakistan Strategy 2020
Exhibit: POL Adjusted EPS and Payout Ratio Exhibit: POL Oil and Gas Production
Source (s): Company Financials, AHL Research Source (s): Company Financials, AHL Research
Key Investment Theme
Drilling Activity: The company plans to spud 10 wells in FY20, which includes 3 exploratory wells and 7
developmental wells. Furthermore, Jhandial and Adhi South appraisal is also under pipeline. Moreover,
drilling exploratory well Jhandial-2 and developmental wells Ratana-5 are expected to be spud during the
FY20. Meanwhile, exploratory wells Balkassar-01 and Mamikhel South-01 and developmental well Adhi-34
are currently under drilling process. Whereas, developmental wells Adhi South-04 and Adhi-33 have
reached completion.
Production: The company’s 3-Yr historic CAGR of oil production stands at 5%. This is attributable to a
rise in production from Adhi, Maramzai and Khaur. Similarly, gas production’s 3-Yr historic CAGR was 6%,
contributed by Adhi, Maramzai and Makori East.
Highest Dividend Yield: In FY20, the company is expected to have dividend payout and dividend yield of
90% and 11% respectively. The stock is currently trading at an implied oil price of USD 49.18/bbl as
compared to Arab Light Price of USD 68.73/bbl with FY20 PER of 7.9 x and PB of 3.3x. We expect the
company to post earnings of PKR 55.96/share and PKR 59.62/share in FY20 and FY21, respectively.
Uptick in Gas Reserves, while Oil Reserves Remained Stagnant : As per PPIS Reserves data for
Jun’19 the company’s gas reserves have grown by 7% YoY amid growth in gas reserves of TAL Block
(730 bcf in Jun’19 vis-à-vis 551 bcf in Jun’18) and Adhi Block (312 bcf in Jun’19 against 289 bcf in Jun’18).
Meanwhile, company’s oil reserves for Jun’19 remained stagnant at 48 mm bbls, attributable to rise in Adhi
Block’s oil reserves by 38% YoY.
Key Risks
Production cut from TAL & Nashpa amid natural depletion or prolonged ATA.
Negative outcome on windfall levy case pending in the court of law.
Higher elasticity to oil price: for every USD 5/bbl change in price, FY20 earnings alter by PKR 3.58/share
or 7%.
70%
79%
88%
97%
106%
115%
124%
20
25
30
35
40
45
50
55
60
FY12 FY13 FY14 FY15 FY16 FY17 FY18 FY19
EPS Payout (RHS)(PKR)
6.0
6.5
7.0
7.5
8.0
8.5
9.0
FY15 FY16 FY17 FY18 FY19
(mn BOE)
Pakistan Oilfields Ltd.
Yield Play
PSX Code Target Price (Dec’20) Market Price Upside Potential Stance
POL 489.04 440.67 11.0% BUY
48

Pakistan Strategy 2020
Exhibit: Relative Performance with KSE-100 Index
Source (s): Bloomberg, PSX , AHL Research
PKR mn 2019A 2020E 2021F
Income Statement
Net Sales 43,977 42,836 43,704
Gross Profit 25,410 23,093 23,628
Other Income 7,177 4,884 6,013
Finance Cost 3,774 1,638 1,651
Post Tax Profit 16,872 15,884 16,923
Balance Sheet
Shareholder's Equity 38,071 38,292 40,451
Total Liabilities 43,419 46,981 49,202
Current Assets 51,429 58,374 64,852
Fixed Assets 7,747 6,699 5,611
Non-Current Assets 30,061 26,899 24,801
Total Assets 81,490 85,273 89,653
Source (s): Company Financials, AHL Research
Ratio Analysis 2019A 2020E 2021F
Earnings PKR 59.4 56.0 59.6
Dividend PKR 50.0 50.0 53.7
Book value PKR 134.1 134.9 142.5
Price to Earning x 6.8 7.9 7.4
Price to Book x 3.0 3.3 3.6
Net Margins % 38.4 37.1 38.7
Dividend Yield % 12.3 11.3 12.2
Source (s): Company Financials, AHL Research
Pakistan Oilfields Ltd.
Yield Play
75%
80%
85%
90%
95%
100%
105%
110%
115%
Jan
-19
Fe
b-1
9
Ma
r-1
9
Ap
r-19
Ma
y-1
9
Jun
-19
Jul-
19
Au
g-1
9
Se
p-1
9
Oct-
19
Nov-1
9
Dec-1
9
KSE100 POL
49

Pakistan Strategy 2020
Exhibit: MARI’s Gas Price vs. EPS Exhibit: MARI’s Trade Debts
Source (s): Company Financials, AHL Research Source (s): Company Financials, AHL Research
Key Investment Theme
Highest Reserve Life in the AHL Universe: As per the Oil & Gas Reserves Reports for Jun’19 of PPIS,
reserve life for MARI is expected to be 19 years. In terms of gas reserves, Mari Gas Fields (MGF’s)
reserve life remained stable at 20 years due to increase in gas reserves to 4,942 bcf in Jun’19 as
compared to 4,885 bcf in FY18.
Earnings to Clock-in at PKR 230.50/share in FY20: Earnings are expected to grow at a 3-Yr CAGR at
13.2%. We anticipate the company to post a bottom-line of PKR 230.50/share and PKR 251.91/share in
FY20 and FY21, respectively. Major reasons behind this growth include i) entitlement factor at 100%
during FY20, and ii) attractive pricing for incremental production from MGF under the Petroleum Policy
2012.
Oil & Gas Production Update: The company has a historic 3-Yr gas production CAGR of 4%. Whereas,
historic 3-Yr oil production CAGR drop by 5%. During FY19, MARI’s gas production remained stable at
705mmcfd compared to SPLY. This comes on the back of uptick of 1% YoY in Mari Field’s gas production,
settling 673 mmcfd vis-à-vis 667 mmcfd in FY18. Meanwhile, oil production declined to 1,110 bopd in
FY19 against 1,490 bopd in FY18, down by 26% YoY. This decline was mainly due to dip in oil production
from Halini, Halini Deep, Kalabagh and Ghauri by 21%, 24%, 46% and 52% YoY, respectively.
Future Outlook: The company has acquired 25% stake in Bela West from PPL. Furthermore, the
company is in process of acquiring greater working interest in Tirah, Orakzai, Ranipur and Lakhi Rud from
OGDC. Additionally, the company has applied for Exploration License in Zarrar Block (Indus Offshore). On
top of this the company is considering farm-in opportunities in Iraq and Tajikistan. Furthermore, with an
investment of USD 1mn, MARI will establish a wholly owned subsidiary company in Dubai Free Zone for
expanding its footprint in other countries for operations in oil, gas and associated services.
Key Risks
Mounting trade debts: GIDC amount stands at PKR 149bn in Jun’19.
Disruption of gas production from Mari field.
-
50
100
150
200
250
300
1.0
1.1
1.2
1.3
1.4
1.5
1.6
1.7
FY18 FY19 FY20 FY21 FY22
Gas Price EPS (RHS)
(PKR)(USD/MMBT
-80%
-30%
20%
70%
120%
170%
-
20
40
60
80
100
120
140
160
FY13 FY14 FY15 FY16 FY17 FY18 FY19
Trade Debts % Change
(PKR bn)
Mari Petroleum Co Ltd.
Breaching the Threshold
PSX Code Target Price (Dec’20) Market Price Upside Potential Stance
MARI 1,501.8 1,328.4 13.1% BUY
50

Pakistan Strategy 2020
Mari Petroleum Co Ltd.
Breaching the Threshold
Exhibit: Relative Performance with KSE-100 Index
Source (s): Bloomberg, PSX , AHL Research
PKR mn 2019A 2020E 2021F
Income Statement
Net Sales 59,448 72,397 78,089
Gross Profit 40,161 50,225 54,199
Operating Profit 33,743 45,248 48,874
Other Income 1,767 1,551 2,445
Post Tax Profit 24,327 30,750 33,605
Balance Sheet
Shareholder's Equity 63,607 93,644 126,415
Trade and Other Payables 146,398 147,612 159,218
Total Liabilities 156,455 157,670 169,275
Current Assets 183,655 210,204 249,672
Non-Current Assets 36,407 41,110 46,018
Total Assets 220,062 251,314 295,690
Source (s): Company Financials, AHL Research
Ratio Analysis 2019A 2020E 2021F
Earnings PKR 182.4 230.5 251.9
Dividend PKR 6.0 6.3 6.3
Book value PKR 524.5 702.0 947.6
Price to Earning x 5.0 5.8 5.3
Price to Book x 1.7 1.9 1.4
Net Margins % 40.9 42.5 43.0
Dividend Yield % 0.7 0.5 0.5
Source (s): Company Financials, AHL Research
64%
70%
76%
82%
88%
94%
100%
106%
112%
118%
Jan
-19
Fe
b-1
9
Ma
r-1
9
Ap
r-19
Ma
y-1
9
Jun
-19
Jul-
19
Au
g-1
9
Se
p-1
9
Oct-
19
Nov-1
9
Dec-1
9
KSE100 MARI
51
Pakistan Strategy 2020
Sectors
52
FertilizerContinuously Passing on

Pakistan Strategy 2020 53
Key Investment Theme
Agriculture Performance & Fertilizer Offtake: Sector contribution in the GDP of Pakistan declined by
0.6% YoY in FY19 to 18.5% as compared to 19% YoY in FY18. Overall slowdown in economy coupled with
decline in major crops alongside lower cotton crop were the major contributor towards this subdued
performance. Going forward, we expect urea offtake to clock-in at 5.9mn tons in CY20 while DAP offtake is
expected at 2.0mn tons.
Pricing Power: During CY19, pricing power of local manufacturers remained elevated, as urea prices
jumped up by 28% YoY to PKR 2,020/bag in CYTD as compared to an average price of PKR 1,576/bag
during CY18. The said increase was on account of gas tariff hike for feed and fuel gas along with other cost
push inflationary pressures.
Inventory - A Cause of Concern?: Urea inventory in Pakistan was around 1.0mn tons as at 1st Dec’19,
while forecasted demand for Dec’19 is expected between 0.8-1.0mn tons. With this, inventory at year end
is expected to arrive at ~550k tons (locally produced urea 530k tons). Assuming buffer stock of ~250k tons,
we believe that 300k tons will be available for exports. Additionally, in CY20, assumingly RLNG plants
operates for 9 months, the estimated inventory (without any exports) by the end of CY20 would be around
650k tons which may challenge local manufacturers pricing power in mid term. Albeit, we cannot rule out
the possibility of another export grant in case of excess inventory buildup during CY20.
International Urea Prices: International urea prices have declined sharply to USD 235/ton in Dec’19 (a
decline of 21% YoY). However, we expect prices to recover and remain stable by the end of this year as
Indian and Brazilian demand is expected to kick-in from the ongoing month.
Key Risks
Gas tariff / GIDC increase and failure to pass on the same to end consumers.
Excess inventory, denial of permission for exports along with volatility in international prices.
Negative outcome on GIDC verdict.
Natural disasters such as floods and earthquake.
Exhibit: Urea and DAP offtake and prices Exhibit: International Urea and DAP prices
Source (s): NFDC, AHL Research Source (s): Bloomberg, AHL Research
400
900
1,400
1,900
2,400
2,900
3,400
3,900
4,400
-
1,000
2,000
3,000
4,000
5,000
6,000
7,000
CY
10
CY
11
CY
12
CY
13
CY
14
CY
15
CY
16
CY
17
CY
18
CY
19*
Urea Offtake DAP Offtake
Urea Price DAP Price(Tons)
(PKR/bag)
200
225
250
275
300
325
350
375
400
425
450
475
Jan
-18
Ma
r-18
Ma
y-1
8
Jul-1
8
Se
p-1
8
Nov-1
8
Jan
-19
Mar-
19
Ma
y-1
9
Jul-1
9
Se
p-1
9
Nov-1
9
Urea DAP(USD/ton)
Mkt Cap (USD mn) KSE-100 Index Weight No. of Companies Free Float (%) Sector Stance
3,308 13.8% 6 46.8% Over Weight
Fertilizer
Continuously Passing On

Pakistan Strategy 2020 54
Exhibit: Historical and Expected EPS and DPS Exhibit: Historical and Expected Margins
Source (s): Company Financials, AHL Research Source (s): Company Financials, AHL Research
Key Investment Theme
5-yr Earnings CAGR of 7%: Given a diversified portfolio of business in banking, energy and FMCG
sectors, we expect the company’s profitability to grow at 5-yr CAGR of 7% to PKR 15.96/share in CY23.
Major contributor towards profitability growth will be stable core business along with dividend income from
AKBL, FFBL and FFCEL.
Urea Offtake to Remain Stable: Stable urea offtake (average of 2.4mn tons and 121% utilization level
during last 5 years) along with CY18 and CY19 production at 123% and 122% of rated capacity, we expect
urea offtake to clock-in at 2.5mn tons for CY20. In addition, on the trading side we anticipate DAP offtake of
the company at 0.45mn tons during CY20.
GIDC Verdict Would be Crucial: The decision by the Supreme Court (SC) regarding GIDC is expected to
be a big trigger for companies including FFC and FFBL on either side. The SC may reduce/remove or in
principle impose GIDC. Any removal or settlement of the said will result in cost savings for the company (if
not passed on completely) along with one-off windfall gains.
Payout Ratio: High dividend payout ratio of (5 year average at 90%) translates into attractive dividend yield
of 11.4% for CY20.
Thar Energy to Add Further Value: The company has a 30% stake in Thar Energy Limited (TEL) which is
a 330MW local coal based power plant at Thar. We expect earnings and target price contribution of PKR
0.95/share and PKR 3.3/share from the said project. However, due to non-financial closure, we haven’t
incorporated this project in our valuations yet.
Key Risks
Gas tariff hike / inability to pass on the same. For every PKR 10/mmbtu increase in feed and fuel stock
prices, earnings will erode by PKR 0.38/share (PKR 14.5/bag increase in urea price to neutralize the
impact).
Reduction in price of urea by PKR 50/bag will erode company’s EPS by PKR 1.32.
8.4
11.4
12.4
13.7
14.4
6.0
7.5
9.0
10.5
12.0
13.5
15.0
CY17A CY18A CY19E CY20F CY21F
EPS DPS(PKR)
5.0
10.0
15.0
20.0
25.0
30.0
CY17A CY18A CY19E CY20F CY21F
Gross Margins EBITDA Margins
Net Margins(%)
Fauji Fertilizer Company Ltd.
Operational Excellence
PSX Code Target Price (Dec’20) Market Price Upside Potential Stance
FFC 130.00 105.29 23.5% BUY

Pakistan Strategy 2020 55
Exhibit: Relative Performance with KSE-100 Index
Source (s): Bloomberg, PSX , AHL Research
PKR mn 2018A 2019E 2020F
Income Statement
Sales 105,964 128,854 137,049
Cost of sales 77,986 94,863 100,434
Gross Profit 27,979 33,991 36,615
Finance Cost 1,637 3,242 4,248
Post Tax Profit 14,439 15,823 17,410
Balance Sheet
Shareholder's Equity 33,383 35,214 37,360
Current Liabilities 99,945 113,456 117,821
Trade and other payables 60,599 69,730 73,838
Non-Current Liabilities 13,162 8,697 6,131
Current Assets 95,354 102,015 104,128
Non-Current Assets 51,135 55,352 57,183
Source (s): Company Financials, AHL Research
Ratio Analysis 2018A 2019E 2020F
Earnings PKR 11.4 12.4 13.7
Dividend PKR 8.9 11.0 12.0
Book value PKR 26.2 27.7 29.4
Price to Earning x 8.1 8.5 7.7
Dividend Yield x 9.6 10.4 11.4
Price to Book % 3.5 3.8 3.6
Gross Margins % 26.4 26.4 26.7
Source (s): Company Financials, AHL Research
Fauji Fertilizer Company Ltd.
Operational Excellence
74%
84%
94%
104%
114%
124%
Jan
-19
Fe
b-1
9
Ma
r-1
9
Ap
r-19
Ma
y-1
9
Jun
-19
Jul-
19
Au
g-1
9
Se
p-1
9
Oct-
19
Nov-1
9
Dec-1
9
KSE100 FFC

Pakistan Strategy 2020 56
Exhibit: PAT and Net Margins Exhibit: Declining D/E Ratio
Source (s): Company Financials, AHL Research Source (s): Company Financials, AHL Research
Key Investment Theme
Earnings to Grow at a 5-year CAGR of 14%: We expect the company to post 5-year profitability CAGR of
14.24%. The expected growth is primarily driven by i) CoD of Engro Powergen Thar Power Limited (EPTPL)
along with Sindh Engro Coal Mining Company (SECMC), 2) Volumetric growth amid expansion in polymer
business including PVC, VCM and hydrogen peroxide leading towards higher profitability, and 3) Steady
business operations from Elengy terminal based on fixed RoE, and 4) Engro Powergen Qadirpur, which is
likely to remain stable amid secure gas supply.
Thar Projects to Reap Profits from CY20: With the CoD of Sindh Engro Coal Mining Company (SECMC)
along with 660MW mine mouth power plant namely Engro Power Thar Limited (EPTL) in Jun’19, profits
from the said projects will become fully visible in CY20. We expect earnings contribution in CY20 of PKR
7.44/share and PKR 1.44/share from EPTL and SECMC, respectively.
Other Business: EFERT’s profitability is expected to remain stable however, conclusion of concessionary
gas rate in 2021 as per the initial agreement could pose a risk to earnings in 2021 while we also cannot rule
out the possibility of extension in the time period of concessionary gas till 2023. EPCL’s earnings are
expected to grow on the back of expansion in PVC and addition of Hydrogen Peroxide and LABSA in
product line. Moreover, Engro Powengen Qadirpur, Engro Elengy and Engro Vopak business are expected
to remain stable while PKR depreciation will be an upside risk for the businesses. Lastly EFOODS, is
expected to remain in hot waters amid overall slowdown in economy tagged with subdued margins on
account of lower consumer purchasing power.
Future Investments: The company has a solid cash position, amounting to PKR 60bn as at Sep’19, which
may be utilized for future growth projects including RLNG terminal, Naptha cracking facility and further
investment in Thar mine mouth power plants in Phase 3 and 4 of CPEC, to name a few.
Key Risks
Gas price hike for the fertilizer sector.
Volumetric and margin decline in dairy segment.
Circular debt in power sector.
Lower than expected International PVC Margins posing a risk to the chemical business.
Reinvestment risk.
9.4
12.7
19.5
22.3 22.1
5.0
7.0
9.0
11.0
13.0
15.0
5.0
9.0
13.0
17.0
21.0
25.0
CY17 CY18 CY19E CY20F CY21F
PAT Net Margins (RHS)(PKR bn) (%)
131.5 136.3
168.4 180.5
192.5
-
0.2
0.4
0.6
0.8
1.0
1.2
40.0
65.0
90.0
115.0
140.0
165.0
190.0
CY17 CY18 CY19E CY20F CY21F
Equity Debt to Equity (RHS)
(PKR bn)(x)
PSX Code Target Price (Dec’20) Market Price Upside Potential Stance
ENGRO 403.30 326.66 23.5% BUY
Engro Corporation Ltd.
Diversification to Reap Profits

Pakistan Strategy 2020 57
Exhibit: Relative Performance with KSE-100 Index
Source (s): Bloomberg, PSX , AHL Research
PKR mn 2018A 2019E 2020F
Income Statement
Sales 171,568 145,842 153,350
Gross Profit 51,108 41,618 42,753
Other Income 9,147 2,228 2,456
Finance Cost 5,453 3,567 3,353
Post Tax Profit 12,708 19,494 22,255
171,568 145,842 153,350
Balance Sheet
Shareholder's Equity 185,587 187,768 201,007
Current Liabilities 129,799 166,424 147,691
Trade and other payables 207,568 287,517 263,666
Non-Current Liabilities 152,361 177,500 165,513
Current Assets 240,794 297,784 299,160
Non-Current Assets 393,155 475,285 464,673
Source (s): Company Financials, AHL Research
Ratio Analysis 2018A 2019E 2020F
Earnings PKR 22.1 33.8 38.6
Dividend PKR 21.0 25.0 29.0
Book value PKR 354.9 359.0 384.3
Price to Earning x 13.5 9.7 8.5
Price to Book x 0.8 0.9 0.8
Dividend Yield % 7.0 7.7 8.9
Net Margins % 7.4 13.4 14.5
Source (s): Company Financials, AHL Research
Engro Corporation Ltd.
Diversification to Reap Profits
74%
84%
94%
104%
114%
124%
134%
Jan
-19
Fe
b-1
9
Ma
r-1
9
Ap
r-19
Ma
y-1
9
Jun
-19
Jul-
19
Au
g-1
9
Se
p-1
9
Oct-
19
Nov-1
9
Dec-1
9
KSE100 ENGRO

Pakistan Strategy 2020
Sectors
58
CementCut-throat Competition

Pakistan Strategy 2020 59
Key Investment Theme
Volte-face in Domestic Volumes: To recall, cement dispatches in the domestic market during FY19
registered a decline of over 3% YoY to 39.8mn tons marked by adoption of fiscal consolidation policies by
the government together with contractionary monetary stance of the SBP which curtailed public and private
sector demand. Albeit, coming out of a period of economic vulnerability, local cement dispatches are
expected to recuperate this year and generate a 3yr forward CAGR of 3% by FY22. In addition, exports of
cement and clinker, primarily seaborne exports to African countries, Bangladesh and Sri Lanka, will continue
to favour the industry; we forecast a 3-yr CAGR of 6% in exports.
Rebound in Prices Appears Dubious Amid Last Round of Capacity Addition: With the ongoing
expansionary spree nearing conclusion, another 7.3mn tons are projected to come online within a quarter
(PIOC, LUCK and KOHC adding 2.4mn, 2.6mn and 2.3mn tons, respectively in the North market). These
announced expansions are set to take the installed capacity of the sector up by ~12% to 69.2mn tons from
61.93mn tons and as demand is forecast to surpass 47mn tons in FY20, excess capacity is set to go beyond
~21.8mn tons (31%). In the prevailing backdrop of supply side strain, we view prices to succumb to
relentless pressure in both regions; case-in-point: prices have come down sharply by PKR 30-40/bag in
North and PKR 40-50/bag in South, since end of FY19.
Cost Pressures Mount to Unforgiving Levels: Higher financial charges due to interest rate hikes by the
SBP and augmented borrowing to support capacity expansions, higher depreciation expense, devaluation in
the Pak Rupee against USD, higher excise duty under the FY20 Budget at PKR 2,000/ton, and upwards
adjustment in electricity and gas tariffs are likely to dent margins and profitability of cement manufacturers in
FY20. Although cement players will be cushioned by lower coal prices (expected at USD 75/ton in FY20 vs.
USD 100/ton in FY19), the benefit will not translate to the bottom-line.
Key Risks:
Further loss of pricing power owing to new additions.
Unforeseeable costing pressures: PKR depreciation against USD, extension of recent spike in coal prices,
higher than expected electricity and gas tariff hikes and delay in interest rate cuts.
Mkt Cap (USD mn) KSE-100 Index Weight No. of Companies Free Float (%) Sector Stance
2,292 6.0% 21 34.0% Under Weight
Exhibit: Industry to endure oversupply Exhibit: Cement and coal prices head south in FY20TD
Source (s): APCMA, AHL Research Source: PBS, Bloomberg, AHL Research
60%
65%
70%
75%
80%
85%
90%
95%
-
5,000
10,000
15,000
20,000
25,000
30,000
35,000
40,000
45,000
FY
08A
FY
09A
FY
10A
FY
11A
FY
12A
FY
13A
FY
14A
FY
15A
FY
16A
FY
17A
FY
18A
FY
19A
FY
20E
Local Dispatches Exports Utilization (RHS)
(000 tons)
30
50
70
90
110
130
200
300
400
500
600
700
FY1
2A
FY1
3A
FY1
4A
FY1
5A
FY1
6A
FY1
7A
FY1
8A
FY1
9A
FY2
0TD
Cement price PKR/bag Coal price USD/ton (RHS)
Cement
Cut-throat Competition

Pakistan Strategy 2020 60
Exhibit: Strong pricing to aid revenue growth Exhibit: Quantum of exports in total sales to grow
Source (s): Company Financials, AHL Research Source (s): Company Financials, AHL Research
Key Investment Theme
Brand Image - A Formidable Defense: With the economic growth limping and domestic dispatches
contracting (by 3% YoY) in the outgoing year, ACPL managed to outshine the sector and post a volumetric
growth of 29% YoY in FY19 amid commencement of new plant. As recently as 1QFY20, whereby sector-
wide gross margins tumbled to a single digit and in some cases, turned red, ACPL posted solid margins of
over 26%. We believe this foreshadows ACPL’s ability to flourish in turbulent times. Going forward, the
company is expected to leverage its strong brand image (which entails a loyal customer base as well as
premium pricing) and generate a 5-Yr forward earnings CAGR of 13% by FY24 to PKR 3,768mn (EPS: PKR
27.42).
Insatiable Exports’ Growth: Although cement manufacturers are projected to fiercely contend for market
share in the domestic cement space as the current climate affirms the idea of oversupply, while dumping
from North also poses a threat to players in South, we view that exports will mend the domestic wreckage.
To recall, over the past year ACPL managed to secure massive orders of cement and clinker from markets
of Bangladesh, Sri Lanka and East Africa. Whereas latest numbers also suggest that growth in exports
would plausibly remain vigorous; we forecast a 3-yr forward CAGR of 6%, which should support overall
volumes.
ACPL Goes Global : To recall, ACPL commenced commercial production at its newly constructed 900,000
tons p.a. cement grinding unit in Basra, Iraq. We estimate this project to add PKR 23.15/share to our
valuation (60% holding) and generate a PAT of PKR 462mn in FY20; assuming recognition of dividend
income, this will add PKR 1.18/share to our FY20 earnings forecast.
Top Pick in the AHL Cement Universe : Given the stock offers a noteworthy 42% upside to our Dec’20
target price of PKR 142.66/share, we recommend BUY.
Key Risks:
Cement prices coming under stress; every PKR 5/bag decline will erode earnings for FY20 by PKR
0.67/share (4%).
Spike in coal prices; every USD 5/ton surge will shred bottom-line in FY20 by PKR 1.80/share (15%).
PSX Code Target Price (Dec’20) Market Price Upside Potential Stance
ACPL 142.66 100.48 41.9% BUY
Attock Cement Limited
Chalk Horse of the Cement Sector
200
300
400
500
600
700
-
5,000
10,000
15,000
20,000
25,000
FY1
2A
FY1
3A
FY1
4A
FY1
5A
FY1
6A
FY1
7A
FY1
8A
FY1
9A
FY2
0E
FY2
1F
FY2
2F
Net revenues
PAT
Cement price PKR/bag (RHS)(PKR mn)
0%
10%
20%
30%
40%
50%
- 200 400 600 800
1,000 1,200 1,400 1,600 1,800
FY1
2A
FY1
3A
FY1
4A
FY1
5A
FY1
6A
FY1
7A
FY1
8A
FY1
9A
FY2
0E
FY2
1F
FY2
2F
Local sales Exports Exports % in total (RHS)
(000 tons)

Pakistan Strategy 2020 61
Exhibit: Relative Performance with KSE-100 Index
Source (s): Bloomberg, PSX , AHL Research
PKR mn 2019A 2020E 2021F
Income Statement
Sales 20,781 21,439 21,692
Cost of sales 15,978 16,494 16,817
Gross Profit 4,803 4,945 4,875
Finance Cost 648 773 565
Post Tax Profit 2,073 1,721 1,875
Balance Sheet
Shareholder's Equity 16,099 17,271 18,596
Current Liabilities 8,404 7,460 6,800
Trade and other payables 3,577 3,450 3,401
Non-Current Liabilities 2,814 2,814 2,084
Current Assets 7,647 8,105 8,280
Non-Current Assets 19,670 19,439 19,201
Source (s): Company Financials, AHL Research
Ratio Analysis 2019A 2020E 2021F
Earnings PKR 15.1 12.5 13.6
Dividend PKR 4.0 4.0 4.0
Book value PKR 117.1 125.7 135.3
Price to Earning x 4.7 8.0 7.4
Price to Book x 0.6 0.8 0.7
Net Margins % 10.0 8.0 8.6
Dividend Yield % 5.6 4.0 4.0
Source (s): Company Financials, AHL Research
Attock Cement Limited
Chalk Horse of the Cement Sector
55%
67%
79%
91%
103%
115%
Jan
-19
Fe
b-1
9
Ma
r-1
9
Ap
r-19
Ma
y-1
9
Jun
-19
Jul-
19
Au
g-1
9
Se
p-1
9
Oct-
19
Nov-1
9
Dec-1
9
KSE100 ACPL

Pakistan Strategy 2020 62
Exhibit: LUCK’s share to contract but remain highest Exhibit: Sum of the parts valuation
Source (s): Company Financials, AHL Research Source: AHL Research
Key Investment Theme
Status of Being Number 1 Almost Certain: Set to become the largest cement player in the country (with a
capacity of 11.6mn tons) and grow its diversified portfolio by means of its leverage-free book, LUCK
continues to stand out. We eye a solid earnings CAGR of 15% for the company by FY24 to PKR 20,938mn
(EPS: PKR 64.75), taking account of the company’s chief cement business where we view total dispatches
to grow to ~9.4mn tons (5-yr CAGR of 4%) vis-à-vis 7.7mn tons in FY19.
A Diversified Portfolio that Warrants Attention: LUCK’s 2.6mn tons brownfield project in Pezu, KPK is
expected to commence commercial operations in Dec’19, making it the largest cement player and solidifying
its footprint in the country. In addition, the company’s PKR 20bn automobile plant in Pakistan alongside
South Korean auto giant Kia, is now operational and the launch of Kia “Sportage” and “Picanto” has been
received well. Moreover, its 100% owned 660MW coal power plant is projected to kick-off operations in
Mar’21. The company has initiated construction activity at the plant site and we have assumed COD in
FY22. Finally, the company’s 51% share in ICI Pakistan Limited - a listed chemical company - also
augments value of the portfolio as ICI has commissioned a Morinaga plant to manufacture infant formula
with a nameplate capacity of 12k tons per annum as well as undertaken capacity addition in its soda ash
business to 500k tons p.a..
Sum of the Parts-based TP of PKR 553/share: The stock offers a noteworthy 28% upside from last
closing to our Dec’20 target price of PKR 552.66/share. We believe a higher P/E multiple for LUCK remains
justifiable given its diversified theme with exposure in cements, automobiles, power and chemical.
Key Risks:
Cement prices tapering off; every PKR 5/bag decline will erode earnings by PKR 1.16/share (5%).
Drastic ascent in coal prices; FY20 bottom-line should retreat by PKR 1.79/share (8%) on every USD
5.00/ton uptick in average coal prices.
Delay in materialization of key projects.
PSX Code Target Price (Dec’20) Market Price Upside Potential Stance
LUCK 552.66 424.52 30.2% BUY
5%
8%
11%
14%
17%
-
15,000
30,000
45,000
60,000
75,000
FY
12A
FY
13A
FY
14A
FY
15A
FY
16A
FY
17A
FY
18A
FY
19A
FY
20E
FY
21F
FY
22F
Industry capacity LUCK's offtake
(000 tons)
Lucky Cement Limited
Nearly At The Top
Sum of the Parts Value Discount TP
Core 60,851 - 188.2
ICI 31,599 30% 68.4
Iraq Project 12,804 0% 39.6
Congo Project 1,738 0% 5.4
660 MW Coal Power Plant 66,164 0% 204.6
Wind Power 2,921 0% 9.0
KIA motors 12,119 0% 37.5
188,195 552.66

Pakistan Strategy 2020 63
Exhibit: Relative Performance with KSE-100 Index
Source (s): Bloomberg, PSX , AHL Research
PKR mn 2019A 2020E 2021F
Income Statement
Sales 48,021 46,821 53,049
Gross Profit 13,984 9,690 11,042
Other Income 3,242 3,700 6,128
Other Charges 1,048 1,021 1,157
Post Tax Profit 10,490 6,626 9,217
Balance Sheet
Shareholder's Equity 94,318 98,843 106,443
Current Liabilities 23,578 19,673 21,990
Trade and other payables 2,059 2,007 2,274
Non-Current Liabilities 7,193 7,335 7,480
Current Assets 33,379 28,869 33,893
Non-Current Assets 91,710 96,982 102,019
Source (s): Company Financials, AHL Research
Ratio Analysis 2019A 2020E 2021F
Earnings PKR 32.4 20.5 28.5
Dividend PKR 6.5 5.0 9.0
Book value PKR 291.7 305.7 329.2
Price to Earning x 11.7 20.7 14.9
Price to Book x 1.3 1.4 1.3
Gross Margins % 29.1 20.7 20.8
Dividend Yield % 1.7 1.2 2.1
Source (s): Company Financials, AHL Research
Lucky Cement Limited
Nearly At The Top
70%
76%
82%
88%
94%
100%
106%
112%
Jan
-19
Fe
b-1
9
Ma
r-1
9
Ap
r-19
Ma
y-1
9
Jun
-19
Jul-
19
Au
g-1
9
Se
p-1
9
Oct-
19
Nov-1
9
Dec-1
9
KSE100 LUCK

Pakistan Strategy 2020 64
Exhibit: DGKC’s utilization to slow down Exhibit: Market share to contract amid competition
Source (s): Company Financials, AHL Research Source (s): Company Financials, AHL Research
Key Investment Theme
Utilization and Market Share to Pull Back as New Capacities Add On: Despite undertaking an
expansion of 2.8mn tons in the prior year, utilization of the company is expected to remain relatively lower
(averaging at ~95% in the next three years vis-à-vis 103% between FY17-FY19). Pertinently, expansion by
other players such as CHCC (2.1mn tons; Jan’19), MLCF (2.2mn ton; Mar’19) and POWER (2.5mn tons;
Dec’19), as well as forthcoming additions of 7.3mn tons, tagged with slower demand growth, will keep
DGKC’s utilization low. Consequentially, market share of the company is expected to contract from 10.8%
(past 3-yr average) to an average of 9.8% between FY20-FY21.
Operationally Weaker: Augmented costs associated with the new plant i.e. higher depreciation charge,
weaker prices (particularly in North as domestic manufacturers slash prices to pump higher volumes; and
slow infection in South given dumping from North), alongside depreciation in the PKR-USD parity - already
trading at levels much weaker than the prior year, have effectively eroded gross margins of DGKC (at -5.9%
in 1QFY20). With that said, we believe coal should provide respite in FY20, although, to no effect as without
considerable recovery in cement prices (which appears unlikely in the immediate term), we project DGKC to
post an operating loss in the ongoing year.
Leverage Position a Cause of Concern: DGKC remains highly levered with its latest financials indicating
a debt to equity of 53% (borrowing of PKR 36bn as of 1QFY20 with short term borrowing at PKR 16bn).
Going forward, with the company struggling to generate earnings in the midst of derailed pricing power and
manifold growth in costs, DGKC’s interest coverage is expected to contract from 1.6x in FY19 to 0.2x in
FY20.
SELL Recommendation at Current Levels: We have a “SELL” stance on the stock with our sum of the
parts Dec’20 target price arriving at PKR 66.75/share.
Key Risks:
Waning cement prices; every PKR 5/bag dip will erode earnings for FY20 by PKR 0.81/share (11%).
Spike in coal prices; every USD 5/ton surge will shred bottom-line in FY20 by PKR 1.69/share (23%).
PSX Code Target Price (Dec’20) Market Price Downside Potential Stance
DGKC 66.75 75.51 -11.6% Sell
50%
70%
90%
110%
-
1,000
2,000
3,000
4,000
5,000
6,000
7,000
FY1
2A
FY1
3A
FY1
4A
FY1
5A
FY1
6A
FY1
7A
FY1
8A
FY1
9A
FY2
0E
FY2
1F
FY2
2F
DGKC's Offtake Capacity Utilization
(000 tons)
8%
9%
9%
10%
10%
11%
11%
-
10,000
20,000
30,000
40,000
50,000
60,000
70,000
80,000
FY
12A
FY
13A
FY
14A
FY
15A
FY
16A
FY
17A
FY
18A
FY
19A
FY
20E
FY
21F
FY
22F
Industry capacity DGKC's Offtake % Share
(000 tons)
DG Khan Cement Limited
FY20: Staring into abyss
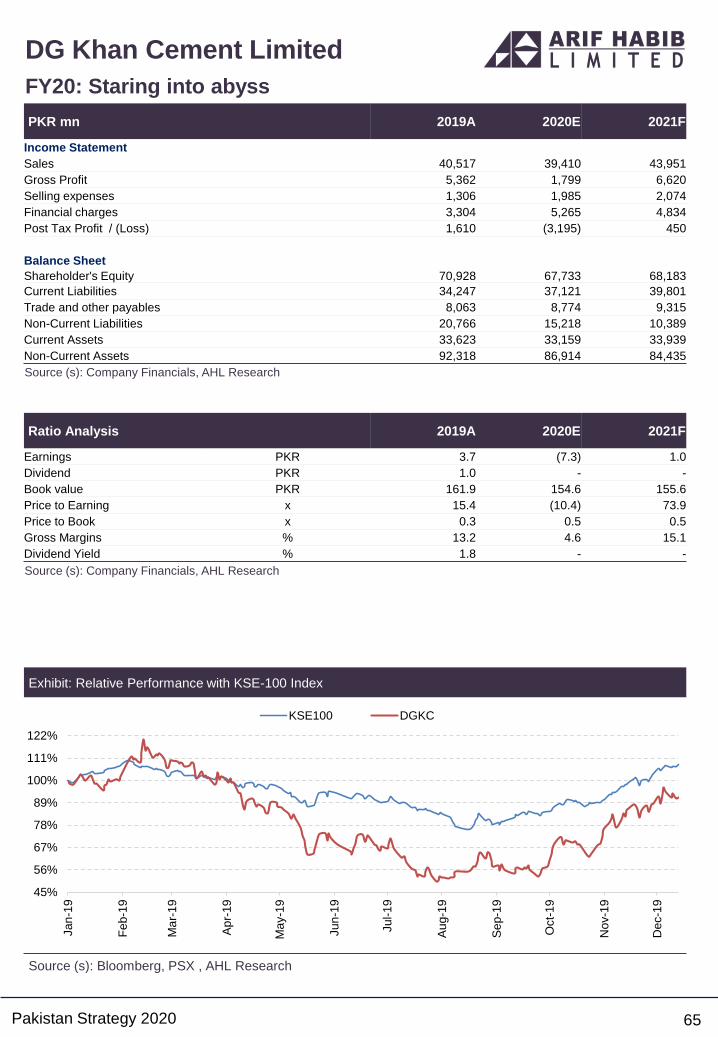
Pakistan Strategy 2020 65
Exhibit: Relative Performance with KSE-100 Index
Source (s): Bloomberg, PSX , AHL Research
PKR mn 2019A 2020E 2021F
Income Statement
Sales 40,517 39,410 43,951
Gross Profit 5,362 1,799 6,620
Selling expenses 1,306 1,985 2,074
Financial charges 3,304 5,265 4,834
Post Tax Profit / (Loss) 1,610 (3,195) 450
Balance Sheet
Shareholder's Equity 70,928 67,733 68,183
Current Liabilities 34,247 37,121 39,801
Trade and other payables 8,063 8,774 9,315
Non-Current Liabilities 20,766 15,218 10,389
Current Assets 33,623 33,159 33,939
Non-Current Assets 92,318 86,914 84,435
Source (s): Company Financials, AHL Research
Ratio Analysis 2019A 2020E 2021F
Earnings PKR 3.7 (7.3) 1.0
Dividend PKR 1.0 - -
Book value PKR 161.9 154.6 155.6
Price to Earning x 15.4 (10.4) 73.9
Price to Book x 0.3 0.5 0.5
Gross Margins % 13.2 4.6 15.1
Dividend Yield % 1.8 - -
Source (s): Company Financials, AHL Research
DG Khan Cement Limited
FY20: Staring into abyss
45%
56%
67%
78%
89%
100%
111%
122%
Jan
-19
Fe
b-1
9
Ma
r-1
9
Ap
r-19
Ma
y-1
9
Jun
-19
Jul-
19
Au
g-1
9
Se
p-1
9
Oct-
19
Nov-1
9
Dec-1
9
KSE100 DGKC

Pakistan Strategy 2020 66
Power GenerationDollar Hedged Return

Pakistan Strategy 2020 67
Key Investment Theme
Return Hedged Against US Dollar And Inflation: The power sector of Pakistan has a unique return
structure. The return component has a built in immunity against both local and foreign inflation. This unique
structure provides a natural hedge to investors against inflation, currency and interest rates. This kind of
structure also provides comfort to foreign investors invested in local IPPs.
Increasing Demand: Nine (9) special economic zones (SEZs) being established under the China-Pakistan
Economic Corridor (CPEC). As per the document submitted to the Senate Special Committee on CPEC, the
total expected demand for these SEZs is 934MW. In addition to this govt’s Naya Pakistan Housing Program
of 5 million houses will also spur the power demand. As per Central Power Purchasing Agency Guarantee
Limited (CPPAG), power demand is expected to grow by 4.1% for next six (6) years; from 21.5K MW in
2019 to 27.6K MW in 2025.
Long Term Tariff Structure: All IPPs have a long term tariff ranging from 20-30 years and power
purchaser is bound to pay the Capacity Purchase Price (CPP) to the power producer, regardless of whether
electricity is purchased or not during the tariff period. The tariff of power companies is split into two
components; i) Capacity Purchase Price (CPP), and ii) Energy Purchase Price (EPP). The CPP component
is hedged against US Dollar with no dependency on the load factor of the power generation company. The
EPP component is a pass through item which includes the fuel cost and variable operation and maintenance
costs.
Key Risks
Lower power demand due to economic slowdown and delay in CPEC based SEZs.
Lower than expected PKR depreciation.
Rising circular debt may prolong the liquidity crisis and keep payout muted.
Exhibit: Tariff Components at Various Stages of Power Supply-Chain
Source (s): NEPRA, AHL Research, *Operation & Maintenance, ^Transmission & Distribution
Generation Stage Transmission Stage Distribution Stage Retail Tariff
1) Capacity Purchase Price Use of System Charge 1) Distribution margin 1) Capacity Purchase Price
2) Energy Purchase Price 2) T & D^ losses (allowed) 2) Energy Purchase Price
3) Variable O&M* 3) Prior year Adjustments 3) Variable O&M
4) Use of System Charge
5) Distribution margin
6) T & D losses (allowed)
7) Prior year Adjustments
Mkt Cap (USD mn) KSE-100 Index Weight No. of Companies Free Float (%) Sector Stance
2,138 6.8% 17 42.2% Market Weight
Power Generation
Dollar Hedged Return
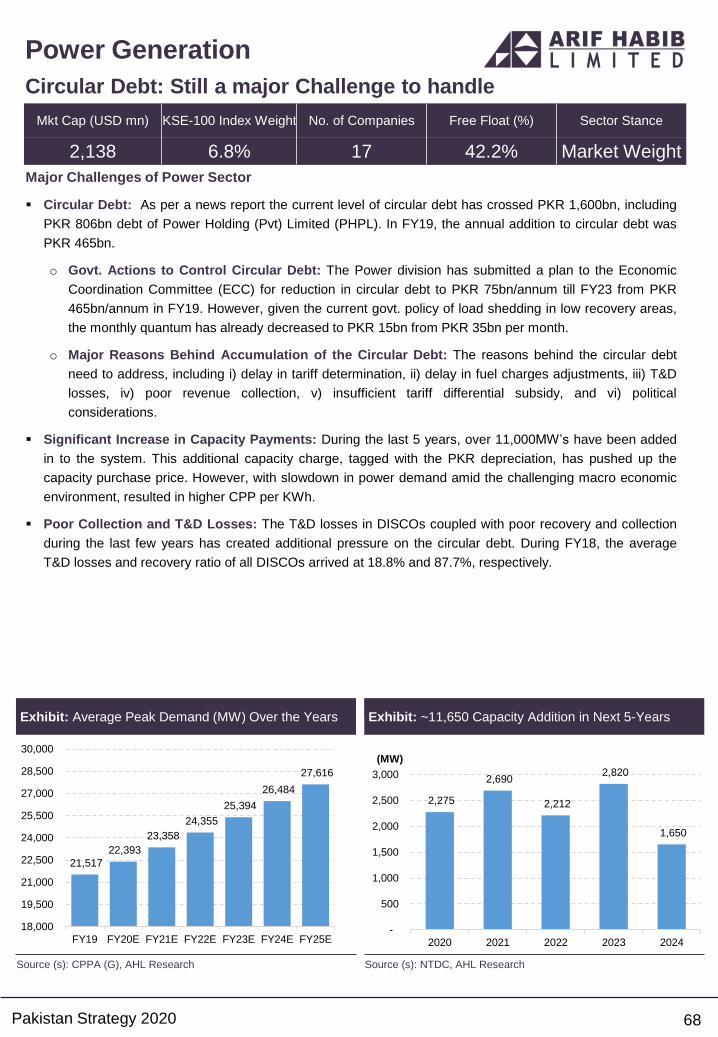
Pakistan Strategy 2020 68
Major Challenges of Power Sector
Circular Debt: As per a news report the current level of circular debt has crossed PKR 1,600bn, including
PKR 806bn debt of Power Holding (Pvt) Limited (PHPL). In FY19, the annual addition to circular debt was
PKR 465bn.
o Govt. Actions to Control Circular Debt: The Power division has submitted a plan to the Economic
Coordination Committee (ECC) for reduction in circular debt to PKR 75bn/annum till FY23 from PKR
465bn/annum in FY19. However, given the current govt. policy of load shedding in low recovery areas,
the monthly quantum has already decreased to PKR 15bn from PKR 35bn per month.
o Major Reasons Behind Accumulation of the Circular Debt: The reasons behind the circular debt
need to address, including i) delay in tariff determination, ii) delay in fuel charges adjustments, iii) T&D
losses, iv) poor revenue collection, v) insufficient tariff differential subsidy, and vi) political
considerations.
Significant Increase in Capacity Payments: During the last 5 years, over 11,000MW’s have been added
in to the system. This additional capacity charge, tagged with the PKR depreciation, has pushed up the
capacity purchase price. However, with slowdown in power demand amid the challenging macro economic
environment, resulted in higher CPP per KWh.
Poor Collection and T&D Losses: The T&D losses in DISCOs coupled with poor recovery and collection
during the last few years has created additional pressure on the circular debt. During FY18, the average
T&D losses and recovery ratio of all DISCOs arrived at 18.8% and 87.7%, respectively.
Exhibit: Average Peak Demand (MW) Over the Years Exhibit: ~11,650 Capacity Addition in Next 5-Years
Source (s): CPPA (G), AHL Research Source (s): NTDC, AHL Research
21,517
22,393
23,358
24,355
25,394
26,484
27,616
18,000
19,500
21,000
22,500
24,000
25,500
27,000
28,500
30,000
FY19 FY20E FY21E FY22E FY23E FY24E FY25E
2,275
2,690
2,212
2,820
1,650
-
500
1,000
1,500
2,000
2,500
3,000
2020 2021 2022 2023 2024
(MW)
Mkt Cap (USD mn) KSE-100 Index Weight No. of Companies Free Float (%) Sector Stance
2,138 6.8% 17 42.2% Market Weight
Power Generation
Circular Debt: Still a major Challenge to handle

Pakistan Strategy 2020 69
Tariff Increase is not Enough to Subdued the Impact of Incremental Capacity Payments
Capacity Addition of Relative Source of Generation: As per the NTDC report, the planned capacity
addition during the next five (5) years is 11,650MW. Out of which, 3,360MW addition is local coal-based,
1,620MW is imported coal-based, 2,200MW is nuclear-based, 1,852MW is hydel-based, 1,243MW is
RLNG-based, 1,002MW is bagasse-based and 100MW is solar-based. Almost 90% of the planned addition
is relatively cheaper compared to RLNG (most expensive fuel at present after FO). However, the CPP of the
system is expected to increased by 3.3x to PKR 907bn in FY20E compared to PKR 275bn during FY16. The
rise in CPP is driven by ~11,000MW addition of capacity along with PKR depreciation.
Further Increase in Power Tariff is Unavoidable: As stated above, the capacity payments are expected to
increased by 3.3x, hence the govt. has to increase the power tariff to compensate the jump. Having said
that, the government has already increased the power tariff by PKR 3.56/KWh (31%) to PKR 15.06/KWh,
which is insufficient to overcome the incremental impact of capacity payments, we view.
Exhibit: CPP* to Reach at PKR 6.67/KWh Exhibit: CPP will be 55% of Total Tariff* by 2020
Source (s): CPPA (G), AHL Research, * Capacity Purchase Price Source (s): CPPA (G), AHL Research, *Generation Stage
Exhibit: RFO is the Most Expensive Source of Power
Generation
Exhibit: Share of Nuclear is Expected to Reach at 15%
by 2025 in Generation Mix
Source (s): NEPRA, AHL Research, Fuel Cost for the month of Oct’19 Source (s): NEPRA, NTDC, AHL Research
7%
18%
26%13%
-7%
5%
23%
0.02%7%
34%
7%13%
15%
9%
15%RFO
Gas
Hydro
Imp. Coal
Local Coal
Nuclear
Renewable
RLNG
FY19 FY25
Mkt Cap (USD mn) KSE-100 Index Weight No. of Companies Free Float (%) Sector Stance
2,138 6.8% 17 42.2% Market Weight
Power Generation
CPP is Expected to Cross PKR 900bn
62%
38%45%
55%
EPP CPP
FY20E FY16
4.6 5.36.2 6.2 5.4
2.83.1
3.54.6 6.7
-
2.00
4.00
6.00
8.00
10.00
12.00
14.00
FY16 FY17 FY18 FY19 FY20E
EPP CPP
(PKR / KWh)
1.0
3.3
5.9 6.8 7.2
9.9
11.6
13.4
-
2.0
4.0
6.0
8.0
10.0
12.0
14.0
16.0
Nucle
ar
Ba
ggasse
Coal
Mix
ed
Gas
RLN
G
Import
ed
FO
Oct-19(PKR/KWh)

Pakistan Strategy 2020 70
Exhibit: KAPCO’s Generation Mix Tilted Towards RLNG Exhibit: As per NTDC, KAPCO is Available till 2028
Source (s): Company Financials, AHL Research Source (s): NTDC, AHL Research
Key Investment Theme
Return Hedged Against US Dollar And Inflation: The power sector of Pakistan has a unique return
structure. The return component has a built in immunity against both local and foreign inflation. This unique
structure provides a natural hedge to investors against inflation, currency and interest rates. Due to PKR
depreciation during FY19, the Capacity Purchase Price (CPP) of KAPCO has witnessed an increase of 12%
YoY to PKR 20.1bn.
SUKUK-2; KAPCO is Expected to Receive the Highest Portion: The govt. is trying to curb the circular
debt and has already issued a SUKUK of PKR 200bn, while another SUKUK worth PKR 250bn is the
pipeline. As of Sep’19, KAPCO’s total receivables settled at PKR 132bn, which are the highest amongst all
other IPPs and we expect the company to receive the highest portion from SUKUK-2.
PPA Extension is Likely: We expect an extension in the Power Purchase Agreement (PPA) of the
company given i) KAPCO is a multi-fired power plant, ii) the plant has an average efficiency of 44% (42.5%-
47%), iii) located in the load center, iv) small generation units, v) has a useful life of 5-10 years, and vi)
dependency of the Southern Punjab industry on KAPCO. However, we have not incorporated the PPA
extension in our valuations.
Key Risks
Lower power demand due to economic slowdown and delay in CPEC based SEZs.
Lower than expected PKR depreciation.
Rising circular debt may prolong the liquidity crisis and keep payout muted.
Possible outcome of Liquidity Damages (LDs) proceedings against the company.
Extension of PPA on unfavorable conditions.
86% 81%
63%
45%29%
3%3%
3%
0%
0%
11% 16%
34%
55%71%
0%
20%
40%
60%
80%
100%
120%
FY15 FY16 FY17 FY18 FY19
RFO HSD Gas/RLNGJamshoro
200
MW
1
Unit(s)
AES
350
MW
1
Unit(s)
Jamshoro
170
MW
3
Unit(s)
Kot addu
140
MW
3
Units(s)
Kohinoor
13.8
MW
9
Unit(s)
Guddu ST
60
MW
2
Units(s)
FSB CC
134
MW
1
Units(s)
HUBCO
300
MW
1
Units(s)
Saba
123
MW
1
Units(s)
FSB GT
19
MW
4
Units(s)
Guddu ST
140
MW
2
Units(s)
Guddu CC
360
MW
1
Units(s)
HUBCO
300
MW
3
Units(s)
Kor Addu
336
MW
1
Unit(s)
Roush
395
MW
1
Unit(s)
Uch
551
MW
1
Unit(s)
Liberty
212
MW
1
Unit(s)
FSB Steam
50
MW
2
Unit(s)
Kor Addu
251
MW
1
Unit(s)
Guddu CC
280
MW
2
Units(s)
Kotri CC
107
MW
1
Units(s)
Lakhra
30
MW
2
Units(s)
MGARH
177
MW
5
Units(s)
MGARH
245
MW
1
Units(s)
AES
350
MW
1
Unit(s)
Habib Ullah
126
MW
1
Units(s)
F-kabirwala
150
MW
1
Units(s)
Alltern
10
MW
1
Units(s)
2020 2021 2022 2023 2024 2025 2026 2027 2028 2029 2030 2031 2032
Gas
FO
Coal
RLNG
Kot Addu Power Company Ltd.
Multi-fired Power Plant
PSX Code Target Price (Dec’20) Market Price Total Return Stance
KAPCO 46.80 31.99 79.1% BUY

Pakistan Strategy 2020 71
Kot Addu Power Company Ltd.
Multi-fired Power Plant
Exhibit: Relative Performance with KSE-100 Index
Source (s): Bloomberg, PSX , AHL Research
PKR mn 2019A 2020E 2021F
Income Statement
Net Sales 98,756 134,527 123,794
Gross Profit 14,205 18,475 18,529
Operating Profit 13,781 12,473 11,201
Finance Cost 8,306 8,083 7,313
Post Tax Profit 13,112 15,459 15,738
Balance Sheet
Shareholder's Equity 41,161 47,377 53,873
Trade and Other Payables 54,218 86,122 79,253
Total Liabilities 98,106 120,619 104,711
Current Assets 132,512 162,925 155,486
Non-Current Assets 6,755 5,071 3,098
Total Assets 139,267 167,997 158,584
Source (s): Company Financials, AHL Research
Ratio Analysis 2019A 2020E 2021F
Earnings PKR 14.90 17.56 17.88
Dividend PKR 4.50 10.50 10.50
Book value PKR 46.76 53.82 61.20
Price to Earning x 2.44 1.82 1.79
Dividend Yield % 12.37 32.82 32.82
Price to Book x 0.78 0.59 0.52
Net Margins % 14.38 13.73 14.97
Source (s): Company Financials, AHL Research
55%
66%
77%
88%
99%
110%
Jan
-19
Fe
b-1
9
Ma
r-1
9
Ap
r-19
Ma
y-1
9
Jun
-19
Jul-
19
Au
g-1
9
Se
p-1
9
Oct-
19
Nov-1
9
Dec-1
9
KSE100 KAPCO

Pakistan Strategy 2020
Sectors
72
Oil & Gas Marketing CompaniesGood Days Ahead

Pakistan Strategy 2020 73
Exhibit: Declining FO Share in Overall Volumes Exhibit: Rising OMC Margins
Source (s): OCAC, AHL Research Source (s): OGRA, AHL Research
Key Investment Theme
HSD and FO Remained Key Culprits for Volumetric Decline: During last 2 years, Furnace Oil (FO) and
High Speed Diesel (HSD) sales witnessed a steep decline due to power generation from FO being replaced
with cheaper fuel sources while excess arrival of smuggled diesel from Iran is relatively cheaper than official
HSD price. MS sales grew at a three year CAGR of 13% on account of continuous increase in vehicle
population.
IMO 2020 - Game Changing Fuel Regulation for OMCs: International Maritime Organization (IMO) is
expected to implement its global regulation by 1st Jan’20 to reduce Sulphur content of marine fuel. This
development is going to be material positive for OMCs given significant reduction in international HSFO
price which should revive sales volume of FO and make it a cheaper source of fuel for power generation
compared to RLNG.
Multiple Factors to Improve Fuel Demand: We expect demand momentum to pick up pace from early
CY20 amid i) economic stabilization to increase demand of retail fuels, ii) increased surveillance on borders
to control smuggling, and iii) implementation of IMO-2020 which will encourage captive power producers to
use FO as cheaper fuel.
Robust Earnings Forecasted: Currently the situation is turning favorable for the sector given advent of
market determined exchange rate resulting in less volatility in the PKR-USD parity, stable international oil
prices and uptick in inflation. This should be beneficial for the sector as margin revision is linked with CPI.
High Interest Rates to Erode the Otherwise Robust Profitability: Recent control of unaccounted for gas
(UFG) losses together with an expansion in the distribution network, has translated positively in profitability.
Whereas recent hikes in gas prices are also expected to relieve some pressure off of the cash flows of local
utilities, as the government targets to minimize the difference in prescribed and consumer prices. Albeit,
high interest rates and augmented borrowing amid accumulation of receivables has rendered finance costs
to undergo a massive jump, hence compressing the bottom-line slightly.
Key Risks
Devaluation of PKR against USD can lead to exchange losses.
Decline in ex-refinery prices may result in inventory loss.
Uncontrolled arrival of smuggled fuel from Iran.
PKR depreciation against USD alongside higher oil prices trigger an uptick in weighted average cost of gas
which exaggerates the quantum of UFG.
Mkt Cap (USD mn) KSE-100 Index Weight No. of Companies Free Float (%) Sector Stance
1,494 4.6% 8 38.2% Over Weight
Oil & Gas Marketing Companies
Good Days Ahead
4.7 5.8 6.7 7.3 7.4 7.7
7.4 7.7
8.4 9.0 7.2 7.6
9.1 8.7
9.3 7.1
3.0 2.7
1.0 1.0
1.0 1.0
0.7 0.8
-
5.0
10.0
15.0
20.0
25.0
30.0
FY15 FY16 FY17 FY18 FY19 FY20E
MS HSD FO Others
(Mn Tons)
2.41 2.50 2.64
2.81 3.12
3.40
0.0%
2.0%
4.0%
6.0%
8.0%
10.0%
12.0%
-
0.50
1.00
1.50
2.00
2.50
3.00
3.50
4.00
FY17 FY18 FY19 FY20E FY21F FY22F
OMC's distribution margin Growth
(PKR/Liter)
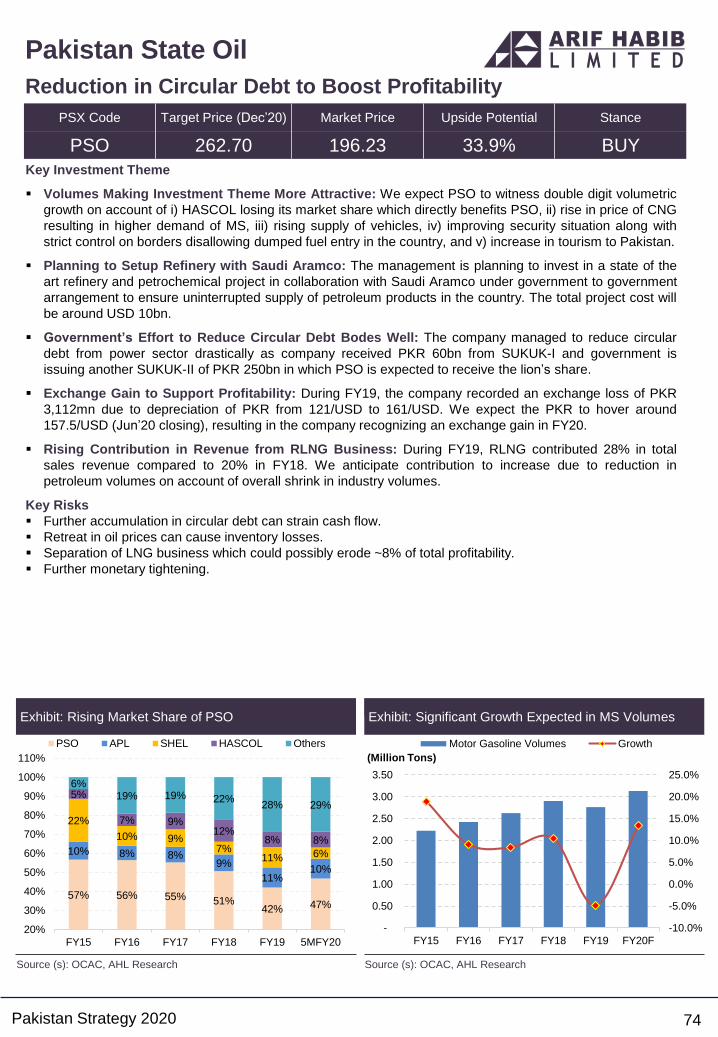
Pakistan Strategy 2020 74
Exhibit: Rising Market Share of PSO Exhibit: Significant Growth Expected in MS Volumes
Source (s): OCAC, AHL Research Source (s): OCAC, AHL Research
Key Investment Theme
Volumes Making Investment Theme More Attractive: We expect PSO to witness double digit volumetric
growth on account of i) HASCOL losing its market share which directly benefits PSO, ii) rise in price of CNG
resulting in higher demand of MS, iii) rising supply of vehicles, iv) improving security situation along with
strict control on borders disallowing dumped fuel entry in the country, and v) increase in tourism to Pakistan.
Planning to Setup Refinery with Saudi Aramco: The management is planning to invest in a state of the
art refinery and petrochemical project in collaboration with Saudi Aramco under government to government
arrangement to ensure uninterrupted supply of petroleum products in the country. The total project cost will
be around USD 10bn.
Government’s Effort to Reduce Circular Debt Bodes Well: The company managed to reduce circular
debt from power sector drastically as company received PKR 60bn from SUKUK-I and government is
issuing another SUKUK-II of PKR 250bn in which PSO is expected to receive the lion’s share.
Exchange Gain to Support Profitability: During FY19, the company recorded an exchange loss of PKR
3,112mn due to depreciation of PKR from 121/USD to 161/USD. We expect the PKR to hover around
157.5/USD (Jun’20 closing), resulting in the company recognizing an exchange gain in FY20.
Rising Contribution in Revenue from RLNG Business: During FY19, RLNG contributed 28% in total
sales revenue compared to 20% in FY18. We anticipate contribution to increase due to reduction in
petroleum volumes on account of overall shrink in industry volumes.
Key Risks
Further accumulation in circular debt can strain cash flow.
Retreat in oil prices can cause inventory losses.
Separation of LNG business which could possibly erode ~8% of total profitability.
Further monetary tightening.
Pakistan State Oil
Reduction in Circular Debt to Boost Profitability
PSX Code Target Price (Dec’20) Market Price Upside Potential Stance
PSO 262.70 196.23 33.9% BUY
57% 56% 55% 51%42% 47%
10% 8% 8%9%
11%10%
22%
10% 9%7%
11% 6%
5%
7% 9%12%
8% 8%
6%19% 19% 22%
28% 29%
20%
30%
40%
50%
60%
70%
80%
90%
100%
110%
FY15 FY16 FY17 FY18 FY19 5MFY20
PSO APL SHEL HASCOL Others
-10.0%
-5.0%
0.0%
5.0%
10.0%
15.0%
20.0%
25.0%
-
0.50
1.00
1.50
2.00
2.50
3.00
3.50
FY15 FY16 FY17 FY18 FY19 FY20F
Motor Gasoline Volumes Growth
(Million Tons)

Pakistan Strategy 2020 75
Exhibit: Relative Performance with KSE-100 Index
Source (s): Bloomberg, PSX , AHL Research
PKR mn 2019A 2020E 2021F
Income Statement
Sales 1,154,298 1,223,380 1,343,527
Gross Profit 36,017 38,550 43,446
Other Income 7,305 8,394 8,742
Finance Cost 8,939 11,137 10,320
Post Tax Profit 10,587 11,345 13,889
Balance Sheet
Shareholder's Equity 119,181 126,613 133,460
Interest Bearing Liabilities 107,994 91,974 91,954
Total Liabilities 297,899 262,383 281,116
Current Assets 384,225 355,329 379,677
Non-Current Assets 32,854 33,667 34,899
Total Assets 417,080 388,996 414,576
Source (s): Company Financials, AHL Research
Ratio Analysis 2019A 2020E 2021F
Earnings PKR 22.5 24.2 29.6
Dividend PKR 10.0 10.0 15.0
Book value PKR 253.9 269.7 284.3
Price to Earning x 7.5 8.1 6.6
Dividend Yield % 5.9 5.1 7.6
Price to Book x 0.7 0.7 0.7
Net Margins % 0.9 0.9 1.0
Source (s): Company Financials, AHL Research
Pakistan State Oil
Reduction in Circular Debt to Boost Profitability
47%
56%
65%
74%
83%
92%
101%
110%
Jan
-19
Fe
b-1
9
Ma
r-1
9
Ap
r-19
Ma
y-
19
Jun
-19
Jul-
19
Au
g-
19
Se
p-
19
Oct-
19
No
v-1
9
De
c-1
9
KSE100 PSO

Pakistan Strategy 2020 76
Exhibit: Visible growth in distribution network Exhibit: Profitability & Price Performance
Source (s): Company Financials, AHL Research Source (s): Company Financials, AHL Research
Key Investment Theme
Assets’ Growth to Fuel Operating Profits: Given the induction of RLNG into the system, the Regulator
continues to sanction augmented funds (capital requirement targeted at PKR 35bn and PKR 20bn in FY19
and FY20, respectively) - primarily to develop the distribution network. Bearing in mind the ROA-based
formula SNGP derives its bottom-line from, a massive surge therefore can be expected in operating profits.
Albeit, we have phased out the expenditure to PKR 12bn by FY24, despite the company projecting a bigger
quantum of CAPEX (PKR 46bn), since historically OGRA has remained relatively conservative.
UFG Losses to Remain Contained: Although UFG losses appear inconsistent in terms of percentage,
absolute UFG losses have come down significantly from 71bcf in FY13 to 50bcf in FY18. With domestic gas
depleting naturally, and given continuous efforts of the UFG Control Committee, we estimate UFG volumes
to continue ticking lower going forward. While we have assumed average UFG to exceed 10% over our
investment horizon.
Gas Tariff Hikes to Shield cash flows: Energy sector reforms under the IMF program entail timely
notification and adjustment in end-consumer tariffs by the Regulator, therefore easing liquidity concerns.
Prior to this, the government delayed increasing the tariff for several years which stressed the cash flows of
gas utilities as the deficit filled in by the government swelled to enormous levels.
Accumulate at Current Levels: Our Dec’20 DCF-based target price has been revised to PKR
111.06/share. The stock offers an upside of 44% from last closing, we recommend BUY.
Key Risks
Failure to ensure utilization of RLNG will cause liquidity issues under the long term take or pay clause.
Surge in UFG losses; every 1% upturn in our UFG assumption erodes bottom-line by ~PKR 1.5bn.
Implementation of the UFG reduction plan, a key requirement of the IMF, poses an upside risk.
Higher oil prices and PKR depreciation push up the quantum of weighted average cost of gas and UFG.
0%
2%
4%
6%
8%
10%
12%
14%
-
20,000
40,000
60,000
80,000
100,000
120,000
140,000
FY
10
FY
11
FY
12
FY
13
FY
14
FY
15
FY
16
FY
17
FY
18
Distribution Network (Kms) YoY % Age Increase (RHS)
7%
8%
9%
10%
11%
12%
-
10,000
20,000
30,000
40,000
50,000
60,000
70,000
80,000
FY
13A
FY
14A
FY
15A
FY
16A
FY
17A
FY
18A
FY
19E
FY
20F
Actual UFG (MMCF) UFG % (RHS)
Sui Northern Gas Pipelines
Upgrade to RLNG Provides Layered Defense
PSX Code Target Price (Dec’20) Market Price Upside Potential Stance
SNGP 111.06 78.98 40.6% BUY

Pakistan Strategy 2020 77
Sui Northern Gas Pipelines
Upgrade to RLNG Provides Layered Defense
Exhibit: Relative Performance with KSE-100 Index
Source (s): Bloomberg, PSX , AHL Research
PKR mn 2018A 2019E 2020F
Income Statement
Sales 503,782 810,848 904,963
Cost of sales 476,786 771,418 878,247
Operating Profit 26,282 39,328 28,502
Financial charges 10,806 25,019 13,890
Post Tax Profit 11,121 10,159 10,375
Balance Sheet
Shareholder's Equity 18,677 24,365 30,300
Current Liabilities 280,714 386,873 366,353
Trade and other payables 233,680 321,371 325,629
Non-Current Liabilities 161,766 151,666 157,919
Current Assets 267,094 352,459 345,133
Non-Current Assets 194,063 210,446 209,439
Source (s): Company Financials, AHL Research
Ratio Analysis 2018A 2019E 2020F
Earnings PKR 17.5 16.0 16.4
Dividend PKR 7.1 7.0 7.0
Book value PKR 29.4 38.4 47.8
Price to Earning x 5.7 4.3 4.8
Dividend Yield % 7.0 10.1 8.9
Price to Book X 3.4 1.8 1.7
Payout % 40.2 40.0 40.0
Source (s): Company Financials, AHL Research
70%
80%
90%
100%
110%
120%
Jan
-19
Fe
b-1
9
Ma
r-1
9
Ap
r-19
Ma
y-1
9
Jun
-19
Jul-
19
Au
g-1
9
Se
p-1
9
Oct-
19
Nov-1
9
Dec-1
9
KSE100 SNGP

Pakistan Strategy 2020
Sectors
78
Automobile AssemblersEconomic Turmoil Clouds Volumetric Growth

Pakistan Strategy 2020 79
Exhibit: Automobile Sales Volume Exhibit: Market Share
Source (s): PAMA, AHL Research Source (s): PAMA, AHL Research
Key Investment Theme
Double Digit Decline in Auto Volumes: In the period under review, auto sales have witnessed a massive
slowdown due to i) significant depreciation of PKR against USD, ii) rise in interest rates to 13.25%, iii)
slower GDP growth (5.5% in FY18 to 3.3% in FY19), iv) competition from new entrants, v) imposition of
Federal Excise Duty (FED) on sale of automobiles, and vi) increase in additional custom duty and regulatory
duty on imported raw materials.
A Story from Double Shift Working to Non Production Days: Previously, all three OEMs used to
operate plants on a double shift basis to reduce delivery time period as demand of automobiles was at its
peak. Currently, two leading automobile assemblers are observing Non Production Days (NPD) and we
expect this to continue in the upcoming year as demand of automobiles is expected to remain subdued due
to economic slowdown and higher prices of automobiles.
Volumetric Outlook: The upcoming year is going to be the year of new players as they have better pricing
power given availability of duty concession for new players [as per Automobile Development Policy (2016-
21)] which will allow them to penetrate and grab market share from existing automobile manufacturers. We
expect overall volumes to drop by 40% while HCAR, INDU, MTL and PSMC volumes are expected to
decrease by 40%, 39%, 25% and 10%, respectively.
Electric Vehicle Policy - Talk of the Town: Minister for Climate Change proposed EV policy to save
environment and precious foreign exchange of around USD 2bn per annum. In the proposed policy, import
of CBU vehicles will be allowed at zero duty for the next five years while 1% sales tax will be collected from
EV assemblers for seven years. We believe implementation on EV policy might depress volumes of existing
auto manufacturers.
Profitability to Remain Stressed: Currently sustainability of margins and profitability remains challenging
for the sector due to i) depressed Purchasing power of customers given lower GDP growth (2.4% in FY20)
and high inflation forecast, ii) government's documentation drive, and iii) higher interest rates.
Key Risks
Economy may face further slowdown in upcoming year.
Approval and implementation of proposed Electric Vehicle Policy.
Unexpected movement in exchange rates.
Delay in introduction of new cars by existing players or new players grabbing market share of existing
OEMs.
Mkt Cap (USD mn) KSE-100 Index Weight No. of Companies Free Float (%) Sector Stance
1,761 2.7% 12 20.4% Under Weight
Automobile Assemblers
Economic Turmoil Clouds Volumetric Growth
-
50
100
150
200
250
300
FY
14
FY
15
FY
16
FY
17
FY
18
FY
19
5M
FY
19
5M
FY
20
INDU PSMC HCAR(000 Units)
25%
32%29% 28%
24%27%
57%55%
59%54%
56% 54%
18%13% 12%
18% 20% 18%
0%
10%
20%
30%
40%
50%
60%
70%
FY14 FY15 FY16 FY17 FY18 FY19
INDU PSMC HCAR

Pakistan Strategy 2020 80
Exhibit: Declining Capacity Utilization Exhibit: Car Share in Total Sales
Source (s): Company Financials, PAMA, AHL Research Source (s): Company Financials, PAMA, AHL Research
Key Investment Theme
Macroeconomic Slowdown to Keep Volumes Subdued: Historic data shows that auto demand in
Pakistan is highly sensitive to economic slowdown. As a result, PSMC witnessed double digit decline in
volumes despite launch of most awaited 660cc Suzuki Alto which saved the grace as it contributes almost
50% of Suzuki’s production form 2HCY19. Apart from launch of Alto, the company is witnessing worst time
period in its history in terms of sales and profitability.
Higher Finance Costs to Erode Profitability: During the period under review, company obtained historic
high short term borrowing in high interest rate era which exceeds PKR ~20bn mark to meet working capital
requirements. The current mark up rate on borrowing ranges between 12-14%. We expect higher finance
costs owing to augmented short term borrowings to keep profitability subdued.
New Entrants Grabbing Market Share from Existing Players: KIA recently launched Picanto in Sep’19
which has given immense competition to Cultus and Wagon R, resulting in drastic volumetric decline of 35%
YoY and 75% YoY during 5MFY20. We expect launch of new hatchback models from new entrants which
will reduce market share of the company.
Trading at Unjustified P/E: Despite massive surge in vehicle prices, PSMC is set to register a huge loss in
CY19 as company was unable to pass on full impact of currency depreciation while rise in duties on
imported raw materials resulted in lower gross margins. We expect the company to post a loss per share of
PKR 43/share compared to earnings per share of PKR 15 last year. PSMC is trading at an unjustified price
compared to peers.
Key Risks
Further adverse currency movement would result in higher exchange loss and lower gross margins.
Higher duty concessions to new entrants.
Adverse change in import duty structure.
Pak Suzuki Motors Company Ltd
Higher Cost of Financing Upsetting Bottom-line
PSX Code Target Price (Dec’20) Market Price Total Return Stance
PSMC 143.70 255.36 -43.7% Sell
50%
55%
60%
65%
70%
75%
80%
85%
90%
95%
(10)
20
50
80
110
140
170
200
CY14 CY15 CY16 CY17 CY18 CY19E
Capacity Sales Capacity Utilization
(000 Units)Swift, 4%
Cultus, 15%
WagonR, 21%
Alto/Mehran, 28%
Bolan, 16%
Ravi, 16%

Pakistan Strategy 2020 81
Pak Suzuki Motors Company Ltd
Higher Cost of Financing Upsetting Bottom-line
Exhibit: Relative Performance with KSE-100 Index
Source (s): Bloomberg, PSX , AHL Research
PKR mn 2018A 2019E 2020F
Income Statement
Net Sales 119,853 123,011 137,529
Gross Profit 7,044 1,824 7,627
Other Income 565 322 283
Finance Cost 362 1,589 2,182
Post Tax Profit 1,298 (3,502) 162
Balance Sheet
Shareholder's Equity 29,233 25,731 25,893
Interest Bearing Liabilities 11,310 21,490 20,415
Total Liabilities 32,277 42,756 45,147
Current Assets 43,682 48,351 51,515
Non-Current Assets 17,828 20,136 19,525
Total Assets 61,510 68,487 71,040
Source (s): Company Financials, AHL Research
Ratio Analysis 2018A 2019E 2020F
Earnings PKR 15.8 (42.6) 2.0
Dividend PKR 3.2 - -
Book value PKR 355.2 312.6 314.6
Price to Earning x 11.0 nm 129.3
Dividend Yield % 1.8 - -
Price to Book x 0.5 0.8 0.8
Net Margins % 1.1 (2.8) 0.1
Source (s): Company Financials, AHL Research
70%
91%
112%
133%
154%
175%
196%
Jan
-19
Fe
b-1
9
Ma
r-1
9
Ap
r-19
Ma
y-1
9
Jun
-19
Jul-
19
Au
g-1
9
Se
p-1
9
Oct-
19
Nov-1
9
Dec-1
9
KSE100 PSMC

Pakistan Strategy 2020
Sectors
82
TextileExpanding to Increase Global Footprint

Pakistan Strategy 2020 83
Exhibit: Contribution in Textile Exports Exhibit: Total Textile Exports
Source (s): PBS, AHL Research Source (s): PBS, AHL Research
Key Investment Theme
Volumetric Growth: The textile sector of Pakistan has witnessed decent volumetric growth, especially the
value added segment, on account of government’s support to export oriented sector in terms of subsidized
gas and electricity prices, partial clearance of pending refunds, currency depreciation and availability of
cheaper financing (LTFF and ERF). This has resulted in double digit growth in volumes of textile exports.
Continuation of GSP+ Status and Free Trade Agreement with Other Countries: Pakistan finally
entered into the long awaited Free Trade Agreement (FTA) phase-II with China and it is expected to benefit
the textile sector the most (in particular the value added sector), as it can export products at 0% import tariff
compared to an import tariff of 5-9% previously.
Downward Mobility: We believe the ongoing financial year will prove to be challenging for the textile sector
given higher cotton prices (25% YoY growth in average prices) and low cotton output (declined by 20%
YoY) in the country. Furthermore, high interest rates, change in taxation regime (removal of zero rated
status) and Pak Rupee appreciation are some of the factors posing threat to sector’s profitability.
Export-Friendly Approach: The incumbent government has taken several steps to boost textile exports by
providing relief in the form of i) reducing the cost of doing business by slashing custom / regulatory duties on
key imported raw materials, ii) concessionary gas prices at USD 6.5/mmbtu compared to actual market
price of USD 11/mmbtu, and iii) subsidized electricity prices at USD 7.5/Kwh. On the other hand, these
sectors have an advantage to avail borrowing on fixed interest rates from Export Refinance scheme (ERF)
at 3% and Long Term Finance Facility (LTFF) at 6.0% which is significantly lower than current discount rate
of 13.75%.
Key Risks
A key downside risk remains any reversal (appreciation) in the PKR/USD parity, which would negatively
affect exports and sales.
Volatility in Cotton and Polyester prices.
Delay in refund payments.
Discontinuation of GSP+ Status.
Mkt Cap (USD mn) KSE-100 Index Weight No. of Companies Free Float (%) Sector Stance
1,738 2.5% 50 24.8% Market Weight
Textile
Expanding to Increase Global Footprint
-
2.0
4.0
6.0
8.0
10.0
12.0
14.0
16.0
FY-14 FY-15 FY-16 FY-17 FY-18 FY-19
Cotton Yarn Cotton Cloth Knitwear
Bed Wear Readymade All Others
(USD bn)
13.5
12.5 12.5
13.5
13.3
-10.0%
-8.0%
-6.0%
-4.0%
-2.0%
0.0%
2.0%
4.0%
6.0%
8.0%
10.0%
11.8
12.0
12.2
12.4
12.6
12.8
13.0
13.2
13.4
13.6
13.8
FY-15 FY-16 FY-17 FY-18 FY-19
Total Exports Growth
(USD bn)

Pakistan Strategy 2020 84
Exhibit: Highest Gross Margins Exhibit: Hosiery Export Growth
Source (s): Company Financials, AHL Research Source (s): PBS, Company Financials, AHL Research
Key Investment Theme
Further Expansion in Hosiery Division: The company proved itself as a hosiery expert by posting
substantial growth in earnings. The company raised PKR 5.02bn finance an expansion plan which will
increase total machines to 6,300 (post expansion). The prime objective of expansion is to capture rising
demand, ensure timely delivery, adhere to quality standards, increase energy efficiency and value addition.
Diversification While Capitalizing On the Opportunity: Pakistan has a competitive edge in denim
production due to local cotton which is considered most suitable for manufacturing of denim fabric. To make
the most of it, ILP is planning to tap into the denim market, which is one of the most alluring textile segment,
by setting up a denim plant in Lahore with a production capacity of 14.6mn (40,000/pcs per day) jeans per
annum. We believe the denim segment will contribute around 5.3% of total sales or PKR ~3.0bn in FY20
and 9.2% or PKR ~6bn in FY21.
One of the World’s Largest Socks Supplier: The company holds ~9% share in the country’s knitwear
exports and 3.5%-4.0% in the world’s total socks supplies. Pakistan contributes 5% to global spinning
capacity hence, it makes ILP the world’s largest socks supplier (barring Chinese producers).
Double Digit Growth in Profitability: That said, we expect ILP to continue posting double digit growth
going forward since the company has a strong customer base globally, highest gross margins amongst
listed textile entities, experienced workforce, concrete liquidity position, state of the art machinery, alongside
its upcoming expansion in denim and hosiery division. We expect profitability of the company to grow at 5-yr
CAGR of 18.8%.
Key Risks
Escalation in trade war between US and China, which could lead to sales decline.
Any unfavorable movement in PKR/USD will result in exchange losses.
Any unfavorable decision of the Financial Action Task Force (FATF) to put Pakistan on the black list would
lead to decline in business and clientele, and other financial hardships.
Interloop Limited
Expansion to Keep Profitability Upbeat
PSX Code Target Price (Dec’20) Market Price Upside Potential Stance
ILP 67.70 58.08 16.6% Buy
1%
17%
23%
31%
0%
5%
10%
15%
20%
25%
30%
35%
-
5.0
10.0
15.0
20.0
25.0
30.0
35.0
40.0
45.0
50.0
FY17 FY18 FY19 FY20E
Total Hosiery Exports Exports Growth
(PKR bn)
23.9% 23.8%
28.3%26.5%
29.4%31.9%
0.0%
5.0%
10.0%
15.0%
20.0%
25.0%
30.0%
35.0%
FY14 FY15 FY16 FY17 FY18 FY19
NCL NML ILP GATM FML

Pakistan Strategy 2020 85
Interloop Limited
Expansion to Keep Profitability Upbeat
Exhibit: Relative Performance with KSE-100 Index
Source (s): Bloomberg, PSX , AHL Research
PKR mn 2019A 2020E 2021F
Income Statement
Net Sales 37,478 51,052 61,911
Gross Profit 11,955 14,297 17,484
Operating Profit 6,402 6,785 8,795
Finance Cost 996 1,085 1,302
Post Tax Profit 5,195 5,472 7,240
Balance Sheet
Shareholder's Equity 17,880 20,735 24,486
Interest Bearing Liabilities 16,602 19,658 22,679
Total Liabilities 22,903 26,236 29,535
Current Assets 21,357 24,004 27,941
Non-Current Assets 19,425 22,967 26,080
Total Assets 40,783 46,971 54,021
Source (s): Company Financials, AHL Research
Ratio Analysis 2019A 2020E 2021F
Earnings PKR 6.0 6.3 8.3
Dividend PKR 3.0 3.0 4.0
Book value PKR 20.5 23.8 28.1
Price to Earning x 7.4 9.3 7.0
Price to Book x 2.2 2.4 2.1
Gross Margins % 31.9 28.0 28.2
Net Margins % 13.9 10.7 11.7
Source (s): Company Financials, AHL Research
70%
81%
92%
103%
114%
125%
136%
147%
Ap
r-19
Ma
y-1
9
Jun
-19
Jul-
19
Au
g-1
9
Se
p-1
9
Oct-
19
Nov-1
9
Dec-1
9
KSE100 ILP

Pakistan Strategy 2020 86
Exhibit: FML’s Export Growth Exhibit: FML’s Share in Total Towel Exports
Source (s): Company Financials, AHL Research Source (s): Company Financials, AHL Research
Key Investment Theme
Towering ~27% Market Share Of The Country’s Towels Exports: Total sales accounts for ~99% of
exports given company has a portfolio of well-known international brands and strong reach in global
markets. The company maintained its share from the past few years while we expect this may increase to
30% till FY20 and onwards.
Efficient Cash Conversion Keeps Working Capital Solid: Cash conversion (Inventory days + Receivable
days – Payable Days) is a key contributor towards the success of the company as it boosts profitability of
the company and it also measures how efficiently a company extracts cash flow from its operations. FML’s
cash conversion cycle is one of the lowest amongst listed entities.
Massive Global Footprints: FML is a well-established player in the towel market with a growing market
share, as sales witnessed 5-yr CAGR of 10%. Total export accounts for ~99% of total sales given company
has a portfolio of well-known international brands and strong reach in global markets amid superior quality
products, given the company has partnered with 1,888 mills (holding 5.3% of shares on FML) in the US. We
believe towel volumes are likely to grow at a 5-yr CAGR of 4% where the growth is to be accelerated
through capacity addition, and rising overseas customer base.
Expansion to Capture Rising Demand: The company is continuously incurring capital expenditure to
increase production efficiency and to meet rising demand. During FY19, company made capex of PKR
3.6bn on investment in balancing, modernization and rehabilitation (BMR) of existing machinery with state of
the art new equipment. We expect company to incur capex of PKR 4bn in FY20 to add 24 looms along with
targeting replacement of older looms with newer looms.
Key Risks
Discontinuation of GSP+ status.
Any increase in duties on Pakistan by USA.
Adverse currency movement.
Volatility in Cotton and Polyester prices.
Feroze1888 Mills Limited
Weaving for Better Future
PSX Code Target Price (Dec’20) Market Price Upside Potential Stance
FML 133.90 96.00 39.5% Buy
-100%
1% 10% 3% 3%
35%
16%
-120%
-100%
-80%
-60%
-40%
-20%
0%
20%
40%
60%
-
5.0
10.0
15.0
20.0
25.0
30.0
35.0
FY14 FY15 FY16 FY17 FY18 FY19 FY20
Total Exports Exports Growth(PKR bn)
23%
24%
25%
24%24%
27%
21%
22%
23%
24%
25%
26%
27%
600
650
700
750
800
850
FY14 FY15 FY16 FY17 FY18 FY19
Total Towel Exports FML Towel Exports
FML's Towel Export Share
(USD mn)

Pakistan Strategy 2020 87
Feroze1888 Mills Limited
Weaving for Better Future
Exhibit: Relative Performance with KSE-100 Index
Source (s): Bloomberg, PSX , AHL Research
PKR mn 2019A 2020E 2021F
Income Statement
Net Sales 29,244 33,853 35,556
Gross Profit 7,638 9,190 10,061
Operating Profit 6,377 5,004 6,149
Finance Cost 156 265 241
Post Tax Profit 5,990 4,380 5,543
Balance Sheet
Shareholder's Equity 20,103 22,344 25,881
Interest Bearing Liabilities 8,900 9,228 8,119
Total Liabilities 13,864 14,807 13,849
Current Assets 20,304 21,801 23,140
Non-Current Assets 13,663 15,351 16,591
Total Assets 33,967 37,151 39,730
Source (s): Company Financials, AHL Research
Ratio Analysis 2019A 2020E 2021F
Earnings PKR 15.90 11.63 14.71
Dividend PKR 6.35 4.65 6.00
Book value PKR 53.4 59.3 68.7
Price to Earning x 6.3 8.3 6.5
Price to Book x 1.9 1.6 1.4
Gross Margins % 26.1 27.1 28.3
Net Margins % 20.5 12.9 15.6
Source (s): Company Financials, AHL Research
70%
80%
90%
100%
110%
Jan
-19
Fe
b-1
9
Ma
r-1
9
Ap
r-19
Ma
y-1
9
Jun
-19
Jul-
19
Au
g-1
9
Se
p-1
9
Oct-
19
Nov-1
9
Dec-1
9
KSE100 FML

Pakistan Strategy 2020 88
ChemicalsSubstituting Imports, Generating Profits

Pakistan Strategy 2020 89
Exhibit: Historical Currency Performance Exhibit: Volatile PVC and PTA Margins
Source (s): SBP, AHL Research Source (s): Bloomberg, AHL Research
Key Investment Theme
PKR Depreciation to Benefit the Chemical Companies: The margins of PTA (Purified Terephthalic Acid)
and PVC (Polyvinyl chloride) are dollar-based. To recall, currency depreciation over the past year has
improved the chemical companies’ profitability and we believe it would continue to do so in the future.
Sole Producers of their Respective Products: EPCL and LOTCHEM under the AHL chemical universe,
are sole producers of PVC and PTA with an installed capacity of 195K tons and 500K tons per annum,
respectively. The local demand for both products (270K tons and 700K tons, respectively), is higher than
local production, thereby ensuring sales.
Growing Demand: In a country like Pakistan, with a total population of over 200mn, the demand for PVC
and PTA is expected to continue growing. The growth in demand of PVC is driven by higher usage of PVC
in various industries. The local demand of PTA is around 700K tons. However, it touched 800K tons during
2018. We believe the local demand of PTA will grow to 1mn tons as the economy is expected to enter a
growth phase in the next 2-3 years.
Import Substitution: As mentioned earlier, EPCL and LOTCHEM are the only producers of PVC and PTA
in the country and fulfill majority of the country’s demand (EPCL: ~75%, LOTCHEM ~71%). In the current
macroeconomic situation, where the government is undertaking steps to curb unnecessary imports, local
players remain shielded from risk of imports.
Key Risks
Higher than expected increase in gas prices.
Change in import duty structure.
Lower than expected PKR depreciation.
Lower than expected international PTA and PVC margins.
70
90
110
130
150
170
190
210
230
150
200
250
300
350
400
450
500
550
Jan
-17
Ma
r-17
Ma
y-1
7
Jul-1
7
Se
p-1
7
Nov-1
7
Jan
-18
Ma
r-18
Ma
y-1
8
Jul-1
8
Se
p-1
8
Nov-1
8
Jan
-19
Ma
r-19
Ma
y-1
9
Jul-1
9
Se
p-1
9
Nov-1
9
PVC Margins PTA Margins (RHS)
(USD/ton) (USD/ton)
95
105
115
125
135
145
155
165
Jan
-17
Ma
r-17
Ma
y-1
7
Jul-1
7
Se
p-1
7
Nov-1
7
Jan
-18
Ma
r-18
Ma
y-1
8
Jul-1
8
Se
p-1
8
Nov-1
8
Jan
-19
Ma
r-19
Ma
y-1
9
Jul-1
9
Se
p-1
9
Nov-1
9
Average PKR/USD
Chemicals
Substituting Imports, Generating Profits
Mkt Cap (USD mn) KSE-100 Index Weight No. of Companies Free Float (%) Sector Stance
2,107 2.3% 28 19.6% Market Weight

Pakistan Strategy 2020 90
Exhibit: PVC Margins Sensitivity Exhibit: Historical international PVC Margins
Source (s): Company Financials, AHL Research, * International Source (s): Bloomberg, AHL Research
Key Investment Theme
Demand Pushed PVC Expansion and Import Substitution: The local demand of PVC has grown to
~270K tons from ~170K tons in Jun’15. To cater the growing demand, EPCL has announced a capacity
addition of 100K tons/annum of PVC. EPCL is the only producer of PVC in the country and fulfills ~75% of
the country’s total demand. With the government focusing on keeping imports contained, we believe that
EPCL is well poised to benefit from duty protection.
Heading Towards Diversification: EPCL has also announced to enter in the Hydrogen Peroxide (H2O2)
and Linear Alkyl Benzene Sulphonic Acid (LABSA) market with a total production capacity of 20K tons and
24K tons per annum, respectively. The local demand for H2O2 and LABSA is ~72K tons/annum and ~110K
tons/annum, respectively. EPCL has a competitive advantage over existing players of H2O2 as it already
produces Hydrogen gas. As far as LABSA is concerned, EPCL already has a customer base for the product
as it is expected to sell it to the same customers as that of Caustic Soda.
Earnings to Grow at a CAGR of 11.1% (2018-2022): The company posted earnings of PKR 4,917mn
(EPS: PKR 5.41) during CY18 which are expected to grow to PKR 7,499nm (EPS: PKR 8.25) by CY22. The
rise in earnings is backed by i) expansion in PVC and caustic flaker, and ii) new additions of Hydrogen
Peroxide (H2O2) and LABSA.
Higher than Expected PVC Margins: The international PVC margins are hovering around USD 479/ton
compared with an average of USD 336/ton during CY18. The rise in margins was witnessed due to
environmental restriction on manufacturing of carbide based PVC in China. We expect the average
international PVC margins to hover at USD 330/ton in long term.
Key Risks
Lower than expected international PVC margins.
Higher than expected increase in gas prices.
Decline in import duty of PVC (Current: 13.25%, (includes 2.25% additional custom duty).
Lower than expected PKR depreciation.
Unfavorable outcome of GIDC decision.
PVC Margins*
(USD/ton)
EPS (PKR)TP (Dec-20)
CY20F CY21F
Case 1 225 1.61 2.51 19.65
Case 2 250 2.23 3.43 26.52
Case 3 275 2.85 4.35 33.39
Case 4 300 3.49 5.30 40.42
Base Case 330 4.25 6.42 48.80
Case 6 350 4.74 7.17 54.32
Case 7 375 5.38 8.11 61.36
Case 8 400 6.01 9.06 68.39
Case 9 425 6.65 10.00 75.42
Case 10 450 7.28 10.95 82.46
150
200
250
300
350
400
450
500
550
Jan
-17
Ma
r-17
Ma
y-1
7
Jul-1
7
Se
p-1
7
Nov-1
7
Jan
-18
Ma
r-18
Ma
y-1
8
Jul-1
8
Se
p-1
8
Nov-1
8
Jan
-19
Mar-
19
Ma
y-1
9
Jul-1
9
Se
p-1
9
Nov-1
9
PVC Margins Average
(USD/ton)
Engro Polymer & Chemicals Ltd.
Heading Towards Diversification
PSX Code Target Price (Dec’20) Market Price Upside Potential Stance
EPCL 48.80 36.73 32.9% BUY

Pakistan Strategy 2020 91
Engro Polymer & Chemicals Ltd.
Heading Towards Diversification
Exhibit: Relative Performance with KSE-100 Index
Source (s): Bloomberg, PSX , AHL Research
PKR mn 2018A 2019E 2020F
Income Statement
Net Sales 35,272 36,561 35,300
Gross Profit 26,536 28,018 27,287
Operating Profit 8,736 8,543 8,013
Finance Cost 606 1,590 1,527
Post Tax Profit 4,917 3,960 3,859
Balance Sheet
Shareholder's Equity 16,744 20,158 23,108
Current Liabilities 11,337 13,270 14,831
Trade and other Payables 6,435 6,010 5,803
Non-Current Assets 7,890 13,961 17,482
Current Assets 16,331 15,285 20,023
Total Assets 19,639 32,105 35,397
Source (s): Company Financials, AHL Research
Ratio Analysis 2018A 2019E 2020F
Earnings PKR 5.4 4.4 4.2
Dividend PKR 1.1 0.6 1.0
Book value PKR 18.4 22.2 25.4
Price to Earning x 6.9 8.4 8.7
Dividend Yield % 3.0 1.6 2.7
Price to Book x 2.0 1.7 1.4
Gross Margins % 24.8 23.4 22.7
Source (s): Company Financials, AHL Research
50%
62%
74%
86%
98%
110%
Jan
-19
Fe
b-1
9
Ma
r-1
9
Ap
r-19
Ma
y-1
9
Jun
-19
Jul-
19
Au
g-1
9
Se
p-1
9
Oct-
19
Nov-1
9
Dec-1
9
KSE100 EPCL

Pakistan Strategy 2020 92
Exhibit: PTA Margins Sensitivity Exhibit: Polymer Rates to Dictate the PTA Prices
Source (s): Company Financials, AHL Research, *InternationalSource (s): PCI, LOTCHEM Analyst Briefing Presentation, AHL
Research
Key Investment Theme
Growing Local demand of PTA and Import Substitution: Local demand of PTA has reached 800k tons
per annum in 2018 on the back of higher (89%) operating rates of downstream polymer industry. However,
due to economic slowdown and lower operating rates of downstream polymer industry local demand of PTA
has come down to 700K tons during 2019. We project the demand for PTA demand to grow to 1mn ton in
next two to three years. Being the only producer of PTA in the country, LOTCHEM fulfills ~71% of the
country’s total demand. Therefore, the company is expected to continue receiving duty protection going
forward.
Unleveraged Balance Sheet: LOTCHEM has an unleveraged balance sheet and has cash of PKR 13.0bn
(as of Sep’19). As a result, the company has a shield against higher interest rates. Moreover, the liquidity
will help to easily finance the future expected expansion. The company also holds 75 acres of free land for
future expected expansion. However, based on current local demand, expansion is not feasible as minimum
expansion size is 800K tons due to change in technology.
Long-term PTA Margin Assumption at USD 130/ton: The current decline in margins (USD 86/ton) is
triggered by lower operating rates of downstream industry in China is backed by prolonged trade war
between US and China. However, the margins have crossed USD 200/ton during 2019. We expect
operating rates of downstream polyester industry to improve and average margins to settle at USD 130/ton
going forward. Higher expected polyester demand will keep the PTA prices stable.
Key Risks
Lower than expected international PTA margins.
Higher than expected increase in gas prices.
Decline in import duty of PTA (Current: 5%).
Lower than expected PKR depreciation.
Unfavorable outcome of GIDC decision
PTA Margins
(USD/ton)*
EPS (PKR)TP (Dec-20)
CY20F CY21F
Case 1 90 1.12 0.78 10.97
Case 2 100 1.48 1.11 13.57
Case 3 110 1.86 1.50 16.42
Case 4 120 2.21 1.90 19.69
Base Case 130 2.57 2.31 22.96
Case 6 140 2.95 2.73 26.45
Case 7 150 3.30 3.14 29.57
Case 8 160 3.68 3.56 32.56
Case 9 170 4.04 3.86 35.17
Case 10 180 4.39 4.26 38.44
86%
80%79%
75%
78%79%
81%
86%
69%
72%
75%
78%
81%
84%
87%
2012 2013 2014 2015 2016 2017 2018 2019
Lotte Chemical Pakistan Ltd.
Resolution of Trade War to Improve Margins
PSX Code Target Price (Dec’20) Market Price Upside Potential Stance
LOTCHEM 22.96 14.64 56.8% BUY

Pakistan Strategy 2020 93
Exhibit: Relative Performance with KSE-100 Index
Source (s): Bloomberg, PSX , AHL Research
Lotte Chemical Pakistan Ltd.
Resolution of Trade War to Improve Margins
70%
76%
82%
88%
94%
100%
106%
112%
Jan
-19
Fe
b-1
9
Ma
r-1
9
Ap
r-19
Ma
y-1
9
Jun
-19
Jul-
19
Au
g-1
9
Se
p-1
9
Oct-
19
Nov-1
9
Dec-1
9
KSE100 LOTCHEM
PKR mn 2018A 2019E 2020F
Income Statement
Net Sales 57,400 60,470 54,020
Cost of Sales 50,019 52,709 48,985
Gross Profit 7,382 7,761 5,035
Other Income 515 1,208 1,420
Post Tax Profit 4,431 5,389 3,889
Balance Sheet
Shareholder's Equity 12,519 15,637 18,012
Current Liabilities 8,629 7,501 6,723
Trade and other payables 6,683 7,290 6,512
Non-Current Liabilities 125 125 125
Current Assets 15,570 17,639 19,314
Non-Current Assets 5,704 5,624 5,547
Source (s): Company Financials, AHL Research
Ratio Analysis 2018A 2019E 2020F
Earnings PKR 2.9 3.6 2.6
Dividend PKR 1.5 1.5 1.0
Book value PKR 8.3 10.3 11.9
Price to Earning X 6.4 4.1 5.7
Dividend Yield % 8.0 10.2 6.8
Price to Book X 2.3 1.4 1.2
Net Margins % 12.9 12.8 9.3
Source (s): Company Financials, AHL Research

Pakistan Strategy 2020
Sectors
94
EngineeringExcess Capacity Weighing In on Margins

Pakistan Strategy 2020 95
Key Investment Theme
Demand Contraction to Linger On: Economic slowdown led the contraction in the domestic steel sector
during FY19 (LSM data suggests that production of long products shriveled by 25% while flat steel
production declined by 3%; imports of steel also took a hit of 13% YoY, as per PBS). This trend has spilled
over in the ongoing year (production of long steel has undergone a massive drop of 30% YoY in 4MFY20)
and it appears that long steel demand in the full year will remain suppressed. Whereas revival in flat steel
production appears achievable; it has slipped by a minor 1% YoY in 4MFY20 with imports contracting by
41% as local players undertook capacity additions while illegal smuggling, under invoicing and dumping has
been contained.
Shut Down of Gadani to Aid the Formal Steel Sector: The informal ship-breaking at Gadani with a
capacity of 800k tons p.a., until recently catered to the low quality long steel demand (~15% of total). Albeit,
with its shut down, the demand has been split almost equally in the North and South formal market. With
that, we foresee that while overall domestic long steel demand may observe a decline, listed players may
benefit from the diversion of low quality steel to high-graded steel rebars.
Expansionary Cycle Nears Conclusion; New Players Re-evaluate Entry: GDP growth of prior years and
unprecedented demand ensuing from the public and private sectors set in motion an era of expansion in the
local steel space. Whilst most existing manufacturers have undergone expansion, we await entry of new
players in the long steel space albeit, no significant additions may materialize in the current scenario marked
by high interest rates and slowing demand. Meanwhile, flat steel market remains shielded from such
competition amid risk of over capacity and capital intensive nature of the business.
Pricing Power Appears Exhausted: As demand wanes off and new capacities remain under utilized, local
players will scuffle to maintain market share. Hence, resistance may be observed in increasing prices.
Key Risks
Steel margins are sensitive to international volatility in prices of imported scrap and other raw materials.
Materialization of the Naya Pakistan Housing Scheme with estimated potential demand for 250k single story
houses at 1.25mn tons, and dams (Dasu, Karot & Suki Kinari can generate demand of 30k tons per month).
Mkt Cap (USD mn) KSE-100 Index Weight No. of Companies Free Float (%) Sector Stance
528 0.8% 18 33.7% Under Weight
Engineering
Excess Capacity Weighing in on Margins
Exhibit: Steel Production, Imports and Consumptions (Tons)
Source (s): PBS, AHL Research, *Provisional
Period Production Imports Consumption
(Products) Coke Pig Iron Long Products Flat Products Total Scrap Products Total
FY12 192,876 249,135 1,616,403 1,850,997 3,909,411 1,638,980 1,804,586 3,443,566 5,271,986
FY13 203,359 201,489 1,638,501 2,371,708 4,415,057 1,782,866 2,160,471 3,943,337 6,170,680
FY14 31,924 89,433 2,128,300 2,641,245 4,809,902 2,000,735 1,976,321 3,977,056 6,745,866
FY15 275,777 265,478 2,730,992 3,154,376 6,426,623 3,028,057 2,458,108 5,486,165 8,343,476
FY16 57,394 1,509 3,183,258 3,185,200 6,427,361 4,007,102 3,126,714 7,133,816 9,495,172
FY17 - - 4,099,000 3,626,400 7,725,400 4,248,446 3,305,929 7,554,375 11,031,329
FY18 - - 5,186,000 4,255,550 9,441,550 5,246,745 3,732,520 8,979,265 13,174,070
FY19 - - 3,864,036 4,384,000 8,248,036 4,554,650 3,240,791 7,795,441 11,488,827
4MFY20* - - 1,114,000 1,448,320 2,562,320 1,352,054 724,299 2,076,353 3,286,619

Pakistan Strategy 2020 96
Key Investment Theme
Normal Tax Regime Effectively Reduces Prices post FY20 Budget: Under the FY20 Budget, special tax
procedure for domestic re-rollers was replaced with the normal tax regime whereby, a 17% FED on end
product prices was imposed. Consequentially, the company has been booking revenue at effectively lower
prices despite higher quotation in the retail market (rebar prices increased from PKR 98k in 4QFY19 to PKR
110K per ton at present however, revenue post FED has been recognized at PKR 94k per ton). This has
contained the otherwise robust revenue growth expectations of ASTL.
Prices to Remain Contained as ASTL Plays The Hardball in North: With plans to penetrate the market
in North, where prices are ~PKR 4-6,000/ton lower compared to South, ASTL aims to aggressively take up
its market share from 2% to 4-5% (since North forms 80% of the steel rebar market). Albeit, this will keep a
cap on prices as competition is expected to turn fierce.
Tail End of Deceleration Period to Rescue Volumes But Margins To Stay Restrained: With Gadani
going out of business, revival of some housing schemes tagged with increasing focus on construction of
dams as the economy ameliorates from a period of slowdown, we forecast ASTL to achieve a 3-yr
volumetric CAGR of 13% by FY22 to 400,000 tons. Albeit, limited pricing power accompanied with
augmented costs associated with the new plant will keep margins at an average of 12% in the next 5 years
compared to 17% between FY15-FY19.
Sentiments Overplayed: Although ASTL has shown a stunning rally at the index, we believe the
sentiments have been overplayed as the company trades at a FY20 P/E multiple of 66x. At current levels,
we have a SELL stance on the scrip with our Dec’19 target price set at PKR 32.08/share.
Key Risks
Entry of new players may squeeze market share and build pressure on margins.
Volatility in international scrap and other raw material prices.
Smuggling from Iran, which adds pressure on prices, as manufacturers there benefit from provision of
subsidized gas.
Exhibit: Lower Utilization Compared to Previous Years Exhibit: Margins to Average Near 12% Going Forward
Source (s): Company Financials, AHL Research Source (s): Company Financials, AHL Research
Amreli Steels Limited
Valuations More Than Priced-in in the Scrip
PSX Code Target Price (Dec’20) Market Price Upside Potential Stance
ASTL 32.08 38.13 -15.9% SELL
0%
20%
40%
60%
80%
100%
-
100
200
300
400
500
600
FY
14A
FY
15A
FY
16A
FY
17A
FY
18A
FY
19E
FY
20F
FY
21F
Sales Volume Capacity Capacity Utlization (RHS)
(000 Tons)
0%
5%
10%
15%
20%
25%
-
5,000
10,000
15,000
20,000
25,000
30,000
35,000
40,000
FY
14A
FY
15A
FY
16A
FY
17A
FY
18A
FY
19E
FY
20F
FY
21F
Revenue GP Margin(PKR mn)

Pakistan Strategy 2020 97
Exhibit: Relative Performance with KSE-100 Index
Source (s): Bloomberg, PSX , AHL Research
Amreli Steels Limited
Valuations More Than Priced-in in the Scrip
25%
40%
55%
70%
85%
100%
115%
Jan
-19
Fe
b-1
9
Ma
r-1
9
Ap
r-19
Ma
y-1
9
Jun
-19
Jul-
19
Au
g-1
9
Se
p-1
9
Oct-
19
Nov-1
9
Dec-1
9
KSE100 ASTL
PKR mn 2019A 2020E 2021F
Income Statement
Net Sales 28,596 28,749 34,115
Cost of Sales 26,172 25,008 29,888
Gross Profit 2,424 3,741 4,227
Finance Cost 1,262 2,054 1,777
Post Tax Profit 33 173 568
Balance Sheet
Shareholder's Equity 12,244 12,416 12,984
Interest Bearing Liabilities 11,781 12,313 11,533
Current Liabilities 14,475 14,423 14,709
Total Liabilities 17,367 17,173 16,488
Current Assets 12,460 13,163 13,551
Non-Current Assets 17,151 16,427 15,921
Source (s): Company Financials, AHL Research
Ratio Analysis 2019A 2020E 2021F
Earnings PKR 0.1 0.6 1.9
Dividend PKR - - 0.5
Book value PKR 41.2 41.8 43.7
Price to Earning X 223.1 65.6 19.9
Dividend Yield % - - 1.3
Price to Book X 0.6 0.9 0.9
Net Margins % 0.1 0.6 1.7
Source (s): Company Financials, AHL Research

Pakistan Strategy 2020 98
Recommendation SummaryCode
PriceTP (Dec'20) Upside (%) Stance
EPS (PKR) DPS (PKR) P/E (x)^ DY (%)^ P/B (x)^ ROE (%)^
13-Dec-19 2018 2019 2020 2018 2019 2020 2019 2020 2019 2020 2019 2020 2019 2020
Exploration & Production
PPL 130.6 171.9 31.6 Buy 16.8 22.7 24.7 5.50 2.00 3.00 5.8 5.3 1.5 2.3 1.2 1.0 22.9 20.3
OGDC 135.2 194.8 44.1 Buy 18.3 27.5 29.9 10.00 11.00 12.00 4.9 4.5 8.1 8.9 0.9 0.8 20.1 19.4
POL 440.7 489.0 11.0 Buy 40.1 59.4 56.0 42.50 50.00 50.00 7.4 7.9 11.3 11.3 3.3 3.3 47.6 41.6
MARI 1,328.4 1,501.8 13.1 Buy 115.2 182.4 230.5 6.00 6.00 6.25 7.3 5.8 0.5 0.5 2.8 1.9 46.9 39.1
Commercial Banks
UBL 169.1 209.4 23.9 Buy 12.6 16.4 27.5 11.00 11.00 18.00 10.3 6.1 6.5 10.6 1.1 1.1 11.5 18.0
BAFL 46.9 57.9 23.6 Buy 6.2 7.6 8.7 2.50 3.50 4.50 6.2 5.4 7.5 9.6 1.0 0.9 16.6 17.4
MCB 212.7 263.7 23.9 Buy 17.2 18.6 29.8 16.00 16.00 21.00 11.4 7.1 7.5 9.9 1.6 1.5 14.4 21.9
HBL 156.0 197.9 26.8 Buy 8.2 10.3 26.8 4.25 5.00 13.00 15.1 5.8 3.2 8.3 1.1 1.0 7.3 17.5
ABL 100.0 120.7 20.7 Buy 11.4 12.1 13.8 8.00 8.00 8.00 8.2 7.2 8.0 8.0 1.0 1.0 12.7 13.9
NBP 44.6 54.2 21.4 Buy 9.4 11.6 (5.0) - - - 3.8 (8.9) - - 0.4 0.4 11.2 (4.7)
AKBL 19.0 22.3 17.5 Buy 3.5 4.7 5.0 1.00 1.00 1.00 4.1 3.8 5.3 5.3 0.6 0.6 16.4 15.5
BOP 11.9 15.8 32.5 Buy 2.9 3.3 3.8 0.75 - - 3.6 3.2 - - 0.7 0.6 20.7 19.3
Fertilizer
ENGRO 326.7 403.3 23.5 Buy 22.1 33.8 38.6 21.00 25.00 29.00 9.7 8.5 7.7 8.9 1.0 0.9 10.4 11.4
FFBL 22.3 24.4 9.2 Hold 1.5 0.0 1.8 1.00 - 1.00 630.4 12.6 - 4.5 1.5 1.4 0.2 11.6
EFERT 74.5 84.8 13.9 Buy 13.0 11.3 11.4 11.00 12.00 11.50 6.6 6.5 16.1 15.4 2.2 2.2 33.4 34.2
FFC 105.3 130.0 23.5 Buy 11.3 12.4 13.7 8.85 11.00 12.00 8.5 7.7 10.4 11.4 3.8 3.6 46.1 48.0
FATIMA 27.0 NC na na 6.3 na na 1.75 na na na na na na na na na na
AHCL 32.8 NC na na 4.0 0.4 na 2.00 - na na na na na na na na na
Cement
LUCK 424.5 552.7 30.2 Buy 37.7 32.4 20.5 13.00 6.50 5.00 13.1 20.7 1.5 1.2 1.5 1.4 11.6 6.9
FCCL 16.9 17.2 2.1 Hold 2.5 2.0 0.9 2.00 1.50 - 8.2 18.8 8.9 - 1.1 1.1 13.6 5.8
ACPL 100.5 142.6 41.9 Buy 32.0 15.1 12.5 13.00 4.00 4.00 6.4 8.3 7.9 6.5 1.6 1.5 13.4 10.3
DGKC 75.5 66.8 (11.6) Sell 20.2 3.7 (7.3) 4.25 1.00 - 20.6 (10.4) 1.3 - 0.5 0.5 2.2 (4.6)
KOHC 74.4 106.6 43.2 Buy 14.8 12.3 3.8 5.00 2.50 1.00 5.3 6.0 11.5 6.6 1.2 1.1 13.1 3.8
MLCF 23.2 22.5 (2.9) Hold 7.7 4.1 (4.8) 2.50 0.50 - 5.3 6.0 11.5 6.6 1.2 1.1 8.9 (9.5)
POWER 7.0 NC na na 0.3 0.5 na - - na na na na na na na na na
Oil & Gas Marketing
PSO 196.2 262.7 33.9 Buy 32.9 22.5 24.2 15.00 10.00 10.00 8.7 8.1 5.1 5.1 0.8 0.7 9.2 9.2
APL 380.4 433.0 13.8 Buy 56.8 39.8 44.1 40.00 20.00 25.00 9.6 8.6 5.3 6.6 2.0 1.8 21.2 22.1
SNGP 79.0 111.1 40.6 Buy 17.5 16.0 16.4 7.05 7.00 7.00 4.9 4.8 8.9 8.9 2.1 1.7 49.7 49.7
Automobile Assembler
PSMC 255.4 143.7 (43.7) Sell 15.8 (42.6) 2.0 3.16 - - nm 129.3 - - 0.8 0.8 (12.7) 0.6
INDU 1,198.3 1,066.7 (11.0) Sell 200.7 174.5 96.1 140.00 115.00 55.00 6.9 12.5 9.6 4.6 2.4 2.2 35.7 18.1
HCAR 221.0 157.3 (28.8) Sell 45.5 27.0 16.8 26.93 12.15 8.00 8.2 13.1 5.5 3.6 1.8 1.7 22.2 13.2
MTL 676.1 756.5 11.9 Buy 107.1 73.0 58.1 120.00 85.00 50.00 9.3 11.6 12.6 7.4 7.0 6.1 69.4 55.9
Power Generation & Distribution^^
HUBC 90.9 Coverage Restricted due to Advisory Mandate
NCPL 19.5 32.1 74.8 Buy 9.3 9.3 12.6 1.50 2.00 2.00 2.1 1.6 10.3 10.3 0.5 0.4 25.7 28.3
NPL 30.0 37.5 33.1 Buy 9.1 10.6 12.3 1.50 1.50 2.50 2.8 2.5 5.0 8.3 0.6 0.5 21.2 20.8
KAPCO 32.0 46.8 79.1 Buy 12.1 14.9 17.6 9.15 4.50 10.50 2.1 1.8 14.1 32.8 0.7 0.6 34.4 34.9
Textile Composite
NML 108.4 134.8 24.4 Buy 11.7 16.7 11.6 4.75 4.00 5.00 6.5 9.3 3.7 4.6 0.6 0.6 8.2 6.1
NCL 40.4 47.5 17.6 Buy 9.8 13.2 6.7 4.00 4.00 3.00 3.1 6.0 9.9 7.4 0.6 0.6 21.8 10.2
FML 96.0 133.9 39.5 Buy 7.3 15.9 11.6 3.65 6.35 4.65 6.0 8.3 6.6 4.8 1.8 1.6 33.0 20.6
ILP 58.1 67.7 16.6 Buy 4.5 6.0 6.3 5.00 3.00 3.00 9.8 9.3 5.2 5.2 2.8 2.4 38.5 28.3
Chemicals
LOTCHEM 14.6 23.0 56.8 Buy 2.9 3.6 2.6 1.50 1.50 1.00 4.1 5.7 10.2 6.8 1.4 1.2 38.3 23.1
EPCL 36.7 48.8 32.9 Buy 5.4 4.4 4.2 1.10 0.60 1.00 8.4 8.7 1.6 2.7 1.7 1.4 21.5 17.8
Engineering
ASTL 38.1 32.1 (15.9) Sell 5.3 0.1 0.6 2.20 - - 345.0 65.6 - - 0.9 0.9 0.3 1.4
Source: Bloomberg, AHL Research, * Group Company: No estimates are given, **Earning Consolidated Basis, ^ Calculated at a Price of 13-Dec-19, ^^Upside is total return

Pakistan Strategy 2020 99
List of Abbreviation
1H First Half KSE Karachi Stock Exchange
1Q First Quarter LESCO Lahore Electric Supply Company
9M 9 Months LHS Left hand side
ADB Asian Development Bank LNG Liquified Natural Gas
AIDP Auto Industry Development Policy LPS Loss Per Share
ADR Advances Deposit Ratio LSM Large Scale Manufacturing
AHL Arif Habib Limited LTFF Long Term Financing Facility
AML Anti-Money Laundering mn Million
APCMA All Pakistan Cement Manufacturers Association mb/d Million barrels per day
ATA Annual Turned Around ME March End
avg Average MEPCO Multan Electric Power Company
bn Billion mmbtu Metric Million British Thermal Unit
bbl Barrel mmcfd Million Cubic Feet Per Day
bcf Billion Cubic Feet MPC Monetary Policy Committee
BoE Barrels of Oil Equivalent MPS Monetary Policy Statement
BoP Balance of Payment MS Motor Spirit
bpd barrels per day MSCI Morgan Stanley Composite Index
bps Basis Points MTM Mark to Market
CAB Current Account Balance MW Mega Watts
CAD Current Account Deficit NCCPL National Clearing Company of Pakistan Limited
CAGR Compounded Annual Growth Rate NEPRA National Electric Power Regulatory Authority
CAR Capital Adequacy Ratio NFA Net Domestic Assets
CASA Current Account Saving Account NFC National Finance Commission
CEO Chief Executive Officer NHA National Highway Authority
CFT Combating the Financing of Terrorism NII Net Interest Income
CKD Complete Knock Down NIM Net Interest Margins
CM Chief Minister NIR Net International Reserve
CNG Compressed Natural Gas NPL Non Performaning Loans
CNIC Computerized National Identity Card NSS National Saving Scheme
COD Commercial Operations Date NTDC National Transmission & Despatch Company
CPEC China Pakistan Economic Corridor NY New York
CPI Consumer Price Index NYSDFS New York State Department of Financial Services
CPP Capacity Purchase Price OEM Original Equipment Manufacturer
CPPA Central Power Purchase Agency O&M Operations & Maintance
CYTD Calendar year to date OMCs Oil Marketing Companies
CY Calendar Year OPEC Oil Producing and Exporting Countries
DAP Di-ammonium Phosphate OPEX Operating Expense
DISCOS Distribution Companies p.a. Per annum
DCF Discounted Cash Flow PARCO Pak Arab Refinery Ltd
DPS Dividend Per Share PAT Profit After Tax
DR Discount rate PBS Pakistan Bureau of Statistic
DY Dividend Yield PBV Price to Book Value
E&P Exploration & Production PE Price Earning
EBITDA Earning Before Interest, Taxes & Amortization PER Price Earning Ratio
ECC Economic Coordination Committee PESCO Peshawar Electric Supply Company
EFF Extended Fund Facility PIAC Pakistan International Airline Corporation
EIA Energy Information Administration PIB Pakistan Investment Bonds
EM Emerging Markets PKR Pakistan Rupee
EPCC Engineering, procurement, construction & commissioning PM Prime Ministers
EPP Energy Purchase Price POL Petroleum Products Prices
EPS Earrings Per Share PP Petroleum Policy
EU European Union PPA Power Purchase Agreement
EV Enterprise Value PPIS Pakistan Petroleum Information Service
Ex Excluding PR Policy Rate
FATF Financial Action Task Force PSDP Public Sector Development Program
FBR Federal Board of Revenue PSM Pakistan Steel Mills
FIPI Foreign Investor Portfolio Investment PSX Pakistan Stock Exchange
FM Frontier Markets PTI Pakistan Tehreek-e-Insaf
FMCGs Fast Moving Consumer Goods QESCO Quetta Electric Supply Company
FO Furnace Oil QR Quick Response
FRDLA Fiscal Responsibility and Debt Limitation Act RDs Regulatory Duties
FTSE Financial Times Stock Exchange REER Real Effective Exchange Rate
FX Foreign Exchange Reserves RFO Residue Fuel Oil
FYTD Fiscal year to date RGDP Real Gross Domestic Product
FY Fiscal Year RHS Right hand side
GBP Great Britain Pound RIR Real Interest Rate
GDPg GDP growth RLNG Regassified Liquified Natural Gas
GDP Gross Domestic Product ROA Return on Assets
GENCOs Power Generation Companies ROE Return on Equity
GEPCO Gujranwala Electric Power Company RRR Reserve Replacement Ratio
GIDC Gas Infrastructure Development Cess SBP State Bank of Pakistan
GHPL Government Holdings (Pvt) Ltd. SECMC Sindh Engro Coal Mining Company
Gov't Government SME Small Medium Enterprises
GSP Generalised Scheme of Preferences SOE State-Owned Enterprises
GST General Sales Tax SoTP Sum of the parts
HESCO Hyderabad Electric Supply Company SPLY Same period last year
HSD High Speed Diesel TD To Date
IDR Investment Deposit Ratio T&D Transmission & Distribution
IFC International Finance Corporation TPA Tonnes Per Annum
IMF International Monetary Fund UFG Unaccounted for Gas
IPPs Independent Power Producers US United States
JIT Joint Investigation Team USD US Dollar
JPY Japanese Yen WAPDA Water & Power Development Authority
KO Kerosene Oil YTD Year-to-date
KSA Kingdom of Saudi Arabi YoY Year-on-Year

Pakistan Strategy 2020 100
Disclaimer
Analyst Certification: The research analyst(s) is (are) principally responsible for preparation of this report. The views expressed in thisresearch report accurately reflect the personal views of the analyst(s) about the subject security (ies) or sector (or economy), and nopart of the compensation of the research analyst(s) was, is, or will be directly or indirectly related to the specific recommendationsand views expressed by research analyst(s) in this report. In addition, we currently do not have any interest (financial or otherwise) inthe subject security (ies). Furthermore, compensation of the Analyst(s) is not determined nor based on any other service(s) that AHLis offering. Analyst(s) are not subject to the supervision or control of any employee of AHL’s non-research departments, and nopersonal engaged in providing non-research services have any influence or control over the compensatory evaluation of theAnalyst(s).
Equity Research RatingsArif Habib Limited (AHL) uses three rating categories, depending upon return form current market price, with Target period as Dec’20for Target Price. In addition, return excludes all type of taxes. For more details kindly refer the following table;
Rating Description
BUY Upside* of subject security(ies) is more than +10% from last closing of market price(s)
HOLD Upside* of subject security(ies) is between -10% and +10% from last closing of market price(s)
SELL Upside* of subject security(ies) is less than -10% from last closing of market price(s)
Equity Valuation Methodology
AHL Research uses the following valuation technique(s) to arrive at the period end target prices;
Discounted Cash Flow (DCF)
Dividend Discounted Model (DDM)
Sum of the Parts (SoTP)
Justified Price to Book (JPTB)
Reserved Base Valuation (RBV)
Risks
The following risks may potentially impact our valuations of subject security (ies);
Market risk
Interest Rate Risk
Exchange Rate (Currency) Risk
This document has been prepared by Research analysts at Arif Habib Limited (AHL). This document does not constitute an offer orsolicitation for the purchase or sale of any security. This publication is intended only for distribution to the clients of the Companywho are assumed to be reasonably sophisticated investors that understand the risks involved in investing in equity securities. Theinformation contained herein is based upon publicly available data and sources believed to be reliable. While every care was taken toensure accuracy and objectivity, AHL does not represent that it is accurate or complete and it should not be relied on as such. Inparticular, the report takes no account of the investment objectives, financial situation and particular needs of investors. Theinformation given in this document is as of the date of this report and there can be no assurance that future results or events will beconsistent with this information. This information is subject to change without any prior notice. AHL reserves the right to makemodifications and alterations to this statement as may be required from time to time. However, AHL is under no obligation to updateor keep the information current. AHL is committed to providing independent and transparent recommendation to its client andwould be happy to provide any information in response to specific client queries. Past performance is not necessarily a guide tofuture performance. This document is provided for assistance only and is not intended to be and must not alone be taken as the basisfor any investment decision. The user assumes the entire risk of any use made of this information. Each recipient of this documentshould make such investigation as it deems necessary to arrive at an independent evaluation of an investment in the securities ofcompanies referred to in this document (including the merits and risks involved), and should consult his or her own advisors todetermine the merits and risks of such investment. AHL or any of its affiliates shall not be in any way responsible for any loss ordamage that may be arise to any person from any inadvertent error in the information contained in this report.
© 2020 Arif Habib Limited: Corporate Member of the Pakistan Stock Exchanges. No part of this publication may be copied,reproduced, stored or disseminated in any form or by any means without the prior written consent of Arif Habib Limited.Please remove the below footer.
Disclosure required under Research Analyst Regulations, 2015:
In order to avoid any conflict of interest, we hereby disclose that; Arif Habib Limited (AHL) has shareholding in AKBL,
NBP, NCL, BOP.

Pakistan Strategy 2020 101
Contact Details
Shahid Ali Habib Chief Executive Officer [email protected] 92 -21-3240-1930
Research Team
Samiullah Tariq Director Research & Business Development [email protected] 92-21-3246-2742
Tahir Abbas VP- Deputy Head of Research [email protected] 92-21-3246-2589
Rao Aamir Ali AVP- Investment Analyst [email protected] 92-21-3246-2589
Misha Zahid Investment Analyst [email protected] 92-21-3246-1106
Arsalan M. Hanif Investment Analyst [email protected] 92-21-3246-1106
Faizan Kamran Investment Analyst [email protected] 92-21-3246-1106
Muhammad Iqbal Jawaid Investment Analyst [email protected] 92-21-3246-1106
Aziz Jawaid Haidery Manager Database [email protected] 92-21-3246-1106
Mohammad Tabrez Officer Database [email protected] 92-21-3246-1106
Equity Sales Team
Saad Bin Ahmed Head of Sales [email protected] 92-21-3246-0757
Bilal Khan Director – Head of International Sales [email protected] 92-21-3246-5894
Usman Taufiq Ahmed VP- International Sales [email protected] 92-21-3246-8285
M. Yousuf Ahmed SVP- Equity Sales [email protected] 92-21-3242-7050
Syed Farhan Karim VP- Equity Sales [email protected] 92-21-3244-6255
Farhan Mansoori VP- Equity Sales [email protected] 92-21-3242-9644
Afshan Aamir VP- Equity Sales [email protected] 92-21-3244-6256
Furqan Aslam VP- Equity Sales [email protected] 92-21-3240-1932
Adeel Ahmed VP-Head of Online [email protected] 92-21-3246-0045