pakistan j. zool., vol. 36(4), pp. 295-300, 2004. monthly
TRANSCRIPT

Pakistan J. Zool., vol. 36(4), pp. 295-300, 2004.
Monthly Variation in Physico-Chemical Characteristics
and Metal Contents of Indus River at Ghazi Ghat,
Muzaffargarh, Pakistan
MUHAMMAD ALI*, ABDUS SALAM, NADEEM AHMED, BAKHT YAWAR ALI KHAN AND
MUHAMMAD YOUNIS KHOKHAR Zoology Division, Institute of Pure and Applied Biology (MA, AS, NA, BYAK) and Chemistry Department
(MYK), Bahauddin Zakariya University, Multan, Pakistan. 60800.
*Email: [email protected]
Abstract.- The present study was designed to demonstrate the monthly variation in physico-chemical parameters of Indus River at Ghazi Ghat, Muzaffargarh (Pakistan) for a period of ten months from March to December 2001. Water samples were collected on monthly basis and have been analyzed for estimation of water temperature, light penetration, surface tension, density, specific gravity, viscosity, boiling point, turbidity, pH, DO, free CO2, alkalinity, acidity, electric conductivity, carbonates, bicarbonates, total solids, total volatile solids, total dissolved solids, total volatile dissolved solid and metal contents. The significant monthly variations were observed in all parameters under study. These parameters were compared with standard water quality indicators to indicate probable pollution in river water. The overall water quality of the study site remained within the safe limits throughout the study period. The water quality of two banks was also compared which was found similar. Key words: Water quality, water pollution indicators, heavy metal.
INTRODUCTION
Water is crucial in the evolution of all living
organisms and is one of the basic compounds without which life in any form is not possible in this world. Aquatic life requires water as a support system and in the case of animals such as fish, a medium in which it moves and obtain oxygen in dissolved form. Terrestrial life also requires a regular supply of water to maintain its biological processes. It is the most essential and abundantly available substance in nature (Templeton, 1984). Water quality deals with the physical, chemical and biological characteristics in relation to all other hydrological properties. It provides current information on concentration at a given place and time. Statistical characteristics of water quality such as mean and deviation have become important in water resources planning and development. Water quality principles furnish the basis for judging the suitability of water for its designated uses and for improving existing conditions. For optimum development and management of water for the 0030-9923/2004/0004-0295 $ 4.00/0 Copyright 2004 Zoological Society of Pakistan.
beneficial uses, current information is needed which is provided by water quality monitoring programs. The unequal distribution of water on the surface of earth and the fast declining availability of fresh useable water, are the major concerns in terms of water quality and quantity (Leonard, 1971; Rognemd and Fjeld, 2001). The Indus River supports a major bulk of the population living in this part of the world. More than 80 per cent of Pakistan's agricultural wealth and food production is derived from the river Indus which has been called the "life line" of Pakistan (Meadows and Meadows, 1999). Aquatic animals are sensitive to water quality and a high quality water supply is a key ingredient for successful aquaculture. Many different sources of water are used in aquaculture and it is not uncommon for some of these sources to be polluted. Possible contamination in water supplies include suspended solids, organic matter, nutrients, heavy metals, pesticides and industrial chemicals (Boyd and Tucker, 1998). Anthropogenic activities within river basins, erosion, and atmospheric depositions are the main negative impacts on the water quality of most reservoirs (Straskraba, 1978). The main objective of the present study was to analyze the monthly

M. ALI ET AL. 296
variations in the water quality of Indus River at Ghazi Ghat. These parameters were compared with standard water quality indicators to indicate probable pollution in river water. The ancillary purpose of the study was to compare the water quality of two banks because, both human and natural activities taking place at two sides of river Indus are different.
MATERIALS AND METHODS The present study was carried out at the Indus River at Ghazi Ghat, D.G. Khan, approximately, 80 km away from Multan towards west (G.P.S. N 30 03 852; E 070 48 540). The study period prolonged for 10 months starting from March to December 2001. The samples were taken from the subsurface in plastic bottles of 1.5 litre capacity on monthly basis. At the time of sampling the air and water temperatures were recorded by using alcoholic and digital thermometers, light penetration was recorded with the help of Secchi’s disk. Dissolved oxygen was determined by using an oxygen meter (Jenway Model 9071). pH and Electrical conductivity (EC) was determined by using digital pH and conductivity meter (Model WTW-pH 90), while all other parameters were determined by the methods as described by Boyd (1981), APHA (1989) and Boyd and Tucker (1998). Minitab and SPSS were used for all statistical analyses following Zar (1996).
RESULTS The physical and chemical characteristics of river water are given in Table I. The air temperature in November and July was respectively 16 and 38.5°C, while the water temperature was 12.5 and 33°C, respectively. Light penetration ranged from 1 cm (July) to 14.5 cm (March). Turbidity ranged between 0.5 and 2.60 mg/l. The maximum value (2.60 mg/l) was in July. The maximum boiling point was (99°C) in July and minimum in (95.6°C) in March. The overall values of density ranged between 0.9964 and 0.9988 mg/l. The maximum value (0.9988 mg/l) was observed in May and minimum (0.9964 mg/l) in December. Specific gravity fluctuated between 0.99934 to
1.00950. The maximum value was (1.00950) in June and minimum (0.99934) in December. The surface tension ranged between 72.97 to 75.65 dynes/cm. Maximum value (75.65 dynes/cm) was in August and minimum (72.97dynes/cm) was in March. Maximum value of viscosity (1.2919 mNSm2) was in November and minimum (1.0688 mNSm2) in September. The values of pH ranged between 7.89 and 8.96. The maximum value was found in November and minimum in September. Electric conductivity ranged 300-500 mmhos, maximum value was in March and minimum in June. Maximum dissolved oxygen (12.7 mg/l; 12°C) was in November and minimum (7.4 mg/l; 18°C and 23.5°C) in March and April. The maximum CO2 (7.92 mg/l) was observed in April, the minimum value (1.98 mg/l) in August, October and November. Maximum value of alkalinity (110 mg/l) was observed in June and minimum (74 mg/l) in August. The maximum value for acidity (33 mg/l) was observed in July, whereas minimum value (8 mg/l) was in May. The maximum value of carbonates (12 mg/l) was observed in June and were absent during March to May and July to November. Bicarbonates ranged between 74 and 109 mg/l, maximum value was observed in April and minimum in August. Maximum value of total solids (1.42 g/l) was observed in July, and minimum (0.27 g/l) in September. The values of total volatile solids ranged from 0.032 to 0.39 g/l maximum in September and minimum in May The maximum value of Total Dissolved Solids (TDS) (0.38 g/l) was observed in July, the minimum value (0.10 g/l) in May. Total Dissolved Volatile Solids (TDVS) ranged between 0.02 to 0.07 g/l, maximum value in August and minimum in December. Repeated Measure Analysis suggested that there was no significant difference between two sites whereas the monthly differences were highly significant. Therefore the data of the two sites was pooled. ANOVA suggested that the monthly differences were highly significant for water temperature, light penetration, turbidity, density, photoperiod, specific gravity, electrical conductivity (EC), pH, DO (dissolved oxygen), alkalinity, acidity, bicarbonates, total solids, total dissolved solids (P<0.001), whereas light penetration, surface tension, viscosity, CO2, total dissolved volatile

PHYSICOCHEMICAL CHARACTERISTICS AND METAL CONTENT OF INDUS RIVER 297
Table I.- Monthly variation in physical and chemical properties of water of River Indus at Ghazi Ghat, Punjab, Pakistan
during 2001.
Parameters March April May June July Aug Sep Oct Nov Dec
Water Temp (°C) 18.00h
(0.00) 23.50g (0.71)
29.00c (0.00)
27.75e
(0.35) 33.00a
(0.00) 30.00b
(0.00) 28.00d
(0.00) 25.00f
(0.00) 12.00
(0.00) 14.00c (0.00)
Light penetration
(cm) 14.35a
(0.21) 6.00c
(0.00) 3.80d
(0.00) 3.10d
(0.14) 1.00e
(0.00) 1.70e
(0.00) 2.70d
(0.00) 10.10b
(4.38) 8.50c
(0.71) 11.25c (0.37)
Turbidity (mg/l) 600.00g
(141.40) 800.00f (282.80)
800.00f (0.00)
2200.00b (0.00)
2600.00a (0.00)
2000.00c (141.40)
1500.00d (141.00)
1100.00e (0.00)
700.00f (136.00)
500.00g (0.00)
Density (mg/l) 0.9984c
(0.00) 0.9998a (0.00)
0.9988b (0.00)
0.9998a (0.00)
0.9976e (0.00)
0.9972g (0.00)
0.9976e (0.00)
0.9974f (0.0003)
0.9980d (0.00)
0.9964h (0.00)
Photoperiod (Hours)
12.71f (0.0071)
13.70b (0.0066)
13.53d (0.0076)
14.10a (0.0000)
13.56c (0.0000)
13.10e (0.0000)
12.17g (0.0000)
11.24h (0.0000)
10.34I (0.0000)
10.17j (0.0000)
Specific gravity 1.0014c
(0.0001) 1.0010d (0.0001)
1.0018b (0.0000)
1.0010a (0.0000)
1.0006e (0.0000)
1.0002f (0.0000)
1.0006a (0.0000)
1.0002f (0.0000)
1.0010d (0.0000)
0.9993g (0.0001)
Surface tension (d/cm)
72.97d (0.00)
75.24a (0.00)
75.21a (1.043)
74.74b (0.001)
74.50b (0.003)
74.93b (1.614)
75.65a (0.549)
74.54b (0.000)
75.62a (0.548)
73.85c (0.00)
Viscosity (mN-1S-
1/cm2) 1.1501c (0.0243)
1.1084d (0.0561)
1.1530c (0.0057)
1.1379c (0.0073)
1.1583c (0.0512)
1.1477c (0.0373)
1.1195d (0.0021)
1.2413b (0.0716)
1.2809a (0.0073)
1.1297c (0.0003)
Electric Conduc-tivity (mmhos)
495.00b (7.10)
505.00a (7.07)
365.00f (6.99)
305.00h (7.11)
385.00e (6.86)
380.00e (1.01)
360.00g (0.62)
370.00f (0.00)
410.00c (0.33)
400.00d (0.00)
pH 8.36c
(0.021) 8.15d
(0.007) 8.20d
(0.010) 8.40c
(0.021) 8.40a
(0.396) 8.41c
(0.064) 8.07d
(0.248) 8.69b
(0.071) 8.95a
(0.014) 8.07d
(0.085)
Dissolved Oxygen (mg/l)
7.60g (0.283)
7.80g (0.000)
8.40e (0.141)
8.15f (0.212)
8.15f (0.199)
11.90b (0.000)
8.90d (0.566)
9.65c (0.214)
12.7a (0.000)
12.00b (0.005)
CO2 (mg/l) 7.60c
(0.283) 7.80a
(0.000) 8.40b
(0.141) 8.15b
(0.212) 8.15b
(0.199) 11.90c (0.000)
8.90b (0.566)
9.65c (0.214)
12.7c (0.000)
12.00c (0.005)
Alkalinity (mg/l) 97.50c
(0.71) 108.50a (0.69)
85.00d (2.83)
110.00a (0.00)
79.00e (1.41)
78.00e (5.66)
97.00c (4.24)
80.00e (0.00)
78.00e (0.00)
107.00b (4.00)
Acidity (mg/l) 17.50g
(0.68) 10.00i (0.01)
8.00j (0.00)
21.00e (0.22)
33.00a (0.36)
23.00d (0.66)
27.00b (0.24)
17.00h (0.04)
20.50f (0.71)
24.50c (0.69)
Bicarbonates (mg/l)
97.50b (0.70)
108.50a (0.68)
85.00c (2.83)
98.00b (0.00)
79.00d (1.41)
78.00d (5.66)
97.00b (4.24)
80.00d (0.00)
78.00d (0.00)
99.00b (4.00)
TS mg/l 393.70f
(70.20) 1242.10b
(6.50) 1029.30c (53.30)
933.50d (24.30)
1347.80a (105.41)
1305.80a (79.90)
373.50f (114.80)
401.00f (56.10)
593.40e (32.80)
410.80f (55.70)
TVS (mg/l) 48.66d
(23.10) 91.33d (7.54)
93.29b (11.79)
76.66c (15.09)
90.80b (22.90)
71.66c (7.07)
95.33b (66.94)
118.52b (55.83)
107.66b (28.77)
151.94a (21.76)
TDS (mg/l) 125.34d
(2.35) 214.83b (56.33)
120.99d (25.93)
180.00c (1037)
371.66a (12.73)
223.66b (25.93)
173.33c (43.37)
140.66d (24.52)
133.66d (8.01)
156.33c (15.56)
TDVS (mg/l) 0.0215e
(0.0005) 0.0600b (0.0198)
0.0315a (0.0134)
0.0420c (0.0007)
0.0620b (0.0000)
0.0708a (0.0082)
0.0470c (0.0005)
0.0365a (0.0120)
0.0330a (0.0005)
0.0370d (0.0255)
Standard Deviations are given in parenthesis. Letters indicate results of multiple range tests (LSD) procedure. Mean with same letters are not significantly different from each other at 0.05 level
M. ALI ET AL. 298
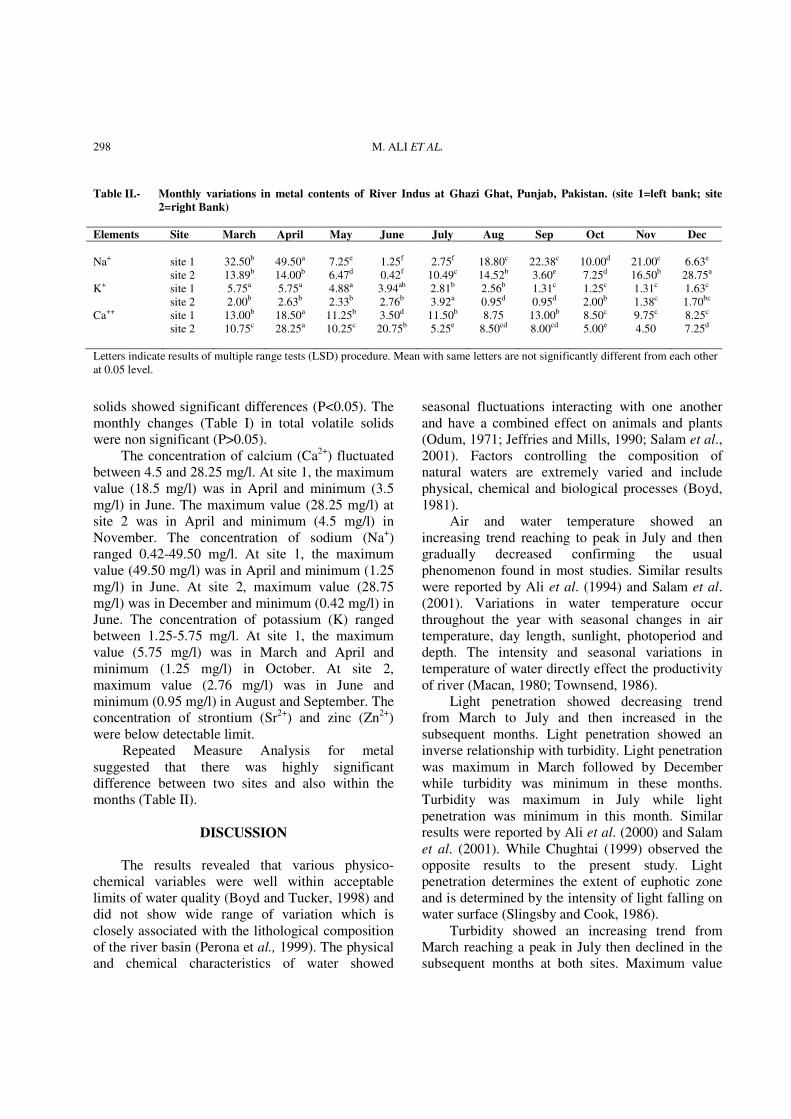
Table II.- Monthly variations in metal contents of River Indus at Ghazi Ghat, Punjab, Pakistan. (site 1=left bank; site
2=right Bank)
Elements Site March April May June July Aug Sep Oct Nov Dec
Na+ site 1 32.50b 49.50a 7.25e 1.25f 2.75f 18.80c 22.38c 10.00d 21.00c 6.63e
site 2 13.89b 14.00b 6.47d 0.42f 10.49c 14.52b 3.60e 7.25d 16.50b 28.75a
K+ site 1 5.75a 5.75a 4.88a 3.94ab 2.81b 2.56b 1.31c 1.25c 1.31c 1.63c
site 2 2.00b 2.63b 2.33b 2.76b 3.92a 0.95d 0.95d 2.00b 1.38c 1.70bc
Ca++ site 1 13.00b 18.50a 11.25b 3.50d 11.50b 8.75 13.00b 8.50c 9.75c 8.25c
site 2 10.75c 28.25a 10.25c 20.75b 5.25e 8.50cd 8.00cd 5.00e 4.50 7.25d
Letters indicate results of multiple range tests (LSD) procedure. Mean with same letters are not significantly different from each other at 0.05 level.
solids showed significant differences (P<0.05). The monthly changes (Table I) in total volatile solids were non significant (P>0.05). The concentration of calcium (Ca2+) fluctuated between 4.5 and 28.25 mg/l. At site 1, the maximum value (18.5 mg/l) was in April and minimum (3.5 mg/l) in June. The maximum value (28.25 mg/l) at site 2 was in April and minimum (4.5 mg/l) in November. The concentration of sodium (Na+) ranged 0.42-49.50 mg/l. At site 1, the maximum value (49.50 mg/l) was in April and minimum (1.25 mg/l) in June. At site 2, maximum value (28.75 mg/l) was in December and minimum (0.42 mg/l) in June. The concentration of potassium (K) ranged between 1.25-5.75 mg/l. At site 1, the maximum value (5.75 mg/l) was in March and April and minimum (1.25 mg/l) in October. At site 2, maximum value (2.76 mg/l) was in June and minimum (0.95 mg/l) in August and September. The concentration of strontium (Sr2+) and zinc (Zn2+) were below detectable limit. Repeated Measure Analysis for metal suggested that there was highly significant difference between two sites and also within the months (Table II).
DISCUSSION
The results revealed that various physico-chemical variables were well within acceptable limits of water quality (Boyd and Tucker, 1998) and did not show wide range of variation which is closely associated with the lithological composition of the river basin (Perona et al., 1999). The physical and chemical characteristics of water showed
seasonal fluctuations interacting with one another and have a combined effect on animals and plants (Odum, 1971; Jeffries and Mills, 1990; Salam et al., 2001). Factors controlling the composition of natural waters are extremely varied and include physical, chemical and biological processes (Boyd, 1981). Air and water temperature showed an increasing trend reaching to peak in July and then gradually decreased confirming the usual phenomenon found in most studies. Similar results were reported by Ali et al. (1994) and Salam et al. (2001). Variations in water temperature occur throughout the year with seasonal changes in air temperature, day length, sunlight, photoperiod and depth. The intensity and seasonal variations in temperature of water directly effect the productivity of river (Macan, 1980; Townsend, 1986). Light penetration showed decreasing trend from March to July and then increased in the subsequent months. Light penetration showed an inverse relationship with turbidity. Light penetration was maximum in March followed by December while turbidity was minimum in these months. Turbidity was maximum in July while light penetration was minimum in this month. Similar results were reported by Ali et al. (2000) and Salam et al. (2001). While Chughtai (1999) observed the opposite results to the present study. Light penetration determines the extent of euphotic zone and is determined by the intensity of light falling on water surface (Slingsby and Cook, 1986). Turbidity showed an increasing trend from March reaching a peak in July then declined in the subsequent months at both sites. Maximum value

PHYSICOCHEMICAL CHARACTERISTICS AND METAL CONTENT OF INDUS RIVER 299
was observed in July showing floods and rain in this month, which bring clay, sand and organic matter from the adjoining areas of river. After the month of July turbidity gradually decreased, turbidity showed inverse relationship with light penetration. Salam et
al. (2001) reported similar results while working on River Chenab. Density of river water showed variation at different sites and at different times. These differences may be due to variations in temperature and salt content of river water (Jeffries and Mills, 1990). There is linear increase in water density with increase in dissolved salts. Specific gravity of water was maximum in May and minimum in December. Specific gravity and density are related to each other (Matthews, 1998). Density was minimum in December, Similarly specific gravity is also minimum in the same month. Same results were reported by Ali et al. (2000) and Salam et al. (2001). Surface tension of water varies with temperature and with the content of dissolved solids (Schwoerbel, 1987). In the present study, it showed relationship with the solids dissolved in water. Surface tension and viscosity are related with each other and showed seasonal changes. Dissolved oxygen showed maximum values in winter season. It may be due to temperature variations. Dissolved oxygen showed inverse relationship with water temperature. In November the water temperature was minimum and dissolved oxygen was maximum. Minimum dissolved oxygen was observed in March. DO has an inverse relationship with photoperiod, when photoperiod was long DO showed low values and when photoperiod was short D.O. showed high values. Ali et al. (1994), Ali et al. (2000) and Salam et al. (2001) reported similar results. In the present study, dissolved oxygen ranged between the suitable limits of tolerance for fish growth. The values of free CO2 showed an inverse relationship with DO during the present study. It is because of the fact that at high temperatures productivity decreases and process of decomposition results in the production of CO2 in the surrounding water. pH values ranged between 7.89 to 8.96, which are well within the acceptable limits of tolerance. Waters with pH values ranging from about 6.5 to
9.0 at day break are most suitable for fish production (Boyd and Tucker, 1998). Alkalinity ranged between 74 to 110 mg/1. Maximum value was observed in June and minimum value in August. Carbonates and bicarbonates are the major components of alkalinity. They have positive correlation with alkalinity and hardness. Calcareous water with alkalinity more than 50 mg/l is most productive. Water with alkalinity less than l0 mg/l rarely produce large crops, water intermediate between 10-50 mg/l may give useful results (Rath, 1993). Maximum value for acidity was observed in July and minimum in May. Acidity is caused by various factors. In natural unpolluted waters, the acidity is mainly contributed by the dissolved CO2. In polluted waters, weak acids like acetic acid may contribute significantly to total acidity. In some industrial wastes, organic acids may also contribute to acidity (Abbasi, 1998). Anaerobic condition in the sediment (basin of the river) is responsible for the biodegradation of organic matter into short chain organic acids like; acetic, propionic, butyric acids etc. Carbonates and bicarbonates showed relationship with each other. TS, TDS, TVS, and TDVS showed a relationship with each other. These also have a direct relationship with temperature. As temperature reached at its peak during summer TS, TDS, TVS and TDVS also showed their peak values, which indicate their direct relationship with the temperature. Maximum total solids were observed in July. Total solids also showed a positive correlation with turbidity in the present study. Total volatile solids and total dissolved volatile solids showed seasonal fluctuations throughout the study period. Same results were reported by Ali et al. (2000) and Salam et al. (2001). All forms of life depend on the availability of adequate amounts of essential metals, however, at higher concentration they become toxic to organisms. Many factors are responsible that influence the concentration at which harmful effects can be expected. Normally, only the free or inorganically bound form of the element is potentially toxic to adequate biota; complexation with organic ligands significantly reduces this concentration and adverse effects. There are other

M. ALI ET AL. 300
factors such as pH and hardness that affect concentration of free metal ions and thus regulate toxicity (Skjekvale, et al., 2001). The mean concentrations of Na+, K+, Ca2+ at both sites was
14.38±12.63, 2.60±2.43, 10.58±16.23 mg/l respectively. Choudhary et al. (1997) also reported the concentration of same elements on five different points including Ghazi Ghat, Indus River, which are higher for Na and lower for K+ and Ca2+ when compared with Choudhary et al. (1997). Sr2+ and Zn2+ were found to be below the detectable limit. The detectable limit of the instrument for Sr2+ was >0.04 mg/l and for Zn2+ was >0.01 mg/l. The seriousness and persistence of heavy metals in water are compounded by the fact that generally they are water soluble, non-degradable, vigorous oxidizing agents and strongly bound to many biochemicals especially polypeptides and proteins (Gurd and Wilcox, 1956). The heavy metals are bioaccumulated in the body of fish and other aquatic plants and animals. The study concluded that there were significant monthly variations in all parameters under study. These parameters when compared with standard water quality indicators to determine probable pollution in river water, the overall water quality of the study site remained within the safe limits throughout the study period. The water quality of two banks was also compared which was similar.
REFERENCES
ABBASI, S.A., 1998. Water quality sampling and analysis. 1st
ed. Discovery Publishing House, New Delhi. ALI, M., SALAM, A. AND HUSSAIN, M.Z., 1994. Effect of
seasonal variations on physico chemical parameters of Zaidi Fish Farm. Punjab Univ. J. Zool., 9: 53-58.
ALI, M., SALAM, A, AZEEM, A. SHAFIQ , M. AND KHAN, B.A., 2000. Studies on the effect of seasonal variations on physical and chemical characteristics of mixed water from Rivers Ravi and Chenab at union site in Pakistan. J. Res.
(Sci.), 11: 11-17. AMERICAN PUBLIC HEALTH ASSOCIATION, 1989.
Standard methods for the examination of water and
wastewater, 17th Ed. Washington, D.C. BOYD, C.E., 1981. Water quality in warm water fish ponds.
Craftmaster Printer, Inc. Opelika, Alabama. BOYD, C.E. AND TUCKER, C.S., 1998. Pond aquaculture
water quality management. Kluwer Academic Publishers, London.
CHAUDHRY,A.A., SALAM, A., ANSARI, T.M. AND TASSADUQ, M., 1997. Studies on the effect of seasonal variations on physico-chemical parameters of Indus River water. Sindh Univ. Res. J. (Sci.), 29: 41-50.
CHUGHTAI, M.I., 1999. Analysis of biodiversity, water quality
and metal contents of mixed (sweage + Chenab water) at
Qasim Bela Multan. M.Sc. thesis. Zoology Deptt. B.Z. University, Multan.
JEFFRIES, M. AND MILLS, D., 1990. Freshwater ecology.
Principles and applications. Belhaven Press, London and New York.
LEONARD, L.C., 1971. Water and water pollution. Vol. 1., Marcel Dekker, Inc., New York.
MACAN, T.T., 1980. Freshwater ecology. 2nd ed. Longman, London.
MATTHEWS, W.J., 1998. Patterns in freshwater fish ecology.
International Thomson Publishing, New York, Tokyo, London, Singapore.
MEADOWS, A. AND MEADOWS, P.S., 1999. The Indus
River. Biodiversity. resources. humankind. 1st ed. Oxford University Press, 5- Banglore Town, Sharae Faisal, Karachi.
ODUM, E.P., 1971. Fundamentals of ecology. 3rd Eds. Toppan Company, Ltd., Japan.
PERONA, E., BONILLA, I. AND MATEO, P., 1999. Spatial and temporal changes in water quality in a Spanish river. Sci. Total Environ., 241: 75-90.
RATH, R., 1993. Freshwater aquaculture. Scientific Publishers, Jodhpur.
ROGNEMD, S. AND FJELD, E., 2001. Trace element concentration of Norwegian lake sediments. Ambio, 30: 11-19.
SALAM, A., ALI, M., KHAN, B.A. AND RIZVI, M.S., 2001. Seasonal changes in the physico-chemical parameters of river Chenab, Muzaffar Garh. Pakistan J. biol. Sci. 4: 299-301.
SCHWOERBEL, J., 1987. Handbook of limnology. Ellis Horwood Limited Publishers, Chichester.
SKJELKVALE, B.L., ANDERSON, T., FJELD, E., MANIO. J., WILANDER, A., JOHANSSON, K., JENSEN, J.P. AND MOISEENKO, T., 2001. Heavy metal survey in Nordic Lakes; Concentrations, geographic patterns and relation to critical limits. Ambio, 30: 2-10.
SLINGSBY, D. AND COOK, C., 1986. Practical ecology. Mac-Millan Education Ltd., London.
STRASKRABA, M., 1978. Problems of eutrophication, its impact, development and models of eutrophication. In: Algal assays, and monitoring entrophication (eds. P. Marvan, S. Pribil and O. Lhotsky), E. Schweitzerbartsche Verlagsbuchbandlung, Stuttgart.
TEMPLETON, R.G., 1984. Freshwater fisheries management. Fishing News Book Limited Farnham. Surrey. England.
TOWNSEND, C.R., 1986. The ecology of streams and rivers. Published by Edward Arnold Pvt. Ltd., Australia.
(Received 19 March 2004, revised 25 August 2004)