pages copy masters sample - shoppe pro web...
TRANSCRIPT

SAMPLE PAGES
I B Chemistry InvestigationsVolume 1 (Standard Level)
COPY MASTERS
(For use with the IB Diploma programme)
(Fourth edition)
Author: John Green
Series editor: David Greig

SAMPLE PAGES
Please note that comprehensive Teaching Notes for each Investigation are available free of charge as pdf files from our website <http://www.ibid.com.au/chemistry>
Table of ContentsInvestigation 1A - DETERMINING THE AMOUNT OF WATER OF CRYSTALLIZATION 1
Investigation 1B – DETERMINING THE COMPOSITION OF ‘COPPER(II) CARBONATE’ BY HEATING 5
Investigation 1C – HOW CONCENTRATED IS ‘CONCENTRATED’ NITRIC ACID? 7
Investigation 1D – DETERMINING THE MOLAR MASS OF A SOLUBLE ACID 10
Investigation 1E – IDENTIFYING FUELS FROM THEIR MOLAR MASSES 13
Investigation 2A – OBSERVING EMISSION SPECTRA 20
Investigation 3A – SOME REACTIONS OF THE HALOGENS 22
Investigation 4A – FORCES BETWEEN PARTICLES AND PHYSICAL PROPERTIES 26
Investigation 5A – MEASURING ENTHALPY CHANGES 31
Investigation 5B - INDIRECTLY DETERMINING AN ENTHALPY CHANGE APPLYING HESS’ LAW 36
Investigation 6A – TECHNIQUES FOR MEASURING REACTION RATES 40
Investigation 6B – FACTORS AFFECTING RATES OF CHEMICAL REACTIONS 49
Investigation 6C – A QUANTITATIVE INVESTIGATION OF REACTION RATES 56
Investigation 7A – AN INTRODUCTION TO EQUILIBRIUM 60
Investigation 7B – FACTORS AFFECTING VAPOUR PRESSURE 62
Investigation 7C – SHIFTING THE POSITION OF AN EQUILIBRIUM 65
Investigation 8A – DETERMINING THE SOLUBILITY OF ETHANEDIOIC (OXALIC) ACID 70
Investigation 8B – THE PERCENTAGE OF NITROGEN IN A FERTILISER 75
Investigation 8C – STRONG AND WEAK ACIDS AND BASES 78
Investigation 9A – COMMON OXIDISING AND REDUCING AGENTS 85
Investigation 9B – BIOCHEMICAL OXYGEN DEMAND (BOD) BY REDOX TITRATION 91
Investigation 9C – AN INTRODUCTION TO ELECTROCHEMISTRY 95
Investigation 10A – INVESTIGATING ORGANIC STRUCTURES USING MODELS 99
Investigation 10B – SOME REACTIONS OF HYDROCARBONS 106
Investigation 10C – REACTIONS OF ALCOHOLS AND HALOGENOALKANES 110
Investigation 11A – ANALYSIS OF ORGANIC SPECTRA 115
Investigation 22A (Option A) – INVESTIGATING CATALYSTS 132
Investigation 23A (Option B) – THE CHROMATOGRAPHIC SEPARATION OF AMINO ACIDS 136
Investigation 24A (Option C) – THE ENTHALPY OF COMBUSTION OF FUELS 138
Investigation 25A (Option D) – THE SYNTHESIS OF ASPIRIN 141

SAMPLE PAGES
The object of this Investigation is to provide practice in calorimetric techniques by measuring the heat evolved or absorbed in both a physical and a chemical change.
In these experiments you will need to calculate the heat gained or lost using the equation:
Heat change = mass × specific heat × temperature change
The heat changes will be those used to heat/cool the water or aqueous solution and to a first approximation you may ignore the heat gained or lost by the polystyrene calorimeter and the other substances present. Another useful approximation is to assume that, like water, dilute aqueous solutions have a density of 1 kg dm-3 and a specific heat capacity of 4.18 kJ dm -3 K-1.
Part A – The heat required for a change of stateMETHOD
1) By mixing hot and cold water in a measuring cylinder, put 100 cm3 of water at about 60°C into a polystyrene cup.
2) Dry about 25 g of ice with a piece of paper towel, weigh them both and record the mass.
3) Rapidly record the temperature of the water, transfer the ice to it, then record the mass of the paper towel and the water it has absorbed.
4) Stir the water-ice mixture and record the temperature of the water as soon as all the ice has just melted.
DATA COLLECTIONMass of ice, paper towel and water = __________ ± ______ g
Mass of paper towel and water = __________ ± ______ g
Initial temperature of water = __________ ± ______ °C
Final temperature of water = __________ ± ______ °C
Volume of water = __________ ± ______ cm3
Relevant qualitative data
DATA ANALYSIS
a) Calculate the heat lost by the warm water.
b) Calculate the heat gained to raise the temperature of the molten ice to the final temperature.
Name ________________________ Date ____________ Teacher ____________________________
31
©ib
id.c
om
.au
20
14
Th
is p
ag
e m
ay
on
ly b
e le
ga
lly u
se
d u
nd
er
th
e c
on
dit
ion
s o
f sa
le
In
te
rn
at
io
na
l
Ba
cc
al
au
re
at
e
Ch
em
is
tr
y
In
ve
st
ig
at
io
ns
f
or
S
ta
nd
ar
d
Le
ve
lInvestigation 5A
MEASURING ENTHALPY CHANGES

SAMPLE PAGES
c) Use these data to calculate the heat required to melt the ice.
d) From this result, calculate the latent heat of fusion of ice in kJ mol-1.
e) Use your values for the precision of the readings to calculate the uncertainy of the latent heat of fusion.
Part B – Determining the enthalpy change for the decomposition of aqueous hydrogen peroxide
METHOD1) Take a polystyrene cup and use a measuring cylinder to put 50 cm3 of 2 mol dm-3 aqueous hydrogen peroxide
into it.
2) Weigh out about 1 g of manganese(IV) oxide into a weighing bottle.
3) Stir and record the temperature of the hydrogen peroxide at half minute intervals for 2 minutes and then add the manganese(IV) oxide.
4) Stir the mixture and record the temperature at half minute intervals until the temperature has been falling for ten consecutive readings.
DATA COLLECTION
Time
/s
Temperature
/°C
Time
/s
Temperature
/°C
Time
/s
Temperature
/°C
0 210 420
30 240 450
60 270 480
90 300 510
120 330 540
150 360 570
180 390 600
32
©ib
id.c
om
.au
20
14
Th
is p
ag
e m
ay
on
ly b
e le
ga
lly u
se
d u
nd
er
th
e c
on
dit
ion
s o
f sa
le
Investigation 5AMEASURING ENTHALPY CHANGES
In
te
rn
at
io
na
l
Ba
cc
al
au
re
at
e
Ch
em
is
tr
y
In
ve
st
ig
at
io
ns
f
or
S
ta
nd
ar
d
Le
ve
l

SAMPLE PAGES
Precision of time measurements ± ______ s
Precision of temperature measurements ± ______ °C
Volume of aqueous hydrogen peroxide = __________ ± ______ cm3
Relevant qualitative data
DATA ANALYSISPlot a graph of temperature against time and draw the best straight line through the initial section and the final cooling section. You may use a spreadsheet or a graph-plotting programme for this, or you may prefer to hand-draw the graph.
a) Use this graph to estimate the rise in temperature that would have occurred if the reaction had been instantaneous and heat had not been lost to the environment. Explain what assumptions you are making in estimating this.
33
©ib
id.c
om
.au
20
14
Th
is p
ag
e m
ay
on
ly b
e le
ga
lly u
se
d u
nd
er
th
e c
on
dit
ion
s o
f sa
le
Investigation 5AMEASURING ENTHALPY CHANGES
In
te
rn
at
io
na
l
Ba
cc
al
au
re
at
e
Ch
em
is
tr
y
In
ve
st
ig
at
io
ns
f
or
S
ta
nd
ar
d
Le
ve
l

SAMPLE PAGES
b) Calculate the heat energy produced by the reaction.
c) From the amount (in mol) of hydrogen peroxide calculate the enthalpy change when 1 mol undergoes decomposition
d) Write a balanced equation for the reaction and calculate ∆H for your equation.
CONCLUSION & EVALUATION
a) Look up the accepted value for the enthalpy of fusion of ice and compare it to the value you have determined, taking into account the uncertainty. What does this imply?
b) The enthalpy of formation of hydrogen peroxide is -187.8 kJ mol-1. Use this value, along with other relevant values from your data booklet, to calculate the expected enthalpy change for the reaction.
c) Use your data booklet to find bond enthalpy values for the bonds that are broken and made during the reaction. Use these data to calculate a second value for the expected enthalpy of reaction.
34
©ib
id.c
om
.au
20
14
Th
is p
ag
e m
ay
on
ly b
e le
ga
lly u
se
d u
nd
er
th
e c
on
dit
ion
s o
f sa
le
Investigation 5AMEASURING ENTHALPY CHANGES
In
te
rn
at
io
na
l
Ba
cc
al
au
re
at
e
Ch
em
is
tr
y
In
ve
st
ig
at
io
ns
f
or
S
ta
nd
ar
d
Le
ve
l

SAMPLE PAGES
d) Which of these values would you expect to be the more accurate? Give your reasons.
e) Using the value you consider to be the more accurate prediction, comment on the accuracy of your result taking into account the uncertainty.
f) What assumptions have been made in these determinations? Are these likely to be able to explain the accuracy of the results obtained?
g) What are the major sources of error in these calorimetry experiments? Is the direction of the systematic errors in keeping with the direction of the deviation of the experimental results?
h) Suggest ways in which the accuracy of either, or both, of the determinations could be significantly improved.
35
©ib
id.c
om
.au
20
14
Th
is p
ag
e m
ay
on
ly b
e le
ga
lly u
se
d u
nd
er
th
e c
on
dit
ion
s o
f sa
le
Investigation 5AMEASURING ENTHALPY CHANGES
In
te
rn
at
io
na
l
Ba
cc
al
au
re
at
e
Ch
em
is
tr
y
In
ve
st
ig
at
io
ns
f
or
S
ta
nd
ar
d
Le
ve
l

SAMPLE PAGES
I B Chemistry InvestigationsVolume 1 (Standard Level)
TEACHING NOTES
(For use with the IB Diploma programme)
(Fourth edition)
Author: John Green
Series editor: David Greig
SAMPLE PAGES
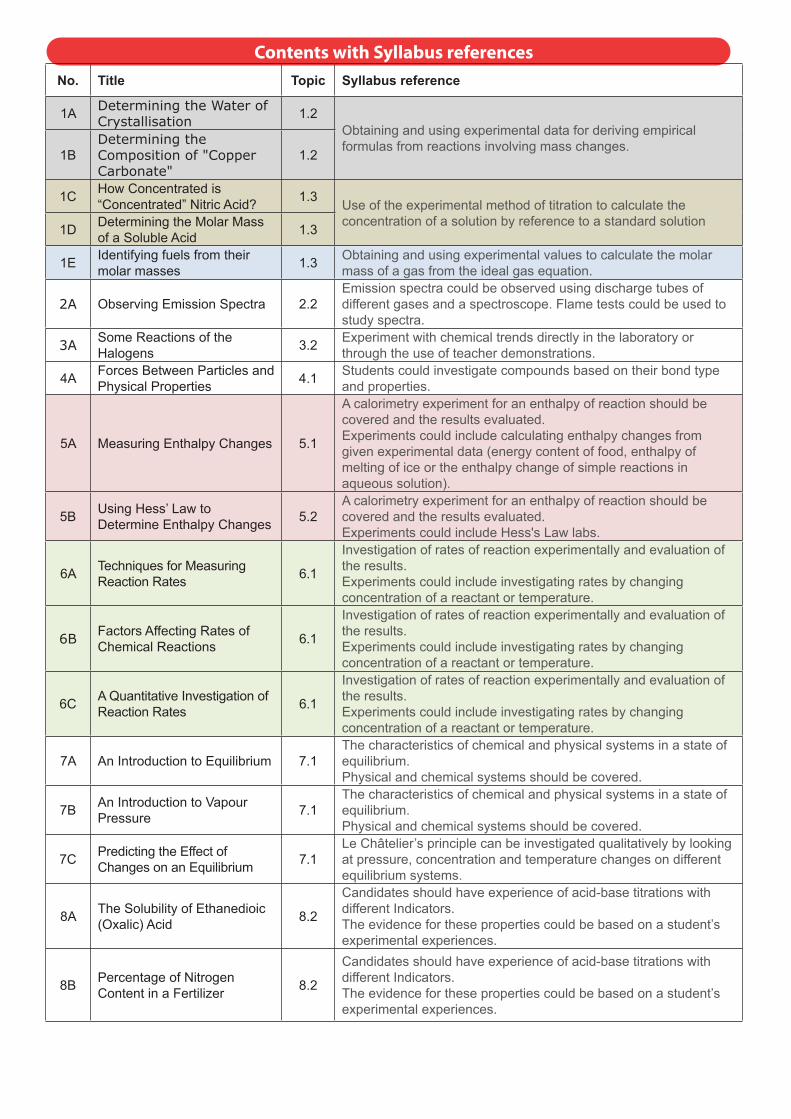
Contents with Syllabus referencesNo. Title Topic Syllabus reference
1A Determining the Water of Crystallisation 1.2
Obtaining and using experimental data for deriving empirical formulas from reactions involving mass changes.
1BDetermining the Composition of "Copper Carbonate"
1.2
1C How Concentrated is “Concentrated” Nitric Acid? 1.3 Use of the experimental method of titration to calculate the
concentration of a solution by reference to a standard solution1D Determining the Molar Mass of a Soluble Acid 1.3
1E Identifying fuels from their molar masses 1.3 Obtaining and using experimental values to calculate the molar
mass of a gas from the ideal gas equation.
2A Observing Emission Spectra 2.2Emission spectra could be observed using discharge tubes of different gases and a spectroscope. Flame tests could be used to study spectra.
3A Some Reactions of the Halogens 3.2 Experiment with chemical trends directly in the laboratory or
through the use of teacher demonstrations.
4A Forces Between Particles and Physical Properties 4.1 Students could investigate compounds based on their bond type
and properties.
5A Measuring Enthalpy Changes 5.1
A calorimetry experiment for an enthalpy of reaction should be covered and the results evaluated.Experiments could include calculating enthalpy changes from given experimental data (energy content of food, enthalpy of melting of ice or the enthalpy change of simple reactions in aqueous solution).
5B Using Hess’ Law to Determine Enthalpy Changes 5.2
A calorimetry experiment for an enthalpy of reaction should be covered and the results evaluated. Experiments could include Hess's Law labs.
6A Techniques for Measuring Reaction Rates 6.1
Investigation of rates of reaction experimentally and evaluation of the results.Experiments could include investigating rates by changing concentration of a reactant or temperature.
6B Factors Affecting Rates of Chemical Reactions 6.1
Investigation of rates of reaction experimentally and evaluation of the results.Experiments could include investigating rates by changing concentration of a reactant or temperature.
6C A Quantitative Investigation of Reaction Rates 6.1
Investigation of rates of reaction experimentally and evaluation of the results.Experiments could include investigating rates by changing concentration of a reactant or temperature.
7A An Introduction to Equilibrium 7.1The characteristics of chemical and physical systems in a state of equilibrium.Physical and chemical systems should be covered.
7B An Introduction to Vapour Pressure 7.1
The characteristics of chemical and physical systems in a state of equilibrium.Physical and chemical systems should be covered.
7C Predicting the Effect of Changes on an Equilibrium 7.1
Le Châtelier’s principle can be investigated qualitatively by looking at pressure, concentration and temperature changes on different equilibrium systems.
8A The Solubility of Ethanedioic (Oxalic) Acid 8.2
Candidates should have experience of acid-base titrations with different Indicators.The evidence for these properties could be based on a student’s experimental experiences.
8B Percentage of Nitrogen Content in a Fertilizer 8.2
Candidates should have experience of acid-base titrations with different Indicators.The evidence for these properties could be based on a student’s experimental experiences.

SAMPLE PAGES
No. Title Topic Syllabus reference
8C A Comparison of Strong and Weak Acids and Bases 8.4
Students should be familiar with the use of a pH meter and universal indicator.Students should have experimental experience of working qualitatively with both strong and weak acids and bases. Examples to include: H2SO4 (aq), HCl (aq), HNO3 (aq), NaOH (aq), NH3 (aq).
9A Common Oxidizing and Reducing Agents 9.1 Experiments could include demonstrating the activity series,
redox titrations and using the Winkler Method to measure BOD.
9B Redox Titrations 9.1 Experiments could include demonstrating the activity series, redox titrations and using the Winkler Method to measure BOD.
9C Investigating some Electrochemical Cells 9.2 Performance of laboratory experiments involving a typical voltaic
cell using two metal/metal-ion half-cells.
10A Investigating Organic Structures using Models 10.1 Construction of 3-D models (real or virtual) of organic molecules.
10B Reactions of Hydrocarbons 10.2 Experiments could include distinguishing between alkanes and alkenes.
10CReactions of Organic Compounds containing Oxygen
10.2 Experiments could include reflux and distillation.
11A Analysis of Organic Spectra 11.3Deduction of information about the structural features of a compound from percentage composition data, MS, 1H NMR or IR.
OPTION TOPICS
22A Investigating the Behaviour of Catalysts A.3
Experiments could include investigating the decomposition of potassium sodium tartrate with cobalt chloride and the decomposition of hydrogen peroxide with manganese (IV) oxide.
23A The Chromatographic Separation of Amino acids B.2 Experiments could involve identification of amino acid mixtures
by paper chromatography.
24A The Enthalpy of Combustion of fuels C.1 The energy density of different fuels could be investigated
experimentally.
25A The Synthesis of Aspirin D.2 Experiments could include the synthesis of aspirin.
Key to Required PracticalsNo. Topic Requirement
1 Topic 1.2 Determination of the molecular formula of a compound from its empirical formula and molar mass.
2 Topic 1.3 Obtaining and using experimental values to calculate the molar mass of a gas from the ideal gas equation.
3 Topic 1.3 Use of the experimental method of titration to calculate the concentration of a solution by reference to a standard solution
4 Topic 5.1 A calorimetry experiment for an enthalpy of reaction should be covered and the results evaluated.
5 Topic 6.1 Investigation of rates of reaction experimentally and evaluation of the results.
6 Topic 9.2 Performance of laboratory experiments involving a typical voltaic cell using two metal/metal-ion half-cells.
7 Topic 10.1 Construction of 3-D models (real or virtual) of organic molecules.
8 Topic 15.1 / Topic 19.1 Perform lab experiments which could include single replacement reactions in aqueous solutions.

SAMPLE PAGES
SYLLAbUS RELEvANCE: TOpIC 5.1A calorimetry experiment for an enthalpy of reaction should be covered and the results evaluated.
Experiments could include calculating enthalpy changes from given experimental data (energy content of food, enthalpy of melting of ice or the enthalpy change of simple reactions in aqueous solution).
Apparatus requiredper group
• Thermometer (0–110oC)
• Stop watch
• 100 cm3 measuring cylinder
• Weighing bottle
• Polystyrene cup
• Electric stirrer
Generally available
• Balance capable of weighing to at least 0.01 g
• Paper towels
• Kettle(s)
Chemicals required• Ice (~25 g per group)
• Aqueous 2 mol dm-3 hydrogen peroxide (~50 cm3 per group)
• Powdered manganese(IV) oxide (manganese dioxide, ~1 g per group)
NotesProbable timing–60 minutes laboratory time
A fairly straightforward thermochemistry practical that gives reasonably good results, though the latent heat generally gives better results than the enthalpy of reaction and there are less embarrassing questions about whether one should take into account the specific heat of manganese(IV) oxide.
Part AMass of ice, filter paper and water = 31.104 ± 0.0005 g
Mass of filter paper and water = 8.135 ± 0.0005 g
Initial temperature of water = 66.8 ± 0.1 oC
Final temperature of water = 37.4 ± 0.1 oC
Volume of water = 100 ± 0.5 cm3
Relevant Qualitative Data
When drying the ice the water absorbed by the towel tends to drip off. Before the ice is added steam is visible rising from the surface of the hot water. When the ice is added to the water the size of the lumps of ice gradually decreases and eventually disappear.
© S
.T.A
.R. 2
01
4 T
his
pa
ge
ma
y o
nly
be
leg
ally
us
ed
un
de
r t
he
co
nd
itio
ns
of s
ale
TN30I
nt
er
na
ti
on
al
B
ac
ca
la
ur
ea
te
C
he
mi
st
ry
I
nv
es
ti
ga
ti
on
s
fo
r
St
an
da
rd
L
ev
el
Teaching Notes for Investigation 5AMEASURING ENTHALpY CHANGES

SAMPLE PAGES
a) Q = m . c . ∆T = 100 x 4.18 x (66.8 – 37.4) = 12289.2 J = 12.29 kJ
b) Q = m . c . ∆T = (31.104 – 8.135) x 4.18 x (37.4 – 0) = 3590.8 J = 3.59 kJ
c) Heat lost by water = Heat required to melt ice + Heat required to heat water after melting
12.29 = x + 3.59
x = 12.29 – 3.59 = 8.70 kJ
d) 22.969 (=31.104 – 8.135) g of ice required 8.70 kJ to melt so 1 mole (18.02 g) would require:
18.028.70 6.8322.969
× = kJ mol
e) Use your values for the precision of the readings to calculate the precision of this value
Quantity value Absolute uncertainty percentage uncertainty
Volume of water 100 0.5 0.500
Decrease in water temperature 29.4 0.2 0.680
Heat lost by water 12.29 0.145 1.180
Mass of ice 22.969 0.001 0.004
Increase in ice temperature 37.4 0.1 0.267
Heat gained by molten ice 3.59 0.010 0.271
Heat required to melt ice 8.70 0.155 1.782
Molar enthalpy of fusion 6.83 0.122 1.786
Molar enthalpy of fusion of water = 6.8 ±0.1 kJ mol-1
Part B
Time
/s
Temperature
/oC
Time
/s
Temperature
/oC
Time
/s
Temperature
/oC0 19.0 210 69.0 420 58.5
30 19.0 240 67.0 450 57.5
60 19.0 270 65.0 480 56.0
90 19.0 300 63.5 510 55.0
120 19.0 330 62.0 540 54.5
150 33.0 360 61.0 570 53.0
180 64.0 390 60.0 600 52.5
Precision of time measurements = ± 1 s
Precision of temperature measurements = ± 0.25 oC
Volume of aqueous hydrogen peroxide = 50 ± 0.5 cm3
© S
.T.A
.R. 2
01
4 T
his
pa
ge
ma
y o
nly
be
leg
ally
us
ed
un
de
r t
he
co
nd
itio
ns
of s
ale
Teaching Notes for Investigation 5AMEASURING ENTHALpY CHANGES
TN31I
nt
er
na
ti
on
al
B
ac
ca
la
ur
ea
te
C
he
mi
st
ry
I
nv
es
ti
ga
ti
on
s
fo
r
St
an
da
rd
L
ev
el

SAMPLE PAGES
Relevant qualitative data
Initial very rapid reaction with evolution of gas and a little splashing out of a few droplets. After about a minute this subsided to leave a colourless liquid with black powder in the bottom and adhering to the sides of the container.
Data Analysis
10
20
30
40
50
60
70
80
0 100 200 300 400 500 600
Tem
pera
ture
/oC
Time /s
a) Rise in temperature if the reaction was instantaneous and the rate of heat loss was the same as in the initial stages of cooling, is shown on the graph above. It gives a value of:
∆T = 74 – 19 = 55 ±1 oC (uncertainty estimated as accuracy of reading graph)
b) Heat to raise water temp = heat produced by reaction
Q = m.c.∆T = 50 × 4.18 × 55 = 11,495 J = 11.495 kJ
Uncertainty in mass = uncertainty in volume = ±1%
Uncertainty in temperature change = 1.8%
Total uncertainty in Q = ±2.8%
c) Amount of H2O2 = n = c.V = 1.0 × 0.050 = 0.050
∆H = 111.495 229.9 0.05
Q kJ moln
−= =
Uncertainty in n = uncertainty in V = ±1%
Total uncertainty in ∆H = 3.8% = ±8.7 kJ
Enthalpy change of reaction:
2 H2O2 (aq) → 2 H2O (l) + O2 (g) = -115 ±9 kJ (negative as reaction is exothermic)
© S
.T.A
.R. 2
01
4 T
his
pa
ge
ma
y o
nly
be
leg
ally
us
ed
un
de
r t
he
co
nd
itio
ns
of s
ale
Teaching Notes for Investigation 5AMEASURING ENTHALpY CHANGES
TN32I
nt
er
na
ti
on
al
B
ac
ca
la
ur
ea
te
C
he
mi
st
ry
I
nv
es
ti
ga
ti
on
s
fo
r
St
an
da
rd
L
ev
el

SAMPLE PAGES
Conclusion & Evaluationa) The accepted value for the enthalpy of fusion of ice is 6.01 kJ mol-1. This value is less than the values determined
(13% lower) and lies well outside the uncertainty of the experimentally determined value, implying that the procedure involves significant systematic errors.
b) ΔH = ΣΔHf (products) – ΣΔHf (reactants) = (2 × 285.5) – (2 × 187.8) = –195.4 kJ mol -1
(Remember ∆Hf of oxygen = 0, like all elements in their standard states)
c) In the reaction, two O-O single bonds are being replaced by a O=O double bond; the O-H bonds remain the same. Hence
∆H = (2 x +144) – (498) = -210 kJ mol-1
d) The value derived from standard enthalpies of formation should be the more accurate, the only source of error being that the reaction carried out involved aqueous hydrogen peroxide rather than the pure compound, so enthalpies of solution were neglected. In the case of the bond enthalpies the value for the O-O bond is an average value of all compounds that contain this bond and it may differ from the precise value in hydrogen peroxide. It also assumes that the bond enthalpies of the O-H bonds remain unchanged and this is probably not correct as the electronegativity of the atom joined on to the second bond of oxygen will affect its electronegativity and hence the strength of the O-H bond. Finally bond enthalpy data is only really valid for reactions taking place in the gas phase and this was in aqueous solution. For all these reasons, the bond enthalpy value is probably less accurate.
e) As may be expected from a thermochemistry determination in simple apparatus, the experimental value for "uppercase delta"H is considerably less than the theoretical one: 115 kJ mol-1 compared to 195 kJ mol-1 (~41% too small). The most probable explanations for this is that the graphical extrapolation of the temperature underestimates the heat lost to the surroundings, because during the period of cooling no hot gas is being evolved, a process that was occurring during the reaction.
f) Like all calorimetric techniques these methods both assume that there is no gain or loss of heat to the surroundings. Heat losses are often significant and could easily explain deviations from literature values of the order of magnitude observed. In addition the hydrogen peroxide involves the loss of gas from the apparatus and this would carry heat away.
This hydrogen peroxide experiment also assumes that the density and specific heat capacity of the aqueous hydrogen peroxide is equal to that of water. In practice the density of the aqueous solution is greater than that of water (~10% higher) and the specific heat capacity of the pure liquid is less (2.62 rather than 4.18 J g-1 K-1) so at least the direction of the errors cancel, but the actual values of these two quantities for the solution used should be determined.
g) If heat was lost to the surroundings the final temperature (37.4oC) would be below the true value so the heat lost by the water (12.29 kJ) would be greater than the true value and the heat gained by the molten ice (3.59 kJ) would be less than the true value. Therefore the heat required to melt the ice, and the enthalpy of fusion, would have been overestimated, as was indeed found.
A second significant source of error in this is that the mass is assumed to be that of ice and no water was transferred to the calorimeter. In practice the ice is always wet, so the true mass of ice is less than the measured mass (22.969 g). This would lead to the value determined for the enthalpy of fusion being smaller than the value determined, which was not what was found, hence it would appear that errors resulting from heat losses are greater than those resulting from the ice being wet.
© S
.T.A
.R. 2
01
4 T
his
pa
ge
ma
y o
nly
be
leg
ally
us
ed
un
de
r t
he
co
nd
itio
ns
of s
ale
Teaching Notes for Investigation 5AMEASURING ENTHALpY CHANGES
TN33I
nt
er
na
ti
on
al
B
ac
ca
la
ur
ea
te
C
he
mi
st
ry
I
nv
es
ti
ga
ti
on
s
fo
r
St
an
da
rd
L
ev
el

SAMPLE PAGES
A third potential source of error is that if the ice has been obtained fresh from the freezer then the centre of the ice will not be at 0oC, but will be at a lower temperature. As a result the heat needed to raise the temperature of the ice to its melting point needs to be added to the equation. This would mean the enthalpy of fusion was greater than the true value as was observed.
h) The loss of heat to the surroundings could be reduced by putting the polystyrene cup inside a second polystyrene cup, so as to provide additional insulation and, perhaps even more importantly, a polystyrene lid with a hole for the thermometer could be fitted to the cup.
The dryness of the ice could be improved by ensuring that there is adequate paper towel to absorb water from the surface and by minimising the surface area of the ice.
Finally to control the starting temperature the ice to be used could be stored in a beaker immersed in an ice-water bath for sufficient time for the ice to be at 0oC.
Inaccuracies associated with the assumptions about the density and specific heat capacity of aqueous hydrogen peroxide could be removed by actually determining these values experimentally.
© S
.T.A
.R. 2
01
4 T
his
pa
ge
ma
y o
nly
be
leg
ally
us
ed
un
de
r t
he
co
nd
itio
ns
of s
ale
Teaching Notes for Investigation 5AMEASURING ENTHALpY CHANGES
TN34I
nt
er
na
ti
on
al
B
ac
ca
la
ur
ea
te
C
he
mi
st
ry
I
nv
es
ti
ga
ti
on
s
fo
r
St
an
da
rd
L
ev
el

SAMPLE PAGES
These are Sample Pages only from the fourth edition of one of the IBID Science Volumes. This Volume is part of a series of full-colour Copy Masters as follows:
SUBJECT VOLUME
BIOLOGY Standard Level Investigations with Teaching Notes
Higher Level Investigations with Teaching Notes
Internal Assessment Handbook
CHEMISTRY Standard Level Investigations with Teaching Notes
Higher Level Investigations with Teaching Notes
Internal Assessment Handbook
PHYSICS Standard Level Investigations with Teaching Notes
Higher Level Investigations with Teaching Notes
Internal Assessment Handbook
These Volumes have been prepared and published specifically to support the teaching of the IB Diploma Sciences. They are for sale as either as paper copies or secure pdf files and may only be used by the purchasing school under the conditions of sale.
More information may be obtained from our website <www.ibid.com.au>