page 5beyondmarket.nirmalbang.com/issue73/download/magazine.pdf · the coalgate scam has dented the...
TRANSCRIPT


It’s simplified...Beyond Market 19th Oct ’12 3
DB Corner – Page 5
A Promising AlternativeNCDs offer high returns with moderate risks while offering investors the flexibility to choose between short and long tenures – Page 6
Easier Said Than DoneA lot needs to be done on the ground level for investors and companies to actually reap the benefits of the recently announced reforms in the airline, retail and insurance sectors – Page 9
Far-reaching ImplicationsThe Coalgate scam has dented the government exchequer and depleted a natural resource, the implication of which will be felt even after it is forgotten – Page 12
The Learning CurveE-learning is gaining popularity in India since it offers mobility and is equally interactive, making it a preferred choice of countless individuals – Page 15
Hanging PrecariouslyOnce regarded as a safe bet, companies from the consumer space too have taken a beating and are looking bleak at the moment – Page 18
Small Size, Big ImpactSmall and mid-sized hotels are benefiting from the shift in demand for premium hotels – Page 21
Seeking Common GroundThere is a need for guidelines on revenue recognition by real estate companies in the absence of a uniform method to compute the same – Page 24
A Proactive InterventionThe SC directive to the government on pharma pricing policy is an initiative in the right direction and is hoped to make drugs affordable to a majority of the Indian population – Page 27
Has Crude Oil Peaked Out For 2012?The recent drop in oil prices is more politically driven than fundamentally - Page 30
CESC Limited: Rise To PowerRegular tariff hikes, improvement in retail operations and commissioning or signing of power purchase agreement of the Chandrapur power project are likely to help CESC Ltd to grow in the coming times - Page 36
Theme Party On The BoursesThematic funds are doing well on the bourses and have given good returns to investors in recent times – Page 40
Muthoot Capital Services Ltd – Page 43
Technical Outlook For The Fortnight – Page 44
Indicators Of ChangeTechnical analysts use indicators to understand, interpret, predict, alert and/or confirm moves in the markets or individual stocks – Page 46
Volume 1 Issue: 73, 19th Oct ’12
Editor-in-Chief & Publisher: Rakesh BhandariEditor: Tushita NigamSenior Sub-Editor: Kiran V Uchil
Art Director: Sachin KambleJunior Designer: Sagar Padwal
Marketing & Operations:Divya Bhurat, Afsana Tamboli
We, at Beyond Market welcome your views, comments and feedback. Do help us to grow better as per your liking. This is our attempt to reach you better while crossing horizons...
Web: www.nirmalbang.com [email protected] No: 022 - 3926 8047
HEAD OFFICE Nirmal Bang Financial Services Pvt LtdSonawala Building, 25 Bank Street, Fort, Mumbai - 400001 Tel. 022-3926 7500/7501
CORPORATE OFFICE B-2, 301/302, Marathon Innova,Off Ganpatrao Kadam Marg,Lower Parel (W), Mumbai - 400 013Tel: 022 - 3926 8000/8001
Research Team: Sunil Jain, Vishal Jajoo, Kunal Shah, Somya Dixit, Dipesh Mehta, Anand Shendge, Manav Chopra, Vikas Salunkhe, Amish Pansuria

It’s simplified...Beyond Market 19th Oct ’124
Oil is considered to be the one of the most important commodities in each and every economy across the globe. Oil has assumed such great importance that no country in the world can survive without it and its byproducts. And a nation that does not have sufficient oil reserves to meet its domestic demand resorts to imports.
A large share of earnings of several economies comes from oil exports alone. Diverse usage, environment-friendliness, lower capital costs and higher efficiency are some of the advantages that oil has over other sources of primary energy.
It is therefore imperative to understand the importance and necessity of oil and our cover story does just that. Oil is one of the many commodities that have fallen in price the fastest despite growing tensions in the Middle East and the tightening sanctions on Iran. Oil prices have also fallen because of increased production of crude oil in the US. Through the cover story, we are trying to ascertain the reasons for the recent fall in oil prices and whether or not oil prices have peaked out. Traders and investors can take heart as our experts have also offered their outlook on this commodity for the near future.
We also have interesting articles like the advantages of investing in non convertible debentures (NCDs), the impact of the recently announced reforms in certain sectors allowing foreign direct investment (FDI) in them, the booming e-learning industry in the country and its future prospects, the surge in demand for small and mid-sized hotels as opposed to premium hotels that are losing their business, the Supreme Court directive on pharmaceutical pricing policy and the different technical tools used by technical analysts to understand as well as predict stock prices and their market movements, that will keep you riveted till the very last page of this edition of the magazinE.
Tushita NigamEditor
SAPPED ENERGY

It’s simplified...Beyond Market 19th Oct ’12 5
Disclaimer It is safe to assume that my clients and I may have an investment interest in the stocks/sectors discussed. Investors are required to take an independent decision before investing. Investment in equity is subject to market risk. Our research should not be considered as an advertisement or advice, professional or otherwise. The investor is requested to take into consideration all the risk factors including their financial condition, suitability to risk return profile and the like and take professional advice before investing.
he government has been on a reform overdrive since the past few weeks. It opened up key sectors
like retail, aviation and insurance by allowing foreign direct investment (FDI), deferred the General Anti Avoidance Regulation (GAAR), announced highway and road contracts under the engineering, procurement and construction (EPC) model as against the earlier model of build, operate and transfer (BOT) among a host of important announcements. All these measures lent support to the markets in the previous fortnight.
The markets were not only propelled by government intervention, they also
T got a boost from the appreciation in the rupee, which reduced the landed prices of a lot of imported materials, especially oil. However, inflation continues to be a major cause of concern since it is high due to the recent hike in petrol and diesel prices announced by the government.
Markets look good on declines. The upside on the index is likely to remain range bound. However, traders and investors can buy stocks at current levels or on declines around the 5,500 – 5,600 levels. Stocks like Cairn India Ltd (LTP: `334.65), Power Finance Corporation Ltd (LTP: `197.30), Rural Electrification Corporation Ltd (LTP: `217.30), Tech Mahindra Ltd (LTP: `944.75), Balrampur Chini
Mills Ltd (LTP: `71.55), Indiabulls Financial Services Ltd (LTP: `221.40) and CCL Products (India) Ltd (LTP: `299) look good from investment and trading perspectives.
In the coming fortnight, market performance is likely to be driven mainly by the quarterly results of India Inc. Also, the street will be eagerly awaiting the upcoming monetary policy review by the Reserve Bank of India (RBI) and see if this time around the apex bank will cut interest rates or noT.
Markets look goodon declines.
Nifty: 5,648Sensex: 18,577.70
(as on 15th Oct ’12)

A PROMISINGALTERNATIVENCDNCDs offer high returns with moderate risks while offering
investors the flexibility to choose between short and long tenures
It’s simplified...Beyond Market 19th Oct ’126

It’s simplified...Beyond Market 19th Oct ’12 7
SIMPLIFYING NCDs
The DNA of an NCD is that of a corporate bond. This means the company raises money from you and you in return earn regular interest as income against your investment.
These NCDs are listed on the stock exchange, which means you are free to trade in it like any other secondary market instrument. As an investor it is your choice to either accumulate more debentures or sell them before their maturity. The price of an NCD will depend mainly on interest rates.
Though it is a debenture, unlike other debentures you cannot convert it into equity at the end of its tenure. There are two types of NCDs that can be on offer. You can have a secured NCD or an unsecured NCD. Secured NCDs, as is evident from the name itself, is an instrument that has underlying assets that can be liquidated to repay holders of this security in case there is a problem.
An unsecured NCD on the other hand is a financial instrument that does not offer any such guarantee. Therefore, if something goes wrong, then the investor will not get back the investment. Understandably, this is a kind of instrument that carries a higher rate of interest.
NCDs may also come with a Put or a Call option. If a callable bond is issued it means that the issuer can exercise the option of redeeming the NCD before the end of its maturity term. This option is usually exercised if the company has issued an NCD when the interest rate was high, but the rate cycle changes eventually.
A put option works in the exact opposite manner. Here, the investor can choose to sell the bond back to the issuer at a stipulated price before the maturity term comes to an end. An
investor can choose to exercise this option if the interest rate rises after the issuance of the NCD.
An NCD may also be of different maturities and come with different options for payout. Some NCDs come with a maturity of three years while others have a maturity of six years or more. The interest payment also varies from three months to six months to an annual payment option. The rate of interest may also vary depending on such issuances.
WHAT TO LOOK OUT FOR
Interest rates may be the biggest incentive that draws an investor towards NCDs. However, as an investor there are certain things he/she needs to watch out for while opting for NCDs.
First and foremost the investor must look at the financial strength of the company. But looking at the profitability of the company is not enough. The investor should also check other factors such as sources of revenue of the company and whether the company has a diverse portfolio or it is majorly dependent on just one source. Since it is mostly NBFCs that are issuing NCDs now, also look out for the asset quality of the NBFC.
The asset quality of the company may be judged from its level of non-performing assets or NPAs. This is particularly relevant in case of gold loan NBFCs or companies that have a high exposure to sectors such as real estate, which is subject to volatility.
The credit quality of the company issuing an NCD may also be judged from the ratings it receives from credit rating agencies such as ICRA, CRISIL or CARE. All NCDs are assigned a rating before they make a debut and you can be assured of the safety or credibility of the company
ith the equity markets in a flux, investors are increasingly flocking towards the
fixed income segment. This is because debt instruments seem to be a safer option in such times.
Making the most of this trend, a number of companies are offering non convertible debentures (NCDs) to mop up funds from the market. NCD is a security that has loans as its underlying assets. It cannot be converted into a stock at the end of its tenure and usually carries a rate of interest that is considerably higher than a convertible debenture.
In the past couple of months, a host of companies (most of which were non-banking financial companies or NBFCs) such as Shriram Transport Finance, Shriram City Union Finance, India Infoline Finance and Religare Finvest have mopped up more than `2,000 crore from investors.
Two more NCDs – one from Muthoot Finance, an NBFC company that doles out gold loans and Kolkata-based Srei Infrastructure Finance are currently open for subscription and plan to raise another `650 crore.
The trend of launching NCDs may continue for quite some time as the equity markets and other asset classes seem to be inconsistent with their returns as of now.
Investors seem to be buying the bait of these companies that are offering high rates of interest in the range of 12% that beats not only equity returns but also that of bank deposits.
But does that mean you too should invest in NCDs? Let us delve into the details to find out whether or not NCDs can be a good investment option for you.
W

It’s simplified...Beyond Market 19th Oct ’128
and even a guarantee of the rate of interest if the NCD has received a high rating from such rating agencies.
But then again, don’t rely on the credit rating alone. It is a good idea to look at the financial statements of the issuer before you make a final decision on your investment.
TAX IMPLICATIONS OF NCDs
The most important thing that influences your investment decision is the tax implication on any instrument. You, therefore, need to keep in mind that the interest you receive as payments from an NCD is not tax-free in your hands.
The total interest that you earn in a year from an NCD is taxed according to the income tax slab you fall into. Therefore, if you are in the higher bracket of income, you will have to bear a cut of 30% on your returns. So, if you are investing in an NCD with a particular goal in mind, make sure that you know about the tax implications of the same.
ARE NCDs THE RIGHT THING FOR YOU?
For those who are in the lower tax bracket and want to earn or are looking for an opportunity to diversify their debt portfolio, NCDs are a good choice. However, financial advisors advise their clients to tread carefully where NCDs are concerned. This is because there are a large number of NBFCs that are making a beeline to raise money from NCDs and their underlying assets have always been a cause of concern in the financial world.
Adequate amount of research needs to be done before choosing an NCD, say experts. And the NCD should not exceed more than 10% to 15% of their overall exposure to debT.

It’s simplified...Beyond Market 19th Oct ’12 9
he ushering of new reforms in different sectors by the government, after a deep
slumber, is a welcome change. Capital-intensive sectors like airlines, retail and insurance had been grappling with low investment for years. But with the government allowing foreign companies to have
T
A lot needs to be done on the ground level for investors and
companies to actually reap the benefits of the recently announced
reforms in the airline, retail and insurance sectors
Implement
EASIER SAIDTHAN DONE
an equity stake in Indian companies from these sectors, there is some hope for them. But would this hope sustain for long? Sectororal experts believe that a lot needs to be done on the ground level for investors and companies to reap appropriate benefits of these reforms. This time we explore the impact of
these reforms in terms of its efficacy given the various challenges faced by these sectors. RETAIL At present the prospects of a foreign company investing in the retail sector is fraught with a lot of challenges. Currently, only nine states have

It’s simplified...Beyond Market 19th Oct ’1210
fund elections of local politicians within their states. Most experts believe that if foreign retail companies come into India, it may impact earnings of small kirana shops, which serve as an election-funding machine for local politicians. Hence, most states, it is perceived, would offer stiff opposition to this reform.
AIRLINES On the other hand, allowing foreign airline companies to buy a minority stake in Indian airline companies may not serve as a game changer for the airline industry as it would not address the systemic and operational challenges of the industry.
One of the biggest operational challenges in India’s strongly cyclical airline industry is the inconsistency in taxes, especially aviation turbine fuel tax, in various states. To begin with Jet Airways and Indigo Airlines would not have any foreign investments as they already have a strong presence of foreign promoters. Owned by Naresh Goyal, Jet has an 80% stake. Kingfisher Airlines, on the other hand, appears to be quite unattractive for a foreign player given its small market share, heavily leveraged balance sheet and resistance from lenders.
It makes sense for an international airline company to start a new airline with a local company instead of investing in a company neck-deep in debts. It has been observed in the past eight years that it is easy for a new carrier to gain 20% market share in five to seven years.
Not only its highly leveraged balance sheet, but also its loss of goodwill makes Kingfisher Airlines unattractive for a foreign partner. Spicejet and GoAir are the likely
contenders to benefit from the 49% FDI approval. Given these realities to start with, foreign carriers can opt for a 20% stake in airline companies.
SpiceJet, whose promoters recently invested `100 crore through the preferential allotment route, can strategically divest its stake to a foreign airline company. For investors, however, the steep rise in the stocks of airline companies offers an attractive exit. The stocks of SpiceJet and Kingfisher Airlines have appreciated more than 25% in the last one week.
Given high aviation turbine fuel prices and low passenger growth in recent months, there is hardly any trigger for these companies to demonstrate good financial performance in the coming quarter. INSURANCE Reforms in the insurance sector were long awaited. It is estimated that the limit for foreign direct investment in insurance is very high not only in BRIC nations but also in most Asian countries such as Japan, Korea, Indonesia and Malaysia.
In India though, FDI was restricted to a mere 26%, which the government recently increased to 49%. For investors and companies, this is a big leap and would provide a strong source of capital for the already loss-making insurance companies.
The implications of reforms can be best understood if one takes into consideration the nature of the industry. Insurance is a capital-intensive business. It is estimated that an insurance company would take 8 to 10 years to become profitable in India.
A company needs to invest heavily in
expressed their support to foreign direct investment in retail. And developing a consensus on the issue would be difficult in the near future. The clauses involved in channelizing investments will make it even less attractive for foreign investors.
For instance, the clause that foreign investors must invest at least 50% of their investment in back-end infrastructure in India seems to be quite a dampener.
Besides, Indian retailers will have to undergo a lot of restructuring and create special purpose vehicles (SPVs) for their businesses in the nine states in which FDI is allowed, which can take a while. Also, assuming that Indian retailers manage to get foreign partners would not ensure that businesses would turnaround. For instance, Walmart, the world’s biggest retail company, has been unsuccessful in other Asian countries such as South Korea, Japan and China.
It has already pulled out of South Korea and Japan. Although it has been in China for more than 12 years, it continues to make losses. Walmart and its peers - Carrefour and Tesco - have been cautious about expanding in China. This is reflected in its sheer market share, which at present stands at 12% in China’s retail sector.
Among Indian retailers, Pantaloon Retail will continue to show good financial performance than its peers - Shoppers Stop and Trent - given its slow growth, high inventory and leveraged balance sheet. A concern that weighs heavy on experts and investors is the perceived tacit involvement of local politicians in opposing the reform. It is perceived that most small retailers - kirana shops, to a very meaningful extent

It’s simplified...Beyond Market 19th Oct ’12 11
distribution, marketing and expansion of an insurance business. Hence, there is a long gestation period to turn profitable. It is estimated that India’s insurance sector needs a capital infusion of $10 billion to $12 billion in the next five years. The reforms are, however, expected to benefit private insurance companies, which had been bleeding since a while due to lack of funds, strict regulations and competition.
By allowing foreign companies to own an equity stake of 49% would provide the right amount of capital for growth. Providing a minority stake to insurers would check their commitment to the Indian markets. Presently, only 5% of the Indian population is believed to invest in insurance, with a large part of the investment coming in from urban areas and to a certain extent from Tier-II cities.
Hence, strong investments would lead to the emergence of best practices and innovative product offerings in the industry. These products can capture a vast section of the untapped population and meet the needs of various classes.
At present, 22 of 24 life insurance companies and 18 of 27 non-life insurance companies have foreign investment. With this reform, a new door would be opened for a plethora of foreign insurers, which have long-recognized the size and potential of India’s insurance industry. These reforms when implemented will offer new investment options to investors. However, a lot needs to be done by the government for the smooth execution of these reforms given the ulterior motives of middle men in the form of corporations and other agentS.
EQUITIES | DERIVATIVES | COMMODITIES* | CURRENCY | MUTUAL FUNDS | IPOs | INSURANCE | DP# # #
QUALAT NIRMAL BANG, YOU’RE MORE THAN
JUST A BUSINESS ASSOCIATE,YOU’RE AN EQUAL PARTNER.
Contact Person: Gaurav Mohta - 07738380299 &Nilesh Sonawane - 07738380027
Address: B-2, 301/302, 3rd Floor, Marathon Innova,
O�. G. K. Marg, Lower Parel (W), Mumbai - 400013.
BSE SEBI REGN No. INB011072759, INF011072759 & INE011072759, NSE SEBI REGN No. INB230939139, INF230939139 & INE230939139 DP SEBI REGN. No NSDL: IN-DP-NSDL-136-2000, CDS(I)l: IN-DP-CDSL-37-99, AMFI REGN. No. arn-49454 NCDEX REGN. NO. 00362, FMC Code-0075, MCX REGN. No. 16590, FMC Code-MCX/TCM/CORP/0490, MCX SX-INE260939139, PMS-INP000002981
Disclaimer: Insurance is a subject matter of solicitation. Mutual Fund investments are subject to market risk. Please read the scheme-related document carefully before investing. Security is subject to market risk. Please read the Do’s and Don’ts prescribed by Commodity Exchange before trading. The PMS Service is not offering for commodity segment. *Through Nirmal Bang Commodities Pvt. Ltd. #Distributors
Registered Office: 38-B, Khatau Building, 2nd Floor, Alkesh Dinesh Mody Marg, Fort, Mumbai - 400 001. Tel: 39268600 / 8601; Fax: 39268610, Corporate Office: B-2, 301/302, 3rd Floor, Marathon Innova, Off Ganpatrao Kadam Marg, Lower Parel (W), Mumbai - 400 013. Tel.: 39268000 / 8001 Fax: 39268010
www.nirmalbang.com
We understand and value the equation of our relationships.
Which is why, we offer our sub-broker/authorized
person/remisier equal independence and status that our
partner merits.
That apart, we provide unparalleled knowledge and
exceptional market analysis to keep you ahead of the curve,
to the advantage of your customers.
After all, at NIRMAL BANG, it’s a relationship beyond broking.

FAR-REACHINGIMPLICATIONS
The Coalgate scam has dented the government exchequer and depleted a
natural resource, the implication of which will be felt even after it is forgotten
It’s simplified...Beyond Market 19th Oct ’1212

It’s simplified...Beyond Market 19th Oct ’12 13
many sectors till date and how its scarcity has impacted the growth of the concerned sectors. The coal sector in India is largely dominated by public sector undertakings. The CRISIL Coal Outlook research suggests that more than 90% of the coal produced in India in fiscal 2009 was produced by government-owned companies. According to a CRISIL Coal Outlook, coal met 52.4% of the total primary energy requirement of India in FY09. The research also suggests that non-coking coal off-take to the power sector was around 77% for power generation. Besides, the planning commission on the other hand highlights the importance of coal as an energy fuel.
In the Integrated Energy Policy 2006, the Planning Commission estimates that coal is projected to meet over 50% of the primary commercial energy requirement by FY32. Experts believe that known coal reserves are expected to last for over 80 years at the 2006 levels of production. However, there is a dire situation as regards availability of coal. More so, the situation also points to the very role coal as a fuel plays in the growth of the economy of a country. One of the reasons is that coal is used as an important input in the production and generation of power, cement and steel, among other things. THE AFFECTED ONES Energy remains a key input for metals and mining companies. For example, power costs account for almost 30% of the total costs incurred by companies while extracting aluminium from bauxite.
Manufacturers of steel, aluminium and allied products have been facing
two challenges pertaining to power supply. First is the availability of power and the second challenge is securing cheap power.
Power costs shoot up further if the miner does not have access to cheap options such as coal. Captive coal mines ensure guaranteed supply of power, which is a scarce input in most parts of India. And more importantly it is a cheap source of power, ensuring higher profitability for miners.
In many cases miners can put up a power generation facility and enter into power purchase agreements with state electricity boards (SEBs). Miners can sell extra power, if any, to state electricity boards. Such revenues enhance profits of the company and in tough times, can support their earnings. The logic naturally is bought by many established players in metals and mining sector along with some new companies in this sector. Bhushan Steel, Hindalco, Jindal Steel and Power, JSW Steel, Tata Steel, Hindustan Zinc, Sterlite Energy, Usha Martin, Monnet Ispat, Jai Balaji Sponge, Electrosteel Castings, Adhunik Metalics and Tata Sponge are some of the companies from the metals and mining sector, which may be impacted adversely. Cement is another sector where the requirement of coal block is very crucial. As energy bill is a major expenditure head for cement manufacturers, they prefer a captive power plant which is run on coal. In case of suspension or cancellation of the coal blocks, Ultratech Cement Ltd, Grasim Industries Ltd, Birla Corporation Ltd, Ambuja Cements Ltd would be affected. As regards the power sector, it must be noted that coal-fired thermal power stations constitute a major
I ndian equity investors were waiting for an influx of measures, policies and directives that would help
revive the country’s coal industry. But what ensued is a lesson in ‘equity investments and policy shocks’.
The Comptroller and Auditor General of India in its report commented that the policy adopted for coal block allocation by the government of India has resulted in windfall gains of ̀ 1.86 trillion for companies that were rewarded 57 coal blocks.
Opposition parties have been demanding the resignation of Prime Minister Manmohan Singh on account of the ‘coalgate’ scam. Meanwhile, beneficiaries of the coal blocks may not enjoy peaceful possession of the coal blocks. The government’s stance on the coal blocks is yet not clear and there is a possibility of a policy U-turn. There are certain possibilities that investors have to take into consideration in this situation if the government gives in to the pressure from the opposition. First, the government may ask for extra royalty or some other way to have an extra share of profit from the beneficiaries. Second, the government may cancel all allocations and go for competitive bidding altogether.
And third, the government may go back to nationalization - handing over all the coal blocks to Coal India. Whichever way it goes, it will have a serious impact on metals and mining as well as the cement and power generation sectors, among other industries in the country. This time we explore how the coal industry in India has evolved in the last 40 years and how coal continues to be scarce and an important fuel for

It’s simplified...Beyond Market 19th Oct ’1214
chunk of power source in India. A number of corporate entities have quoted aggressively for ultra mega power projects.
Low per unit cost of power bid by winners in ultra mega power projects was based on the simple assumption that there will be a captive coal block in some cases. Tata Power, Lanco, CESC and Navabharat are some companies that are likely to be affected by the alleged coal scam.
These companies are seen as the direct victims of the possible cancellation of the coal blocks by the government. However, there are certain businesses that may be impacted, although indirectly, by this scam. Material handling companies may see cancellation of orders placed by these companies.
An important point to note is that no material handling company is dependent on these companies for its very existence. The impact is likely to result in moderate growth estimates.
Some equipment finance deals too may be cancelled, resulting into a minor impact on equipment financing business of banks. Though this is negligible, one cannot ignore it.
THE WAY AHEAD At a time when imported steel from China is giving Indian steel manufacturers sleepless nights, increased energy costs is adding to the woes of these companies. Some of the allocated coal blocks are yet to operate at full capacity due to factors like inability to raise funds to support operations, delayed environmental clearances and geographical locations in naxalite areas.
In the due course, the government may allow companies to continue with their operations where the project has achieved certain minimum operational levels and cancel the rest of the blocks. In such a scenario, it is better to look at each of the blocks individually. This of course will take some time.
Whatever be the case, the cost of energy is expected to go up. This will be inflationary in nature. For most industries, be it manufacturing or services, power is a critical input. In the medium term, this should be detrimental to corporate earnings. The only entity that may benefit from the alleged coal scam is Coal India, that is, if the government chooses to
cancel the coal block allocation and hand over all the blocks to Coal India.
There is a possibility that another public sector undertaking like the National Thermal Power Corporation could also benefit from the reallocation of the coal blocks.
The coal scam will adversely impact the ‘investment-capex’ cycle of Corporate India. The entire issue is a classic example of how a U-turn in policy framework can materially impact the corporate strategy and investors’ returns.
A policy action initiated a decade ago has started playing against all investments undertaken by the stakeholders, including corporations. Hence, it is very important that policies are implemented instead of being framed. Policy changes, affirmative action by the government are welcome.
But policy stability is the need of the hour, feel industry insiders. It is time to think about the next century and not about the next five-year plan. Otherwise more and more such policy irregularities could hit unsuspecting victims in the long ruN.
Contact - Daisee Boga: +91-22-39268244, 7738068289

E-learning
t is astonishing but true. India has the world’s largest population in the age group of 0-24 years. Therefore, it should come as little surprise to anyone that India is also home to one of the top 10 education markets in
the world, valued at around $100 billion.
What’s more, the revenue growth in the sector is one of the fastest in the world with the education spend growing at a median rate of 15% every year since 2000. The education sector is attracting entrepreneurs and investors from all over the world, leading to a massive expansion of private institutes
I
TheLearningCurve
E-learning is gaining
popularity in India since it
offers mobility and is
equally interactive,making it
a preferred choice of
countless individuals
It’s simplified...Beyond Market 19th Oct ’12 15

It’s simplified...Beyond Market 19th Oct ’1216
EDUCOMP SOLUTIONS LTD
Educomp is one of India’s oldest and leading companies in the e-learning segment. The company was started in 1994 and in the beginning it dealt with setting up and maintaining computer labs in schools.
However, in 1998, it took another route and launched eCampus, which was an online student information system. In 1999, it started its first education portal and called it planetvidya.com.
The year 2000 was important for the company as in June that year, US-based investment company Carlyle invested $2.10 million for a 15% equity stake and later on 18th September Educomp became a public limited company.
With the aim of turning an entire classroom into a technology-enabled classroom, it came up with SmartClass, a highly successful multimedia educational product.
After the year 2006, the company expanded its horizon by acquiring a 51% stake in US-based portal learning.com, signing an MoU with Raffles Institute Singapore, acquiring a 51% stake in Takshita Management and entering into a joint venture with Pearson to support vocational learning in India.
CORE EDUCATION & TECHNOLOGIES LTD
Formerly known as Core Projects and Technologies Ltd, Core Education was founded in 2003 as a low-end IT-service provider, which after 12 acquisitions in six years, turned into a high-end education–service provider.
The year 2005 was an important year for Core as it entered the US market with the acquisition of the first US
product company, ECS. Between 2005 and 2008, it acquired 9 companies and businesses with over 100 clients. Currently, the company has business operations in 3 continents and it provides integrated ICT solutions, end-to-end management of government schools and vocational training of government staff. The key alliances of Core Education are the University of Oxford, IGNOU, nationteacher.org and NASA.
EDSERV SOFTSYSTEMS LTD
EdServ was formed in 2001 as a private company known as Lambent Softsystems Pvt Ltd, which in 2008, was re-christened as EdServ Softsystems Ltd. On 5th Feb ’09, Edserve went for an IPO.
During the first two days of the IPO, EdServ received lukewarm response from investors as CARE assigned an IPO Grade 1 to EdServ IPO. However, it got oversubscribed by 1.3 times by the end of the IPO.
Before entering the online education sector, EdServ was focused on IT training and placement solutions. But after the IPO, it acquired many online education companies such as 2tion.com, SchoolMate, SmartLearn WebTV and Sparkling Mind, among others. EdServ now offers coaching for competitive exams, IT courses for graduates and post-graduates, vocational skills training and online ERP training for schools.
EVERONN EDUCATION LTD
Everonn Systems India Ltd, incorporated on 19th Apr ’00 as a public limited company is a pioneer in satellite-based education delivery through the VSAT platform.
In the same year, that is, in 2000 the
in the last 5-6 years. According to estimates, India’s private education industry is expected to grow from $30 billion currently to $45 billion by the end of 2015.
The education sector can be broadly divided into segments like formal education, parallel education and ancillary education.
The formal education sector comprises schools, colleges, universities and professional education. Parallel education is a complementary segment to formal education, comprising private tuition, exam preparation, skill-oriented vocational institutes as well as corporate training.
The formal education system is heavily regularized in India, whereas the parallel education sector is virtually outside the scope of any regulation or supervisory system.
The regulations act as a deterrent to investors in the formal education system, which has led to a rapid growth in the parallel education system primarily through e-learning.
Students prefer this model because it saves time and they can learn at their own pace in the comfort of their homes. E-learning has become so popular that even corporate India is using it to train their employees thanks to the potential and effectiveness of this platform.
The e-learning segment is growing at a fast pace of about 27.9% since the last three years. About 100 new e-learning companies have started in the last three years, taking the total number of e-learning companies in India to over 140.
Following are few of the leading companies in India that provide e-learning products.

It’s simplified...Beyond Market 19th Oct ’12 17
company was awarded a contract for computer education of 332 government schools in Tamil Nadu by the state government of Tamil Nadu. Later, in 2002 it partnered with HughesNet Global Communications Ltd to bring management courses from premier business schools.
Everonn is also the first company to provide education through mobile phones in the country. In 2011, it sold a 12% stake to Dubai-based Varkey group (GEMS education) through preferential allotment.
Currently, Everonn offers education from pre-school to professionals in over 1,400 schools, 1,900 colleges and 50 retail centers. It has also entered into a JV with the union government’s Nation Skill Development Corporation (NSDC) with a target to train 15 million people in various technical streams over the next 10 years.
TATA INTERACTIVE SYSTEMS
A part of the $83 billion Tata Group, Tata Interactive Systems (TIS) was founded in the year 1990 and became the first company in the country to develop a Computer-based Training (CBT) product.
Since its formation, it has won several awards and certificates worldwide, notably, gold at British Interactive Multimedia Awards (1997), SEI CMM Level 5 certification (2001), SEI P-CMM Level 5 certification (2003) and also Brandon Hall Excellence in Learning, APEX, BETT, BIMA, and Business World -NID Design Excellence awards. It is the only e-learning organization in the world to receive level 5 from both SEI CMM and SEI P-CMM.
As of now TIS offers multimedia educational products, consulting services, electronic performance
support systems and training outsourcing services for corporates, schools, universities and government institutions worldwide by creating about 3,000 hours of e-learning content annually.
CAREER POINT LTD
A well known name in the area of competitive exams in north India, Career Point is also using internet technology for expansion. In the year 2008, the company test launched its e-learning system known as TechEdge class. Using the VSAT technology, these e-learning classes are conducted in schools as well as centers where it is not economically feasible for the company to set up full-fledged classrooms.
There are several reasons for the boom in the e-learning market. Cost effectiveness is the primary reason. The investment required for this model is very low and comes at very high margins (as high as 80%). The companies face fewer barriers while entering into the online market.
Earlier, low penetration of broadband was one of the major drawbacks for the e-learning model. However, after the initiatives undertaken by the government of India, the penetration has increased and a large number of students can now access the Internet.
According to the status report on broadband by the Department of Telecom (DoT), 62 gram panchayats will be connected with fibre optics by 15th Oct ’12.
After the completion, various activities including e-learning, tele-medicine and skill development will be tested and based on the outcome, the process of laying of optical cables across the country will start. The government is investing `20,000 crore in the project which
will connect 160 million Indian households with high speed internet as compared to the current figure of 10.3 million homes.
The government has also launched two schemes – National Mission on Education through Information and Communication Technology (NMEICT) And National Program on Technology Enhanced Learning – to promote learning through videos and web-based courses.
Many organisations such as Centrum Learning as well as Tata Interactive Services are being set up using the public-private partnership model.
Moreover, with the changing face of technology, companies are moving towards delivering educational products through platforms in the 3G environment using devices such as tablets and mobiles.
For mobiles, Ericsson is developing a learning platform where the course material for IGNOU can be downloaded. Educomp has formed a joint venture with US-based Zeebo to develop an education platform for school children where they can access course material via 3G network.
The government of India in an effort under NMEICT has formed an alliance with HCL Technologies to launch a tablet called Sakshat. The tablet is said to be the world’s most inexpensive tablet and is aimed to help connect 25,000 colleges and 400 universities across the country as part of the scheme.
It has been a long journey for e-learning companies. But considering the demand for education and the initiatives taken by the government to expand the coverage of e-learning, the future of the e-learning industry in India only looks bright from herE.

HangingPrecariouslyOnce regarded as a safe bet, companies from the consumer space too have taken a beating and are looking bleak at the moment
It’s simplified...Beyond Market 19th Oct ’1218

It’s simplified...Beyond Market 19th Oct ’12 19
CHANGE IN GUARD
Earlier investors and fund managers used to accumulate defensive names and stocks from the consumer space instead of high beta stocks or stocks which were considered risky, as many believed the former would continue to do well owing to structurally sustainable demand and relatively better balance sheets despite economic concerns.
Also, the valuations of stocks from the consumer space touched historical highs as many of them began trading at 35 to 50 times their earnings.
At such a time (almost two months back), most high beta and cyclical stocks were trading at single digit price to earnings multiples owing to economic concerns.
However, this trend is changing for consumer stocks now as not only demand side issues but also valuations in a number of cases have started reversing the positive view of this sector.
As against consumer stocks, cyclical stocks are more depressed at present. A number of cyclical stocks are trading much below their historical low valuations.
And if there are cuts in interest rates and a revival is witnessed in capex, then cyclical stocks will be the first to get rerated and start moving compared to consumer stocks.
In fact, we have already seen rerating of cyclical stocks on the back of reforms announced by the UPA government recently.
In this context, consumer stocks face the risk of diversion or shifting of trades in favour of high beta and cyclical stocks, leading to price erosion of the stock.
Cyclical stocks or companies from sectors like metals and construction, among others, are largely influenced by the ups and downs in a country’s economy. On the contrary, the consumer space is considered relatively stable.
Moderation in the industrial sector also leads to a slowdown in the consumer space. Moreover, the impact of the slowdown could be huge if the slowdown in the industrial space occurs along with a decline in the agricultural sector.
In fact, economists are now expecting a negative GDP growth in the agricultural sector. In the current context, both industrial as well as agricultural growth have come down in India.
Add to this, the exports market is quite weak at present, which in totality is hurting consumer sentiments and their incomes, especially since costs have increased but incomes have remained the same, in an inflationary environment.
Jobs are few and employers are leaving no stone unturned to cut corners by slashing jobs as well as salaries. This situation could have been salvaged if there was no delay in monsoons and the resultant deficiencies were met on time. Not to be left behind, the rural population is also feeling the pinch, increasing the slowdown in the consumer space.
SHORT-TERM PAIN
According to the official data released recently, the April-June GDP or gross domestic product grew 5.5%. But this figure is not desirable given the fact that India has witnessed growth in excess to 7% to 8% in the past.
Unlike manufacturing data, the slowdown in the services sector was
he domestic economic slowdown which was largely restricted to capex and investment-led sectors
like power, infrastructure as well as other heavy engineering sectors, is now seen impacting the consumer space too.
Certain indicators from both the discretionary and non-discretionary spending sides signal a moderation in consumer demand.
Volume growth for companies from the consumer space, particularly those involving discretionary spending on products from the lifestyle, jewellery and fast food segment has also come down drastically.
The fall can be gauged from the decline in footfalls at listed companies from the retail sector. According to the first quarter results of FY12, same-store sales for Jubilant FoodWorks Ltd grew at 22.3% as against 36.7% last year.
Similar was the case with Pantaloon Retails as it recorded a 4.7% growth in same-store sales in the lifestyle segment as compared to 11.4% growth a year ago.
Even watch and jewellery maker Titan reported a 21% decline. Shoppers Stop reported a 1% growth as compared to a 7% growth in the corresponding period last year.
Apart from the retail sector, even the services sector as well as the automobile sector, particularly the two-wheeler segment saw a drastic fall in sales.
All these things clearly indicate a slowdown in the consumer space, which used to be regarded as a safe spot by investors and money managers while dealing with volatility in the markets.
T

It’s simplified...Beyond Market 19th Oct ’1220
surprisingly higher at 6.9%, the slowest pace since Q4 FY09, reflecting the slowdown in growth in the private sector, exports as well as the IT sector. Leading rating agency CRISIL in a media release said, “Given the weak global economic environment and deficient monsoons, GDP growth is expected to remain subdued over the remaining quarters of this fiscal as well. We, therefore, expect GDP to grow at 5.5% during FY13.”
It also added that swift policy action to solve issues related to mining, land acquisition and speedy clearance of projects can create an upside to the growth projection.
Policy action by the government, conducive global economic environment and benign interest rates are the three important initiatives that everybody is seeking as these could propel economic recovery. However, there is not much clarity or action on these fronts.
Due to policy inaction and inordinate delays, demand slowdown, particularly in the consumer space, which had begun moderating, could intensify in the coming months. This will certainly have a bearing on the discretionary and non-discretionary spending in the consumer space.
For instance, in fiscal year 2011, two-wheeler and four-wheeler sales grew 25.8% and 29%, respectively. However, the same is expected to witness a single digit growth in the current financial year.
Importantly, the magnitude of the slowdown is only visible in the month of June and August ’12, which means that the financial impact on the companies from this sector will only be visible with a lag effect in the coming quarters.
LONG-TERM GAIN
If a nation’s economy is going through a difficult phase, then it is bound to impact demand, which will subsequently put pressure on companies in the near term.
While this may require investor attention in the near term, they should not vitiate their views about the long-term opportunities in the consumer space. The slowdown in the economy notwithstanding, India’s long-term economic fundamentals look strong.
India has the ability and the potential to grow higher in the long run given the structure of the economy as well as its demography.
This is also the reason why investor and money managers are keen on being optimistic about the consumer space, even as consumption takes a back seat in the near term due to high valuations and demand issues.
The reasons for the same are aplenty. First is the demography of the country. India accounts for about 16% of the world’s population but hardly contributes to the GDP.
Its vast consumer base, untapped markets and structural changes like level of education, infrastructure, urbanization, working population, communication as well as rising income levels, among others, could have a glaring impact on demand in the long run.
The impact of these drivers has already been felt in the last few years. The per capita income in India has risen from around $450 in the year 2000 to about $1,200 per person currently. This is almost a three-fold increase in the per capita incomes of people in the country.
Not only this, even huge investments undertaken by the Indian government as well as the private sector had quite a major impact on demand across most sectors.
Companies involved in the business of jewellery, FMCG, footwear, food, clothing and several others, from this space have benefitted immensely. However, if estimates and future potential in the consumer space is to be believed this could just be the beginning for them.
THE SLEEPING GIANT
According to consulting firm McKinsey & Co, India’s middle class population, which was around 50 million in 2005, is likely to move up by almost 12 times or nearly 583 million by the end of 2025.
Also, the number of people in the annual income category of `10 lakh will jump four-fold to about `18 million by 2020 from the present count of 4.4 million.
Further, the company projects that with the rise in income, about 290 million people will move from poverty to the higher income group.
The per capita income in the country is expected to move up from the current $1,200 per person to $3,200 -$3,500 per person by the end of the year 2020.
The rise in income levels, coupled with shift of mass consumers into high income categories will mean more opportunities for companies in the consumer space.
There will be more demand for discretionary and non-discretionary products fuelled by increase in education levels, urbanization, working class as well as a humungous young populatioN.

SMALL SIZE,BIG IMPACT
he global economic slowdown had a cascading impact on a number of sectors. And the hospitality industry was no
exception. However, the premium hotel segment has had to bear the maximum brunt of the financial meltdown.
Decline in occupancy rates and room rates shrank their operating margins and pushed costs, adding pressure on the already burdened segment.
Premium hotels derive a substantial part of their revenue from foreign tourist arrivals. But their numbers have dwindled due to the slowdown in the US and Europe.
In the last five calendar years beginning 2007, foreign tourists’ arrivals grew at a Compound
TSmall and
mid-sized
hotels are
benefiting
from the shift
in demand for
premium hotels
It’s simplified...Beyond Market 19th Oct ’12 21

It’s simplified...Beyond Market 19th Oct ’1222
levels by providing luxury services at affordable rates. This was not the case in FY09 as the occupancy rate at mid-sized hotels was 50%. However, businesses gained momentum and occupancy rates grew to 65% to 70% later on.
Increased occupancy rates also boosted cash flows from operations of small and mid-sized hotels. Bhagwati Banquets & Hotels is one such example. Its cash flow from operations grew at a CAGR of 79% to `26.78 crore as of FY11, in the past four fiscals.
While the cash flow from operations of a large and premium hotel like Hotel Leela Ventures was 22% in the last four fiscals. Also, EIH and Indian Hotels could not match up to the growth of mid-sized hotels.
HARD LUCK
In addition to this, small and mid-sized hotels saw better growth since most international operations of large-sized hotels are either making losses or are in the break-even stage. Indian Hotels has five hotels spread across the US, UK and Australia.
The company’s subsidiaries, which include its international hotels business, showed a net loss of `245 crore in FY11 as against a loss of `265 crore in FY10. This has pulled down their performance in the last few years and they continue to make losses even now.
Also, EIH, which has hotels in the Middle East, Egypt and Indonesia, made losses due to the crisis in the Middle East.
Mid-sized hotels, on the other hand, continue to depend on domestic travellers who are increasingly spending and vacationing. Take for instance Oriental Hotels. Its revenues
grew at a CAGR of around 30% in the past four fiscals when most large-sized and premium hotels are witnessing a single-digit growth in their revenues.
BUSINESS OPPORTUNITY
Sensing business opportunity, most international hotel companies have entered into joint ventures with small and mid-sized hotels in recent years. The Intercontinental Hotel Group, for instance, has signed a joint venture with Duet Hotels, a mid-sized hotel to launch the Holiday Inn brand.
Also, international hospitality chain Starwood Hotels & Resorts plans to open 15 hotels and has spelt out its keen focus on tapping the mid-market segment to expand.
Back home, on the domestic front, even the segment leader Indian Hotels has allotted 48% of its hotels inventory in the mid-market and the budget hotels segment for the next 2 to 3 years.
GOING FORWARD
It is estimated that the operating profit margins of premium hotels would be under pressure in the next two fiscals given the strong pipeline of rooms and reduced foreign tourist arrivals.
In the last five years, the operating profit margins of premium hotel companies like Indian Hotels, EIH and Hotel Leela Ventures have almost halved. The operating profit margin of Indian Hotels declined from 34% in FY08 to close to 17.9% in FY12. Going forward, however, there would be an excess supply of rooms in 14 key cities in India, which would put pressure on the operating profit margins of premium hotel companies.
According to research firm CRISIL,
Annual Growth Rate (CAGR) of 4.12% as against a CAGR of 13.2% in the preceding five years, ending 2007. This led to a huge decline in occupancy rates at premium hotels. The occupancy rate at The Indian Hotels Company dropped to 66% at the end of the December ’11 quarter from 73% in FY08.
Owing to the global economic slowdown, coupled with inflation and high interest rates, stocks of premium hotel companies like Indian Hotels, EIH and Hotel Leela Ventures as well as travel companies like Cox & Kings India and Thomas Cook India are trading at a huge discount to their five year prices. Further, it is estimated that the operating profit margins of premium hotels are likely to touch a 10-year-low in the next two years.
LOSE SOME, WIN SOME
Someone’s loss can become someone else’s gain. Thus, small and mid-sized hotels have gained tremendously when premium hotels are struggling to make profits.
The small and mid-sized hotels have been able to post encouraging financials owing to their keen focus on domestic tourism, low operational costs as well as expansion in unexplored territories.
Small and mid-sized hotels like Bhagwati Banquets & Hotels, Royal Orchid Hotels, Oriental Hotels and Asian Hotels (West) have performed considerably better than their bigger counterparts on the back of growth parameters such as cash flow from operations, increased net profits, net sales and better occupancy rates in times of economic slowdown.
The fall in foreign tourists’ arrivals has been favourable for small and mid-sized hotels who earned better revenues from increased occupancy

It’s simplified...Beyond Market 19th Oct ’12 23
the operating profit margins of premium hotel companies (4-and-5-star, listed and unlisted) in 12 cities would be just over 16% in the next two fiscals – the lowest in the last 10 years.
There would be an oversupply in the industry. Property consultancy firm Cushman and Wakefield feels that around 66,371 rooms are likely to be added to the present inventory of 1,12,818 rooms.
The estimate suggests that 14,800 rooms would be added in top six cities in 2012 alone. Of these, 2,000 rooms
have already entered the markets. This oversupply is a big concern when juxtaposed with the falling occupancy rates and average room rates of premium hotels companies.
At present, average occupancy rates of these companies are in the range of 55% to 60% from 63% in FY10, while average room rates have come down by 9% in the same period. This fall in average room and occupancy rates would further decline revenue per available room (RevPAR) of these hotel companies.
CRISIL foresees a decline in the
average RevPAR for premium hotels to `3,900 per day in FY14 from `5,000 per day in FY12. The RevPAR of hotels in Ahmedabad and Chennai, which have oversupply of rooms, is expected to decline by 20%.
While in Bengaluru, Hyderabad, NCR, Jaipur and Kochi, the RevPAR is expected to fall by 15%.
For listed entities though, one favourable factor that assuages concerns related to high interest outgo is their low debt to equity ratio. The debt to equity is less than 1 for both EIH and Indian HotelS.


It’s simplified...Beyond Market 19th Oct ’12 25
investing in the real estate company.
Suppose a project gets completed by the June quarter of a fiscal year, investors can expect the September quarter as one of the strongest ones in that fiscal.
A project is considered complete when apart from the main cost of construction, its other expenses and external risks are relatively less. This method works for projects, which are small and of short duration. It gives an idea to investors to time their investments accordingly.
Apart from this, investors should take into account the location of the project that has been completed. A project that has completed construction does not ensure immediate booking and buying. In this method, though, the pattern and timing of recognizing revenues are quite irregular. As and when a project is completed, the company recognizes revenues and, hence, this can be a tad unpredictable for investors to time their investments.
PERCENTAGE COMPLETION METHOD
In a percentage completion method, real estate companies recognize revenues at the stage a project is completed. This indicates that companies recognize revenues in parts and not as a whole.
So, as and when a particular stage of development of a project is completed, a real estate company would recognize revenues in its profit and loss statement.
Experts believe that this method works well when it is reasonably possible to estimate the stages of the project or estimate the costs and revenues of the project.
Here investors must bear in mind that in this method the costs involved in a project can blow up disproportionately and hamper the continuation of the project.
More so, a project may land in legal issues from different considerations, equipment unavailability and many other glitches that obstruct the progress of a project. Hence, investors should be wary of such possible glitches in a project.
Moreover, the method also involves certain anomalies, which real estate experts claim could possibly mislead investors when it comes to investing. It has been observed that a large number of listed real estate companies project the percentage completion method, while a large section of unlisted companies follow the project completion method. This strategy is employed by many a listed real estate company as well due to certain tax considerations.
THE ANOMALIES
Although by definition, the two methods seem simple, there are lots of anomalies in the way these methods are used in recognizing revenues. For instance, it has been observed that most real estate companies set a minimum benchmark for recognizing of revenues and costs as regards percentage completion method.
Hence, these companies don’t recognize their revenues in the profit and loss statement till they achieve the benchmark. This benchmark sometimes varies in the range of 20% to 35%.
So, there may be a situation where a real estate company following percentage completion method would recognize revenues when 20% of the project is completed, while some
T he real estate sector unlike other sectors has a seemingly strong connection with its buyers.
Being in the business of tangible assets, many consumers can gauge the performance of a real estate company by merely visiting its site or by finding out more about the quality of construction.
Many consumers hold this opinion and are convinced about the fact that such assumptions are fair and unerring. And these consumers then begin buying into the stock of real estate companies.
However, analyzing a real estate company is not that simple in reality. There are various ways by which real estate companies recognize and report their revenues.
Hence, it is important to understand the basic facts associated with various revenue recognition methods followed by real estate companies before investing in the companies.
This time we explain the nitty-gritties of the two main revenue recognition methods of real estate companies: Project Completion and Percentage Completion. We will also delve into the aspects that work best for investors when it comes to investing in real estate companies.
PROJECT COMPLETION METHOD
Project Completion Method means that a real estate company would recognize its revenues from a project only after completing the project.
If a project remains incomplete, the real estate company would not account for its revenues in its profit and loss account statement. This keeps out any kind of doubt in the mind of an investor when it comes to

It’s simplified...Beyond Market 19th Oct ’1226
would recognize revenues when 35% of the project is completed. So, there is no standard as to how much one must recognize as revenues when it comes to the percentage completion method of computation.
A concern that many experts raise is the mere definition of the percentage completion method. Some real estate firms consider the cost of land, development rights and borrowing costs as costs that they have to bear while following the percentage completion method.
On the other hand, there are certain companies which consider the actual cost of construction as total costs.
In addition to this, there are companies which account for costs related to projects in the profit and loss account, while there are companies which recognize them as the project’s costs. There are also companies which consider borrowing costs as part of the project’s costs and charge them in the profit and loss account of the company.
Experts have also found that some companies consider the sale of undivided interest in land as part of the complete contract and apply percentage completion method in recognizing revenues, while others
consider the undivided interest as a separate part and recognize the sale upfront even though the construction of an apartment may take a long time.
Also, in certain cases companies fail to meet their commitments to customers. These companies use terms to signify income that is not generated through the customers.
Typically termed as “unbilled receivables”, various companies employ the percentage completion method and increase their sales in their profit and loss account. And in doing so they also do not care about the completion of their projects.
According to PropEquity, a property research firm, it is estimated that nearly half of the 9,30,000 residential units under construction in India, which are due for delivery between 2011 and 2013, are likely to be delayed by up to 18 months.
IN A NUTSHELL
In order to keep such practices under check, sector experts stress the role of a regulator. There have been talks that the regulator Institute of Chartered Accountants of India (ICAI) plans to deal with such discrepancies in the sector swiftly. Consensus suggests three means to
regulate accounting practices.
The first means is to observe the accounting standards that companies are expected to follow. Second, is the guidance note. Normally, companies are required to implement their guidance note though companies can deviate, provided they furnish acceptable reasons. The third relates to securing an explanation of frequently asked questions, where different situations are projected.
It is strongly believed that these differences can be weeded out of the sector if the Indian real estate sector adopts the International Financial Reporting Standards (IFRS), the global accounting norms that all nations adhere to avoid any anomaly. The IFRS strictly accepts revenue recognition in real estate only when the project is completed. Hence, it is very important that ICAI meaningfully intervenes in these matters. Unless ICAI brings a cogent argument to these practices, any analysis by investors and analysts would be irrelevant and hollow.
Investors seeking exposure to such real estate companies are advised to invest in companies that follow the project completion method for recognising revenueS.
Micro analysis. Mega gains.Trading at Nirmal Bang is based on extensive research and in-depth analysis, where we focus on the smallest of details and turn them into an advantage for you.
Over the years, the analytical approach coupled with decades of experience has helped us maximize returns for our investors and thereby inspire con�dence in them.
EQUITIES* | DERIVATIVES* | COMMODITIES | CURRENCY* | MUTUAL FUNDS^ | IPOs^ | INSURANCE^ | DP* www.nirmalbang.com
REGD. OFFICE: Sonawala Building, 25 Bank Street, Fort, Mumbai - 400 001. Tel: 022 - 39267500 / 7501; Fax: 022 - 39267510 CORPORATE OFFICE: B-2, 301/302, Marathon Innova, O� Ganpatrao Kadam Marg, Lower Parel (W), Mumbai - 400 013. Tel: 022 - 39268000 / 8001; Fax: 022 - 39268010BSE SEBI REGN No. INB011072759, INF011072759 & INE011072759, NSE SEBI REGN No. INB230939139, INF230939139 & INE230939139 DP SEBI REGN. No NSDL: IN-DP-NSDL-136-2000, CDS(I)l: IN-DP-CDSL-37-99, AMFI REGN. No. arn-49454 NCDEX REGN. NO. 00362, FMC Code-0075, MCX REGN. No. 16590, FMC Code-MCX/TCM/CORP/0490, MCX SX-INE260939139, PMS-INP000002981
Disclaimer: Insurance is a subject matter of solicitation. Mutual Fund investments are subject to market risk. Please read the scheme related document carefully before investing. Please read the Do’s and Don’ts prescribed by Commodity Exchange before trading. The PMS Service is not o�ering for commodity segment. *Through Nirmal Bang Securities Pvt. Ltd. ^Distributors #Prepared by Research Analyst of Nirmal Bang Commodities Pvt. Ltd.
SMS ‘BANG’ to 54646 | Contact at: 022-3926 9404 | e-mail: [email protected]

It’s simplified...Beyond Market 19th Oct ’12 27
APROACTIVE
INTERVENTIONThe SC directive to the government on
pharma pricing policy is an initiative in
the right direction and is hoped to make
drugs affordable to a majority of the
Indian population

It’s simplified...Beyond Market 19th Oct ’1228
market and benefit the patient fraternity and the industry at large.
Since the prices of medicines in the bulk market and the cost of manufacturing formulations are widely known, there is no difficulty in fixing prices based on a cost-based formula. Currently, as per the 1995 Drug Price Control Order, the post manufacturing expense (MAPE) allowed is 100% and includes profit for the company.
The Jan Swasthya Abhiyan, the Indian circle of the People’s Health Movement, a worldwide movement to establish health and equitable development as top priorities through comprehensive primary health care and action on the social determinants of health, demands that the government pay heed to the Supreme Court directive and control the prices of all 348 essential drugs by continuing to use the cost plus formula of price fixation.
Essential drugs have a total sale of around `29,000 crore, accounting for almost 60% of the domestic market. Before recommendation, only 74 bulk drugs and their formulations were under the control of the government.
However, the panel has finalized the market-based Weighted Average Prices (WAP) for those companies enjoying more than 1% market share. It includes 348 drugs but has excluded combination drugs.
According to industry sources, the initial assessment was a sales impact in excess of `20 billion when the market share in excess of 5% was being used.
The total value of the compound would be 100% and the weighted average price of products in excess of 1% market share would be taken as the maximum retail price. Hence,
companies which are in the premium pricing band would be impacted the most from this.
MNCs in particular, with a pure domestic play like GSK Pharma and Sanofi India, would be impacted the most, with contraction in EBITDA margins for the business as a whole.
Indian companies not having very huge exposure to the domestic play would be insulated to some extent, but what we would be seeing is contraction in EBITDA margins for the domestic segment as a whole, thus impacting their profitability.
Companies such as Dr Reddy’s (DRL), Sun Pharma, Lupin, Ranbaxy Labs and Cipla would be lesser impacted due to their presence in the exports space. The impact of the new policy may be nearly the same as was the impact under the NPPP.
MNCs like GSK Pharma will be adversely impacted along with Indian pharma players like Ranbaxy, Cipla as well as Cadila.
While the actual impact on these companies will be known only when further details on the policy are available, industry watchers believe that these three companies will be relatively more impacted as compared to others given their significant exposure to the anti-infective segment. None of the companies have confirmed the impact depicted and, hence, more clarity from the management of these companies is keenly awaited.
AIOCD President JS Shinde believes that market-based pricing would balance patient as well as industry interests, while preventing formulations going off the market on account of unviable manufacturing environment – as it happened during the cost-based pricing regime.
T he Group of Ministers (GoM), headed by Union Agriculture Minister Sharad Pawar along with
Minister of State for Chemicals and Fertilizers Srikant Jena and other members of the group including Health Minister Ghulam Nabi Azad, Minister for HRD, Communications and IT Kapil Sibal, Law Minister Salman Khurshid and Planning Commission Deputy Chairman Montek Singh Ahluwalia, recently gave its approval to the final pharmaceutical pricing policy, bringing 348 essential drugs under the government’s price control regime.
The GoM will be sending its recommendations to the cabinet in the next 10-15 days, said senior government officials.
However, given the fact that medicines are often outside the reach of the common man, India’s Apex Court responded by saying that the government will not disturb the retail price mechanism of essential drugs under the price control order, while increasing the list of important medicines under the National List of Essential Drugs (NLED).
The new pharma pricing policy had been pending since the year 2009. Hence, the Supreme Court gave an ultimatum to the government and asked it to take a decision on the policy, failing which it will pass an interim order.
Further, the All India Organization of Chemists and Druggists (AIOCD) wrote a letter to Sharad Pawar, Chairman, Group of Ministers – National Pharmaceutical Pricing Policy, to urgently finalize the new drug pricing policy, which seeks to determine the prices at which pharma companies sell essential medicines in the retail market. This is hoped to dispel the prevalent uncertainty in the

It’s simplified...Beyond Market 19th Oct ’12 29
It is been observed that consumers are benefited because the NLEM list has been increased from the current 74 to 348 drugs (includes approximately 750 formulations), which will reduce prices of these drugs by up to 20%.
The grey area here is that specific drugs for specific strengths are only included in the current NLEM list. Hence, it would be interesting to see how the industry looks at bypassing this regulation. On the whole, this can be seen as a win-win situation for all.
The mechanism for market-based pricing should be seen against this background. Reports indicate that the government is set to introduce the concept of WAP as the method for fixing the ceiling price of drugs.
In such a system, the present prices of existing brands and their respective share in the entire market of a particular drug will be taken into account to compute the ceiling price. Such a method is entirely skewed as
the ceiling price fixed would largely reflect the price of the brand leaders.
Generally 2 to 3 top selling brands - usually the most expensive or some of the more expensive brands - control a bulk of the market.
Therefore, price control will do nothing to bring down drug prices, and will in fact encourage cheaper brands to start charging more and approach the high ceiling price.
This situation has risen because medicine prices in India have no relation to the actual cost of production, packaging and marketing.
A study commissioned by the National Commission on Macroeconomics and Health showed that there is a very wide variation in the prices of drugs sold in the retail market and those sold in bulk through tenders to institutions. The price differences range from around 100% to 5600%.
There is also a wide variance in prices of the same medicine sold under different brands by different pharmaceutical companies
Moreover, the more expensive brands sell much more than the less expensive ones because big pharmaceutical companies are able to promote their expensive brands by offering incentives to prescribers as well as chemists.
The proposed method of price fixation for medicines is likely to push up the prices of brands that are cheaper. And hence, the cost of procuring drugs for the free medicine scheme by the government will increase significantly.
As we know the Supreme Court has asked the government to see the affordability factor as well. Now the GoM is getting ready to present the report to the Cabinet and, hence, we need to wait till the final decision is taken by the CabineT.
The most intelligent strategy in Chess is to be ready with the next move.
Similarly, currency trading involves moves that are a combination of
knowledge and skill, backed by years of experience.
Currency Derivatives Trading with us keeps you a few steps ahead, always.
Registered O�ce: Nirmal Bang Securities Private Limited. 38-B, Khatau Building, 2nd Floor, Alkesh Dinesh Mody Marg, Fort, Mumbai - 400001. Tel: 3926 8600 / 01; Fax: 3926 8610Disclaimer: Insurance is a subject matter of solicitation. Mutual Fund investments are subject to market risk. Please read the scheme related document carefully before investing. Please read the Do’s and Don’ts prescribed by Commodity Exchange before trading. Through Nirmal Bang Securities Pvt. Ltd. *Through Nirmal Bang Commodities Pvt. Ltd. #Distributors investment in securities is subject to market risk. investment in securities is subject to market risk
EQUITIES | DERIVATIVES | COMMODITIES* | CURRENC Y | MUTUAL FUNDS# | IPOs# | INSURANCE# | DP
Contact: 022-39268088 | e -mail: [email protected] | www.nirmalbang.com


2011 2010 2009Aug Jul Jun Q2 Q1 Q4 Q3 Q2 Q1 Year Year Year
DemandOECD 48 47 46 45 46 47 47 45 47 46.4 46.9 46.3Rest of the World 44 44 45 43 43 43 43 42 42 42.3 41.2 39.1Total 92 90 91 89 89 90 89 88 89 88.7 88.1 85.4SupplyOPEC 31 31 31 31 31 31 30 29 30 29.7 28.9 28.7Non-OPEC 52 51 51 51 51 51 51 51 51 49.9 50.4 49Others 8.7 8.7 8.6 8.6 8.6 8.4 8.3 8.1 8.2 8.3 8.1 7.6Total 92 91 91 91 91 90 89 88 88 87.9 87.4 85.3
2012 2011
Source: EIA Unit: mbpd
Global Supply And Demand
It’s simplified...Beyond Market 19th Oct ’12 31
On 21st Dec ’11 the European Union came out with LTRO (Long Term Refinancing Operation) to overcome the ongoing debt crisis in the nation. LTRO1 infused 489 billion Euros and the LTRO2 pumped around 529 billion Euros into the system. Ignoring geopolitical tensions, the infusion of around 1 trillion Euros through LTROs had a very limited upside in oil prices.
WILL RISE IN GASOLINE PRICES HELP OBAMA?
On 14th September, the national average price for regular gasoline rose to $3.878 a gallon as per the US Energy Information Administration. Prices are up 7.7% from $3.601 in the year 2011 and at a record-high for this time of the year.
Gasoline prices gained after the Federal Reserve came up with its plan to buy mortgage backed securities worth $40 billion every month till there is a meaningful recovery in the job market. Retail gasoline prices climbed above year-earlier levels for the sixth consecutive week ended on 14th September. A jump in the cost of gasoline pushed US consumer prices up in August and during mid September was at the fastest pace in more than three years.
Source: Bloomberg
00.5
11.5
22.5
33.5
44.5
5
01-Jan-08 01-Jan-09 01-Jan-10 01-Jan-11 01-Jan-12
$/ba
rrel
US GasolineAny further risethen Obama may
The demand for gasoline in the US is seen declining. Going forward, if prices continue to remain high, any major spike from here would actually dent consumer sentiments in the US.
GLOBAL SUPPLY AND DEMAND
Below is the global demand and supply figure from 2009-12. Global demand for oil has remained weak throughout the year.

It’s simplified...Beyond Market 19th Oct ’1232
Source: Bloomberg, Reuters
Source: Bloomberg
The consumption of oil by top consumers like the US, China, Europe and Japan has dropped significantly since the past four years and is showing mild signs of recovery.
Going forward, we expect a further drop in demand due to the ongoing slowdown. The fiscal cliff in the developed world will lead to a further drop in GDP in these countries.
In July the global demand for oil increased by 1.8% year-on-year (y-o-y). The increase in consumption was mainly supported by higher demand in the US, China and Japan. The demand for oil from OECD nations has also remained quite strong since the past two to three months.
However, the non-OECD demand has not shown any significant increase and a sharp contraction was witnessed in China, whose consumption is nearly 1/10th of the consumption of oil globally.
Also, we have seen a major drawdown in oil stocks recently due the supply lump in non-OPEC nations. The growth in global production was held back by Hurricane Isaac, causing a 2,20,000 b/d reduction over the course of the month.
We consider such supply shocks to have a limited impact on crude oil prices. Rampant rise in shale oil production is likely to weigh on WTI oil as long as crude oil prices remain above $80/barrel. We expect shale oil producers to be encouraged to pump more and more oil.
Higher production numbers from other non-OPEC nations such as Russia and certain OPEC nations like Libya and Saudi Arabia has kept the oil market under pressure.
Currently, the oil market is well-supplied and top oil producing countries are producing oil at a record pace. We expect supply to overtake demand this year as the consumption of oil is not expected to show any pickup, going forward.
OPEC PRODUCTION Being the top producer of crude oil, OPEC has always remained a big concern for oil prices. The main motive of OPEC is to keep the oil market well-balanced and avoid sudden shocks in the supply chain.
Earlier the average quota for OPEC nations used to be around 27-28 mbpd. However, the quota was recently revised to 30 mbpd after the December ’11 OPEC meeting. The decision was taken to tackle the sudden loss in crude oil production.
By 2011 the total OPEC production was at least 2.18 mbpd higher than the normal quota. The nation contributing the most to this increase was Saudi Arabia, which was pumping around 10 mbpd. And Libya’s production was returning back to the pre-war levels of 1.42 mbpd.
The major motivation for such a drastic increase in production is to maintain a balance in the oil market and take the benefit of high crude oil prices. However, OPEC is raising its quota to match the actual production, while at the same time gauging the possibility of a slowing global economy and rising Libyan supply.
We believe that the prices that OPEC producers are deriving for oil is too high considering that the demand outlook for oil and supply cuts is quite unlikely even if prices drop sharply due to social unrest in the Middle East.
SAUDI AND LIBYA OIL PRODUCTION
Libya’s descent into civil war in February last year resulted in drastic cuts in production and a halt in oil shipments. During the civil war, the Libyan crude oil supply was literally taken out from the market and the production dropped to 22,000 bpd in July ’11.
Libya is a major oil supplier in OPEC and a sudden loss of 1.55 mbpd from the oil market increased supply concerns in the market, which affected oil prices.
27
28
29
30
31
32
33
34
Jan Feb Mar Apr May Jun July Aug Sept Oct Nov Dec
mbp
d
OPEC Production2009 2010 2011 2012
OPEC producing oil at record high
0
0.5
1
1.5
2
02468
1012
01-Ja
n-11
01-M
ar-1
1
01-M
ay-1
1
01-Ju
l-11
01-S
ep-1
1
01-N
ov-1
1
01-Ja
n-12
01-M
ar-1
2
01-M
ay-1
2
01-Ju
l-12
mbp
d
Saudi Arabia & Libya Crude Production Oil
Saudi Arabia Libya (RHS)
mbp
d
Declining oil
to the ongoing the end of the

It’s simplified...Beyond Market 19th Oct ’12 33
Being a top producer of oil among the OPEC nations, Saudi stepped in by raising its output slowly. It increased its production by almost 12.86% in less than six months.
Also, production from Libya too rebounded close to its pre-war level to 1.42 mbpd. The civil war ended on October ’11 and the Libyan oil production is ramping up constantly since then. The production jumped almost 1.2 mbpd in the last eight months. In September, Saudi pumped 0.5 mbpd less oil owing to the sluggish economic growth across the globe. However, since oil prices are quite high, Saudi Arabia has pledged to pump more oil to tame the oil prices.
RISING NON-OPEC SUPPLY Increase in oil production from Canada, Russia and the US
Source: Bloomberg, Reuters
Source: Bloomberg, Reuters
Source: Bloomberg Note: 100 as a base with respect to Jan’11
Non-OPEC Major Oil Suppliers
The US is a top consumer of oil and to reduce its dependency on oil imports, it has increased its production since 2008. Oil imports were down to 49% in 2010 and the imports are expected to drop by 36% by 2035. The US is pumping more than 6 mbpd of oil constantly since the past four months. The high production is mainly supported by shale oil exploration going on in the US.
Over the past decade, Canada has become a top supplier of oil mainly due to the increase in oil sands production. It currently contributes around 3.5 mbpd of oil. Going forward, we expect Canada to remain one of the major suppliers of crude oil and Canadian exports of oil are also expected to rise in the future.
FALLING IMPORTS OF MAJOR CONSUMERS Imports from all major economies have shown a decline due to the sluggish demand for oil across the globe this year. The US has witnessed a fall of almost 3.3% in less than three months. The steep fall in imports can be
supported by two main reasons. The largest factor is the combination of increased crude oil and NG liquid produc-tion and the second largest factor is reduced petroleum oil consumption. Declining US petroleum oil consumption is the second most significant factor contributing to the reduced net oil imports of the country.
707580859095
100105110115120
31-Ja
n-11
31-M
ar-1
1
31-M
ay-1
1
31-Ju
l-11
30-S
ep-1
1
30-N
ov-1
1
31-Ja
n-12
31-M
ar-1
2
31-M
ay-1
2
31-Ju
l-12
Crude Oil Imports
US China Japan
Despite being the second largest consumer of oil, China has reduced its oil imports by more than 30% in the past four months following sluggish growth in the country. China’s GDP contracted 0.5% in the last quarter, depicting the worsening situation in the economy. China’s crude oil imports fell 12.5% in the month of August as compared to last year. It is the biggest drop since October ’10 as the refiners cut imports due to the ongoing maintenance and the slowing demand for oil in the country. Japan, one of the major importers of oil, has also reduced its oil imports drastically.
US FALLING IMPORTS & RISING PRODUCTION
8
8.5
9
9.5
10
10.5
5.00
5.20
5.40
5.60
5.80
6.00
6.20
6.40
01-J
an-1
0
01-M
ar-1
0
01-M
ay-1
0
01-J
ul-1
0
01-S
ep-1
0
01-N
ov-1
0
01-J
an-1
1
01-M
ar-1
1
01-M
ay-1
1
01-J
ul-1
1
01-S
ep-1
1
01-N
ov-1
1
01-J
an-1
2
01-M
ar-1
2
01-M
ay-1
2
01-J
ul-1
2
mbp
d
US Total Crude Oil ProductionUS Total Produc on Imports
mbp
d
the country’s dependency on oil imports.
Top consumer US is expected to witness a drop of 1.5% in consumption by the end of the year. According to the Energy Information Administration (EIA), crude oil imports have fallen by almost 12% between 2010 and
4.90
5.10
5.30
5.50
5.70
5.90
6.10
0.00
2.00
4.00
6.00
8.00
10.00
12.00
01-J
an-0
2
01-J
an-0
3
01-J
an-0
4
01-J
an-0
5
01-J
an-0
6
01-J
an-0
7
01-J
an-0
8
01-J
an-0
9
01-J
an-1
0
01-J
an-1
1
mbp
d
Canada Russia US (RHS)
mbp
d
US oil output avg above 6 mbpd in 2012

It’s simplified...Beyond Market 19th Oct ’1234
Source: Bloomberg, Reuters Source: Bloomberg Unit: mbpd
2012, from 6.2 mbpd to 5.45 million barrels. A rise in US oil production is purely driven by the shale oil activity at the Eagle Ford and Bakken Shale which have reduced its reliance on imports recently. Going forward, we expect the US to reduce its reliance on oil imports as there has been tremendous increase in oil production in the US.
IRAN OIL EXPORTS & PRODUCTION
After the EU ban and US sanctions on Iranian oil exports, we have witnessed a drastic fall in Iran’s oil export numbers. Oil exports from Iran have fallen to 1.0 mbpd approximately, down by almost 70% from the start of the year. Same is the case with Iran’s oil production also, which has fallen from 3.6 mbpd in 2011 to 2.8 mbpd in August this year and currently the production is at a 22-year low.
2.50
2.70
2.90
3.10
3.30
3.50
3.70
0.51
1.52
2.53
3.54
01-D
ec-1
1
01-J
an-1
2
01-F
eb-1
2
01-M
ar-1
2
01-A
pr-1
2
01-M
ay-1
2
01-J
un-1
2
01-J
ul-1
2
01-A
ug-1
2
mbp
d
Iran Crude Oil Production & Exports
OECD & Non-OECD Demand
Exports Produc on
mbp
d
A sharp fall seen in the exports numbers
The International Atomic Energy Agency is firmly committed to intensifying dialogue and will continue to negotiate with Iran, the chief of the UN nuclear watchdog has said, even though no concrete results have been achieved since November ’11. We do not expect any major geopolitical tension to arise immediately as no one in the current environment can afford a war or major conflict as even without war the global economic slowdown is worsening. Sanity should prevail over extremism.
OECD AND NON-OECD DEMAND Post-2008 we have seen a sharp depreciation in oil demand in OECD countries. We believe that there is still a long way to go for OECD demand to pick up. We believe that the demand for crude oil from OECD countries is likely to drop by 0.35-0.4 mbpd in 2013, mainly due to contraction in the Euro zone and Japan.
In spite of upbeat economic reports from the US, we are skeptical about the massive surge in incremental demand growth of the US as roaring fiscal deficit may weigh on the
YearOECD
DemandNon-OECD
Demand
2006 49.79 35.23
2007 49.6 36.48
2008 47.92 38.23
2009 45.93 39.27
2010 46.48 41.76
2011 45.85 43.512012 45.61 43.93
economic growth. Post election, growth concerns in the US are likely to dominate over the recent optimism from QE3 programme.
Since six years, the oil story has more to do with the emerging markets than the developed world. Growth engines of the global economy, that is, the emerging markets, seem to have lost their momentum in the last two quarters, with India and China both passing through a rough patch.
In these two countries, the economy contracted quite sharply and high inflation prevented policymakers from acting aggressively.
We believe the demand from Non-OECD countries is likely to grow by 0.90 mbpd – 1 mbpd. The demand from China has dropped quite sharply in the last two quarters and we are not expecting any major pick-up in demand growth. Because of the Chinese slowdown, the incremen-tal growth is likely to plummet, but the non-OECD demand for crude oil will continue to grow even in 2013.
TANKER INDEX
The global tanker index is clearly pointing towards a

It’s simplified...Beyond Market 19th Oct ’12 35
scenario of glut in the world oil market. Even though in the last four years more and more fleets have emerged, the drop in freight rates is also one of the indicators that the global oil market is well supplied.
Source: Bloomberg
0
200
400
600
800
1000
1200
18-N
ov-1
0
18-J
an-1
1
18-M
ar-1
1
18-M
ay-1
1
18-J
ul-1
1
18-S
ep-1
1
18-N
ov-1
1
18-J
an-1
2
18-M
ar-1
2
18-M
ay-1
2
18-J
ul-1
2
Tanker Index
Dirty Tanker Index Clean Tanker index
OUTLOOK
In the commodity segment, crude oil has remained the prime focus since the last four to five years. Except for 2012, China is the only country that accounted for incremental growth in demand. Sharp contraction in Chinese GDP has shaved off oil imports and the oil market still struggles to find another China. Even though the Chinese economy may pick up growth in the first half of 2013, we do not expect any meaningful growth in oil imports due to the structural problems in China. US’s efforts to increase its domestic oil production will lead to a drop in oil imports. Even though the US oil demand moves up it will not lead to a significant jump in oil imports from the Middle East. Due to the austerity trap, we feel Europe’s economic woes are likely to put a cap on EU’s demand for oil.
The global oil market is showing more resistance towards ultra loose monetary policies and stimulus drugs. If meaningful recovery is expected after bold steps from the ECB and the Federal Reserve, it would not be possible with high oil prices. Developing economies which were growth engines of the global economy need to lower fuel costs as most of them are battling high inflation, which has forced governments to take favourable steps to stimulate the economy. We are of the view that the recent drop in oil prices is more politically driven than fundamentally driven.
We are of the opinion that oil prices have peaked out for the next three quarters and any spike due to geopolitical tensions or liquidity injections should be sold. We feel the WTI crude oil may drop and test the levels of $85-$82/barrels in the next three quarterS.
regular investments keep worries away
an apple a day keeps the doctor away
SMS ‘BANG’ to 54646 | e -mail: [email protected] | www.nirmalbang.comE Q U I T I E S | D E R I V AT I V E S | C O M M O D I T I E S | C U R R E N C Y | M U T U A L F U N D S | I P O s | I N S U R A N C E | D PYour financial health is our concern.
At Nirmal Bang, it’s a relationship beyond broking...

Regular tariff hikes, improvement in retail operations and commissioning or signing of power purchase agreement of the Chandrapur power project are likely to help CESC Ltd to grow in the coming times
ESC is a fully integrated power utility with its operation spanning the entire value chain: right from mining coal to generating and distributing power. It is the flagship company
of RP-Sanjiv Goenka Group.
The company also has interests in retail and real estate business where it operates through fully owned subsidiaries (Spencer’s and CESC Properties).
The company is the sole distributor of electricity within an area of 567 sq km of Kolkata, serving more than 2.5 million customers, which includes domestic, industrial and commercial users. It also owns and operates four thermal power plants generating 1,225 MW of power.
INVESTMENT RATIONALE
Strong Regulated Power Business Provides Steady Cash Flows
CESC has a regulated power business with an integrated model in Kolkata. The company operates four power
C
RISE TOPOWER
It’s simplified...Beyond Market 19th Oct ’1236
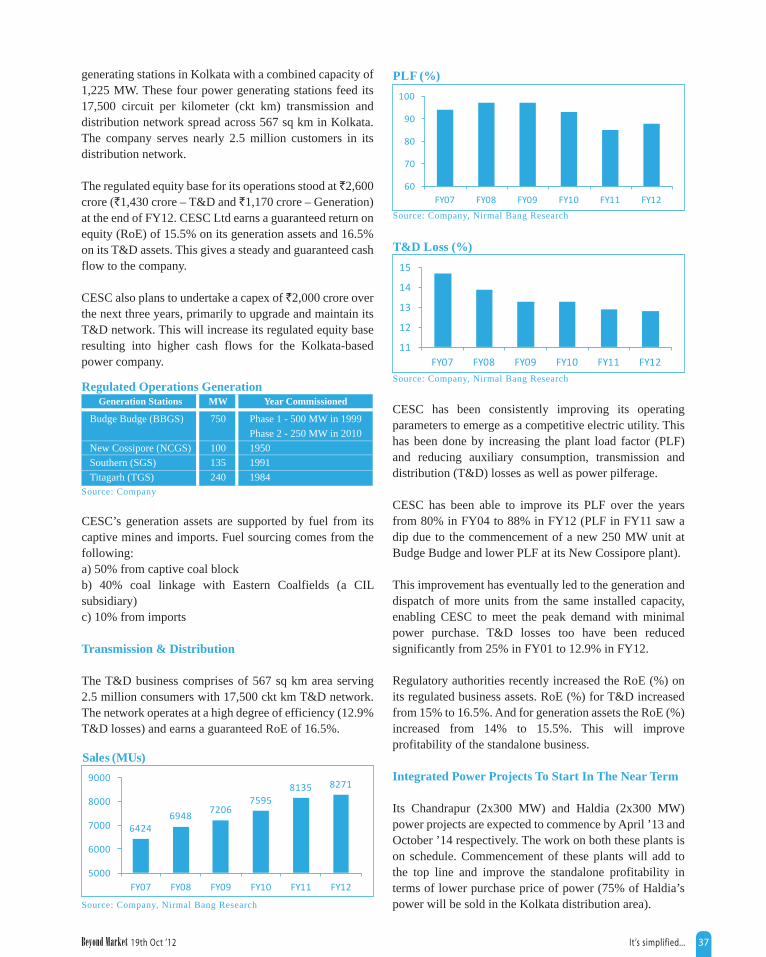
It’s simplified...Beyond Market 19th Oct ’12 37
generating stations in Kolkata with a combined capacity of 1,225 MW. These four power generating stations feed its 17,500 circuit per kilometer (ckt km) transmission and distribution network spread across 567 sq km in Kolkata. The company serves nearly 2.5 million customers in its distribution network.
The regulated equity base for its operations stood at ̀ 2,600 crore (`1,430 crore – T&D and `1,170 crore – Generation) at the end of FY12. CESC Ltd earns a guaranteed return on equity (RoE) of 15.5% on its generation assets and 16.5% on its T&D assets. This gives a steady and guaranteed cash flow to the company.
CESC also plans to undertake a capex of `2,000 crore over the next three years, primarily to upgrade and maintain its T&D network. This will increase its regulated equity base resulting into higher cash flows for the Kolkata-based power company.
Source: Company
Source: Company, Nirmal Bang Research
Source: Company, Nirmal Bang Research
Source: Company, Nirmal Bang Research
Budge Budge (BBGS)
New Cossipore (NCGS)Southern (SGS)Titagarh (TGS)
Phase 1 - 500 MW in 1999Phase 2 - 250 MW in 2010195019911984
750
100135240
Regulated Operations GenerationGeneration Stations Year CommissionedMW
CESC’s generation assets are supported by fuel from its captive mines and imports. Fuel sourcing comes from the following:a) 50% from captive coal blockb) 40% coal linkage with Eastern Coalfields (a CIL subsidiary)c) 10% from imports
Transmission & Distribution
The T&D business comprises of 567 sq km area serving 2.5 million consumers with 17,500 ckt km T&D network. The network operates at a high degree of efficiency (12.9% T&D losses) and earns a guaranteed RoE of 16.5%.
64246948
72067595
8135 8271
5000
6000
7000
8000
9000
FY07 FY08 FY09 FY10 FY11 FY12
Sales (MUs)
11
12
13
14
15
FY07 FY08 FY09 FY10 FY11 FY12
T&D Loss (%)
60
70
80
90
100
FY07 FY08 FY09 FY10 FY11 FY12
PLF (%)
CESC has been consistently improving its operating parameters to emerge as a competitive electric utility. This has been done by increasing the plant load factor (PLF) and reducing auxiliary consumption, transmission and distribution (T&D) losses as well as power pilferage.
CESC has been able to improve its PLF over the years from 80% in FY04 to 88% in FY12 (PLF in FY11 saw a dip due to the commencement of a new 250 MW unit at Budge Budge and lower PLF at its New Cossipore plant).
This improvement has eventually led to the generation and dispatch of more units from the same installed capacity, enabling CESC to meet the peak demand with minimal power purchase. T&D losses too have been reduced significantly from 25% in FY01 to 12.9% in FY12.
Regulatory authorities recently increased the RoE (%) on its regulated business assets. RoE (%) for T&D increased from 15% to 16.5%. And for generation assets the RoE (%) increased from 14% to 15.5%. This will improve profitability of the standalone business.
Integrated Power Projects To Start In The Near Term
Its Chandrapur (2x300 MW) and Haldia (2x300 MW) power projects are expected to commence by April ’13 and October ’14 respectively. The work on both these plants is on schedule. Commencement of these plants will add to the top line and improve the standalone profitability in terms of lower purchase price of power (75% of Haldia’s power will be sold in the Kolkata distribution area).
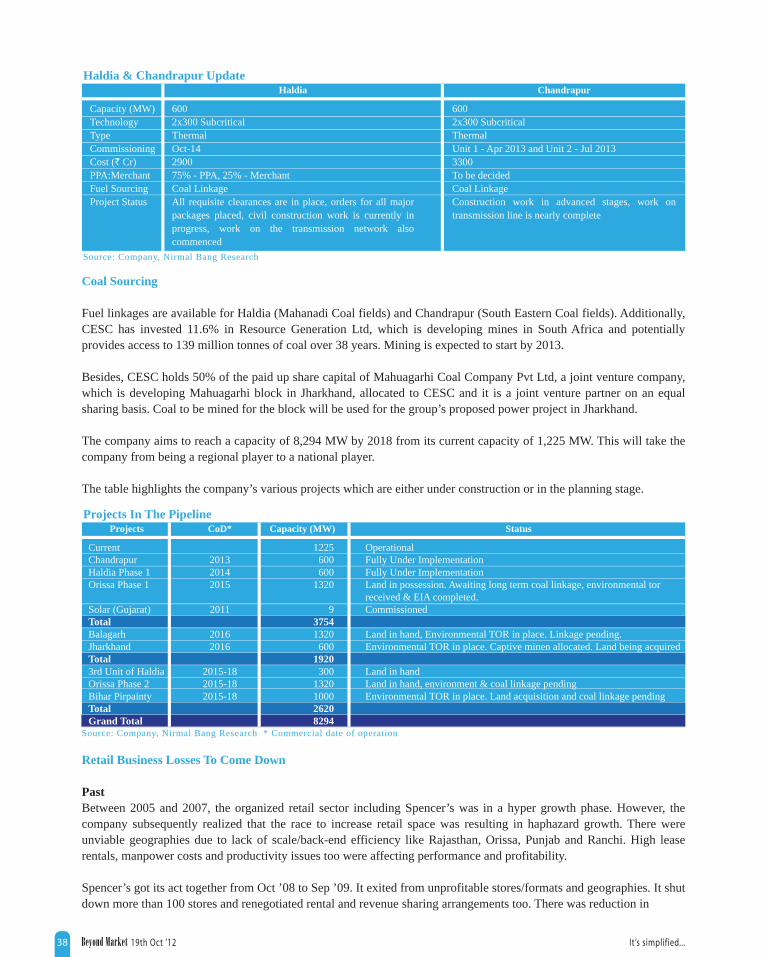
It’s simplified...Beyond Market 19th Oct ’1238
Source: Company, Nirmal Bang Research
Source: Company, Nirmal Bang Research * Commercial date of operation
Haldia Chandrapur
Coal Sourcing
Fuel linkages are available for Haldia (Mahanadi Coal fields) and Chandrapur (South Eastern Coal fields). Additionally, CESC has invested 11.6% in Resource Generation Ltd, which is developing mines in South Africa and potentially provides access to 139 million tonnes of coal over 38 years. Mining is expected to start by 2013.
Besides, CESC holds 50% of the paid up share capital of Mahuagarhi Coal Company Pvt Ltd, a joint venture company, which is developing Mahuagarhi block in Jharkhand, allocated to CESC and it is a joint venture partner on an equal sharing basis. Coal to be mined for the block will be used for the group’s proposed power project in Jharkhand.
The company aims to reach a capacity of 8,294 MW by 2018 from its current capacity of 1,225 MW. This will take the company from being a regional player to a national player.
The table highlights the company’s various projects which are either under construction or in the planning stage.
Haldia & Chandrapur Update
Capacity (MW)TechnologyTypeCommissioningCost (` Cr)PPA:MerchantFuel SourcingProject Status
6002x300 SubcriticalThermalOct-14290075% - PPA, 25% - MerchantCoal LinkageAll requisite clearances are in place, orders for all major packages placed, civil construction work is currently in progress, work on the transmission network also commenced
6002x300 SubcriticalThermalUnit 1 - Apr 2013 and Unit 2 - Jul 20133300To be decidedCoal LinkageConstruction work in advanced stages, work on transmission line is nearly complete
Projects CoD* Capacity (MW) StatusProjects In The Pipeline
CurrentChandrapurHaldia Phase 1Orissa Phase 1
Solar (Gujarat)TotalBalagarhJharkhandTotal3rd Unit of HaldiaOrissa Phase 2Bihar PirpaintyTotalGrand Total
201320142015
2011
20162016
2015-182015-182015-18
1225600600
1320
937541320
6001920
3001320100026208294
OperationalFully Under ImplementationFully Under ImplementationLand in possession. Awaiting long term coal linkage, environmental tor received & EIA completed.Commissioned
Land in hand, Environmental TOR in place. Linkage pending.Environmental TOR in place. Captive minen allocated. Land being acquired
Land in hand Land in hand, environment & coal linkage pendingEnvironmental TOR in place. Land acquisition and coal linkage pending
Retail Business Losses To Come Down
PastBetween 2005 and 2007, the organized retail sector including Spencer’s was in a hyper growth phase. However, the company subsequently realized that the race to increase retail space was resulting in haphazard growth. There were unviable geographies due to lack of scale/back-end efficiency like Rajasthan, Orissa, Punjab and Ranchi. High lease rentals, manpower costs and productivity issues too were affecting performance and profitability.
Spencer’s got its act together from Oct ’08 to Sep ’09. It exited from unprofitable stores/formats and geographies. It shut down more than 100 stores and renegotiated rental and revenue sharing arrangements too. There was reduction in

It’s simplified...Beyond Market 19th Oct ’12 39
employee count (down by 4,000). Significant investments were made in systems and backend.
Current Status & OutlookSame store sales have been rising. In the last 24 months, average growth rate has been over 14%. Spencer’s turned store EBITDA positive every month since April ’10. Policy reforms like FDI, GST, APMC Act, etc are potential upside triggers.
The management expects Spencer’s to break even at the company level by Q4 FY14. The cash outgo from the parent company towards Spencer’s is expected to come down to `110 crore in FY13 from `160 crore in FY12. The top line is expected to grow at 17% to 18% in FY13 and FY14.The management has highlighted the strategy of increasing the top line growth to dilute the effect of high corporate costs. Spencer’s expects to end FY13 with nearly 1,136k sq ft of trading area from the current 975k sq ft.
Source: Company, Nirmal Bang Research * Trading area
Regions States TA *('000) Hypers >15k Supers 3k-15k Dailies <3k TotalSpencer’s Footprint – June 2012
East
West
North
South 1
South 2
TOTAL
WBTotalMaharashtraGujaratTotalEast UPNCRTotalKeralaT.N.TotalBangaloreCoastal APHyderabadTotal
182182
8924
113114126240
29116145
5394
147295975
662133470112439
26
220001232242136
15
101010
01014
620
73946
79
2036
122
181812
113181230
9425111142651
163
Real Estate Business Will Tap The Unutilized Land Bank Of The Company
CESC has a large unexploited land bank at different locations, which it plans to use to generate an additional source of income. The company has floated a wholly-owned subsidiary ‘CESC Properties’ to develop real estate projects.
The company is developing three acres of land in central Kolkata, where it is setting up a shopping mall with 4 lakh sq ft of retail area with parking space for more than 900 cars. Construction work is in process and the mall is expected to start operations in Mar ’13. According to the management, the entire space is sold out and lease rentals are expected to be in the range of `100-110/sq ft/month. This project is expected to add approximately `30 crore to the bottom line.
RISKS
The downside risk for the company would be 1) Continuing losses in Spencer’s and delay in FDI in retail 2) Absence of PPA in Chandrapur (the company has revoked the earlier signed PPA)3) Increase in fuel prices4) Delays in the upcoming power projects5) Regulatory risks in terms of coal sourcing and tariff hikes
OUTLOOK
Regular tariff hikes, improvement in retail operations and commissioning or signing of PPA of the Chandrapur power project would be key triggers for growth. Given the government’s focus on the distribution sector, winning of franchises in cities can also provide meaningful upside triggers for the stock. Currently, the company is one the bidders for various cities in JharkhanD.

Theme Party On The BoursesThematic funds are doing well on the bourses and have given good returns
to investors in recent times
It’s simplified...Beyond Market 19th Oct ’1240

It’s simplified...Beyond Market 19th Oct ’12 41
new categories, would help metropolitan areas maintain their level of consumption.
For FMCG, increased focus on farm sector will boost rural incomes, thus providing better growth prospects to FMCG companies. The FMCG sector is also likely to benefit from the growing demand in the market.
As far as pharma is concerned, growing population and rise in the economic scenario, is likely to transform the pharma market in the coming years.
Despite both the sectors doing immensely well in the past few years, we would like to say that investors should contribute only a part of their investment in sectoral or thematic funds. It is always advisable to start through balanced and diversified equity funds and then graduate towards aggressive funds such as sectoral funds.
This article attempts to present the immense investment opportunities in FMCG and pharma sectors through mutual funds.
FAST MOVING CONSUMER GOODS (FMCG)
The FMCG sector has done remarkably well in the past few years and investors have benefited a great deal by investing in stocks from this sector. In the last decade, the sector has grown at an annual rate of 11% and is the fourth largest sector in the Indian economy with a size of over `1,300 billion.
Currently, investors can invest in two FMCG mutual fund schemes, viz, ICICI Prudential FMCG and SBI Magnum FMCG. Both these schemes have been around for over a decade now with a proven track record and history, too.
In the past one year ICICI Prudential FMCG has given a return of over 27% while SBI Magnum FMCG gave a return of 34%. The FMCG sector is one of the few sectors that has given positive returns not only for one year, but also for, three, five and also 10 years. The schemes have shown some resilience not only during rising markets but also during the downturn of 2008-09.
However, there are not many FMCG companies in India. Therefore, the portfolios of both these schemes have limited stocks, which might have a negative impact.
But sectoral schemes have a part of risk attached to it. Currently, there is lot of pessimism for the FMCG sector as it has only seen an upward movement in the past few months.
FMCG goods are popularly called consumer packaged goods and items in this category include all consumables people buy at regular intervals. These items are meant for daily and frequent consumption, unlike other products.
It is believed that FMCG has a lot of potential in the Indian unexploited market as penetration and per capita consumption remain low as compared to other emerging or developed markets. Rising population of middle class and the rural segments offers huge untapped prospect to FMCG players in the country.
However, concerns like rising cost of fuel and raw materials, decline in industrial growth and slowing economy will lead to lower demand in FMCG products, which might have a negative impact on these stocks.
But many argue that the FMCG sector is likely to continue its positive run albeit with some hiccups. But investors are advised to invest a small
he fortunes of many a investor has changed for the worse owing to the volatility in the markets.
Not only have they lost money in the equity markets, news of mutual fund investors burning their fingers too have come to light. However, the poor performance of the schemes has more to do with the equity markets, which have almost remained flat or negative in the past several months.
It is often said that sectoral or thematic funds are volatile in nature and retail investors should stay away from investing in them. Instead, they should continue investing in diversified equity funds.
But going by the data on thematic funds such as Fast Moving Consumer Goods (FMCG) and pharma for 1-year, 3-year or even for a 10-year time frame, we find that the returns have remained positive and topped the performance compared to many other equity schemes.
Since 2009-10, we have seen a partial slowdown in growth in India due to global and domestic issues resulting in lowering of investor confidence. However, India’s consumption has more or less remained on track, which many experts hope will do well on the back of intense opportunity in the Indian markets.
Both FMCG and pharma sectors cannot be ignored as it still has to penetrate into rural and semi-urban areas. Because of low per capita consumption of almost all products in the country, FMCG companies have a vast potential for growth. However, the demand in urban areas would be the key growth driver for the sector in the long term.
Also, increase in the urban population, along with the increase in income levels and accessibility of
T

It’s simplified...Beyond Market 19th Oct ’1242
sum in the sector with a long-term horizon, as it comes with certain risks attached to it. PHARMA AND HEALTH CARE
As the name suggests, mutual funds that invest across the pharmaceutical industry are known as pharma funds. The pharmaceutical industry also includes hospitals and drug manufacturing companies (drug companies related to research and development), which means that mutual funds also have exposure to such companies.
Much like FMCG, there is immense growth opportunity in the pharma sector too owing to rising population and the middle class, which can afford to buy expensive medicines. The focus will now shift to tier-III and rural areas.
The Indian pharma industry is all set to record a robust growth due to increase in pharmaceutical
outsourcing and upward trend in investments by multinational companies. Indian pharmaceutical companies export drugs to advanced and regulated countries like the United States and also Western European countries.
Currently, there are three pharma funds in the country with assets over `700 crore. Reliance Pharma fund leads the sector with the highest assets in the sector. Such a thematic fund invests only in equities (stocks) of pharma and healthcare companies. For example, UTI Pharma aims to invest in companies engaged in the business of manufacture and marketing of bulk drugs, formulations and health care products and services.
Talking about performance, a number of schemes have managed to give positive returns both in the short term as well as the long term.
UTI Pharma & Healthcare fund is the oldest scheme in the category which
was launched way back in June ’99. In the last one year pharma funds have given returns in the range of 16% to 26%.
Many people believe that there is tremendous opportunity in the sector and several mid-cap and small-cap companies are also likely to benefit from the huge demand in the pharma space. If we look at the portfolios of the schemes, we find that many schemes hold mid-cap and small-cap companies in the pharma and health care sector.
The outlook on Indian pharmaceutical companies is reportedly encouraging as it is believed that companies will continue to benefit from the recovery in the domestic market, strong growth and outsourcing opportunities from the developed market. However, here too many players believe that some regulatory stance from the government is required to make use of the full potential of the Indian pharma sectoR.
w w w.nirmalbang.com
BSE SEBI REGN No. INB011072759, INF011072759 & INE011072759, NSE SEBI REGN No. INB230939139, INF230939139 & INE230939139 DP SEBI REGN. No NSDL: IN-DP-NSDL-136-2000, CDS(I)l: IN-DP-CDSL-37-99, AMFI REGN. No. arn-49454 NCDEX REGN. NO. 00362, FMC Code-0075, MCX REGN. No. 16590, FMC Code-MCX/TCM/CORP/0490, MCX SX-INE260939139, PMS-INP000002981
CORPORATE OFFICE: B-2, 301/302, Marathon Innova, O� Ganpatrao Kadam Marg, Lower Parel (W), Mumbai - 400 013. Tel: 022 - 39268000 / 8001; Fax: 022 - 39268010R E G D. O F F I C E : S onawala Bui ld ing, 25 Bank Street , For t , Mumbai - 400 001. Tel : 022 - 39267500 / 7501; Fax : 022 - 39267510
Disclaimer: Insurance is a subject matter of solicitation. Mutual Fund investments are subject to market risk. Please read the scheme related document carefully before investing. Please read the Do’s and Don’ts prescribed by Commodity Exchange before trading. The PMS Service is not o�ering for commodity segment. *Through Nirmal Bang Securities Pvt. Ltd. ^Distributors #Prepared by Research Analyst of Nirmal Bang Commodities Pvt. Ltd.
For job openings at Nirmal Bang, visit http://www.nirmalbang.com/careers.aspx
Now, Commodity TradingIs No More A Puzzle.Commodity trading can be confusing especially if one is inexperienced and
lacks the necessary skills to trade successfully. At Nirmal Bang, our team of
seasoned analysts with years of experience and in-depth knowledge can help
you spot the underlying clues and create the investment strategies that best
suit your commodity trading requirements.

100 100 100 100 100 100 100 100 100 100 100 100 100 100 100 100 100 100 100
100 100 100 100 100 100 100 100 100 uthoot Capital Services Ltd, promoted by Muthoot Pappachan Group, was
incorporated on 18th Feb ’94 as a public limited company. The company is an NBFC registered with the Reserve Bank of India and listed on the Bombay Stock Exchange.
CHANGE IN BUSINESS MODEL
Muthoot Capital has changed its business model and derives a signifi-cant portion of its revenues from the auto finance, two-wheeler and three-wheeler loan segment, a drastic shift from the gold loan business, which the company used to do earlier.
STRONG IMPROVEMENT GOING FORWARD
It had an AUM of close to `300 crore at the end of FY12. The target for the AUM for FY13 is `700 crore with the clientele doubling to more than 2 lakh compared to 1 lakh, at present.
Since the company derives a major portion of its revenues by financing the two-wheeler and three-wheeler segment, coupled with a low base, there are bright chances that the company would achieve its target.
STRONG ASSET QUALITY
One of the key aspects of any NBFC is its asset quality. With its roots in the financing business, Muthoot Capital has managed growth but not at the cost of quality. The loan book is pretty strong with net Non-performing Assets (NPAs) at less than 0.5%.
FINANCIAL PERFORMANCE
With schemes tailor-made for
M customer needs and flexibility in repayment methods, it has posted a continuous growth in its earnings.
During Q1FY13, the company posted a net income of `22.04 crore compared to `12.19 crore last year. The PAT more than doubled to `4.9 crore compared to `2.35 crore during the corresponding quarter last year.
Muthoot Capital had concluded a rights issues last year at a price of `70 per share. Unlike other investors, the promoters had fully subscribed to the same, resulting in their holding increasing to 77% from 74%.
However, in order to meet the regula-tory guidelines, the promoter holding has been reduced marginally to below 75% levels.
The company has firm foot marks in the two-wheeler finance space in the four southern states, including Goa. The company is expanding its presence to the states of Gujarat and Maharashtra, too.
Considering these initiatives, we derive comfort from the fact that the company would be able to reach its targeted figure of `700 crore AUM by the end of FY13.
Recently, the Society of Indian Automobile Manufacturers (SIAM) reduced the targets for the auto loan industry, particularly passenger cars.
However, the two-wheeler segment is expected to do relatively well as compared to the automobile segment on the whole. Since the company depends significantly on this segment, the impact of the overall slowdown would be much less on Muthoot Capital.
Secondly, Muthoot Capital has a share of around 3% in the automobile finance segment and therefore, a marginal increase in share, coupled with an overall increase in the market size should help the company achieve the guidance.
The company’s main market segment is rural and semi-urban markets, which should do relatively well compared to the urban markets.
A high promoter holding, coupled with a consistent dividend-payout ratio augurs well for the company, going forward. The share is quoting at 1.3x the book value and the rights issue also took place at the same price last year, pointing towards much lower valuationS.
MUTHOOT CAPITAL SERVICES LIMITEDMUTHOOT CAPITAL SERVICES LIMITED
Financials
IncomePATEquityEPS Dividend per shareBook Value
12.254
6.56.161.5
18.77
17.395.426.5
8.332
24.77
Particulars FY08 FY09
22.487.176.5
11.042.5
32.88
FY10
37.189.676.5
12.093
44.26
67.3515.5112.4713.12
3.569.74
FY11 FY12
Source: Company, Nirmal Bang Research
Note: The market price of Muthoot Capital Services Ltd as on 15th Oct ’12 is `84.60
It’s simplified...Beyond Market 19th Oct ’12 43

It’s simplified...Beyond Market 19th Oct ’1244
he Nifty Futures remained in a consolidation mode in October (till 15th Oct) due to around 7% gains in
the September expiry. The bullish undertone is visible in the markets owing to liquidity on the international front with government policy initiatives on the domestic front.
In September, FIIs were net buyers to the tune of $4 billion in Indian equities. With this, the cumulative tally for 2012 has so far reached around $16 billion. Together with buying interest by FIIs, the average monthly stock delivery volume in the Indian equity markets (which suggests a bullish undertone) rose to 43% in September. This is the highest value since October ’11. All data point toward the likely upward move in the markets in the days to come.
The Put Call Ratio Open Interest (PCR OI) for Nifty Options is hovering between a very narrow range of 1.09 and 0.98 since the past fortnight. The current PCR OI stands at 0.98 (as on 15th October) which is also the lower end of the October series and going forward we see PCR consolidating between 0.90-1.04, maintaining a neutral to negative view till the end of October expiry.
On the Nifty Options front, the October series’ highest OI build up was witnessed near 5300PE and 5700CE, near the start of the expiry. Thereafter, an aggressive writing narrowed the Nifty range from 400 points to 200 points. With this the highest build up now stands at 5,800 Call and 5,600 Put to the tune of 9.53 million and 8.04 million, respectively (15th October). Looking at the current Options scenario, we expect the markets to consolidate between
TTECHNICAL OUTLOOK FOR THE FORTNIGHT
the narrow range of 5,600-5,800 and breach of this on closing will further decide the trend of the market.
India VIX, which measures the immediate 30-day volatility in the market, has been quite subdued since the past fortnight and is trading in a very narrow range of 15-17 (currently at 15.90) (15th September)). But going forward, we believe that it has already formed a strong base of 14.5 and we may see an upward breakout. The 19 and 22 levels can be seen on the India VIX in the days to come.
The Nifty index rallied from the September ’12 lows of 5,270 and the advance halted at the 5,810 level on 5th Oct ’12. It did correct from the resistance and found support at the 5,640 level and has turned sideways since then. Currently, the range for the index is 5,550-5,750 and any move would call for a trending action.
Recently, a bearish engulfing pattern was seen forming on the weekly charts and closing above this is essential for a positive bias, which has to be triggered by strong buying across Index stocks. Until the index trades below the 5,750 level, one should maintain a cautious approach in the near term. Any move beyond that may trigger a further upside till 5,880 and 5,950, which is a possibility over the next few weeks. However, for the uptrend to remain intact, the Nifty should sustain above the level of 5,550 in case of further correction in the next few days.
After taking support from its rising trend line drawn from its December ’12 lows, the Bank Nifty has managed to sustain above the 11,200 level, which is a bullish signal. The Bank Nifty faces a strong resistance around
the 11,550 level on the upside where selling pressure is expected. One should maintain a positive bias only on close above this for an upside potential to 11,750-11,900. There is an immediate support at the 11,220 -11,180 levels on the downside. As the market struggles with the trend, and is seemingly undecided whether to move up or down, we find evidence of continuation of the ranging action is building up again. Traders should maintain a bullish bias in the Bank Nifty only on a decisive close above the 11,550 level.
STOCK PICK
Ranbaxy has managed to exceed from the descending channel pattern along with the horizontal resistance zone of `542-`545 levels with above average volumes, which confirms the bullish breakout in the stock. The price projection is found by measuring the widest distance of the pattern and subtracting it from the resistance breakout with the targets - the rising channel pattern resistance - around the `582-`590 levels. The MACD has given a positive crossover and is above the positive territory. The RSI indicator is currently advancing, showing bullish momentum.
OPTIONS STRATEGYSHORT STRANGLE ON NIFTY
It can be initiated by selling 5700CE and 5600PE of the October series. The net combined premium inflow is around `80, which is also the maximum profit (if Nifty Oct series expires between 5,600-5,700). The breakeven stands at 5,780-5,520. There is unlimited loss beyond the breakeven range. Traders can square off their strategy when the combined rate of the Strangle crosses 110+.


ndicators are tools at the disposal of technical analysts to help them understand, interpret, predict, alert, and/or
confirm the moves in the markets or individual stocks.
There are a number of indicators in the markets, which investors can use either singularly or in combination. Just be advised, “Too many cooks spoil the broth.”
Similarly, using too many indicators, however, can confuse you instead of giving you a clear direction since there may be conflicting signals from different indicators.
Hence, in this article, we shall only
Itry and focus on some of the widely-used and well-established indicators, which can be easily calculated and interpreted by investors and which do not require any chart plotting or complex computer software for analysis.
There are basically three types of indicators.
a. Leading IndicatorsThese are indicators that lead the price move. In other words, the indicators move first and the price move follows. They usually help identify the overbought and the oversold position.
b. Lagging IndicatorsThe price of the stock moves first and
INDICATORSOF CHANGE
It’s simplified...Beyond Market 19th Oct ’1246

It’s simplified...Beyond Market 19th Oct ’12 47
INDICATORS
� MOVING AVERAGES
Although it is the simplest of all indicators, analysts across the world swear by the efficacy of this tool in predicting the future movement of a stock or the markets. Moving averages help in calculating the
average price of a security over a given time period.
a. Simple Moving Average (SMA)Moving averages are lagging indicators. It is simply an average of the closing prices of a stock for a given number of days, that is, the sum of the closing price for each day divided by the number of days.
the indicators follow. They help in identifying trend continuation or trend reversal.
c. Coincident IndicatorsThe coincident indicators occur almost simultaneously with the event that they signify. Such indicators are not of much use for predicting future trends for stocks.
Technical analysts use indicators to understand, interpret, predict, alert, and/or confirm moves in the markets or individual stocks

It’s simplified...Beyond Market 19th Oct ’1248
Example: For a 7-day period, the closing price of a stock has been 35, 38, 42, 39, 40, 42, and 41, respectively.
The SMA for those 7 days would be
Interpretation a. Trend: If a stock price is trading above the moving average level, it signals ‘bullishness’ and if the price is trading below the moving average level, it suggests ‘bearishness’. b. Support and Resistance: The moving average also gives us support and resistance. Hence, if a stock is trading above the moving average, it will find support at the moving average level and resume its uptrend. Whereas, if a stock is trading below the moving average, it will find resistance at the moving average level and continue to fall.
c. Penetration: Thirdly, if a rising stock moving above the moving average were to start falling and go below the moving average level, then it would indicate penetration of the support (downward penetration) and signal a trend reversal.
Similarly, if a falling stock were to start rising and move above the moving average level, it would indicate penetration of the resistance (upward penetration) and, hence, signal a change in trend. Actiona. If a stock in an uptrend finds support at the moving average level and moves upward, then one can buy the stock, keeping the moving average level as the stop loss.b. If a stock in a downtrend encounters resistance at the moving average level and moves downwards, then one can sell the stock, keeping the moving average level as the stop loss.c. If there is a downward penetration, then it means that the stock has broken support and can fall further, cover your longs or go short.d. If there is an upward penetration, then it means that the stock has broken resistance and can go up, cover your shorts or go long.
� ARMS INDEX OR TRADING INDEX (TRIN)
A short-term technical analysis breadth indicator determines the buying and selling pressure in the market and the general breadth of the market. Basically, it is a comparison between the volume of advancing stocks and the volume of declining stocks and its strength.
Arms Index (TRIN) =
Illustration: On a particular day, say the number of stocks that are advancing are 910 with a total volume of 55 lakh whereas the number of stocks that are declining are 495 with a total volume of 24 lakh then:
The TRIN is 0.79. To gain a slightly short-to-medium term perspective, simple moving averages (explained earlier) are incorporated in the formula, where short-term traders use 7 to 21 days moving averages, whereas a medium to long-term trader can make use of a 55 or 100 day moving average.
InterpretationAn index of greater than 1 means that the average volume of stocks that fell is greater than the average volume of stocks that rose and conversely if the index is less than 1, it means that the average volume of stocks that rose is greater than the average volume of stocks that fell.
Generally, a TRIN value below 1 is considered a bullish sign whereas a TRIN value of greater than 1 is considered a bearish sign.
Readings above 1.5 or below 0.5 are considered extremely bearish or extremely bullish, respectively.
35+38+42+39+40+42+41 = 277 = 39.57 7
number of advancing stocks / number of declining stocks
(upside volume /downside volume)
TRIN = 910/495 = 1.83 = 0.79(5500000/2400000) 2.29
= Weighted Close (total) = 1132 = 40.42Weight (total) 28
b.Weighted Moving Average Here, weights are attached to the closing price. The common weights used are 1 for day one, 2 for day two, 3 for day three, and so on.
To calculate the weighted average, first the closing price for each day needs to be multiplied by its weight.
1234567
So, in the above example
35384239404241
ClosingPrice
Day
1234567
Weight
3576
126156200252287
WeightedClose
Total of the Weighted close = 35+76+126+156+200+252+287 = 1132
Total of the Weights = 1+2+3+4+5+6+7 = 28
Over a medium to long-term time period, Simple Moving Averages have proved to be much more effective than Weighted Moving Averages, when it comes to predicting upward or downward trend. And, hence, you would find most analysts using SMA more than anything else.
SMA of 10 to 30 days is used for short-term trend identification.SMA of 50 to 125 days is used for medium-term trend identification.SMA of 200 days to 12 months or 24 months is used for long-term trend identification.

It’s simplified...Beyond Market 19th Oct ’12 49
Actiona) If there is a single day fall in the markets, but the TRIN index suggests bullishness, chances are that the fall in the markets may not continue. Do not go short. b) Conversely, if there is a rise in the markets and the TRIN index also suggests bullishness, then chances are that the markets will go up at least in the short term. One can initiate a buy trade.c) When the TRIN is close to 1, it means that the market is undecided as to which way to go and can go either ways. Avoid initiating any trades on either side.
� TICK INDEX
It is the simplest short-term indicator but it has a sizeable chunk of loyal followers. Often this index is useful for only a couple of minutes and, hence, is most popular among day traders to view the overall market sentiment at a given point in time. It compares the number of upticks to the number of downticks in the markets at a single point in time.
Uptick: Each stock whose last trade is done at a price higher than its previous price should be marked as an Uptick.Downtick: Each stock whose last trade is done at a price lower than its previous price should be marked as a Downtick.
TICK = number of stocks trading with an uptick - number of stocks trading with a downtick
Tick Index = All upticks - All downticks.
InterpretationAny reading above +100 is considered a bullish sign and any reading below – 100 is considered as a bearish sign.
RSI = 100 – 1001 +RS
Actiona. Tick reading above +100, buy for a short term/intraday trade.b. Tick reading below -100, short sell for a short term/intraday trade.c. Reading between +100 and -100, suggests sideways movement, avoid trading.
� RSI (RELATIVE STRENGTH INDEX)
The RSI is a technical momentum indicator that compares the magnitude of recent gains to recent losses in an attempt to determine the overbought and oversold conditions of an asset. It was developed by Wells Wilder. It basically helps to determine the technical strength and weakness in a particular stock by comparing the days a stock closes up versus the days it closes down. Most people use 5-day, 7-day, 9-day, or 14-day period for calculating the RSI. RSI is a leading indicator.
Where, RS = Average of “up closes”/Average of “down closes”.
InterpretationIf the RSI range is from 1 to 100, RSI above 70 is considered overbought and RSI below 30 is considered oversold. If a stock is moving down but the RSI is rising or if a stock is moving up but the RSI is falling, it signals divergence and it means that a trend reversal is on the cards.
ActionSell when RSI is above 70 and buy when RSI is below 30.
� PIVOT POINT
A technical indicator used to determine the overall trend of the market for the next trading day based on today’s price action. On the subsequent day, trading above the
pivot point is thought to indicate a bullish sentiment, while trading below the pivot point indicates a bearish sentiment. It also helps to calculate support and resistance levels for the next trading day.
Once you master this indicator you too can give support and resistance levels for a stock or an index.
Basically you need three things to calculate the Pivot Point (P) and the support and resistance of a stock: Previous day’s High, Low, and Closing Price.
Formula
InterpretationIf the stock opens above the pivot point on the next trading day, then the trading bias is upwards. If the stock opens below the pivot point, then the trading bias is downwards.
R1 and S1 is the first Resistance and Support level, from where the price can reverse. If the market is near R2 or S2, it suggests that it is in the overbought or oversold zone respectively and a reversal is likely.
Action a.If a stock is at R1, then one can go short, keeping R2 as a stop loss.b.If a stock is at S1, then one can go long keeping S2 as a stop loss.
REMEMBERThe purpose of an indicator is to indicate. Investors/traders should not rely solely on indicators to guide their trade. Indicators should be studied in conjunction with other analytical tools such as Fundamental and Technical analysis and when all signals point in the same direction, one can trade with confidencE.
P (Pivot Point) = (High + Low + Close) / 3R1 (1st Resistance) = (2 x Pivot) – LowS1 (1st Support) = (2 x Pivot) – HighR2 (2nd Resistance) = P + (R1-S1)S2 (2nd Support) = P – (R1-S1)


