package ‘pearsonds’ - the comprehensive r archive … · package ‘pearsonds’ july 18, 2017...
TRANSCRIPT

Package ‘PearsonDS’July 18, 2017
Type Package
Title Pearson Distribution System
Version 1.1
Date 2017-07-17
Maintainer Martin Becker <[email protected]>
Description Implementation of the Pearson distribution system, including fullsupport for the (d,p,q,r)-family of functions for probability distributionsand fitting via method of moments and maximum likelihood method.
Suggests gsl
License GPL (>= 2)
LazyLoad yes
Encoding latin1
NeedsCompilation yes
Author Martin Becker [aut, cre],Stefan Klößner [aut]
Repository CRAN
Date/Publication 2017-07-17 22:51:33 UTC
R topics documented:PearsonDS-package . . . . . . . . . . . . . . . . . . . . . . . . . . . . . . . . . . . . . 2empMoments . . . . . . . . . . . . . . . . . . . . . . . . . . . . . . . . . . . . . . . . 3Pearson . . . . . . . . . . . . . . . . . . . . . . . . . . . . . . . . . . . . . . . . . . . 4Pearson0 . . . . . . . . . . . . . . . . . . . . . . . . . . . . . . . . . . . . . . . . . . . 5pearsonDiagram . . . . . . . . . . . . . . . . . . . . . . . . . . . . . . . . . . . . . . . 7pearsonFitM . . . . . . . . . . . . . . . . . . . . . . . . . . . . . . . . . . . . . . . . . 8pearsonFitML . . . . . . . . . . . . . . . . . . . . . . . . . . . . . . . . . . . . . . . . 9PearsonI . . . . . . . . . . . . . . . . . . . . . . . . . . . . . . . . . . . . . . . . . . . 10PearsonII . . . . . . . . . . . . . . . . . . . . . . . . . . . . . . . . . . . . . . . . . . 12PearsonIII . . . . . . . . . . . . . . . . . . . . . . . . . . . . . . . . . . . . . . . . . . 13PearsonIV . . . . . . . . . . . . . . . . . . . . . . . . . . . . . . . . . . . . . . . . . . 15
1

2 PearsonDS-package
pearsonMoments . . . . . . . . . . . . . . . . . . . . . . . . . . . . . . . . . . . . . . 18pearsonMSC . . . . . . . . . . . . . . . . . . . . . . . . . . . . . . . . . . . . . . . . 19PearsonV . . . . . . . . . . . . . . . . . . . . . . . . . . . . . . . . . . . . . . . . . . 21PearsonVI . . . . . . . . . . . . . . . . . . . . . . . . . . . . . . . . . . . . . . . . . . 22PearsonVII . . . . . . . . . . . . . . . . . . . . . . . . . . . . . . . . . . . . . . . . . 24
Index 27
PearsonDS-package Pearson Distribution System
Description
Implementation of the d,p,q,r function family, calculation of moments, and fitting via (empirical)moment matching as well as maximum likelihood method for the Pearson distribution system.
Warning
If at all possible, package gsl should be installed. In this case, the functions for Pearson type IVdistributions make use of lngamma_complex (see Gamma). If package gsl is not installed, somecalculations for Pearson type IV distributions with (more or less) extreme parameters (ie, big nuand/or m) may slow down by factors of more than 1000.
Author(s)
Martin Becker <[email protected]> and Stefan Klößner <[email protected]>
Maintainer: Martin Becker <[email protected]>
References
[1] Abramowitz, M. and I. A. Stegun (1972) Handbook of mathematical functions, National Bureauof Standards, Applied Mathematics Series - 55, Tenth Printing, Washington D.C.
[2] Heinrich, J. (2004) A Guide to the Pearson Type IV Distribution, Univ. Pennsylvania, Philadel-phia, Tech. Rep. CDF/Memo/Statistics/Public/6820 http://www-cdf.fnal.gov/physics/statistics/notes/cdf6820_pearson4.pdf
[3] Hida, Y., X. S. Li and D. H. Bailey (2000) Algorithms for quad-double precision floating pointarithmetic, Lawrence Berkeley National Laboratory. Paper LBNL-48597.
[4] Johnson, N. L., Kotz, S. and Balakrishnan, N. (1994) Continuous Univariate Distributions, Vol.1, Wiley Series in Probability and Mathematical Statistics, Wiley
[5] Johnson, N. L., Kotz, S. and Balakrishnan, N. (1994) Continuous Univariate Distributions, Vol.2, Wiley Series in Probability and Mathematical Statistics, Wiley
[6] Willink, R. (2008) A Closed-form Expression for the Pearson Type IV Distribution Function,Aust. N. Z. J. Stat. 50 (2), pp. 199-205
empMoments 3
See Also
Pearson for d,p,q,r function family for Pearson distributions, pearsonFitM and pearsonFitMLfor fitting Pearson distributions, pearsonMSC for model selection, pearsonMoments for calculationof (first four) moments.
Examples
## see documentation of individual functions
empMoments Empirical Moments
Description
Calculates the first four empirical moments (mean, variance, skewness, kurtosis) of a numeric vec-tor.
Usage
empMoments(x)
Arguments
x (numeric) vector containing the data set.
Value
Named vector of length 4 containing mean, variance, skewness and kurtosis (in this order).
Author(s)
Martin Becker <[email protected]>
See Also
PearsonDS-package
Examples
## Generate sample with given (theoretical) momentsDATA <- rpearson(25000,moments=c(mean=1,variance=2,skewness=1,kurtosis=5))## Calculate corresponding empirical momentsempMoments(DATA)
4 Pearson
Pearson The Pearson Distribution System
Description
Density, distribution function, quantile function and random generation for the Pearson distributionsystem.
Usage
dpearson(x, params, moments, log = FALSE, ...)
ppearson(q, params, moments, lower.tail = TRUE, log.p = FALSE, ...)
qpearson(p, params, moments, lower.tail = TRUE, log.p = FALSE, ...)
rpearson(n, params, moments, ...)
Arguments
x, q vector of quantiles.
p vector of probabilities.
n number of observations.
params vector/list of parameters for Pearson distribution. First entry gives type of dis-tribution (0 for type 0, 1 for type I, ..., 7 for type VII), remaining entries givedistribution parameters (depending on distribution type).
moments optional vector/list of mean, variance, skewness, kurtosis (not excess kurtosis).Overrides params with corresponding pearson distribution, if given.
log, log.p logical; if TRUE, probabilities p are given as log(p).
lower.tail logical; if TRUE, probabilities are P [X ≤ x], otherwise, P [X > x].
... further parameters for underlying functions (currently only used for distributionsof type IV).
Details
These are the wrapper functions for the (d,p,q,r)-functions of the Pearson distribution system sub-classes.
Value
dpearson gives the density, ppearson gives the distribution function, qpearson gives the quantilefunction, and rpearson generates random deviates.

Pearson0 5
Author(s)
Martin Becker <[email protected]>
See Also
PearsonDS-package, Pearson0, PearsonI, PearsonII, PearsonIII, PearsonIV, PearsonV, PearsonVI,PearsonVII, pearsonFitM, pearsonFitML, pearsonMSC
Examples
## Define moments of distributionmoments <- c(mean=1,variance=2,skewness=1,kurtosis=5)## Generate some random variatesrpearson(5,moments=moments)## evaluate distribution functionppearson(seq(-2,3,by=1),moments=moments)## evaluate density functiondpearson(seq(-2,3,by=1),moments=moments)## evaluate quantile functionqpearson(seq(0.1,0.9,by=0.2),moments=moments)
Pearson0 The Pearson Type 0 (aka Normal) Distribution
Description
Density, distribution function, quantile function and random generation for the Pearson type 0 (akaNormal) distribution.
Usage
dpearson0(x, mean, sd, params, log = FALSE)
ppearson0(q, mean, sd, params, lower.tail = TRUE, log.p = FALSE)
qpearson0(p, mean, sd, params, lower.tail = TRUE, log.p = FALSE)
rpearson0(n, mean, sd, params)
Arguments
x, q vector of quantiles.
p vector of probabilities.
n number of observations.
mean location parameter (and expectation)
sd scale parameter (and standard deviation)

6 Pearson0
params optional vector/list containing distribution parameters mean and sd (in this or-der!). Overrides parameters mean and sd, if given.
log, log.p logical; if TRUE, probabilities p are given as log(p).
lower.tail logical; if TRUE, probabilities are P [X ≤ x], otherwise, P [X > x].
Details
Distributions of type 0 have been added to the Pearson Distribution system in order to have thenormal distributions not only nested as limits of other distribution types. The functions are onlywrappers for dnorm, pnorm, qnorm and rnorm contained in package stats.
Value
dpearson0 gives the density, ppearson0 gives the distribution function, qpearson0 gives the quan-tile function, and rpearson0 generates random deviates.
Author(s)
Martin Becker <[email protected]>
References
See the references in Normal.
See Also
Normal, PearsonDS-package, Pearson
Examples
## define Pearson type 0 parameter set with mean=-1, sd=2p0pars <- list(mean=-1, sd=2)## calculate probability density functiondpearson0(-4:1,params=p0pars)## calculate cumulative distribution functionppearson0(-4:1,params=p0pars)## calculate quantile functionqpearson0(seq(0.1,0.9,by=0.2),params=p0pars)## generate random numbersrpearson0(5,params=p0pars)

pearsonDiagram 7
pearsonDiagram Regions of Pearson Distribution Types
Description
2D-Plot of the regions for the different types of Pearson distributions, depending on (squared) skew-ness and kurtosis.
Usage
pearsonDiagram(max.skewness = sqrt(14), max.kurtosis = 24,squared.skewness = TRUE, lwd = 2, legend = TRUE,n = 301)
Arguments
max.skewness maximal value for the skewness.
max.kurtosis maximal value for the kurtosis (not excess kurtosis!).squared.skewness
plot squared skewness on x-axis (default: TRUE)?
lwd line width for distributions of type II, III, V, VII.
legend include legend in the plot (default: TRUE)?
n number of points for curve.
Details
The label of the x-axis is β1 for squared skewness and√β1 for regular skewness. The label of the
y-axis is β2.
Value
Nothing useful. Function called for its side-effects.
Author(s)
Martin Becker <[email protected]> and Stefan Klößner <[email protected]>
References
[1] Johnson, N. L., Kotz, S. and Balakrishnan, N. (1994) Continuous Univariate Distributions, Vol.1, Wiley Series in Probability and Mathematical Statistics, Wiley
See Also
PearsonDS-package

8 pearsonFitM
Examples
## Show me the regions for the different distribution types!pearsonDiagram()
pearsonFitM Method of Moments Estimator for Pearson Distributions
Description
This function calculates the method of moments estimator for Pearson distribution, ie, it generatesa Pearson distribution with moments exactly (up to rounding errors) matching the input momentsmean, variance, skewness and kurtosis.
Usage
pearsonFitM(mean, variance, skewness, kurtosis, moments)
Arguments
mean target mean.
variance target variance.
skewness target skewness.
kurtosis target kurtosis (not excess kurtosis!).
moments optional vector/list of mean, variance, skewness, kurtosis (not excess kurtosis)in this order. Overrides all other input parameters, if given.
Value
List of parameters for Pearson distribution. First entry gives type of distribution (0 for type 0, 1 fortype I, ..., 7 for type VII), remaining entries give distribution parameters (depending on distributiontype).
Author(s)
Martin Becker <[email protected]>
References
[1] Johnson, N. L., Kotz, S. and Balakrishnan, N. (1994) Continuous Univariate Distributions, Vol.1, Wiley Series in Probability and Mathematical Statistics, Wiley
[2] Johnson, N. L., Kotz, S. and Balakrishnan, N. (1994) Continuous Univariate Distributions, Vol.2, Wiley Series in Probability and Mathematical Statistics, Wiley
See Also
PearsonDS-package, Pearson, pearsonFitML, pearsonMoments, pearsonMSC
pearsonFitML 9
Examples
## Define moments of distributionmoments <- c(mean=1,variance=2,skewness=1,kurtosis=5)## find Pearson distribution with these parametersppar <- pearsonFitM(moments=moments)print(unlist(ppar))## check momentspearsonMoments(params=ppar)
pearsonFitML Maximum Likelihood Estimation of Pearson Distributions
Description
This function tries to find the Maximum Likelihood estimator within the Pearson distribution sys-tem. ML estimation is done for all sub-classes of the distribution system via numerical optimization(with nlminb). The sub-class with the optimal likelihood function value and the corresponding pa-rameters are returned.
Usage
pearsonFitML(x, ...)
Arguments
x empirical data (numerical vector) for MLE.
... parameters for nlminb.
Details
Starting values for each sub-class are found in a three-step procedure. First, the empirical momentsof the input vector are calculated. In the second step, the moments are altered, such that the momentrestrictions for the current sub-class are fulfilled (if necessary), and the method of moments estima-tor is calculated to obtain starting values for the optimizer. In the last step, the starting values areadjusted (if necessary) in order to assure that the whole sample lies in the support of the distribution.
Value
List of parameters for Pearson distribution. First entry gives type of distribution (0 for type 0, 1 fortype I, ..., 7 for type VII), remaining entries give distribution parameters (depending on distributiontype).
Note
The implementation is VERY preliminary (and slow). No analytical results are used, ie. no analyt-ical solutions for ML estimators and no analytical gradients. Most of the distribution types (0, II,III, V, VII) should rather be neglected (for speed reasons), because they will contain the MLE withprobability of 0.
10 PearsonI
Author(s)
Martin Becker <[email protected]>
References
[1] Johnson, N. L., Kotz, S. and Balakrishnan, N. (1994) Continuous Univariate Distributions, Vol.1, Wiley Series in Probability and Mathematical Statistics, Wiley
[2] Johnson, N. L., Kotz, S. and Balakrishnan, N. (1994) Continuous Univariate Distributions, Vol.2, Wiley Series in Probability and Mathematical Statistics, Wiley
See Also
PearsonDS-package, Pearson, pearsonFitM, pearsonMSC, pearsonMoments
Examples
## Generate sampleDATA <- rpearson(1000,moments=c(mean=1,variance=2,skewness=1,kurtosis=5))## find Pearson distribution with these parametersppar <- pearsonFitML(DATA)print(unlist(ppar))## compare with method of moments estimatorprint(unlist(pearsonFitM(moments=empMoments(DATA))))
PearsonI The Pearson Type I (aka Beta) Distribution
Description
Density, distribution function, quantile function and random generation for the Pearson type I (akaBeta) distribution.
Usage
dpearsonI(x, a, b, location, scale, params, log = FALSE)
ppearsonI(q, a, b, location, scale, params, lower.tail = TRUE,log.p = FALSE)
qpearsonI(p, a, b, location, scale, params, lower.tail = TRUE,log.p = FALSE)
rpearsonI(n, a, b, location, scale, params)

PearsonI 11
Arguments
x, q vector of quantiles.
p vector of probabilities.
n number of observations.
a first shape parameter of Pearson type I distribution.
b second shape parameter of Pearson type I distribution.
location location parameter of Pearson type I distribution.
scale scale parameter of Pearson type I distribution.
params vector/list of length 4 containing parameters a, b, location, scale for Pearsontype I distribution (in this order!).
log, log.p logical; if TRUE, probabilities p are given as log(p).
lower.tail logical; if TRUE, probabilities are P [X ≤ x], otherwise, P [X > x].
Details
Essentially, Pearson type I distributions are (location-scale transformations of) Beta distributions,the above functions are thus simple wrappers for dbeta, pbeta, qbeta and rbeta contained inpackage stats. The probability density function with parameters a, b, scale= s and location= λis given by
f(x) =Γ(a+ b)
Γ(a)Γ(b)
(x− λs
)a−1(1− x− λ
s
)b−1
for a > 0, b > 0, s 6= 0, 0 < x−λs < 1.
Value
dpearsonI gives the density, ppearsonI gives the distribution function, qpearsonI gives the quan-tile function, and rpearsonI generates random deviates.
Note
Negative values for scale are not excluded, albeit negative skewness is usually obtained by switch-ing a and b (such that a>b) and not by using negative values for scale (and a<b).
Author(s)
Martin Becker <[email protected]>
References
See the references in Beta.
See Also
Beta, PearsonDS-package, Pearson
12 PearsonII
Examples
## define Pearson type I parameter set with a=2, b=3, location=1, scale=2pIpars <- list(a=2, b=3, location=1, scale=2)## calculate probability density functiondpearsonI(seq(1,3,by=0.5),params=pIpars)## calculate cumulative distribution functionppearsonI(seq(1,3,by=0.5),params=pIpars)## calculate quantile functionqpearsonI(seq(0.1,0.9,by=0.2),params=pIpars)## generate random numbersrpearsonI(5,params=pIpars)
PearsonII The Pearson Type II (aka Symmetric Beta) Distribution
Description
Density, distribution function, quantile function and random generation for the Pearson type II (akasymmetric Beta) distribution.
Usage
dpearsonII(x, a, location, scale, params, log = FALSE)
ppearsonII(q, a, location, scale, params, lower.tail = TRUE,log.p = FALSE)
qpearsonII(p, a, location, scale, params, lower.tail = TRUE,log.p = FALSE)
rpearsonII(n, a, location, scale, params)
Arguments
x, q vector of quantiles.
p vector of probabilities.
n number of observations.
a shape parameter of Pearson type II distribution.
location location parameter of Pearson type II distribution.
scale scale parameter of Pearson type II distribution.
params vector/list of length 3 containing parameters a, location, scale for Pearsontype II distribution (in this order!).
log, log.p logical; if TRUE, probabilities p are given as log(p).
lower.tail logical; if TRUE, probabilities are P [X ≤ x], otherwise, P [X > x].

PearsonIII 13
Details
Essentially, Pearson type II distributions are (location-scale transformations of) symmetric Betadistributions, the above functions are thus simple wrappers for dbeta, pbeta, qbeta and rbetacontained in package stats. The probability density function with parameters a, scale= s andlocation= λ is given by
f(x) =Γ(2a)
Γ(a)2
(x− λs·(
1− x− λs
))a−1
for a > 0, s 6= 0, 0 < x−λs < 1.
Value
dpearsonII gives the density, ppearsonII gives the distribution function, qpearsonII gives thequantile function, and rpearsonII generates random deviates.
Author(s)
Martin Becker <[email protected]>
References
See the references in Beta.
See Also
Beta, PearsonDS-package, Pearson
Examples
## define Pearson type II parameter set with a=2, location=1, scale=2pIIpars <- list(a=2, location=1, scale=2)## calculate probability density functiondpearsonII(seq(1,3,by=0.5),params=pIIpars)## calculate cumulative distribution functionppearsonII(seq(1,3,by=0.5),params=pIIpars)## calculate quantile functionqpearsonII(seq(0.1,0.9,by=0.2),params=pIIpars)## generate random numbersrpearsonII(5,params=pIIpars)
PearsonIII The Pearson Type III (aka Gamma) Distribution
Description
Density, distribution function, quantile function and random generation for the Pearson type III (akaGamma) distribution.

14 PearsonIII
Usage
dpearsonIII(x, shape, location, scale, params, log = FALSE)
ppearsonIII(q, shape, location, scale, params, lower.tail = TRUE,log.p = FALSE)
qpearsonIII(p, shape, location, scale, params, lower.tail = TRUE,log.p = FALSE)
rpearsonIII(n, shape, location, scale, params)
Arguments
x, q vector of quantiles.
p vector of probabilities.
n number of observations.
shape shape parameter of Pearson type III distribution.
location location parameter of Pearson type III distribution.
scale scale parameter of Pearson type III distribution.
params vector/list of length 3 containing parameters shape, location, scale for Pear-son type III distribution (in this order!).
log, log.p logical; if TRUE, probabilities p are given as log(p).
lower.tail logical; if TRUE, probabilities are P [X ≤ x], otherwise, P [X > x].
Details
Essentially, the above functions are wrappers for dgamma, pgamma, qgamma and rgamma containedin package stats. As a minor (but important) extension, negative scale parameters (which reflectthe distribution at location) are permitted to allow for negative skewness. The probability densityfunction with parameters shape= a, scale= s and location= λ is thus given by
f(x) =1
|s|aΓ(a)|x− λ|a−1e−
x−λs
for s 6= 0, a > 0 and x−λs ≥ 0.
Value
dpearsonIII gives the density, ppearsonIII gives the distribution function, qpearsonIII givesthe quantile function, and rpearsonIII generates random deviates.
Author(s)
Martin Becker <[email protected]>

PearsonIV 15
References
See the references in GammaDist.
See Also
GammaDist, PearsonDS-package, Pearson
Examples
## define Pearson type III parameter set with shape=3, location=1, scale=-2pIIIpars <- list(shape=3, location=1, scale=-0.5)## calculate probability density functiondpearsonIII(-4:1,params=pIIIpars)## calculate cumulative distribution functionppearsonIII(-4:1,params=pIIIpars)## calculate quantile functionqpearsonIII(seq(0.1,0.9,by=0.2),params=pIIIpars)## generate random numbersrpearsonIII(5,params=pIIIpars)
PearsonIV The Pearson Type IV Distribution
Description
Density, distribution function, quantile function and random generation for the Pearson type IVdistribution.
Usage
dpearsonIV(x, m, nu, location, scale, params, log = FALSE)
ppearsonIV(q, m, nu, location, scale, params, lower.tail = TRUE,log.p = FALSE, tol = 1e-08, ...)
qpearsonIV(p, m, nu, location, scale, params, lower.tail = TRUE,log.p = FALSE, tol = 1e-08, ...)
rpearsonIV(n, m, nu, location, scale, params)
Arguments
x, q vector of quantiles.
p vector of probabilities.
n number of observations.
m first shape parameter of Pearson type IV distribution.

16 PearsonIV
nu second shape parameter (skewness) of Pearson type IV distribution.
location location parameter of Pearson type IV distribution.
scale scale parameter of Pearson type IV distribution.
params vector/list of length 4 containing parameters m, nu, location, scale for Pearsontype IV distribution (in this order!).
log, log.p logical; if TRUE, probabilities p are given as log(p).
lower.tail logical; if TRUE, probabilities are P [X ≤ x], otherwise, P [X > x].
tol relative tolerance for evaluation of hypergeometric function 2F1 (ppearsonIV)or absolute target q-error for Newton method (qpearsonIV).
... further parameters for underlying hypergeometric function.
Details
The Pearson type IV distribution with location parameter location= λ, scale parameter scale= a,and shape parameters m and ν can be obtained by its probability density function
p(x) =
∣∣∣Γ(m+ ν2 i)
Γ(m)
∣∣∣2aB(m− 1
2 ,12 )
[1 +
(x− λa
)2]−m
e−νarctan( x−λa )
for a > 0, m > 12 , ν 6= 0 (ν = 0 corresponds to the Pearson type VII distribution family).
The normalizing constant, which involves the complex Gamma function, is calculated with lngamma_complex(see Gamma) of package gsl, if package gsl is installed. Section 5.1 of [2] contains an algorithm (Ccode) for the calculation of the normalizing constant, which is used otherwise, but this will be veryslow for large absolute values of ν.
The generation of random numbers (rpearsonIV) uses the C code from section 7 of [2]. It is (thus)restricted to distributions with m > 1.
For the cumulative distribution function (ppearsonIV), numerical integration of the density func-tion is used, if package gsl is not available. If package gsl is installed, three different methods areused, depending on the parameter constellation (the corresponding parameter regions were obtainedby comprehensive benchmarks):
• numerical integration of the density function
• cdf representation of Heinrich [2]
• cdf representation of Willink [4]
The hypergeometric functions involved in the latter two representations are approximated via partialsums of the corresponding series (see [1], 15.1.1, p. 556). Depending on the parameter constella-tion, transformation 15.3.5 of [1] (p. 559) is applied for Heinrich’s method. The evaluation ofthe partial sums is first carried out in (ordinary) double arithmetic. If cancellation reduces accuracybeyond tol, the evaluation is redone in double-double arithmetics. If cancellation still reduces accu-racy beyond tol, the evaluation is again redone in quad-double arithmetic. Code for double-doubleand quad-double arithmetics is based on [3]. For Willink’s representation, the hypergeometric func-tion in the denominator of R in equation (10) is evaluated via complex gamma functions (see [1],15.1.20, p. 556), which is fast and much more stable. A warning is issued if the approximation of

PearsonIV 17
the hypergeometric function seems to fail (which should not happen, since numerical integrationshould be carried out for critical parameter constellations).
The quantile function (qpearsonIV) is obtained via Newton’s method. The Newton iteration beginsin the (single) mode of the distribution, which is easily calculated (see [2], section 3). Since themode of the distribution is the only inflection point of the cumulative distribution function, con-vergence is guaranteed. The Newton iteration stops when the target q-error is reached (or after amaximum of 30 iterations).
Value
dpearsonIV gives the density, ppearsonIV gives the distribution function, qpearsonIV gives thequantile function, and rpearsonIV generates random deviates.
Warning
If at all possible, package gsl should be installed. Otherwise, calculations for distributions with(more or less) extreme parameters may slow down by factors of more than 1000 and/or may becomeunstable.
Note
Many calculations are done in logarithms to avoid IEEE 754 underflow/overflow issues.
The description of quad-double arithmetics in [3] contains minor errors: in algorithm 9 (p. 6), lines9 and 10 should be interchanged; in algorithm 14 (p. 10), k < 2 should be replaced with k < 3(line 10) and k < 3 should be replaced with k < 4 (line 11).
Author(s)
Martin Becker <[email protected]> and Stefan Klößner <[email protected]>
References
[1] Abramowitz, M. and I. A. Stegun (1972) Handbook of mathematical functions, National Bureauof Standards, Applied Mathematics Series - 55, Tenth Printing, Washington D.C.
[2] Heinrich, J. (2004) A Guide to the Pearson Type IV Distribution, Univ. Pennsylvania, Philadel-phia, Tech. Rep. CDF/Memo/Statistics/Public/6820 http://www-cdf.fnal.gov/physics/statistics/notes/cdf6820_pearson4.pdf
[3] Hida, Y., X. S. Li and D. H. Bailey (2000) Algorithms for quad-double precision floating pointarithmetic, Lawrence Berkeley National Laboratory. Paper LBNL-48597.
[4] Willink, R. (2008) A Closed-form Expression for the Pearson Type IV Distribution Function,Aust. N. Z. J. Stat. 50 (2), pp. 199-205
See Also
PearsonDS-package, Pearson

18 pearsonMoments
Examples
## define Pearson type IV parameter set with m=5.1, nu=3, location=0.5, scale=2pIVpars <- list(m=5.1, nu=3, location=0.5, scale=2)## calculate probability density functiondpearsonIV(-2:2,params=pIVpars)## calculate cumulative distribution functionppearsonIV(-2:2,params=pIVpars)## calculate quantile functionqpearsonIV(seq(0.1,0.9,by=0.2),params=pIVpars)## generate random numbersrpearsonIV(5,params=pIVpars)
pearsonMoments Moments of Pearson Distribution
Description
Calculates the first four moments (mean, variance, skewness, kurtosis) of a Pearson distribution.
Usage
pearsonMoments(params, moments)
Arguments
params vector/list of parameters for Pearson distribution. First entry gives type of dis-tribution (0 for type 0, 1 for type I, ..., 7 for type VII), remaining entries givedistribution parameters (depending on distribution type).
moments optional vector/list of mean, variance, skewness, kurtosis (not excess kurtosis).Overrides params with corresponding pearson distribution, if given.
Value
Named vector of length 4 containing mean, variance, skewness and kurtosis (in this order).
Note
Optional parameter moments is merely for testing purposes. Of course, pearsonMoments shouldreproduce its input (when neglecting rounding errors) if moments is given.
kurtosis is the kurtosis of the distribution, not the excess kurtosis!
Author(s)
Martin Becker <[email protected]>

pearsonMSC 19
References
[1] Johnson, N. L., Kotz, S. and Balakrishnan, N. (1994) Continuous Univariate Distributions, Vol.1, Wiley Series in Probability and Mathematical Statistics, Wiley
[2] Johnson, N. L., Kotz, S. and Balakrishnan, N. (1994) Continuous Univariate Distributions, Vol.2, Wiley Series in Probability and Mathematical Statistics, Wiley
See Also
PearsonDS-package, Pearson0, PearsonI, PearsonII, PearsonIII, PearsonIV, PearsonV, PearsonVI,PearsonVII,
Examples
## Define moments of distributionmoments <- c(mean=1,variance=2,skewness=1,kurtosis=5)## Are the moments reproduced?pearsonMoments(moments=moments)
pearsonMSC Log-Likelihoods and Model Selection Criteria for different Pearsondistribution types
Description
This function performs (as pearsonFitML) an ML estimation for all sub-classes of the Pearsondistribution system via numerical optimization (with nlminb) for model selection purposes. Apartfrom calculating the log-likelihood values as well as the values of some common model selectioncriteria (pure ML, AIC, AICc, BIC, HQC) for the different sub-classes, model selection is done foreach of the criteria and the parameter estimates for each distribution sub-class are returned.
Usage
pearsonMSC(x, ...)
Arguments
x empirical data (numerical vector) for MLE.
... parameters for nlminb.
Details
For the ML estimation, see the details of pearsonFitML. The considered Model Selection Criteria(MSCs) are ’pure’ Maximum Likelihood (ML), Akaike Information Criterion (AIC), corrected AIC(AICc), Bayes Information Criterion (BIC, also known as Schwarz Criterion), and Hannan-Quinn-Criterion (HQC). The definitions used for the different MSCs are
• for ML: −2 · lnL(θ)

20 pearsonMSC
• for AIC: −2 · lnL(θ) + 2 · k• for AICc: −2 · lnL(θ) + 2 · k · n
n−k−1
• for BIC: −2 · lnL(θ) + k · ln(n)
• for HQC: −2 · lnL(θ) + 2 · k · ln(ln(n))
where lnL(θ) denotes the log-Likelihood, n denotes the number of observations (ie, the length ofx) and k denotes the number of parameters of the distribution (sub-class).
The best model minimizes the corresponding MSC function values.
Value
A list containing
MSCs a matrix with rows ML, AIC, AICc, SIC, HQC for the different model selectioncriteria and columns 0, I, II, III, IV, V, VI,VII for the different distributiontypes containing the values of the criterion/distribution type-combinations.
logLik a vector with the log-likelihood values for the different distribution types.FittedDistributions
a list with vectors of the parameter estimates (preceeded by the distribution typenumber) for the 8 Pearson distribution sub-classes.
Best a list with components ML, AIC, AICc, SIC, and HQC containing the ’best’ dis-tributions (distribution type number and parameter estimates) for the differentModel Selection Criteria.
Note
The implementation is still preliminary (and slow). No analytical results are used, ie. no analyticalsolutions for ML estimators and no analytical gradients.
Author(s)
Martin Becker <[email protected]>
See Also
PearsonDS-package, Pearson, pearsonFitML
Examples
## Generate sampleDATA <- rpearson(500,moments=c(mean=1,variance=2,skewness=1,kurtosis=5))## Call pearsonMSC for model selectionMSC <- pearsonMSC(DATA,control=list(iter.max=1e5,eval.max=1e5))## log-Likelihood values for all distribution sub-classesprint(MSC$logLik)## Values for all MSCs and distribution sub-classesprint(MSC$MSCs)## Model selection for all MSCsprint(MSC$Best)

PearsonV 21
PearsonV The Pearson Type V (aka Inverse Gamma) Distribution
Description
Density, distribution function, quantile function and random generation for the Pearson type V (akaInverse Gamma) distribution.
Usage
dpearsonV(x, shape, location, scale, params, log = FALSE)
ppearsonV(q, shape, location, scale, params, lower.tail = TRUE,log.p = FALSE)
qpearsonV(p, shape, location, scale, params, lower.tail = TRUE,log.p = FALSE)
rpearsonV(n, shape, location, scale, params)
Arguments
x, q vector of quantiles.
p vector of probabilities.
n number of observations.
shape shape parameter of Pearson type V distribution.
location location parameter of Pearson type V distribution.
scale scale parameter of Pearson type V distribution.
params vector/list of length 3 containing parameters shape, location, scale for Pear-son type V distribution (in this order!).
log, log.p logical; if TRUE, probabilities p are given as log(p).
lower.tail logical; if TRUE, probabilities are P [X ≤ x], otherwise, P [X > x].
Details
The Pearson type V distributions are essentially Inverse Gamma distributions. Thus, all functionsare implemented via calls to the corresponding functions for Gamma distributions, ie. dgamma,pgamma, qgamma and rgamma in package stats. Negative scale parameters (which reflect thedistribution at location) are permitted to allow for negative skewness. The probability densityfunction with parameters shape= a, scale= s and location= λ is given by
f(x) =|s|a
Γ(a)|x− λ|−a−1e−
sx−λ
for s 6= 0, a > 0 and sx−λ > 0.

22 PearsonVI
Value
dpearsonV gives the density, ppearsonV gives the distribution function, qpearsonV gives the quan-tile function, and rpearsonV generates random deviates.
Note
Since package version 0.98, the parameter scale corresponds to the usual scale parameter of theInverse Gamma distribution (not the reciprocal value, which was implemented [incorrectly!] untilpackage version 0.97).
Author(s)
Martin Becker <[email protected]>
References
See the references in GammaDist.
See Also
GammaDist, PearsonDS-package, Pearson
Examples
## define Pearson type V parameter set with shape=3, location=1, scale=-2pVpars <- list(shape=3, location=1, scale=-2)## calculate probability density functiondpearsonV(-4:1,params=pVpars)## calculate cumulative distribution functionppearsonV(-4:1,params=pVpars)## calculate quantile functionqpearsonV(seq(0.1,0.9,by=0.2),params=pVpars)## generate random numbersrpearsonV(5,params=pVpars)
PearsonVI The Pearson Type VI (aka Beta Prime) Distribution
Description
Density, distribution function, quantile function and random generation for the Pearson type VI (akaBeta prime) distribution.
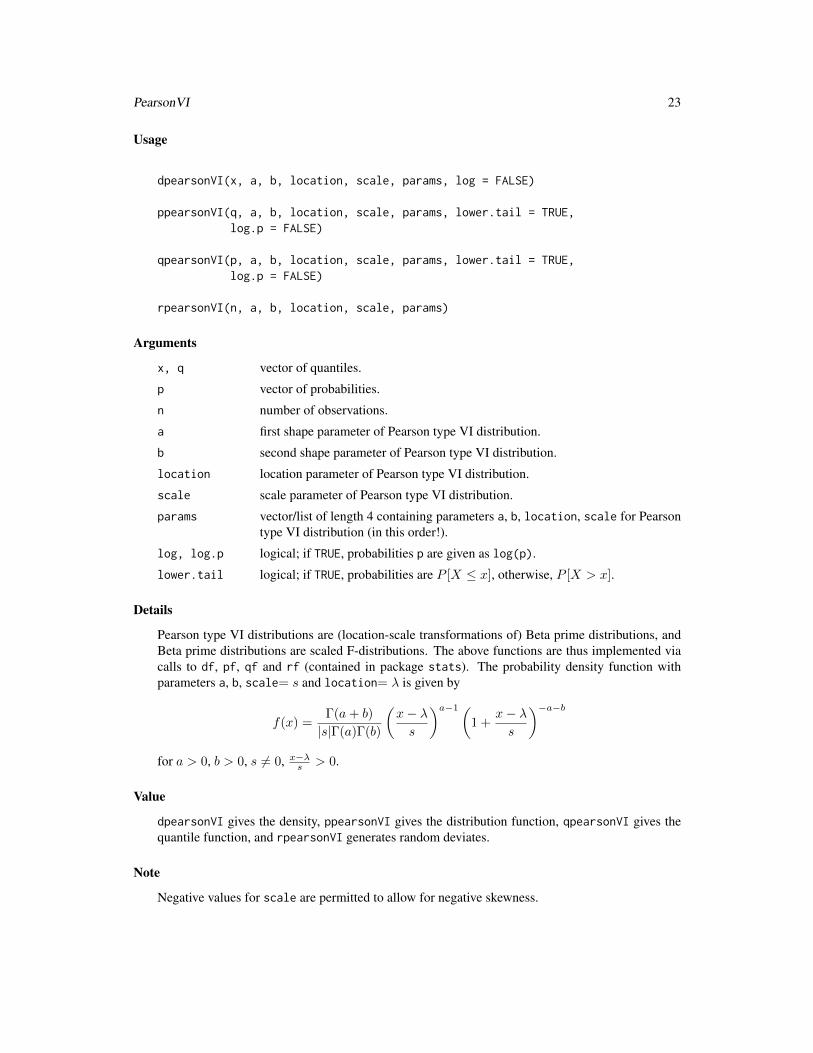
PearsonVI 23
Usage
dpearsonVI(x, a, b, location, scale, params, log = FALSE)
ppearsonVI(q, a, b, location, scale, params, lower.tail = TRUE,log.p = FALSE)
qpearsonVI(p, a, b, location, scale, params, lower.tail = TRUE,log.p = FALSE)
rpearsonVI(n, a, b, location, scale, params)
Arguments
x, q vector of quantiles.
p vector of probabilities.
n number of observations.
a first shape parameter of Pearson type VI distribution.
b second shape parameter of Pearson type VI distribution.
location location parameter of Pearson type VI distribution.
scale scale parameter of Pearson type VI distribution.
params vector/list of length 4 containing parameters a, b, location, scale for Pearsontype VI distribution (in this order!).
log, log.p logical; if TRUE, probabilities p are given as log(p).
lower.tail logical; if TRUE, probabilities are P [X ≤ x], otherwise, P [X > x].
Details
Pearson type VI distributions are (location-scale transformations of) Beta prime distributions, andBeta prime distributions are scaled F-distributions. The above functions are thus implemented viacalls to df, pf, qf and rf (contained in package stats). The probability density function withparameters a, b, scale= s and location= λ is given by
f(x) =Γ(a+ b)
|s|Γ(a)Γ(b)
(x− λs
)a−1(1 +
x− λs
)−a−b
for a > 0, b > 0, s 6= 0, x−λs > 0.
Value
dpearsonVI gives the density, ppearsonVI gives the distribution function, qpearsonVI gives thequantile function, and rpearsonVI generates random deviates.
Note
Negative values for scale are permitted to allow for negative skewness.

24 PearsonVII
Author(s)
Martin Becker <[email protected]>
References
See the references in FDist.
See Also
FDist, PearsonDS-package, Pearson
Examples
## define Pearson type VI parameter set with a=2, b=3, location=1, scale=2pVIpars <- list(a=2, b=3, location=1, scale=2)## calculate probability density functiondpearsonVI(seq(1,6,by=1),params=pVIpars)## calculate cumulative distribution functionppearsonVI(seq(1,6,by=1),params=pVIpars)## calculate quantile functionqpearsonVI(seq(0.1,0.9,by=0.2),params=pVIpars)## generate random numbersrpearsonVI(5,params=pVIpars)
PearsonVII The Pearson Type VII (aka Student’s t) Distribution
Description
Density, distribution function, quantile function and random generation for the Pearson type VII(aka Student’s t) distribution.
Usage
dpearsonVII(x, df, location, scale, params, log = FALSE)
ppearsonVII(q, df, location, scale, params, lower.tail = TRUE,log.p = FALSE)
qpearsonVII(p, df, location, scale, params, lower.tail = TRUE,log.p = FALSE)
rpearsonVII(n, df, location, scale, params)
PearsonVII 25
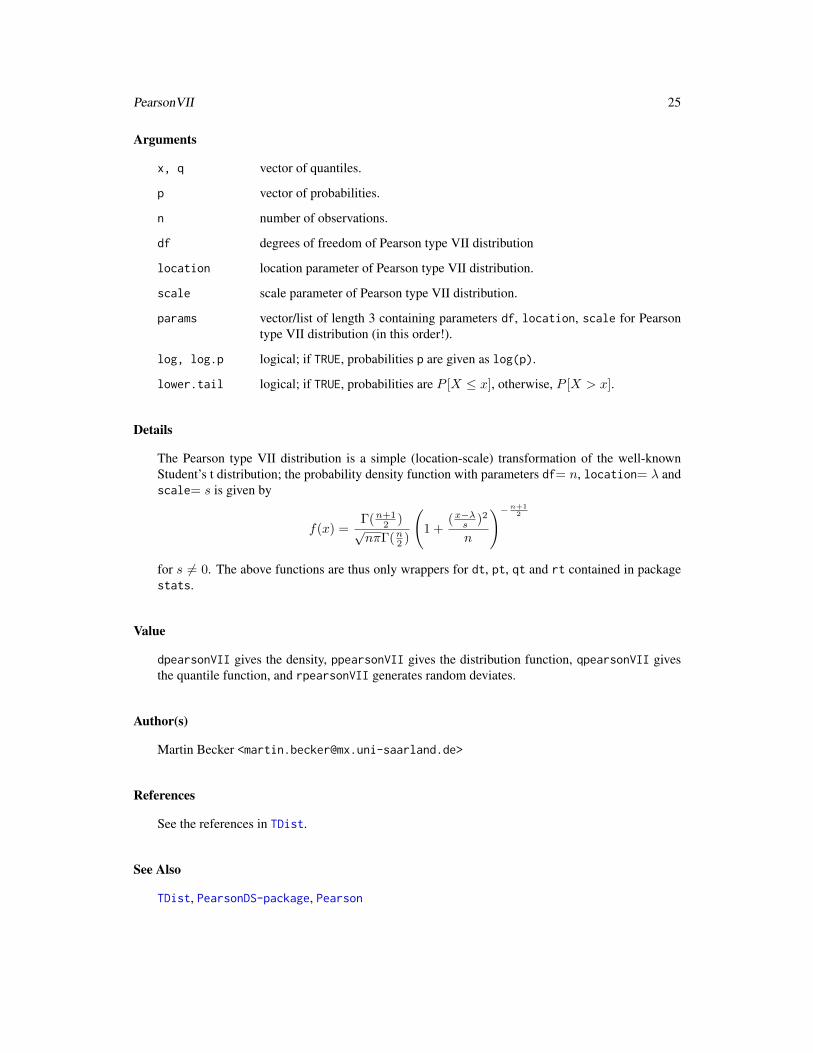
Arguments
x, q vector of quantiles.
p vector of probabilities.
n number of observations.
df degrees of freedom of Pearson type VII distribution
location location parameter of Pearson type VII distribution.
scale scale parameter of Pearson type VII distribution.
params vector/list of length 3 containing parameters df, location, scale for Pearsontype VII distribution (in this order!).
log, log.p logical; if TRUE, probabilities p are given as log(p).
lower.tail logical; if TRUE, probabilities are P [X ≤ x], otherwise, P [X > x].
Details
The Pearson type VII distribution is a simple (location-scale) transformation of the well-knownStudent’s t distribution; the probability density function with parameters df= n, location= λ andscale= s is given by
f(x) =Γ(n+1
2 )√nπΓ(n2 )
(1 +
(x−λs )2
n
)−n+12
for s 6= 0. The above functions are thus only wrappers for dt, pt, qt and rt contained in packagestats.
Value
dpearsonVII gives the density, ppearsonVII gives the distribution function, qpearsonVII givesthe quantile function, and rpearsonVII generates random deviates.
Author(s)
Martin Becker <[email protected]>
References
See the references in TDist.
See Also
TDist, PearsonDS-package, Pearson
26 PearsonVII
Examples
## define Pearson type VII parameter set with df=7, location=1, scale=1pVIIpars <- list(df=7, location=1, scale=1)## calculate probability density functiondpearsonVII(-2:4,params=pVIIpars)## calculate cumulative distribution functionppearsonVII(-2:4,params=pVIIpars)## calculate quantile functionqpearsonVII(seq(0.1,0.9,by=0.2),params=pVIIpars)## generate random numbersrpearsonVII(5,params=pVIIpars)

Index
∗Topic distributionempMoments, 3Pearson, 4Pearson0, 5pearsonDiagram, 7PearsonDS-package, 2pearsonFitM, 8pearsonFitML, 9PearsonI, 10PearsonII, 12PearsonIII, 13PearsonIV, 15pearsonMoments, 18pearsonMSC, 19PearsonV, 21PearsonVI, 22PearsonVII, 24
∗Topic packagePearsonDS-package, 2
Beta, 11, 13
curve, 7
dpearson (Pearson), 4dpearson0 (Pearson0), 5dpearsonI (PearsonI), 10dpearsonII (PearsonII), 12dpearsonIII (PearsonIII), 13dpearsonIV (PearsonIV), 15dpearsonV (PearsonV), 21dpearsonVI (PearsonVI), 22dpearsonVII (PearsonVII), 24
empMoments, 3
FDist, 24
Gamma, 2, 16GammaDist, 15, 22
nlminb, 9, 19Normal, 6
Pearson, 3, 4, 6, 8, 10, 11, 13, 15, 17, 20, 22,24, 25
Pearson0, 5, 5, 19pearsonDiagram, 7PearsonDS (PearsonDS-package), 2PearsonDS-package, 2pearsonFitM, 3, 5, 8, 10pearsonFitML, 3, 5, 8, 9, 19, 20PearsonI, 5, 10, 19PearsonII, 5, 12, 19PearsonIII, 5, 13, 19PearsonIV, 5, 15, 19pearsonMoments, 3, 8, 10, 18pearsonMSC, 3, 5, 8, 10, 19PearsonV, 5, 19, 21PearsonVI, 5, 19, 22PearsonVII, 5, 19, 24ppearson (Pearson), 4ppearson0 (Pearson0), 5ppearsonI (PearsonI), 10ppearsonII (PearsonII), 12ppearsonIII (PearsonIII), 13ppearsonIV (PearsonIV), 15ppearsonV (PearsonV), 21ppearsonVI (PearsonVI), 22ppearsonVII (PearsonVII), 24
qpearson (Pearson), 4qpearson0 (Pearson0), 5qpearsonI (PearsonI), 10qpearsonII (PearsonII), 12qpearsonIII (PearsonIII), 13qpearsonIV (PearsonIV), 15qpearsonV (PearsonV), 21qpearsonVI (PearsonVI), 22qpearsonVII (PearsonVII), 24
27

28 INDEX
rpearson (Pearson), 4rpearson0 (Pearson0), 5rpearsonI (PearsonI), 10rpearsonII (PearsonII), 12rpearsonIII (PearsonIII), 13rpearsonIV (PearsonIV), 15rpearsonV (PearsonV), 21rpearsonVI (PearsonVI), 22rpearsonVII (PearsonVII), 24
TDist, 25