package ‘formattable’ · 4 area arguments x a numeric vector. digits an integer to indicate the...
TRANSCRIPT

Package ‘formattable’August 29, 2016
Title Create 'Formattable' Data Structures
Version 0.2.0.1
Description Provides functions to create formattable vectors and data frames.'Formattable' vectors are printed with text formatting, and formattabledata frames are printed with multiple types of formatting in HTMLto improve the readability of data presented in tabular form rendered inweb pages.
Depends R (> 3.0.2)
Date 2016-08-05
Imports methods, htmltools, htmlwidgets, knitr, rmarkdown
License MIT + file LICENSE
LazyData true
URL https://renkun.me/formattable,
https://github.com/renkun-ken/formattable
BugReports https://github.com/renkun-ken/formattable/issues
ByteCompile TRUE
Suggests testthat, DT, shiny, covr
RoxygenNote 5.0.1
VignetteBuilder knitr
NeedsCompilation no
Author Kun Ren [aut, cre],Kenton Russell [aut]
Maintainer Kun Ren <[email protected]>
Repository CRAN
Date/Publication 2016-08-05 11:53:18
1

2 R topics documented:
R topics documented:
formattable-package . . . . . . . . . . . . . . . . . . . . . . . . . . . . . . . . . . . . 3accounting . . . . . . . . . . . . . . . . . . . . . . . . . . . . . . . . . . . . . . . . . . 3area . . . . . . . . . . . . . . . . . . . . . . . . . . . . . . . . . . . . . . . . . . . . . 4as.datatable . . . . . . . . . . . . . . . . . . . . . . . . . . . . . . . . . . . . . . . . . 5as.datatable.formattable . . . . . . . . . . . . . . . . . . . . . . . . . . . . . . . . . . . 5as.htmlwidget . . . . . . . . . . . . . . . . . . . . . . . . . . . . . . . . . . . . . . . . 6as.htmlwidget.formattable . . . . . . . . . . . . . . . . . . . . . . . . . . . . . . . . . 6color_bar . . . . . . . . . . . . . . . . . . . . . . . . . . . . . . . . . . . . . . . . . . 7color_text . . . . . . . . . . . . . . . . . . . . . . . . . . . . . . . . . . . . . . . . . . 8color_tile . . . . . . . . . . . . . . . . . . . . . . . . . . . . . . . . . . . . . . . . . . 9comma . . . . . . . . . . . . . . . . . . . . . . . . . . . . . . . . . . . . . . . . . . . . 9csscolor . . . . . . . . . . . . . . . . . . . . . . . . . . . . . . . . . . . . . . . . . . . 10currency . . . . . . . . . . . . . . . . . . . . . . . . . . . . . . . . . . . . . . . . . . . 10digits . . . . . . . . . . . . . . . . . . . . . . . . . . . . . . . . . . . . . . . . . . . . 11formattable . . . . . . . . . . . . . . . . . . . . . . . . . . . . . . . . . . . . . . . . . 12formattable.data.frame . . . . . . . . . . . . . . . . . . . . . . . . . . . . . . . . . . . 13formattable.Date . . . . . . . . . . . . . . . . . . . . . . . . . . . . . . . . . . . . . . 14formattable.default . . . . . . . . . . . . . . . . . . . . . . . . . . . . . . . . . . . . . 15formattable.factor . . . . . . . . . . . . . . . . . . . . . . . . . . . . . . . . . . . . . . 16formattable.logical . . . . . . . . . . . . . . . . . . . . . . . . . . . . . . . . . . . . . 16formattable.numeric . . . . . . . . . . . . . . . . . . . . . . . . . . . . . . . . . . . . . 17formattable.POSIXct . . . . . . . . . . . . . . . . . . . . . . . . . . . . . . . . . . . . 18formattable.POSIXlt . . . . . . . . . . . . . . . . . . . . . . . . . . . . . . . . . . . . 19formattableOutput . . . . . . . . . . . . . . . . . . . . . . . . . . . . . . . . . . . . . . 19formatter . . . . . . . . . . . . . . . . . . . . . . . . . . . . . . . . . . . . . . . . . . 20format_table . . . . . . . . . . . . . . . . . . . . . . . . . . . . . . . . . . . . . . . . . 21gradient . . . . . . . . . . . . . . . . . . . . . . . . . . . . . . . . . . . . . . . . . . . 23icontext . . . . . . . . . . . . . . . . . . . . . . . . . . . . . . . . . . . . . . . . . . . 24is.formattable . . . . . . . . . . . . . . . . . . . . . . . . . . . . . . . . . . . . . . . . 25normalize . . . . . . . . . . . . . . . . . . . . . . . . . . . . . . . . . . . . . . . . . . 25normalize_bar . . . . . . . . . . . . . . . . . . . . . . . . . . . . . . . . . . . . . . . . 26percent . . . . . . . . . . . . . . . . . . . . . . . . . . . . . . . . . . . . . . . . . . . . 26prefix . . . . . . . . . . . . . . . . . . . . . . . . . . . . . . . . . . . . . . . . . . . . 27proportion . . . . . . . . . . . . . . . . . . . . . . . . . . . . . . . . . . . . . . . . . . 27proportion_bar . . . . . . . . . . . . . . . . . . . . . . . . . . . . . . . . . . . . . . . 28qrank . . . . . . . . . . . . . . . . . . . . . . . . . . . . . . . . . . . . . . . . . . . . 28renderFormattable . . . . . . . . . . . . . . . . . . . . . . . . . . . . . . . . . . . . . . 29scientific . . . . . . . . . . . . . . . . . . . . . . . . . . . . . . . . . . . . . . . . . . . 29style . . . . . . . . . . . . . . . . . . . . . . . . . . . . . . . . . . . . . . . . . . . . . 30suffix . . . . . . . . . . . . . . . . . . . . . . . . . . . . . . . . . . . . . . . . . . . . 31vmap . . . . . . . . . . . . . . . . . . . . . . . . . . . . . . . . . . . . . . . . . . . . 31
Index 33

formattable-package 3
formattable-package The formattable package
Description
This package is designed for applying formatting on vectors and data frames to make data presen-tation easier, richer, more flexible and hopefully convey more information.
Details
Atomic vectors are basic units to store data. Some data can be read more easily with formatting.A numeric vector, for example, stores a group of percentage numbers yet still shows in the form oftypical floating numbers. This package provides functions to create data structures with predefinedformatting rules so that these objects stores the original data but are printed with formatting.
On the other hand, in a typical workflow of dynamic document production, knitr and rmarkdownare powerful tools to render documents with R code to different types of portable documents.
knitr package is able to render a RMarkdown document (markdown document with R code chunksto be executed sequentially) to Markdown document. rmarkdown calls pandoc to render markdowndocument to HTML web page. To put a table from a data.frame on the page, one may callknitr::kable to produce its markdown representation. By default the resulted table is in a plaintheme with no additional formatting. However, in some cases, additional formatting may helpclarify the information and make contrast of the data.
accounting Numeric vector with accounting format
Description
Numeric vector with accounting format
Usage
accounting(x, digits = 2L, format = "f", big.mark = ",", ...)
## Default S3 method:accounting(x, digits = 2L, format = "f", big.mark = ",",
...)
## S3 method for class 'character'accounting(x, digits = max(get_digits(x)), format = "f",big.mark = ",", ...)
4 area
Arguments
x a numeric vector.
digits an integer to indicate the number of digits of the percentage string.
format format type passed to formatC.
big.mark thousands separator
... additional parameters passed to formattable.
Examples
accounting(15320)accounting(-12500)accounting(c(1200, -3500, 2600), format = "d")accounting(c("123,23.50", "(123.243)"))
area Create an area to apply formatter
Description
Create an representation of two-dimenstional area to apply formatter function. The area can be oneor more columns, one or more rows, or an area of rows and columns.
Usage
area(row, col)
Arguments
row an expression of row range. If missing, TRUE is used instead.
col an expression of column range. If missing, TRUE is used instead.
Details
The function creates an area object to store the representation of row and column selector ex-pressions. When the function is called, the expressions and environment of row and columnare captured for format_table to evaluate within the context of the input data.frame, that is,rownames and colnames are defined in the context to be the indices of rows and columns, re-spectively. Therefore, the row names and column names are avaiable symbols when row andcol are evaluated, respectively, which makes it easier to specify range with names, for example,area(row = row1:row10, col = col1:col5).
See Also
format_table, formattable.data.frame

as.datatable 5
Examples
area(col = c("mpg", "cyl"))area(col = mpg:cyl)area(row = 1)area(row = 1:10, col = 5:10)area(1:10, col1:col5)
as.datatable Generic function to create an htmlwidget
Description
This function is a generic function to create an htmlwidget to allow HTML/JS from R in multiplecontexts.
Usage
as.datatable(x, ...)
Arguments
x an object.... arguments to be passed to datatable
Value
a datatable object
as.datatable.formattable
Convert formattable to a datatable htmlwidget
Description
Convert formattable to a datatable htmlwidget
Usage
## S3 method for class 'formattable'as.datatable(x, escape = FALSE, ...)
Arguments
x a formattable object to convertescape logical to escape HTML. The default is FALSE since it is expected that formatters
from formattable will produce HTML tags.... additional arguments passed to to datatable

6 as.htmlwidget.formattable
Value
a datatable object
as.htmlwidget Generic function to create an htmlwidget
Description
This function is a generic function to create an htmlwidget to allow HTML/JS from R in multiplecontexts.
Usage
as.htmlwidget(x, ...)
Arguments
x an object.
... arguments to be passed to methods.
Value
a htmlwidget object
as.htmlwidget.formattable
Convert formattable to an htmlwidget
Description
formattable was originally designed to work in rmarkdown environments. Conversion of a format-table to a htmlwidget will allow use in other contexts such as console, RStudio Viewer, and Shiny.
Usage
## S3 method for class 'formattable'as.htmlwidget(x, width = "100%", height = NULL, ...)
Arguments
x a formattable object to convert
width a valid CSS width
height a valid CSS height
... reserved for more parameters
color_bar 7
Value
a htmlwidget object
Examples
## Not run:library(formattable)# mtcars (mpg background in gradient: the higher, the redder)as.htmlwidget(
formattable(mtcars, list(mpg = formatter("span",style = x ~ style(display = "block","border-radius" = "4px","padding-right" = "4px",color = "white","background-color" = rgb(x/max(x), 0, 0)))))
)
# since an htmlwidget, composes well with other tagslibrary(htmltools)
browsable(tagList(
tags$div( class="jumbotron",tags$h1( class = "text-center"
,tags$span(class = "glyphicon glyphicon-fire"),"experimental as.htmlwidget at work"
)),tags$div( class = "row"
,tags$div( class = "col-sm-2",tags$p(class="bg-primary", "Hi, I am formattable htmlwidget.")
),tags$div( class = "col-sm-6"
,as.htmlwidget( formattable( mtcars ) ))
))
)
## End(Not run)
color_bar Create a color-bar formatter
Description
Create a color-bar formatter
8 color_text
Usage
color_bar(color = "lightgray", fun = "proportion", ...)
Arguments
color the background color of the bars
fun the transform function that maps the input vector to values from 0 to 1. Usesproportion by default.
... additional parameters passed to fun
See Also
normalize_bar, proportion_bar
Examples
formattable(mtcars, list(mpg = color_bar("lightgray", proportion)))
color_text Create a color-text formatter
Description
Create a color-text formatter
Usage
color_text(...)
Arguments
... parameters passed to gradient.
Examples
formattable(mtcars, list(mpg = color_text("black", "red")))

color_tile 9
color_tile Create a color-tile formatter
Description
Create a color-tile formatter
Usage
color_tile(...)
Arguments
... parameters passed to gradient.
Examples
formattable(mtcars, list(mpg = color_tile("white", "pink")))
comma Numeric vector with thousands separators
Description
Numeric vector with thousands separators
Usage
comma(x, digits, format = "f", big.mark = ",", ...)
## Default S3 method:comma(x, digits = 2L, format = "f", big.mark = ",", ...)
## S3 method for class 'character'comma(x, digits = max(get_digits(x)), format = "f",big.mark = ",", ...)
Arguments
x a numeric vector.
digits an integer to indicate the number of digits of the percentage string.
format format type passed to formatC.
big.mark thousands separator
... additional parameters passed to formattable.
10 currency
Examples
comma(1000000)comma(c(1250000, 225000))comma(c(1250000, 225000), format = "d")comma("123,345.123")
csscolor Generate CSS-compatible color strings
Description
Generate CSS-compatible color strings
Usage
csscolor(x, format = c("auto", "hex", "rgb", "rgba"), use.names = TRUE)
Arguments
x color input
format the output format of color strings
use.names logical of whether to preserve the names of input
Value
a character vector of CSS-compatible color strings
Examples
csscolor(rgb(0, 0.5, 0.5))csscolor(c(rgb(0, 0.2, 0.2), rgb(0, 0.5, 0.2)))csscolor(rgb(0, 0.5, 0.5, 0.2))csscolor(gradient(c(1,2,3,4,5), "white", "red"))
currency Numeric vector with currency format
Description
Numeric vector with currency format

digits 11
Usage
currency(x, symbol, digits, format = "f", big.mark = ",", ...)
## Default S3 method:currency(x, symbol = "$", digits = 2L, format = "f",big.mark = ",", ..., sep = "")
## S3 method for class 'character'currency(x, symbol = get_currency_symbol(x),digits = max(get_digits(x)), format = "f", big.mark = ",", ...)
Arguments
x a numeric vector.
symbol currency symbol
digits an integer to indicate the number of digits of the percentage string.
format format type passed to formatC.
big.mark thousands separator
... additional parameters passed to formattable.
sep separator between symbol and value
Examples
currency(200000)currency(200000, "\U20AC")currency(1200000, "USD", sep = " ")currency(1200000, "USD", format = "d", sep = " ")currency("$ 120,250.50")currency("HK$ 120,250.50", symbol = "HK$")currency("HK$ 120, 250.50")
digits Numeric vector showing pre-specific digits
Description
Numeric vector showing pre-specific digits
Usage
digits(x, digits, format = "f", ...)

12 formattable
Arguments
x a numeric vector
digits an integer to indicate the number of digits to show.
format format type passed to formatC.
... additional parameters passed to formattable.
Examples
digits(pi, 2)digits(123.45678, 3)
formattable Generic function to create formattable object
Description
This function is a generic function to create formattable object, i.e. an object to which a formattingfunction and related attribute are attached. The object works as ordinary object yet has speciallydefined behavior as being printed or converted to a string representation.
Usage
formattable(x, ...)
Arguments
x an object.
... arguments to be passed to methods.
Value
a formattable object

formattable.data.frame 13
formattable.data.frame
Create a formattable data frame
Description
This function creates a formattable data frame by attaching column or area formatters to the dataframe. Each time the data frame is printed or converted to string representation, the formatterfunction will use the formatter functions to generate formatted cells.
Usage
## S3 method for class 'data.frame'formattable(x, ..., formatter = "format_table",preproc = NULL, postproc = NULL)
Arguments
x a data.frame
... arguments to be passed to formatter.
formatter formatting function, format_table in default.
preproc pre-processor function that prepares x for formatting function.
postproc post-processor function that transforms formatted output for printing.
Details
The formattable data frame is a data frame with lazy-bindings of prespecified column formatters orarea formatters. The formatters will not be applied until the data frame is printed to console or in adynamic document. If the formatter function has no side effect, the formattable data frame will notbe changed even if the formatters are applied to produce the printed version.
Value
a formattable data.frame
See Also
format_table, area
Examples
# mtcars (mpg in red)formattable(mtcars,
list(mpg = formatter("span", style = "color:red")))
# mtcars (mpg in red if greater than median)formattable(mtcars, list(mpg = formatter("span",

14 formattable.Date
style = function(x) ifelse(x > median(x), "color:red", NA))))
# mtcars (mpg in red if greater than median, using formula)formattable(mtcars, list(mpg = formatter("span",
style = x ~ ifelse(x > median(x), "color:red", NA))))
# mtcars (mpg in gradient: the higher, the redder)formattable(mtcars, list(mpg = formatter("span",
style = x ~ style(color = rgb(x/max(x), 0, 0)))))
# mtcars (mpg background in gradient: the higher, the redder)formattable(mtcars, list(mpg = formatter("span",
style = x ~ style(display = "block","border-radius" = "4px","padding-right" = "4px",color = "white","background-color" = rgb(x/max(x), 0, 0)))))
# mtcars (mpg in red if vs == 1 and am == 1)formattable(mtcars, list(mpg = formatter("span",
style = ~ style(color = ifelse(vs == 1 & am == 1, "red", NA)))))
# hide columnsformattable(mtcars, list(mpg = FALSE, cyl = FALSE))
# area formattingformattable(mtcars, list(area(col = vs:carb) ~ formatter("span",
style = x ~ style(color = ifelse(x > 0, "red", NA)))))
df <- data.frame(a = rnorm(10), b = rnorm(10), c = rnorm(10))formattable(df, list(area() ~ color_tile("transparent", "lightgray")))formattable(df, list(area(1:5) ~ color_tile("transparent", "lightgray")))formattable(df, list(area(1:5) ~ color_tile("transparent", "lightgray"),
area(6:10) ~ color_tile("transparent", "lightpink")))
formattable.Date Create a formattable Date vector
Description
Create a formattable Date vector
Usage
## S3 method for class 'Date'formattable(x, ..., formatter = "format.Date",preproc = NULL, postproc = NULL)

formattable.default 15
Arguments
x a vector of class Date.
... arguments to be passed to formatter.
formatter formatting function, format.Date in default.
preproc pre-processor function that prepares x for formatting function.
postproc post-processor function that transforms formatted output for printing.
Value
a formattable Date vector
Examples
dates <- as.Date("2015-04-10") + 1:5fdates <- formattable(dates, format = "%m/%d/%Y")fdatesfdates + 30
formattable.default Create a formattable object
Description
Create a formattable object
Usage
## Default S3 method:formattable(x, ..., formatter, preproc = NULL,
postproc = NULL)
Arguments
x an object.
... arguments to be passed to formatter.
formatter formatting function, formatC in default.
preproc pre-processor function that prepares x for formatting function.
postproc post-processor function that transforms formatted output for printing.
Value
a formattable object that inherits from the original object.
Examples
formattable(rnorm(10), formatter = "formatC", digits = 1)
16 formattable.logical
formattable.factor Create a formattable factor object
Description
Create a formattable factor object
Usage
## S3 method for class 'factor'formattable(x, ..., formatter = "vmap", preproc = NULL,postproc = NULL)
Arguments
x a factor object.
... arguments to be passed to formatter.
formatter formatting function, vmap in default.
preproc pre-processor function that prepares x for formatting function.
postproc post-processor function that transforms formatted output for printing.
Value
a formattable factor object.
Examples
formattable(as.factor(c("a", "b", "b", "c")),a = "good", b = "fair", c = "bad")
formattable.logical Create a formattable logical vector
Description
Create a formattable logical vector
Usage
## S3 method for class 'logical'formattable(x, ..., formatter = "ifelse", preproc = NULL,postproc = NULL)
formattable.numeric 17
Arguments
x a logical vector.
... arguments to be passed to formatter.
formatter formatting function, formattable::ifelse in default.
preproc pre-processor function that prepares x for formatting function.
postproc post-processor function that transforms formatted output for printing.
Value
a formattable logical vector.
Examples
logi <- c(TRUE, TRUE, FALSE)flogi <- formattable(logi, "yes", "no")flogi!flogiany(flogi)all(flogi)
formattable.numeric Create a formattable numeric vector
Description
Create a formattable numeric vector
Usage
## S3 method for class 'numeric'formattable(x, ..., formatter = "formatC", preproc = NULL,postproc = NULL)
Arguments
x a numeric vector.
... arguments to be passed to formatter.
formatter formatting function, formatC in default.
preproc pre-processor function that prepares x for formatting function.
postproc post-processor function that transforms formatted output for printing.
Value
a formattable numeric vector.

18 formattable.POSIXct
Examples
formattable(rnorm(10), format = "f", digits = 1)formattable(rnorm(10), format = "f",
flag="+", digits = 1)formattable(1:10,
postproc = function(str, x) paste0(str, "px"))formattable(1:10,
postproc = function(str, x)paste(str, ifelse(x <= 1, "unit", "units")))
formattable.POSIXct Create a formattable POSIXct vector
Description
Create a formattable POSIXct vector
Usage
## S3 method for class 'POSIXct'formattable(x, ..., formatter = "format.POSIXct",preproc = NULL, postproc = NULL)
Arguments
x a vector of class POSIXct.
... arguments to be passed to formatter.
formatter formatting function, format.POSIXct in default.
preproc pre-processor function that prepares x for formatting function.
postproc post-processor function that transforms formatted output for printing.
Value
a formattable POSIXct vector
Examples
times <- as.POSIXct("2015-04-10 09:30:15") + 1:5ftimes <- formattable(times, format = "%Y%m%dT%H%M%S")ftimesftimes + 30
formattable.POSIXlt 19
formattable.POSIXlt Create a formattable POSIXlt vector
Description
Create a formattable POSIXlt vector
Usage
## S3 method for class 'POSIXlt'formattable(x, ..., formatter = "format.POSIXlt",preproc = NULL, postproc = NULL)
Arguments
x a vector of class POSIXlt.
... arguments to be passed to formatter.
formatter formatting function, format.POSIXlt in default.
preproc pre-processor function that prepares x for formatting function.
postproc post-processor function that transforms formatted output for printing.
Value
a formattable POSIXlt vector
Examples
times <- as.POSIXlt("2015-04-10 09:30:15") + 1:5ftimes <- formattable(times, format = "%Y%m%dT%H%M%S")ftimesftimes + 30
formattableOutput Widget output function for use in Shiny
Description
Widget output function for use in Shiny
Usage
formattableOutput(outputId, width = "100%", height = "0")
20 formatter
Arguments
outputId output variable to read from
width a valid CSS width or a number
height valid CSS height or a number
formatter Create a formatter function making HTML elements
Description
Create a formatter function making HTML elements
Usage
formatter(.tag, ...)
Arguments
.tag HTML tag name. Uses span by default.
... functions to create attributes of HTML element from data colums. The unnamedelement will serve as the function to produce the inner text of the element. If nounnamed element is provided, identity function will be used to preserve thestring representation of the colum values. Function and formula are accepted.See details for how different forms of formula will behave differently.
Details
This function creates a formatter object which is essentially a closure taking a value and optionallythe dataset behind.
The formatter produces a character vector of HTML elements represented as strings. The tag nameof the elements are specified by .tag, and its attributes are calculated with the given functions orformulas specified in ... given the input vector and/or dataset in behind.
Formula like x ~ expr will behave like function(x) expr. Formula like ~expr will be evaluatedin different manner: expr will be evaluated in the data frame with the enclosing environment beingthe formula environment. If a column is formatted according to multiple other columns, ~exprshould be used and the column names can directly appear in expr.
Value
a function that transforms a column of data (usually an atomic vector) to formatted data representedin HTML and CSS.
format_table 21
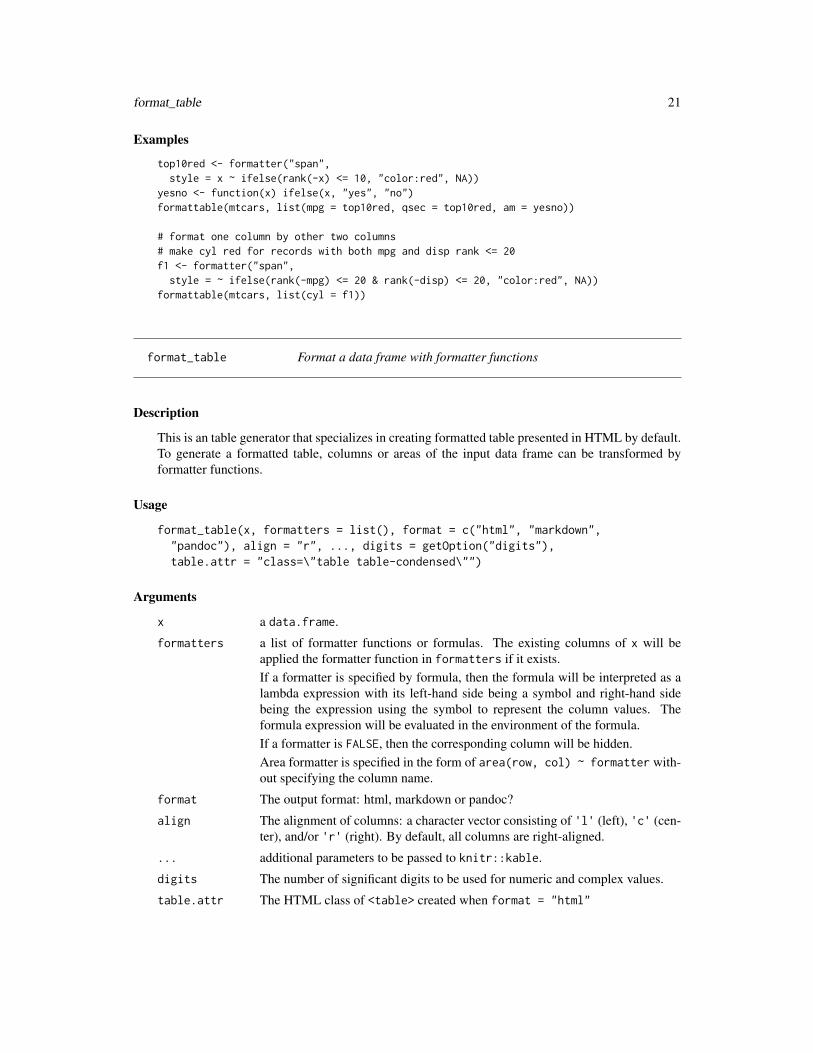
Examples
top10red <- formatter("span",style = x ~ ifelse(rank(-x) <= 10, "color:red", NA))
yesno <- function(x) ifelse(x, "yes", "no")formattable(mtcars, list(mpg = top10red, qsec = top10red, am = yesno))
# format one column by other two columns# make cyl red for records with both mpg and disp rank <= 20f1 <- formatter("span",
style = ~ ifelse(rank(-mpg) <= 20 & rank(-disp) <= 20, "color:red", NA))formattable(mtcars, list(cyl = f1))
format_table Format a data frame with formatter functions
Description
This is an table generator that specializes in creating formatted table presented in HTML by default.To generate a formatted table, columns or areas of the input data frame can be transformed byformatter functions.
Usage
format_table(x, formatters = list(), format = c("html", "markdown","pandoc"), align = "r", ..., digits = getOption("digits"),table.attr = "class=\"table table-condensed\"")
Arguments
x a data.frame.
formatters a list of formatter functions or formulas. The existing columns of x will beapplied the formatter function in formatters if it exists.If a formatter is specified by formula, then the formula will be interpreted as alambda expression with its left-hand side being a symbol and right-hand sidebeing the expression using the symbol to represent the column values. Theformula expression will be evaluated in the environment of the formula.If a formatter is FALSE, then the corresponding column will be hidden.Area formatter is specified in the form of area(row, col) ~ formatter with-out specifying the column name.
format The output format: html, markdown or pandoc?
align The alignment of columns: a character vector consisting of 'l' (left), 'c' (cen-ter), and/or 'r' (right). By default, all columns are right-aligned.
... additional parameters to be passed to knitr::kable.
digits The number of significant digits to be used for numeric and complex values.
table.attr The HTML class of <table> created when format = "html"
22 format_table
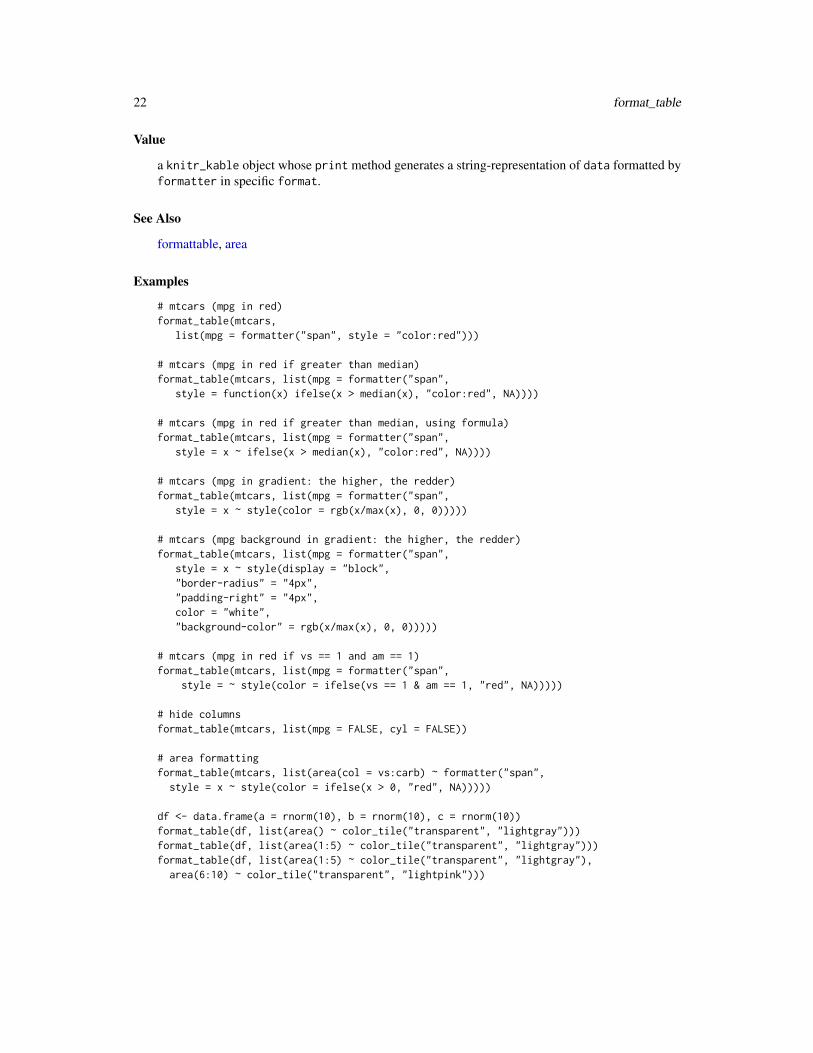
Value
a knitr_kable object whose print method generates a string-representation of data formatted byformatter in specific format.
See Also
formattable, area
Examples
# mtcars (mpg in red)format_table(mtcars,
list(mpg = formatter("span", style = "color:red")))
# mtcars (mpg in red if greater than median)format_table(mtcars, list(mpg = formatter("span",
style = function(x) ifelse(x > median(x), "color:red", NA))))
# mtcars (mpg in red if greater than median, using formula)format_table(mtcars, list(mpg = formatter("span",
style = x ~ ifelse(x > median(x), "color:red", NA))))
# mtcars (mpg in gradient: the higher, the redder)format_table(mtcars, list(mpg = formatter("span",
style = x ~ style(color = rgb(x/max(x), 0, 0)))))
# mtcars (mpg background in gradient: the higher, the redder)format_table(mtcars, list(mpg = formatter("span",
style = x ~ style(display = "block","border-radius" = "4px","padding-right" = "4px",color = "white","background-color" = rgb(x/max(x), 0, 0)))))
# mtcars (mpg in red if vs == 1 and am == 1)format_table(mtcars, list(mpg = formatter("span",
style = ~ style(color = ifelse(vs == 1 & am == 1, "red", NA)))))
# hide columnsformat_table(mtcars, list(mpg = FALSE, cyl = FALSE))
# area formattingformat_table(mtcars, list(area(col = vs:carb) ~ formatter("span",
style = x ~ style(color = ifelse(x > 0, "red", NA)))))
df <- data.frame(a = rnorm(10), b = rnorm(10), c = rnorm(10))format_table(df, list(area() ~ color_tile("transparent", "lightgray")))format_table(df, list(area(1:5) ~ color_tile("transparent", "lightgray")))format_table(df, list(area(1:5) ~ color_tile("transparent", "lightgray"),
area(6:10) ~ color_tile("transparent", "lightpink")))

gradient 23
gradient Create a matrix from vector to represent colors in gradient
Description
Create a matrix from vector to represent colors in gradient
Usage
gradient(x, min.color, max.color, alpha = NULL, use.names = TRUE,na.rm = TRUE)
Arguments
x a numeric vector.
min.color color of minimum value.
max.color color of maximum value.
alpha logical of whether to include alpha channel. NULL to let the function decide byinput.
use.names logical of whether to preserve names of input vector.
na.rm logical indicating whether to ignore missing values as x is normalized. (defultis TRUE)
Value
a matrix with rgba columns in which each row corresponds to the rgba value (0-255) of each elementin input vector x. Use csscolor to convert the matrix to css color strings compatible with webbrowsers.
See Also
csscolor
Examples
gradient(c(1,2,3,4,5), "white", "red")gradient(c(5,4,3,2,1), "white", "red")gradient(c(1,3,2,4,5), "white", "red")gradient(c(1,3,2,4,5), rgb(0,0,0,0.5), rgb(0,0,0,1), alpha = TRUE)
24 icontext
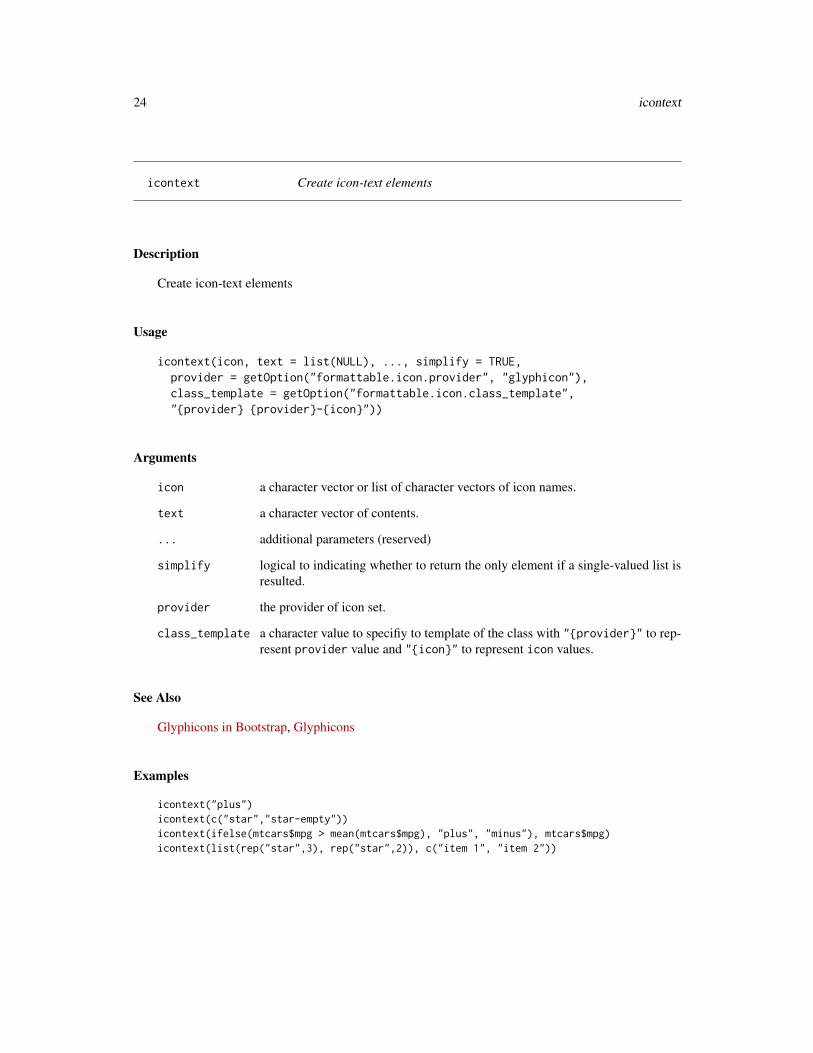
icontext Create icon-text elements
Description
Create icon-text elements
Usage
icontext(icon, text = list(NULL), ..., simplify = TRUE,provider = getOption("formattable.icon.provider", "glyphicon"),class_template = getOption("formattable.icon.class_template","{provider} {provider}-{icon}"))
Arguments
icon a character vector or list of character vectors of icon names.
text a character vector of contents.
... additional parameters (reserved)
simplify logical to indicating whether to return the only element if a single-valued list isresulted.
provider the provider of icon set.
class_template a character value to specifiy to template of the class with "{provider}" to rep-resent provider value and "{icon}" to represent icon values.
See Also
Glyphicons in Bootstrap, Glyphicons
Examples
icontext("plus")icontext(c("star","star-empty"))icontext(ifelse(mtcars$mpg > mean(mtcars$mpg), "plus", "minus"), mtcars$mpg)icontext(list(rep("star",3), rep("star",2)), c("item 1", "item 2"))

is.formattable 25
is.formattable Test for objects of ’formattable’ class
Description
Test for objects of ’formattable’ class
Usage
is.formattable(x)
Arguments
x an object
Value
TRUE if x has class ’formattable’; FALSE otherwise.
Examples
is.formattable(10)is.formattable(formattable(10))
normalize Normalize a vector to fit zero-to-one scale
Description
Normalize a vector to fit zero-to-one scale
Usage
normalize(x, min = 0, max = 1, na.rm = FALSE)
Arguments
x a numeric vector
min numeric value. The lower bound of the interval to normalize x.
max numeric value. The upper bound of the interval to normalize x.
na.rm a logical indicating whether missing values should be removed
Examples
normalize(mtcars$mpg)

26 percent
normalize_bar Create a color-bar formatter using normalize
Description
Create a color-bar formatter using normalize
Usage
normalize_bar(color = "lightgray", ...)
Arguments
color the background color of the bars... additional parameters passed to normalize
See Also
color_bar, normalize
Examples
formattable(mtcars, list(mpg = normalize_bar()))
percent Numeric vector with percentage representation
Description
Numeric vector with percentage representation
Usage
percent(x, digits, format = "f", ...)
## Default S3 method:percent(x, digits = 2L, format = "f", ...)
## S3 method for class 'character'percent(x, digits = NA, format = "f", ...)
Arguments
x a numeric vector.digits an integer to indicate the number of digits of the percentage string.format format type passed to formatC.... additional parameters passed to formattable.

prefix 27
Examples
percent(rnorm(10, 0, 0.1))percent(rnorm(10, 0, 0.1), digits = 0)percent("0.5%")percent(c("15.5%", "25.12%", "73.5"))
prefix Formattable object with prefix
Description
Formattable object with prefix
Usage
prefix(x, prefix = "", sep = "", ..., na.text = NULL)
Arguments
x an object
prefix a character vector put in front of each non-missing value in x as being formatted.
sep separator
... additional parameter passed to formattable.
na.text text for missing values in x.
Examples
prefix(1:10, "A")prefix(1:10, "Choice", sep = " ")prefix(c(1:10, NA), prefix = "A", na.text = "(missing)")prefix(rnorm(10, 10), "*", format = "d")prefix(percent(c(0.1,0.25)), ">")
proportion Rescale a vector relative to the maximal absolute value in the vector
Description
Rescale a vector relative to the maximal absolute value in the vector
Usage
proportion(x, na.rm = FALSE)
28 qrank
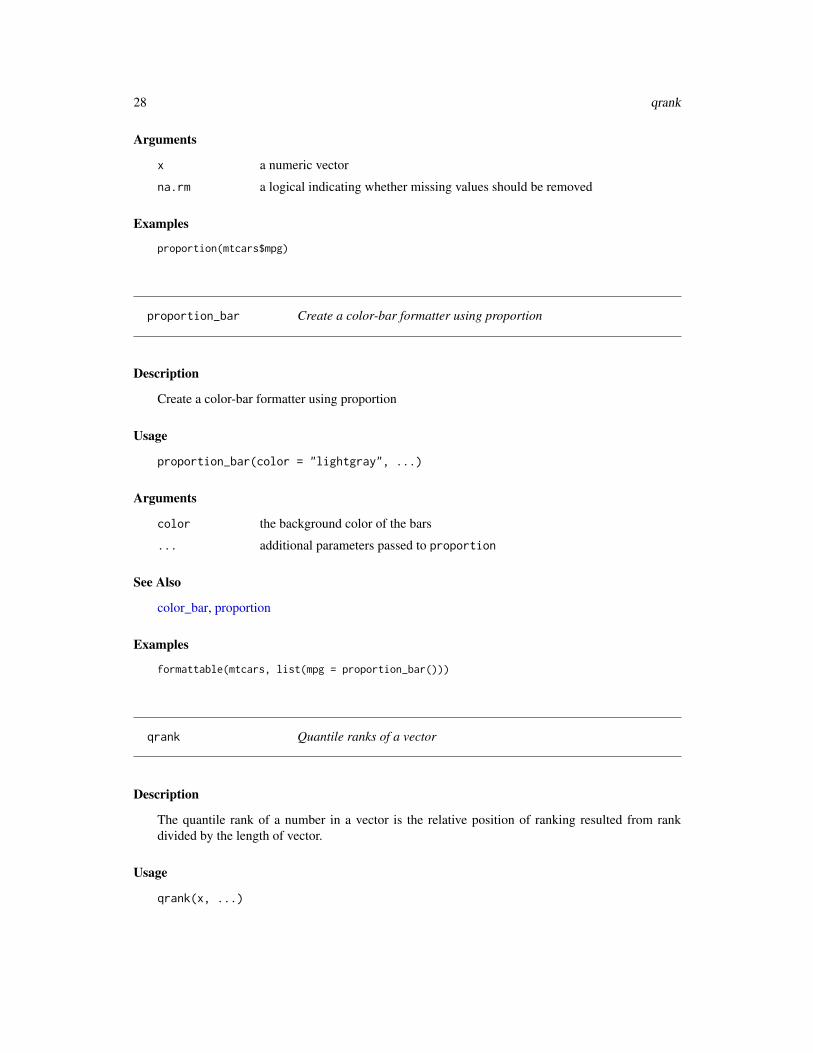
Arguments
x a numeric vector
na.rm a logical indicating whether missing values should be removed
Examples
proportion(mtcars$mpg)
proportion_bar Create a color-bar formatter using proportion
Description
Create a color-bar formatter using proportion
Usage
proportion_bar(color = "lightgray", ...)
Arguments
color the background color of the bars
... additional parameters passed to proportion
See Also
color_bar, proportion
Examples
formattable(mtcars, list(mpg = proportion_bar()))
qrank Quantile ranks of a vector
Description
The quantile rank of a number in a vector is the relative position of ranking resulted from rankdivided by the length of vector.
Usage
qrank(x, ...)

renderFormattable 29
Arguments
x a vector... additional parameters passed to rank
See Also
rank
Examples
qrank(mtcars$mpg)
renderFormattable Widget render function for use in Shiny
Description
Widget render function for use in Shiny
Usage
renderFormattable(expr, env = parent.frame(), quoted = FALSE)
Arguments
expr an expression that generates a valid formattable objectenv the environment in which to evaluate expr.quoted is expr a quoted expression (with quote())? This is useful if you want to save an
expression in a variable.
scientific Numeric vector with scientific format
Description
Numeric vector with scientific format
Usage
scientific(x, format = c("e", "E"), ...)
Arguments
x a numeric vector.format format type passed to formatC.... additional parameter passed to formattable.
30 style
Examples
scientific(1250000)scientific(1253421, digits = 8)scientific(1253421, digits = 8, format = "E")
style Create a string-representation of CSS style
Description
Most HTML elements can be stylized by a set of CSS style properties. This function helps buildCSS strings using conventional argument-passing in R.
Usage
style(...)
Arguments
... style attributes in form of name = value. Many CSS properties contains '-' inthe middle of their names. In this case, use "the-name" = value instead. NAwill cancel the attribute.
Details
The general usage of CSS styling is
<span style = "color: red; border: 1px">Text</span>
The text color can be specified by ‘color‘, the border of element by ‘border‘, and etc.
Basic styles like color, border, background work properly and mostly consistently in modernweb browsers. However, some style properties may not work consistently in different browsers.
Value
a string-representation of css styles
See Also
List of CSS properties, CSS Reference
Examples
style(color = "red")style(color = "red", "font-weight" = "bold")style("background-color" = "gray", "border-radius" = "4px")style("padding-right" = "2px")
formattable(mtcars, list(mpg = formatter("span",style = x ~ style(color = ifelse(x > median(x), "red", NA)))))

suffix 31
suffix Formattable object with suffix
Description
Formattable object with suffix
Usage
suffix(x, suffix = "", sep = "", ..., na.text = NULL)
Arguments
x an object
suffix a character vector put behind each non-missing value in x as being formatted.
sep separator
... additional parameter passed to formattable.
na.text text for missing values in x.
Examples
suffix(1:10, "px")suffix(1:10, ifelse(1:10 >= 2, "units", "unit"), sep = " ")suffix(c(1:10, NA), "km/h", na.text = "(missing)")suffix(percent(c(0.1, 0.25)), "*")
vmap Vectorized map from element to case by index or string value
Description
This function is a vectorized version of switch, that is, for each element of input vector, switch isevaluated and the results are combined.
Usage
vmap(EXPR, ..., SIMPLIFY = TRUE)
Arguments
EXPR an expression evaluated to be character or numeric vector/list.
... The list of alternatives for each switch.
SIMPLIFY TRUE to simplify the resulted list to vector, matrix or array if possible.

32 vmap
See Also
switch
Examples
x <- c("normal","normal","error","unknown","unknown")vmap(x, normal = 0, error = -1, unknown = -2)
x <- c(1,1,2,1,2,2,1,1,2)vmap(x, "type-A", "type-B")

Index
accounting, 3area, 4, 13, 22as.datatable, 5as.datatable.formattable, 5as.htmlwidget, 6as.htmlwidget.formattable, 6
color_bar, 7, 26, 28color_text, 8color_tile, 9comma, 9csscolor, 10, 23currency, 10
datatable, 5, 6digits, 11
format_table, 4, 13, 21formatC, 4, 9, 11, 12, 17, 26, 29formattable, 12, 22formattable-package, 3formattable.data.frame, 4, 13formattable.Date, 14formattable.default, 15formattable.factor, 16formattable.logical, 16formattable.numeric, 17formattable.POSIXct, 18formattable.POSIXlt, 19formattableOutput, 19formatter, 20
gradient, 23
icontext, 24is.formattable, 25
normalize, 25, 26normalize_bar, 8, 26
percent, 26
prefix, 27proportion, 27, 28proportion_bar, 8, 28
qrank, 28
rank, 29renderFormattable, 29
scientific, 29style, 30suffix, 31switch, 32
vmap, 31
33