pacific pilotage · a nnual report 2010. ... cunningham group member* ... by completing the...
TRANSCRIPT

P a c i f i c P i l o t a g e a u t h o r i t y. . . . . . . . . . . . . . . . . . . . . . . . . . . . . . .
Annual Report 2010

B O A R D M E M B E R S
M A n A g E M E n t
Kevin ObermeyerPresident and CEO
Bruce ChadwickDirector of Finance
Brian YoungDirector of Marine Operations
Michael McguireCommunity Liason and Special Projects Manager
Diane StreetCorporate Secretary
Pat Van Den BoschManager of Accounting
Mr. David gardinerChair*
Mr. L. Michael Berry Member*
Mrs. Lorraine CunninghamPresidentCunningham groupMember*
Captain Ray goodeB.C. Coast Pilots Ltd.Member
Captain J. I. MacPhersonB.C. Coast Pilots Ltd.Member
Mr. Paul Prefontaine Outbound Directorgreig Star ShippingMember
Ms. Karen HorcherMember*
Isabelle ForgetExecutiveAssistant
Bruce northwayManager, Operations and Labour Relations
t A B L E O F C O n t E n t S
Mandate . . . . . . . . . . . . . . . . . . . . . . . . . . . . . . . . . . . . 1
Corporate Objectives, Mission Statement and Values . . . . . . . . . . . . . . 2
Chair and CEO Letter . . . . . . . . . . . . . . . . . . . . . . . . . . . . . . 3
What is the Pacific Pilotage Authority . . . . . . . . . . . . . . . . . . . . . . 5
Corporate governance . . . . . . . . . . . . . . . . . . . . . . . . . . . . . 5
Organizational Structure of the Authority . . . . . . . . . . . . . . . . . . . . 5
Operational and Financial Review for the Year of 2010 . . . . . . . . . . . . . 5
Overview of Operations . . . . . . . . . . . . . . . . . . . . . . . . . . . . . 5
traffic . . . . . . . . . . . . . . . . . . . . . . . . . . . . . . . . . . . . . 6
Financial Commentary . . . . . . . . . . . . . . . . . . . . . . . . . . . . . 8
Historical Financial Summary . . . . . . . . . . . . . . . . . . . . . . . . . . 9
Incident Reporting . . . . . . . . . . . . . . . . . . . . . . . . . . . . . . 10
Enterprise Risk Management . . . . . . . . . . . . . . . . . . . . . . . . . 11
Key Performance Measurements . . . . . . . . . . . . . . . . . . . . . . . 12
Accomplishments for 2010 . . . . . . . . . . . . . . . . . . . . . . . . . . 13
Qualified Pilot Candidates as at December 31, 2010 . . . . . . . . . . . . . 13
Regular Consultations with Stakeholders . . . . . . . . . . . . . . . . . . . 13
Looking Ahead – 2011 and Beyond . . . . . . . . . . . . . . . . . . . . . . 14
Strategic goals for 2011 . . . . . . . . . . . . . . . . . . . . . . . . . . . 15
Measurement of 2010 Strategic goals . . . . . . . . . . . . . . . . . . . . 16
Audited Financial Statements . . . . . . . . . . . . . . . . . . . . . . . . . 20
*Denotes member of AuDit Committee.
A l l p h o t o s C o u r t e s y o f D A v e r o e l s .
G r A p h i C D e s i G n b y m e r C u r y G r A p h i C s l t D .
P A C I F I C P I L O t A g E A u t H O R I t Y 2 0 1 0 A n n u A L R E P O R t 1
the mandate of the Authority is
to establish, operate, maintain,
and administer in the interest of
safety, an efficient pilotage
service within the regions set
out in respect of the Authority,
on a basis of financial
self-sufficiency.
Website: www.ppa.gc.ca
offiCes:
heAD offiCe:1000 - 1130 West pender streetvancouver, british Columbiav6e 4A4
tel: 604.666.6771fAx: 604.666.6093 DispAtCh
fAx: 604.666.1647 ADministrAtion
emAil: [email protected]
DispAtCh offiCes:1000 - 1130 West pender streetvancouver, british Columbia, v6e 4A4
211 Dallas road,victoria, british Columbia, v8v 1A1
pilot boArDinG stAtions:sandheads, off stevestonbrotchie ledge, off victoriaCape beale, off port Albernitriple island, off prince rupertpine island, off port hardy
m A n D A t e

2 P A C I F I C P I L O t A g E A u t H O R I t Y 2 0 1 0 A n n u A L R E P O R t
C o r p o r A t e o b j e C t i v e s
m i s s i o n s t A t e m e n t
C o r p o r A t e v A l u e s
to provide safe, reliable and efficient marine pilotage and related services in the coastal waters of British Columbia, including the Fraser River;
to provide the services within a commercially-oriented framework, by maintaining financial self-sufficiency, through a combination of cost management and tariffs that are fair and reasonable;
to achieve the highest productivity of the Authority's resources in the interest of safe navigation;
to implement sustainable practices within the Authority and contribute to government's environmental, social and economic policies as they apply to the marine industry on the Pacific coast of Canada;
to assume a leadership role in the marine industry we serve, by facilitating decisions resulting in improvements to navigational safety and the efficiency of marine operations.
the Pacific Pilotage Authority is dedicated to providing safe, efficient pilotage by working in partnership with pilots and the shipping industry to protect the interests of Canada.
Management and Board members review the Authority’s Corporate Values annually to ensure their continued relevance and applicability. the Corporate Values are:
Honesty/Integrity - We will ensure honesty and integrity in everything that we do. We share responsibility for being effective, accountable and acting appropriately. We consider the outcome of decisions for all those affected before we implement change. We act with visible integrity and openness, and support each other in these actions.
PositiveStakeholderRelations - We will work hard to maintain positive relations with all stakeholders including the shipping industry, the pilots and their respective organizations, our employees, the communities in which we operate and all other related individuals and organizations.
ServiceQuality - We strive for excellence in all our activities. We continuously learn, develop and improve. We take pride in our work and in the services we provide to our clients and partners.
Accountability/Responsibility - We are accountable, as individuals, team members and as an organization for our actions and our decisions. We make effective and efficient use of the resources provided to us. We adhere to our policies and procedures, our mission and objectives, and to the Regulations governing us. When our commitment to innovation is at odds with existing procedures, we will work within the system to achieve positive change and improvement.
AdaptabilityandInnovation - We value innovation and creativity. We encourage and support originality and diversity of thought. As individuals and as teams, working with our internal and external partners, we welcome new ideas and methods to enhance our service and the use of our resources.

C h A i r A n D C e o r e p o r t
Honourable Chuck Strahl January 25, 2011 Minister of transport, Infrastructure and Communities tower C, 29th Floor Place de Ville Ottawa, Ontario K1A 0n5
Dear Sir:
On behalf of the Board of Directors and management of the Pacific Pilotage Authority, we are pleased to submit our Annual Report for the year ended December 31, 2010.
We are happy to report that this year saw some positive signs of recovery from the severe downturn the marine community experienced in 2008/2009. Coastal assignments and Fraser River assignments rose by six percent and one percent respectively over 2009. these additional assignments drove our performance and led to a significant enhancement of our financial position by increasing our budgeted surplus of $0.9 million to an actual surplus of $3.2 million. While this is a positive trend we remain cautious. the global economy is still very volatile and when the severely depressed vessel charter rates around the globe are considered, placing pressure on the shipping industry, it is evident that we need to maintain our vigilance on cost containment.
the Authority remains responsive to the needs of the customers. When reviewing the financial statements it will be noted that we exceeded our training budget by 25 percent. this was a direct result of an industry need. By completing the unbudgeted training in tethered tug escorts and personal pilotage units, the industry was able to increase the sailing draft for tankers navigating through the Second narrows by an additional metre which translates into approximately 10,000 tonnes of additional cargo per vessel, without new infrastructure.
We believe that we have again been very successful in carrying out our mandate of providing safe, reliable and efficient marine pilotage in the coastal waters of British Columbia. the safety level enjoyed on the BC Coast was once more elevated by posting just two minor incidents in 2010 which gave a new record of successful assignments of 99.98 percent.
We continue to uphold the philosophy of “full engagement”, with regular interface between the marine industry we serve and the pilots carrying out the work. this “full engagement” philosophy has also been extended to the communities in which we operate with a number of presentations being made to both municipal and First nation interests.
Strategically we are well positioned to achieve our Vision of becoming a world leader in marine pilotage by 2014 and we look forward to a successful 2011 with the continuation of the good relationships we enjoy with the government, industry and pilots.
Respectfully submitted,
David K. gardiner Kevin Obermeyer Chair President and Chief Executive Officer
P A C I F I C P I L O t A g E A u t H O R I t Y 2 0 1 0 A n n u A L R E P O R t 3
4 P A C I F I C P I L O t A g E A u t H O R I t Y 2 0 1 0 A n n u A L R E P O R t

5
W h At i s t h e pA C i f i C p i l o tA G e A u t h o r i t y
C o r p o r At e G o v e r n A n C e
o r G A n i z At i o n A l s t r u C t u r e o f t h e A u t h o r i t y
o v e r v i e W o f o p e r At i o n s
operational and financial review for the year of 2010
Vessels of 350 gross tons or larger, while travelling in Canadian waters, are legally obliged to use the services of a Canadian marine pilot as per the PilotageAct. the Pacific Pilotage Authority is a federal Crown corporation whose mandate is to administer this service in the waters of Western Canada. Our area of jurisdiction encompasses the British
Columbia coast, including the Fraser River, and stretches from Alaska in the north to Washington State in the south.
Marine pilotage is all about safety as it serves to protect the environment and thus the interests of the Canadian people. We hold ourselves accountable to the Canadian public in this regard.
P A C I F I C P I L O t A g E A u t H O R I t Y 2 0 1 0 A n n u A L R E P O R t 5
Corporate governance is the process of establishing and monitoring, the policies and procedures which will ensure the appropriate stewardship of the business and affairs of the Authority, including financial viability.
the Authority’s Board of Directors comprises a Chair, two pilot representatives, two shipping industry representatives and two representatives of the public interest. this structure provides effective channels of communication and represents a good balance among the major stakeholders.
the Chair and three Board members are also designated as members of the Audit Committee. the Audit Committee’s primary role
is to assist the Board of Directors to oversee and objectively assess the accuracy and integrity of the Authority’s financial reporting and statements, plans and reports and its relationship with the Auditors. the Audit Committee has full access to all books, records, facilities, and personnel of the Authority.
the Authority complies with the treasury Board guidelines on corporate governance practices. this includes Board self assessments, a nomination committee for prospective Directors and the development of Directors’ skills criteria. In addition, the Board has constituted several other committees to focus on the major areas of the Authority including safety, risk management, pilot training and emergency preparedness.
the Authority is managed by a President and CEO who reports to the Board through the Chair.
there are seven management employees, seven employee pilots,
eleven dispatchers, six administrative and twenty-six launch employees.
ninety-eight entrepreneur marine pilots provide coastal pilotage services through their company, the British Columbia Coast Pilots Ltd.
the year 2010 started with the Authority focusing its efforts on ensuring there was no major disruption of pilotage services to our customers during the Winter Olympics. We are pleased to comment that the first quarter of 2010 exceeded virtually all expectations. not only did we ensure seamless delivery of services to the shipping industry, the overall traffic levels exceeded both the budget and that of the prior year.
During 2010 we have seen significant increases in commodity tonnages throughout our jurisdiction. this is in marked contrast from the declines of the prior year. the Authority’s customer base remains well diversified yet very dependent on resource commodities. For export we have seen increased activity in the coal, forest products, potash and sulphur sectors. the grain industry announced a banner year for shipments for the crop year ended July 31st. the container and automobile sectors remained comparable year over year. the cruise sector faced a challenging year with repositioning of vessels out
of the Alaska market mainly due to state government issues. We are pleased to welcome some of these vessels back in 2011 along with a new cruise line.
During 2010 we completed the last major refit scheduled under our launch replacement plan. We have now standardized the engines used in our fleet and have stationed these upgraded backup vessels where they can be deployed to ensure seamless delivery of pilotage services to our customers.
the Authority and pilots finalized a project in 2010 that allows deeper draft tanker vessels to transit Vancouver harbour. these vessels can now be loaded with greater volumes of cargo thus increasing industry’s revenue earning capacity.
Pilot training was a major focus in 2010 as the Authority spent $1.5 million to upgrade and enhance the skills of its employees and contractors. this includes a $200,000 contribution towards upgrading
6 P A C I F I C P I L O t A g E A u t H O R I t Y 2 0 1 0 A n n u A L R E P O R t
the simulator at the British Columbia Institute of technology’s marine campus which will benefit the Authority’s training programs in the years ahead. Coastal pilots have been issued with and received training on portable pilotage units which will assist navigation.
the Authority implemented a three year financial plan during 2008 to ensure five percent of annual revenues are held in an investment account as reserves. this financial self-sufficiency goal was achieved during 2010.
the Authority’s Enterprise Risk Management (ERM) was further expanded and formalized under a permanent Board committee. the results from this program to date are detailed in a separate section of this report.
the Authority continues an Outreach Program directed towards the
communities in which we operate. the primary objective of this Program is to ensure these communities fully understand the role of the Authority and how we provide safe, reliable and efficient marine pilotage services in the waters of British Columbia. A secondary objective is to promote the idea of marine pilotage as the culmination of a sea-going career by broadening the community’s understanding of the hiring and exam process.
the Authority continues to value its excellent relationship with industry and pilots and works hard to sustain these relationships. As a measure of our success in recent years we have seen both of these parties become major allies in attaining our common goals.
In summary, 2010 was a very positive year from operations, traffic and financial standpoints.
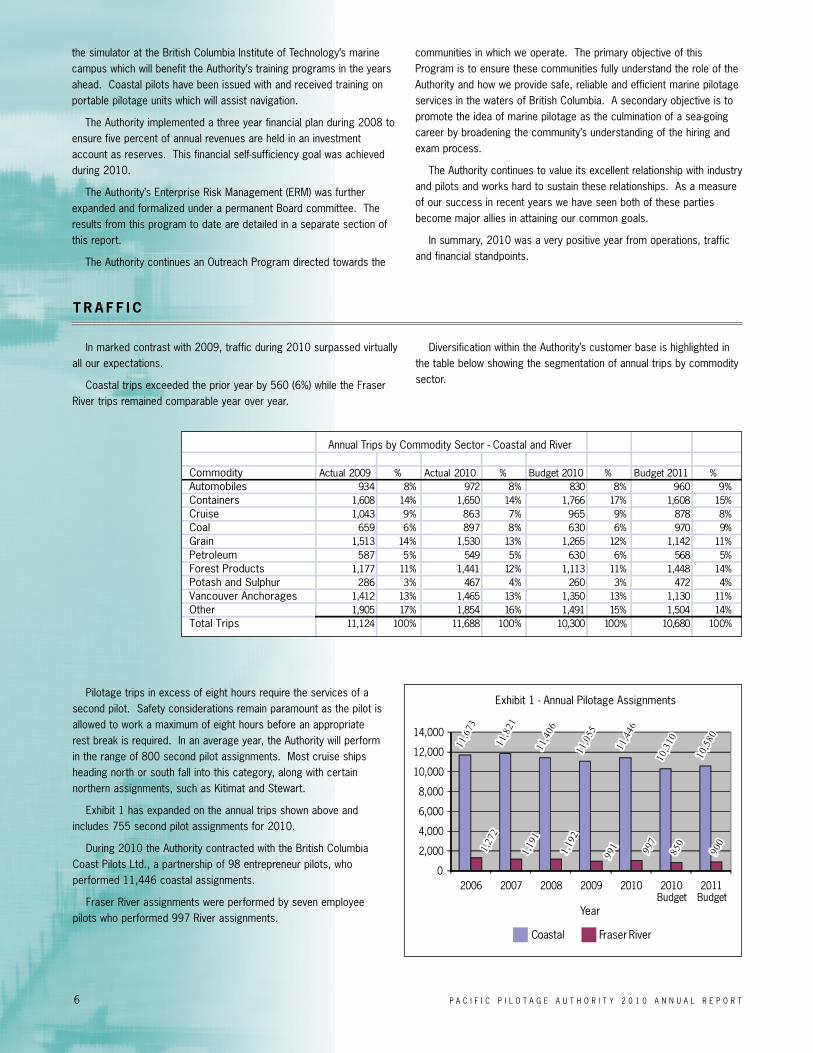
In marked contrast with 2009, traffic during 2010 surpassed virtually all our expectations.
Coastal trips exceeded the prior year by 560 (6%) while the Fraser River trips remained comparable year over year.
Diversification within the Authority’s customer base is highlighted in the table below showing the segmentation of annual trips by commodity sector.
Pilotage trips in excess of eight hours require the services of a second pilot. Safety considerations remain paramount as the pilot is allowed to work a maximum of eight hours before an appropriate rest break is required. In an average year, the Authority will perform in the range of 800 second pilot assignments. Most cruise ships heading north or south fall into this category, along with certain northern assignments, such as Kitimat and Stewart.
Exhibit 1 has expanded on the annual trips shown above and includes 755 second pilot assignments for 2010.
During 2010 the Authority contracted with the British Columbia Coast Pilots Ltd., a partnership of 98 entrepreneur pilots, who performed 11,446 coastal assignments.
Fraser River assignments were performed by seven employee pilots who performed 997 River assignments.
t r A f f i C
Commodity Actual 2009 % Actual 2010 % Budget 2010 % Budget 2011 %Automobiles 934 8% 972 8% 830 8% 960 9%Containers 1,608 14% 1,650 14% 1,766 17% 1,608 15%Cruise 1,043 9% 863 7% 965 9% 878 8%Coal 659 6% 897 8% 630 6% 970 9%Grain 1,513 14% 1,530 13% 1,265 12% 1,142 11%Petroleum 587 5% 549 5% 630 6% 568 5%Forest Products 1,177 11% 1,441 12% 1,113 11% 1,448 14%Potash and Sulphur 286 3% 467 4% 260 3% 472 4%Vancouver Anchorages 1,412 13% 1,465 13% 1,350 13% 1,130 11%Other 1,905 17% 1,854 16% 1,491 15% 1,504 14%Total Trips 11,124 100% 11,688 100% 10,300 100% 10,680 100%
Annual Trips by Commodity Sector - Coastal and River
0
2,000
4,000
6,000
8,000
10,000
12,000
14,000
2006 2007 2008 2009 2010 2010 Budget
2011 Budget
Year
Coastal Fraser River
Exhibit 1 - Annual Pilotage Assignments

P A C I F I C P I L O t A g E A u t H O R I t Y 2 0 1 0 A n n u A L R E P O R t 7
the Authority’s monthly traffic pattern is remaining very consistent year over year. there is a seasonal spike due to the cruise ship sector during the months of May through September.
the Authority categorizes its assignments into four key traffic areas: Port Metro Vancouver, Vancouver Island, northern and Fraser River.
Port Metro Vancouver (PMV), which includes Roberts Bank and Deltaport, is the largest traffic centre representing 68 percent of all coastal assignments performed by the Authority. A significant highlight during 2010 was the opening of a new container berth at Deltaport which expands the annual capacity of this terminal by 600,000 tEus.
Export commodities shipped through PMV include grains, forest products, coal, sulphur, potash, chemicals and petroleum products. All of these commodities showed tonnage increases for the year 2010.
Additionally, both inbound and outbound container volumes increased substantially while vessel trips remained comparable to the prior year.
the single negative area was the cruise sector which saw a decrease in cruise ship calls and thus passengers through this port.
Vancouver Island assignments accounted for 10 percent of the Authority’s coastal pilotage assignments. During 2010, this area saw a
number of previously closed forest product mills reopen due to favourable market conditions. Ogden Point in Victoria remains a positive contributor serving cruise ship traffic transiting to Alaska.
the northern area includes Prince Rupert, Kitimat and Stewart. Ridley Island Coal almost doubled its tonnage from the year before, shipping 8.3 million tonnes making for its best year of record. the grain terminal saw a fifteen percent decrease in tonnage shipments during the year. Both of these terminals are located in the Prince Rupert port.
Fraser River traffic for 2010 was 997 assignments which is very comparable to the prior year’s level of 991. the River has two automobile terminals and one major bulk shipment dock. the River requires the services of a coastal pilot for the transit to and from the Sandheads boarding station which is located at the mouth of the Fraser River.
0
200
400
600
800
1000
1200
1400
J F M A M J J A S O N D
Assi
ngm
ents
Coastal Assignments River Assignments
Exhibit 2 - Assignments by MonthYear of 2010
01,0002,0003,0004,0005,0006,0007,0008,0009,000
Port Metro Vancouver
Vancouver Island
Northern Other Coastal
Fraser R iver
(Coastal)
Fraser River
Exhibit 3 - Annual Assignments by Area
Actual 2009 Actual 2010 Budget 2011
t r A f f i C
8 P A C I F I C P I L O t A g E A u t H O R I t Y 2 0 1 0 A n n u A L R E P O R t
f i n A n C i A l C o m m e n tA r y
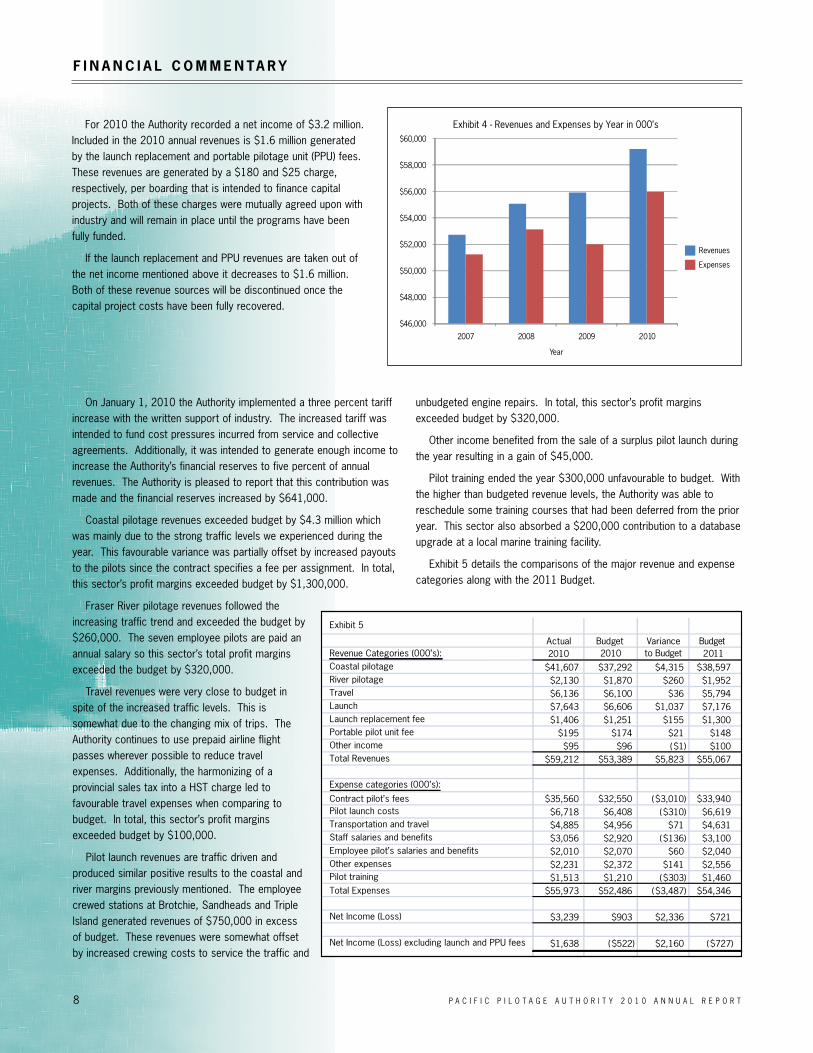
For 2010 the Authority recorded a net income of $3.2 million. Included in the 2010 annual revenues is $1.6 million generated by the launch replacement and portable pilotage unit (PPu) fees. these revenues are generated by a $180 and $25 charge, respectively, per boarding that is intended to finance capital projects. Both of these charges were mutually agreed upon with industry and will remain in place until the programs have been fully funded.
If the launch replacement and PPu revenues are taken out of the net income mentioned above it decreases to $1.6 million. Both of these revenue sources will be discontinued once the capital project costs have been fully recovered.
On January 1, 2010 the Authority implemented a three percent tariff increase with the written support of industry. the increased tariff was intended to fund cost pressures incurred from service and collective agreements. Additionally, it was intended to generate enough income to increase the Authority’s financial reserves to five percent of annual revenues. the Authority is pleased to report that this contribution was made and the financial reserves increased by $641,000.
Coastal pilotage revenues exceeded budget by $4.3 million which was mainly due to the strong traffic levels we experienced during the year. this favourable variance was partially offset by increased payouts to the pilots since the contract specifies a fee per assignment. In total, this sector’s profit margins exceeded budget by $1,300,000.
Fraser River pilotage revenues followed the increasing traffic trend and exceeded the budget by $260,000. the seven employee pilots are paid an annual salary so this sector’s total profit margins exceeded the budget by $320,000.
travel revenues were very close to budget in spite of the increased traffic levels. this is somewhat due to the changing mix of trips. the Authority continues to use prepaid airline flight passes wherever possible to reduce travel expenses. Additionally, the harmonizing of a provincial sales tax into a HSt charge led to favourable travel expenses when comparing to budget. In total, this sector’s profit margins exceeded budget by $100,000.
Pilot launch revenues are traffic driven and produced similar positive results to the coastal and river margins previously mentioned. the employee crewed stations at Brotchie, Sandheads and triple Island generated revenues of $750,000 in excess of budget. these revenues were somewhat offset by increased crewing costs to service the traffic and
unbudgeted engine repairs. In total, this sector’s profit margins exceeded budget by $320,000.
Other income benefited from the sale of a surplus pilot launch during the year resulting in a gain of $45,000.
Pilot training ended the year $300,000 unfavourable to budget. With the higher than budgeted revenue levels, the Authority was able to reschedule some training courses that had been deferred from the prior year. this sector also absorbed a $200,000 contribution to a database upgrade at a local marine training facility.
Exhibit 5 details the comparisons of the major revenue and expense categories along with the 2011 Budget.
$46,000
$48,000
$50,000
$52,000
$54,000
$56,000
$58,000
$60,000
2007 2008 2009 2010
Year
Exhibit 4 - Revenues and Expenses by Year in 000’s
Revenues
Expenses
Exhibit 5
Actual Budget Variance Budget Revenue Categories (000’s): 2010 2010 to Budget 2011Coastal pilotage $41,607 $37,292 $4,315 $38,597River pilotage $2,130 $1,870 $260 $1,952Travel $6,136 $6,100 $36 $5,794Launch $7,643 $6,606 $1,037 $7,176Launch replacement fee $1,406 $1,251 $155 $1,300Portable pilot unit fee $195 $174 $21 $148Other income $95 $96 ($1) $100Total Revenues $59,212 $53,389 $5,823 $55,067
Expense categories (000’s):
Contract pilot’s fees $35,560 $32,550 ($3,010) $33,940Pilot launch costs $6,718 $6,408 ($310) $6,619Transportation and travel $4,885 $4,956 $71 $4,631Staff salaries and benefits $3,056 $2,920 ($136) $3,100Employee pilot’s salaries and benefits $2,010 $2,070 $60 $2,040Other expenses $2,231 $2,372 $141 $2,556Pilot training $1,513 $1,210 ($303) $1,460Total Expenses $55,973 $52,486 ($3,487) $54,346
Net Income (Loss) $3,239 $903 $2,336 $721
Net Income (Loss) excluding launch and PPU fees $1,638 ($522) $2,160 ($727)

P A C I F I C P I L O t A g E A u t H O R I t Y 2 0 1 0 A n n u A L R E P O R t 9
Since inception in 1972 the Authority has been financially self-sufficient and continues to structure its finances in order to maintain this position.
Exhibit 6 compares the major expense categories as a percentage of total expenses for the year 2010.
Similar to prior years, approximately seventy-nine percent of the Authority’s total annual expenditures for the year were covered by either a service contract or collective agreements.
63%
12%
9%
5%4% 4% 3%
Exhibit 6 - Actual Expense Categories 2010
Contract pilots’ fees
Operating costs of pilotlaunches
Pilot transportation andtravel
Staff salaries andbenefits
Employee pilots’salaries and benefits
Other expenses
Exhibit 7Historical Financial Summary
(in thousands of dollars)
Actual Actual Actual Actual Actual Budget2006 2007 2008 2009 2010 2011
Financial ResultsRevenues $49,264 $52,738 $55,076 $55,925 $59,212 $55,067Expenses $48,232 $51,227 $53,146 $51,990 $55,973 $54,346Net Income (Loss) $1,032 $1,511 $1,930 $3,935 $3,239 $721
Financial PositionCurrent Assets $6,539 $7,006 $7,572 $10,216 $12,418 $10,712Current Liabilities $5,216 $8,282 $10,065 $9,181 $9,552 $7,769Working Capital $1,323 ($1,276) ($2,493) $1,035 $2,866 $2,943
Net Capital Assets $4,576 $8,844 $11,187 $10,629 $11,282 $11,546
Operating Indicators (Actual)
Average Number of PilotsCoastal 96 96 98 99 98 100Fraser River 9 8 8 7 7 7
Number of AssignmentsCoastal 11,673 11,821 11,406 11,055 11,446 10,580Fraser River 1,272 1,191 1,192 991 997 900
Average Pilotage Revenue per Assignment (Actual $)
Coastal $2,970 $3,171 $3,358 $3,531 $3,635 $3,648Fraser River $1,726 $1,934 $2,041 $2,113 $2,136 $2,169
f i n A n C i A l C o m m e n tA r y

10 P A C I F I C P I L O t A g E A u t H O R I t Y 2 0 1 0 A n n u A L R E P O R t
the Authority categorizes incident and accident reporting into three types of investigations. An incident or accident will not be classified until sufficient facts are available to assess the potential for safety improvements and may require on site evaluation or interviews.
Class “A” Investigations
Defines an investigation that has a high probability of improving navigation safety, in that, there is a significant potential for reducing the risk to persons, vessels or the environment.
Class “B” Investigations
Defines an investigation that has a medium probability of improving navigation safety, in that, there is a moderate potential for reducing the risk to persons, vessels or the environment.
Class “C” Investigations
Defines an investigation that has a low probability of improving navigation safety, in that, there is a limited potential for reducing the risk to persons, vessels or the environment.
Exhibit 8 shows the actual number of incidents the Authority has recorded over the last five years.
i n C i D e n t r e p o r t i n G
Exhibit 8
Incident FreeAssignments
TotalIncidentsYear Class A Class B Class C
2006 99.938% 8 0 3 52007 99.947% 7 0 0 72008 99.969% 4 0 0 42009 99.950% 6 0 2 42010 99.984% 2 0 0 2

P A C I F I C P I L O t A g E A u t H O R I t Y 2 0 1 0 A n n u A L R E P O R t 11
the Authority has endorsed an Enterprise Risk Management (ERM) Program.
ERM has been incorporated as part of the Authority’s strategy with the intention of ‘cultivating a culture of enterprise risk awareness’.
All areas have been incorporated into this Program, including entrepreneur and employee pilots, launches, dispatch and administration, along with the Board and management.
the ERM Committee is chaired by a Board member and includes representation from each of the areas mentioned above. the Committee reports to the Board, meets quarterly and re-evaluates the risk register with a view to identifying new risks and mitigation measures.
the focus for 2011 will continue to ensure the ‘high’ ranked risks have appropriate mitigation measures in place along with scenario planning, when appropriate.
the results of this Program are summarized in the grid below.
e n t e r p r i s e r i s k m A n A G e m e n t
Priority Risk Title Risk Rating
Likelihood Consequence
1 Criminalization of Pilots HIGH MEDIUM EXTREME
2 Recruitment - Coastal Pilots HIGH MEDIUM VERY HIGH
3 Operational Issues Impacting Vessel Movements HIGH MEDIUM VERY HIGH
4 Occupational Health and Safety Issues HIGH MEDIUM VERY HIGH
5 Training - Coastal Pilots MED LOW VERY HIGH
6 Economic and Financial Conditions MED LOW VERY HIGH
7 Information Technology MED LOW VERY HIGH
8 Recruitment and Training - Launch Crew MED LOW HIGH
9 Vessel Under Pilot Conduct Involved in an Accident MED LOW HIGH
10 Financial and Administrative Systems and Processes MED LOW HIGH
11 PPA Launch Involved in an Accident MED LOW HIGH
12 Recruitment and Training - River Pilots MED VERY LOW VERY HIGH
13 Legal and Regulatory LOW LOW MEDIUM
14 Efficiency or Resource Usage LOW LOW MEDIUM
15 Security of Physical Assets LOW LOW MEDIUM
16 Disaster, Emergency and Special Events Planning LOW VERY LOW HIGH
17 Human Resource Management for the PPA LOW VERY LOW HIGH
18 Delay of Vessel due to the PPA LOW VERY LOW MEDIUM
19 Emerging Risks
12 P A C I F I C P I L O t A g E A u t H O R I t Y 2 0 1 0 A n n u A L R E P O R t
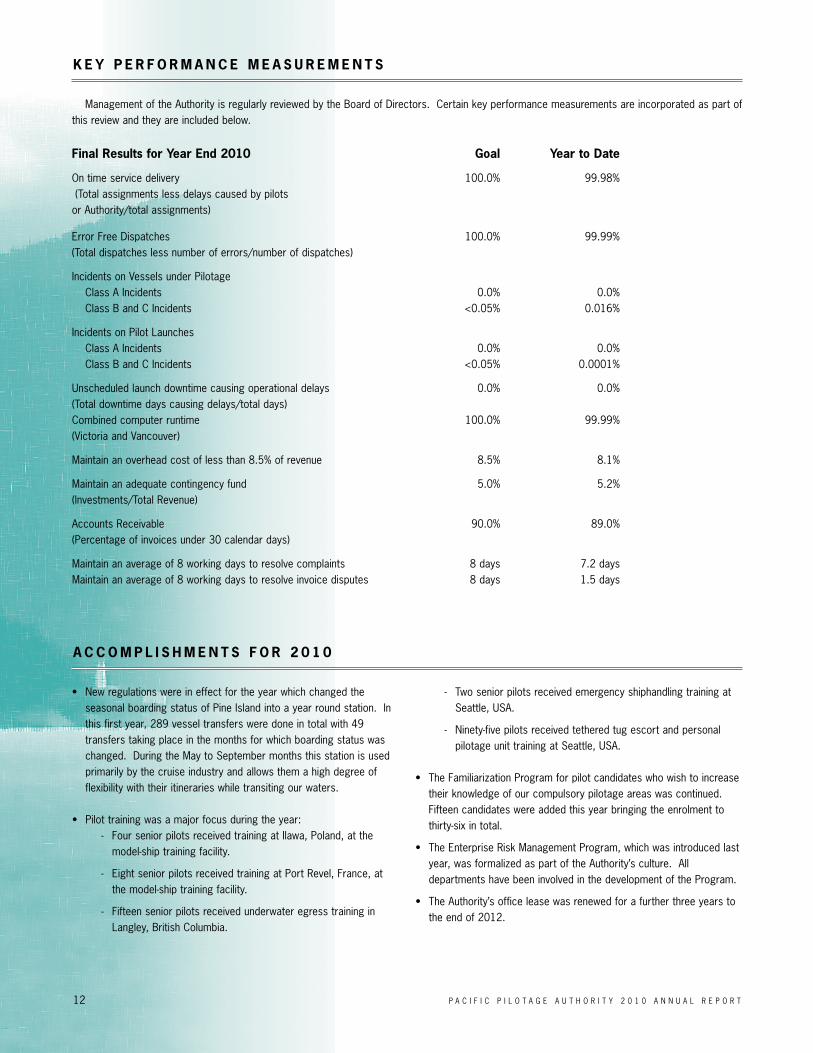
Management of the Authority is regularly reviewed by the Board of Directors. Certain key performance measurements are incorporated as part of this review and they are included below.
• new regulations were in effect for the year which changed the seasonal boarding status of Pine Island into a year round station. In this first year, 289 vessel transfers were done in total with 49 transfers taking place in the months for which boarding status was changed. During the May to September months this station is used primarily by the cruise industry and allows them a high degree of flexibility with their itineraries while transiting our waters. • Pilot training was a major focus during the year: - Four senior pilots received training at Ilawa, Poland, at the model-ship training facility.
- Eight senior pilots received training at Port Revel, France, at the model-ship training facility.
- Fifteen senior pilots received underwater egress training in Langley, British Columbia.
- two senior pilots received emergency shiphandling training at Seattle, uSA.
- ninety-five pilots received tethered tug escort and personal pilotage unit training at Seattle, uSA. • the Familiarization Program for pilot candidates who wish to increase their knowledge of our compulsory pilotage areas was continued. Fifteen candidates were added this year bringing the enrolment to thirty-six in total.
• the Enterprise Risk Management Program, which was introduced last year, was formalized as part of the Authority’s culture. All departments have been involved in the development of the Program.
• the Authority’s office lease was renewed for a further three years to the end of 2012.
final results for year end 2010 Goal year to Date
On time service delivery 100.0% 99.98% (total assignments less delays caused by pilots or Authority/total assignments) Error Free Dispatches 100.0% 99.99% (total dispatches less number of errors/number of dispatches) Incidents on Vessels under Pilotage Class A Incidents 0.0% 0.0% Class B and C Incidents <0.05% 0.016% Incidents on Pilot Launches Class A Incidents 0.0% 0.0% Class B and C Incidents <0.05% 0.0001% unscheduled launch downtime causing operational delays 0.0% 0.0% (total downtime days causing delays/total days)Combined computer runtime 100.0% 99.99% (Victoria and Vancouver) Maintain an overhead cost of less than 8.5% of revenue 8.5% 8.1% Maintain an adequate contingency fund 5.0% 5.2% (Investments/total Revenue) Accounts Receivable 90.0% 89.0% (Percentage of invoices under 30 calendar days) Maintain an average of 8 working days to resolve complaints 8 days 7.2 daysMaintain an average of 8 working days to resolve invoice disputes 8 days 1.5 days
k e y p e r f o r m A n C e m e A s u r e m e n t s
A C C o m p l i s h m e n t s f o r 2 0 1 0

P A C I F I C P I L O t A g E A u t H O R I t Y 2 0 1 0 A n n u A L R E P O R t 13
• two labour contracts expired during 2010 and were negotiated in line with the government’s Cost Containment Program parameters.
• the Authority hosted meetings in Vancouver involving West Coast pilotage authorities from California, Oregon, Washington State and Alaska. Matters of mutual interest were discussed with the intention of holding another round of meetings in 2012.
• the Authority’s leadership within the marine community was further affirmed by the Pacific north Coast Integrated Management Area
(PnCIMA) report and being invited to participate in a tanker forum hosted by municipal governments.
• the Authority’s President and CEO was quoted numerous times in the press relating to tanker issues and pilotage operations.
• the Authority’s employees participated in a successful bicycling fundraiser for the Mission to Seafarers in Vancouver.
During the year 2010, two coastal pilots received their Class II licences and two more apprentices were started in December.
With the intake of the two apprentices during the month of December the coastal eligibility list was reduced to two candidates as of December 31, 2010. the Authority has scheduled the next examination session for February 2011 with twenty-six candidates scheduled to participate.
At December 31, 2010 there are five candidates on the eligibility list for the Fraser River.
the Authority also conducts a Pilot Familiarization Program for interested candidates. this Program is limited to 40 candidates (current enrolment is 36) who participate in order to supplement and upgrade their coast-wide knowledge.
the Authority’s management team continued the annual agency visitation program, meeting with thirty percent of active shipping agencies during the year.
Customer surveys and service levels expected of the Authority have been incorporated into the strategic plan and are measured on a regular basis.
the Authority’s management team continues to meet with the Chamber of Shipping (CS) representatives on a regular basis. During the year, a tariff application was gazetted after receiving written support
from the CS and it proceeded through the regulatory process without objection.
the Authority’s Director of Marine Operations attends the Chamber of Shipping’s navigation Services Committee meetings on a regular basis as an invited guest. this enables the Authority and industry to collectively resolve issues as they arise.
the Authority continues to be an active member of the Western transportation Advisory Council (WEStAC), the northwest Corridor Development Corporation (nCDC) and the Pacific gateway.
A C C o m p l i s h m e n t s f o r 2 0 1 0
Q u A l i f i e D p i l o t C A n D i D At e s A s At D e C e m b e r 3 1 , 2 0 1 0
r e G u l A r C o n s u ltAt i o n s W i t h s tA k e h o l D e r s

14 P A C I F I C P I L O t A g E A u t H O R I t Y 2 0 1 0 A n n u A L R E P O R t
Preparations are underway for 2011 and future years to ensure we maintain our traditional high level of service to all stakeholders.
We continue to actively monitor all projects proposed in our jurisdiction by analyzing the impact they might have on assignments and pilot numbers. Some of the major projects we are currently monitoring are:
• Stage II of the Prince Rupert container facility projected to triple capacity to 2.0 million tEus; • a liquid natural gas terminal in the Kitimat area; • a crude oil pipeline terminal in Kitimat; • a new terminal at Deltaport which would double Port Metro Vancouver’s container volumes.
the enormous scope of these projects will undoubtedly have profound impacts on our business model. to this end we remain committed to
ensure that our strategies recognize the challenges and find the Authority ready for change.
Our monitoring includes the federal emission control area legislation which will cover every vessel entering our jurisdiction, especially the Alaska cruise ships. Also of major scope is the widening of the Panama Canal and how that will affect shipping and trade patterns both locally and globally.
the computer system upgrade program will be continued during 2011. this enhancement will include features such as Automatic Identification System (AIS) interface, mobile communication units for pilots, Internet ordering for customers and automated pilot dispatching.
Our efforts in the coming years continue to be directed towards our vision of being ‘a world leader in marine pilotage’.
there is no question that the Authority’s traffic levels and thus finances are affected by the fortunes of the industries we serve. For 2011 the Authority has maintained its conservative approach to budgeting by basing its expenditures on 10,580 coastal and 900 river assignments. these traffic levels take into account a number of factors:
• the ongoing global economic uncertainty. • the increasing price of oil.
• grain forecasts which are indicating a significant reduction in tonnages for the coming crop year. grain trips are especially significant to the Authority’s traffic volumes since they tend to load at multiple berths and shift between anchorages in order to get full cargoes. the Authority has budgeted for 700 fewer assignments in this sector when compared to the prior year.
With industry support during 2010, the Authority gazetted and received approval to adjust unit and hourly tariff rates by 2.9 percent which will match service contracts in place for 2011. Launch and travel
rates will be adjusted 1.5 percent to match labour contracts and travel cost increases during the year.
the Authority will be converting to IFRS for the December 31, 2011 year-end in accordance with Canadian gAAP. In preparation for this conversion, the Authority has completed an initial diagnostic and established a transition plan. A summary of the progress and the expected financial reporting impact is listed below.
For the 2008 reporting year, the Authority componentized its launch amortization which is in line with the IFRS standards. For the 2009 reporting year, the Authority has measured its employee severance benefits on an actuarial basis using the projected benefit method prorated on service, which is in line with IFRS standards.
Additionally, the Authority is using external advisors to assist with the conversion and is monitoring developments in the new standards as they arise.
the Authority’s external auditors have made comment that ‘the Authority appears to be on track in terms of preparedness for its IFRS transition’.
l o o k i n G A h e A D – 2 0 1 1 A n D b e y o n D
e C o n o m i C
f i n A n C i A l – tA r i f f A D j u s t m e n t A s o f j A n u A r y 1 , 2 0 1 1
i n t e r n At i o n A l f i n A n C i A l r e p o r t i n G s tA n D A r D s ( i f r s )
Accounting Policy Policy change expected onchange to IFRS
Is there an IFRS 1 exemption available?
Will the IFRS 1 exemption be applied?
Revenue recognition
No No N/A
Property, plant and equipment
No Yes No
Borrowing costs No Yes No
Employee benefits Yes Yes Yes

P A C I F I C P I L O t A g E A u t H O R I t Y 2 0 1 0 A n n u A L R E P O R t 15
On an annual basis, the Authority engages in strategic planning sessions involving the Board of Directors and management. the most
recent session held during September 2010, endorsed the key objectives and strategies with a few minor revisions which are summarized below.
s t r At e G i C G o A l s f o r 2 0 1 1
StrategicGoal
Description Strategy Strategy
#1.1 Create a cu l ture of qual ity serv ice Implementation of Pi l ot AssessmentProgram
Standard ized procedures
#1.2 Continue to cul t ivate enterprise r isk awareness
Mitigat ion pl ans for h igh r isks i n pl ace
Conti nue to integrate company - w ide
#2.1 Maintain f i nancial self -suff iciency F i nancial reserv e of 5percent of annual revenues
#2.2 Cost management Maintain overhead costs at 8.5 percent or less
Annual increase i n operational costs maintai ned at CPI or less
#2.3 Improve compet itive edge Rev iew pi l otage fees to retai n competi ti v eedge
#3.1 Effectiv e and eff icient dispatchprocedures
Implement and integrate I SO system
Tracking of delay s
#3.2 Effective and eff icient l aunch operations
Implement and integrate I SO system
Computeri zed maintenance system
#3.3 Enhance the overal l producti v ity of theAuthor ity
Formal i ze trai n i ngprogram for pi lots
Standardi zed train i ng for staff
#4.1 Create a cu l ture of sustainabi l i ty Communicate Sustainabi l i ty Pol icy
I mplement practi ces and procedures
#5.1 Primary source for marine- related in formation
Implement stage 2 of computer database
U t i l i ze database and websi te
#5.2 Raise the prof i le of the Authori ty Management to take on l eadersh ip roles
Communi ty Outreach Program

16 P A C I F I C P I L O t A g E A u t H O R I t Y 2 0 1 0 A n n u A L R E P O R t
the Authority measures its strategic goals on an annual basis.
m e A s u r e m e n t o f 2 0 1 0 s t r At e G i C G o A l s
S t R A t E g I C g O A L # 1 . 1 - E n S u R E A S u S t A I n A B L E S u P P LY O F P I L O t S
Strategy Description Measurement 2009 and 2010
1.1(a) Working in partnership with the BCCP, p r e p a r e a n d i m p l e m e n t a comprehensive long-term plan to ensure an adequate supply of qualified candidates, including the examination of the sustainability of the present system.
2009: Regu lat ions were changed and implemented which inc lude deep sea mariner’s time. This will increase the pool of qualified candidates.2010: Increased the Familiarization Program maximum candidates from 20 to 40.Marine pilotage was promoted as a career choice at two job fairs.Candidates writing the coastal exam have increased from 22 in 2009 to 29 in 2010 (32% increase).
1.1(b) Working with the Pilotage Training and Examination Committee (PTEC), review the present apprenticeship program, m a k e r e c o m m e n d a t i o n s a n d implement agreed upon changes to ensure a consistent and effective training methodology.
2009: The initial part of this review was completed with a number of changes to the sea-time requirements.2010: Analysis of 2010 exams indicated overall pass rate remained same as prior year.
1.1(c) Working in partnership with the BCCP and the marine industry, develop a financial forecasting model that will allow a more analytical approach to the future manning requirements of the Authority.
2009: The new computer system has facil i tated the reporting of trips at the terminal and berth level. This has allowed the Authority to expand its commodity sector analysis and budgeting process. The analysis is shared annually with the industry and pilots.A forecasting model was produced during the year and presented to the Authority’s Board of Directors. It has become evident that a viable forecasting model of this sort is difficult to develop due to the complex and multiple variables involved.2010: Monthly traffic analysis incorporated into financial statement reporting package.

P A C I F I C P I L O t A g E A u t H O R I t Y 2 0 1 0 A n n u A L R E P O R t 17
S t R A t E g I C g O A L # 1 . 2 - C R E A t E A C u Lt u R E O F Q u A L I t Y S E R V I C E
Strategy Description Measurement 2009 and 20101.2(a) Working in partnership with the pilots
and the industry we serve, develop a program of quality service, based on best practices that ensures we are measured as leaders in a number of areas.
• Safety level - incident rate• Se r v i c e l e ve l - d e l a ys t o
service, responsiveness to client needs
• Predictability-consistently knowing what to expect
• Transp a renc y - op en a nd hones t commun ica t i on i n everything we do
• Training - ongoing relevant and effective training
2009: Safety level – incidents are reportedin the annual report.Service level – ‘service delivery’ and ‘errorf ree d ispatches ’ a re inc luded in keyperformance measurements.A Quality Assurance Program has beendeveloped and is currently under review bythe pilots. The system to audit each pilot has beenexpanded to include port currency, training,incidents, complaints, commendations andmedicals.2010: Train the Trainer course developed.Assessment form amended and awaitingapproval from BCCP members.Initial phase implemented - all pilots up to 3rd
year are being assessed.
1.2(b) Working with the launch crew and dispatch personnel to develop a quality assurance program based on industry best practices such as ISO, ISM or any other management tool.
2009: Management has agreed that the most suitable program is the ISO9001. The development of this program was deferred to 2010 due to the cost saving program implemented in 2009.2010: Request tendered and interviews of ISO consultants were completed.Initial information relating to ISO process has been sent to all launch employees.

18 P A C I F I C P I L O t A g E A u t H O R I t Y 2 0 1 0 A n n u A L R E P O R t
S t R A t E g I C g O A L # 1 . 3 - C R E A t E A C u Lt u R E O F E n t E R P R I S E R I S K A W A R E n E S S
S t R At E g I C g O A L # 2 . 1 - C R E At E A C u Lt u R E O F C O S t A W A R E n E S S t H R O u g H O u t t H E A u t H O R I t Y
Strategy Description Measurement 2009 and 20101.3(a) Implement an Enterprise Risk
Management (ERM) Program throughout the Authority.
2009: Completed during 2009.2010: Quarterly meetings held with departmental representatives.Scenario planning implemented for highly rated risks.Intranet website for employees in place to share ERM information.
1.3(b) Communicate the results of the risk assessments departmentally and company-wide on a semi-annual basis until risk management becomes part of the Authority’s culture.
2009: Initial departmental meetings conducted.2010: Identified risks are being communicated to appropriate parties.ERM updates incorporated into annual staff meetings.
Strategy Description Measurement 2009 and 20102.1(a) Develop cost management programs
with accountability and specific targets for every department in the Authority.
2009: Semi-annual staff meetings include financial targets.Enhanced departmental financial statements distributed to users.2010: Managers input reflected in annual budgeting process.Annual percentage goals developed for year:Coastal travel expenses - 2.0% increase goal, 1.3% increase actual.Launch fixed expenses - 2.0% increase goal, 12.7% decrease actual.
2.1(b) Ensure that the Authority remains competitive.
2009 and 2010: A cost comparison of pilotage fees for West Coast ports indicates the Authority remains competitive.
P A C I F I C P I L O t A g E A u t H O R I t Y 2 0 1 0 A n n u A L R E P O R t 19
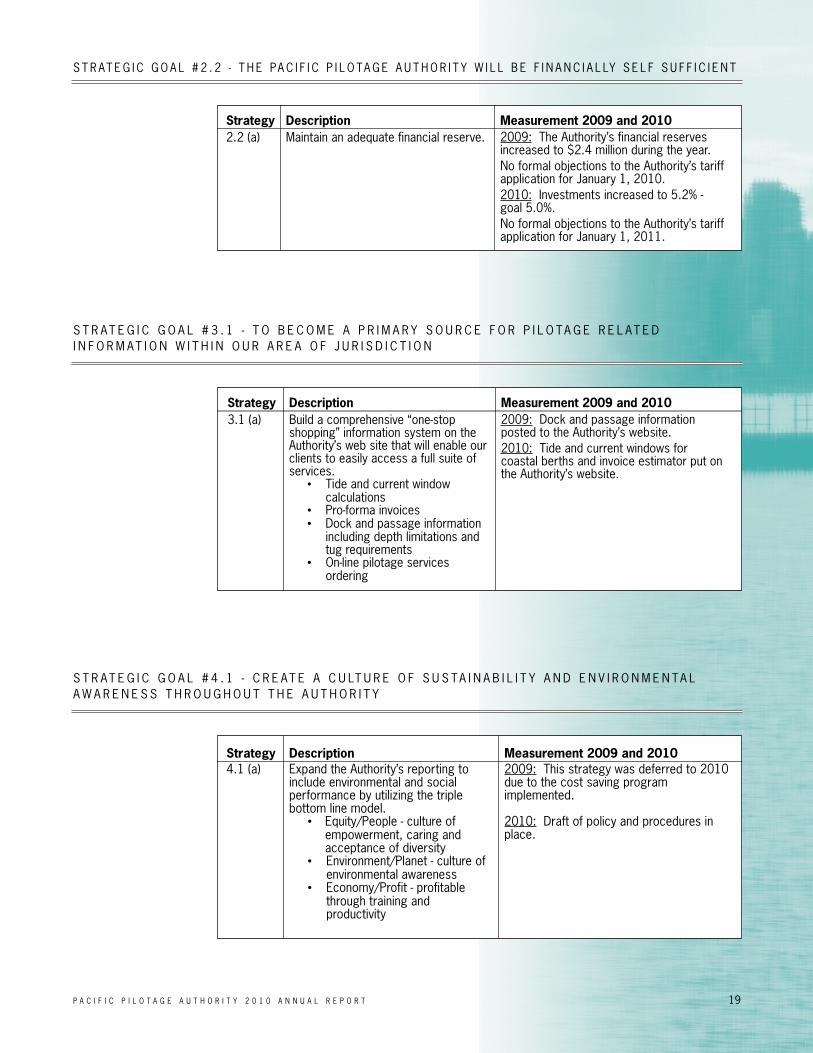
S t R At E g I C g O A L # 2 . 2 - t H E PA C I F I C P I L O tA g E A u t H O R I t Y W I L L B E F I n A n C I A L LY S E L F S u F F I C I E n t
S t R A t E g I C g O A L # 3 . 1 - t O B E C O M E A P R I M A R Y S O u R C E F O R P I L O t A g E R E L A t E D I n F O R M A t I O n W I t H I n O u R A R E A O F J u R I S D I C t I O n
S t R A t E g I C g O A L # 4 . 1 - C R E A t E A C u Lt u R E O F S u S t A I n A B I L I t Y A n D E n V I R O n M E n t A L A W A R E n E S S t H R O u g H O u t t H E A u t H O R I t Y
Strategy Description Measurement 2009 and 20102.2 (a) Maintain an adequate financial reserve. 2009: The Authority’s financial reserves
increased to $2.4 million during the year. No formal objections to the Authority’s tariff application for January 1, 2010. 2010: Investments increased to 5.2% - goal 5.0%.No formal objections to the Authority’s tariff application for January 1, 2011.
Strategy Description Measurement 2009 and 20103.1 (a) Build a comprehensive “one-stop
shopping” information system on the Authority’s web site that will enable our clients to easily access a full suite of services.
• Tide and current window calculations
• Pro-forma invoices• Dock and passage information
including depth limitations and tug requirements
• On-line pilotage services ordering
2009: Dock and passage information posted to the Authority’s website.2010: Tide and current windows for coastal berths and invoice estimator put on the Authority’s website.
Strategy Description Measurement 2009 and 20104.1 (a) Expand the Authority’s reporting to
include environmental and social performance by utilizing the triple bottom line model.
• Equity/People - culture of empowerment, caring and acceptance of diversity
• Environment/Planet - culture of environmental awareness
• Economy/Profit - profitable through training and productivity
2009: This strategy was deferred to 2010 due to the cost saving program implemented.
2010: Draft of policy and procedures in place.

20 P A C I F I C P I L O t A g E A u t H O R I t Y 2 0 1 0 A n n u A L R E P O R t
s tAt e m e n t o f m A n A G e m e n t r e s p o n s i b i l i t y
these financial statements have been prepared by the Authority’s management in accordance with Canadian generally accepted accounting principles, using management’s best estimates and judgements, where appropriate. the Authority’s management is responsible for the integrity and objectivity of the information in the financial statements and annual report.
Management maintains a system of internal control designed to provide reasonable assurance that assets are safeguarded and controlled, transactions comply with relevant authorities and accounting systems provide relevant and reliable financial information.
the Board of Directors of the Authority is responsible for ensuring that management fulfils its responsibilities for financial reporting and internal control. the Board exercises this responsibility through an Audit Committee, which meets regularly with management and the auditor. the financial statements and annual report are reviewed and approved by the Board of Directors on the recommendation of the Audit Committee.
the independent auditor, the Auditor general of Canada, is responsible for auditing the transactions and financial statements of the Authority and for issuing her report thereon. K. g. Obermeyer B. D. Chadwick PresidentandChiefExecutiveOfficer DirectorofFinance February 24, 2011

P A C I F I C P I L O t A g E A u t H O R I t Y 2 0 1 0 A n n u A L R E P O R t 21
i n D e p e n D e n t A u D i t o r ' s r e p o r t
to the Minister of transport, Infrastructure and Communities
report on the financial statements
I have audited the accompanying financial statements of the Pacific Pilotage Authority, which comprise the balance sheet as at 31 December 2010, and the statement of income, comprehensive income and retained earnings and statement of cash flows for the year then ended, and a summary of significant accounting policies and other explanatory information.
Management’sResponsibilityfortheFinancialStatements
Management is responsible for the preparation and fair presentation of these financial statements in accordance with Canadian generally accepted accounting principles, and for such internal control as management determines is necessary to enable the preparation of financial statements that are free from material misstatement, whether due to fraud or error.
Auditor’sResponsibility
My responsibility is to express an opinion on these financial statements based on my audit. I conducted my audit in accordance with Canadian generally accepted auditing standards. those standards require that I comply with ethical requirements and plan and perform the audit to obtain reasonable assurance about whether the financial statements are free from material misstatement.
An audit involves performing procedures to obtain audit evidence about the amounts and disclosures in the financial statements. the procedures selected depend on the auditor’s judgement, including the assessment of the risks of material misstatement of the financial statements, whether due to fraud or error. In making those risk assessments, the auditor considers internal control relevant to the entity’s preparation and fair presentation of the financial statements in order to design audit procedures that are appropriate in the circumstances, but not for the purpose of expressing an opinion on the effectiveness of the entity’s internal control. An audit also includes evaluating the appropriateness of accounting policies used and the reasonableness of accounting estimates made by management, as well as evaluating the overall presentation of the financial statements.
I believe that the audit evidence I have obtained is sufficient and appropriate to provide a basis for my audit opinion.
Opinion
In my opinion, the financial statements present fairly, in all material respects, the financial position of the Pacific Pilotage Authority as at 31 December 2010, and the results of its operations and its cash flows for the year then ended in accordance with Canadian generally accepted accounting principles. report on other legal and regulatory requirements
As required by the FinancialAdministrationAct, I report that, in my opinion, Canadian generally accepted accounting principles have been applied on a basis consistent with that of the preceding year.
Further, in my opinion, the transactions of the Pacific Pilotage Authority that have come to my notice during my audit of the financial statements have, in all significant respects, been in accordance with Part X of the FinancialAdministrationAct and regulations, the PilotageAct and regulations, and the by-laws of the Pacific Pilotage Authority.
guy Legras, CA PrincipalfortheAuditorGeneralofCanada24February2011Vancouver,Canada

22 P A C I F I C P I L O t A g E A u t H O R I t Y 2 0 1 0 A n n u A L R E P O R t
f i n A n C i A l s tAt e m e n t s
balance sheet as at December 31 (in thousands)
Assets 2010 2009_______________________________________________________________________________________
Current
Cash and cash equivalents $ 6,805 $ 5,387
Derivative financial asset (note 4) 13 61
Accounts receivable, trade (note 4) 4,624 4,000
Prepaid expenses and other receivables 976 768_______________________________________________________________________________________
12,418 10,216_______________________________________________________________________________________
non-current
Long-term investments (note 5) 3,059 2,418
Property and equipment (note 6) 11,282 10,629
Intangible asset (note 7) 280 300_______________________________________________________________________________________
14,621 13,347_______________________________________________________________________________________
$ 27,039 $ 23,563_______________________________________________________________________________________
liAbilities
Current
Accounts payable and accrued liabilities $ 5,920 $ 4,905
Bank indebtedness (note 8) 3,632 4,276_______________________________________________________________________________________
9,552 9,181_______________________________________________________________________________________
non-current
Employee severance benefits (note 10) 992 1,126_______________________________________________________________________________________
992 1,126_______________________________________________________________________________________
10,544 10,307_______________________________________________________________________________________
eQuity
Contributed capital 806 806
Retained earnings 15,689 12,450_______________________________________________________________________________________
16,495 13,256_______________________________________________________________________________________
$ 27,039 $ 23,563_______________________________________________________________________________________
Commitments (note 14)
Theaccompanyingnotesareanintegralpartofthesefinancialstatements.
Approved by the Board of Directors:
Chair: ____________________________ Member: ____________________________
P A C I F I C P I L O t A g E A u t H O R I t Y 2 0 1 0 A n n u A L R E P O R t 23
f i n A n C i A l s tAt e m e n t s
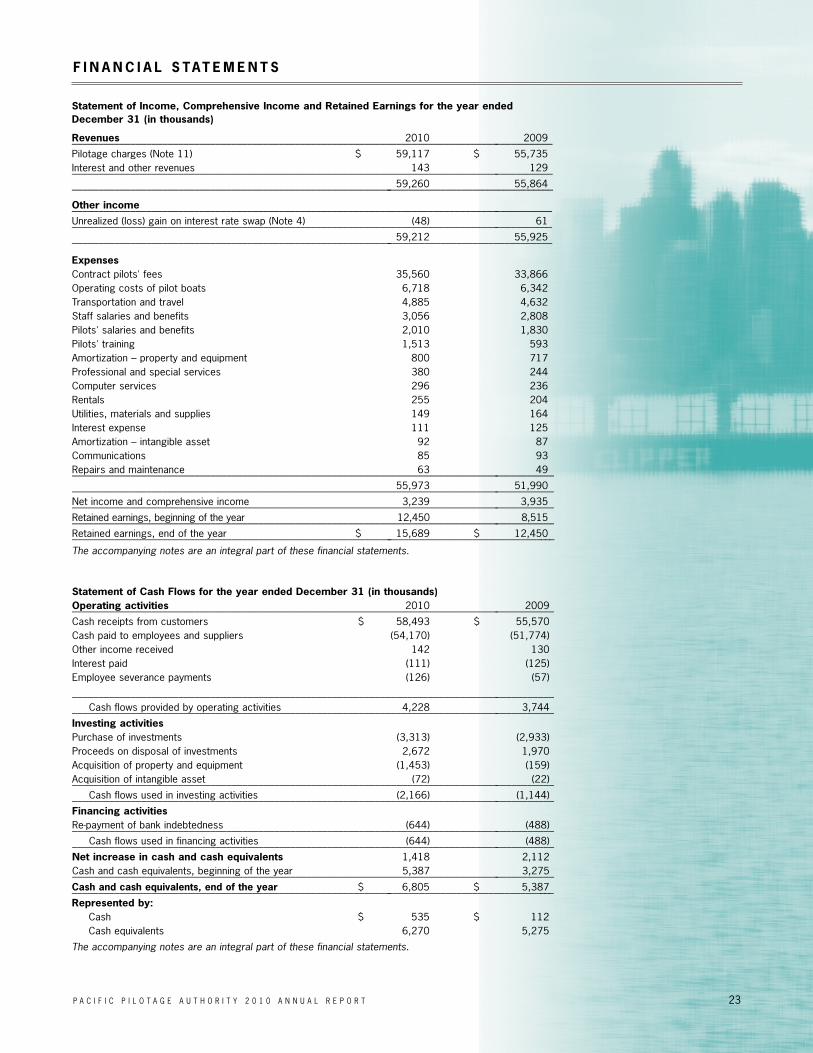
statement of income, Comprehensive income and retained earnings for the year ended December 31 (in thousands)
revenues 2010 2009___________________________________________________________________________________________Pilotage charges (note 11) $ 59,117 $ 55,735Interest and other revenues 143 129___________________________________________________________________________________________ 59,260 55,864____________________________________________________________________________________________
other income___________________________________________________________________________________________unrealized (loss) gain on interest rate swap (note 4) (48) 61___________________________________________________________________________________________ 59,212 55,925___________________________________________________________________________________________
expensesContract pilots' fees 35,560 33,866Operating costs of pilot boats 6,718 6,342transportation and travel 4,885 4,632Staff salaries and benefits 3,056 2,808Pilots' salaries and benefits 2,010 1,830Pilots' training 1,513 593Amortization – property and equipment 800 717Professional and special services 380 244Computer services 296 236Rentals 255 204utilities, materials and supplies 149 164Interest expense 111 125Amortization – intangible asset 92 87Communications 85 93Repairs and maintenance 63 49___________________________________________________________________________________________ 55,973 51,990___________________________________________________________________________________________net income and comprehensive income 3,239 3,935___________________________________________________________________________________________Retained earnings, beginning of the year 12,450 8,515___________________________________________________________________________________________Retained earnings, end of the year $ 15,689 $ 12,450____________________________________________________________________________________________
Theaccompanyingnotesareanintegralpartofthesefinancialstatements.
statement of Cash flows for the year ended December 31 (in thousands)operating activities 2010 2009___________________________________________________________________________________________Cash receipts from customers $ 58,493 $ 55,570Cash paid to employees and suppliers (54,170) (51,774)Other income received 142 130Interest paid (111) (125)Employee severance payments (126) (57)
___________________________________________________________________________________________ Cash flows provided by operating activities 4,228 3,744___________________________________________________________________________________________ investing activities Purchase of investments (3,313) (2,933)Proceeds on disposal of investments 2,672 1,970Acquisition of property and equipment (1,453) (159)Acquisition of intangible asset (72) (22)___________________________________________________________________________________________ Cash flows used in investing activities (2,166) (1,144)___________________________________________________________________________________________ financing activitiesRe-payment of bank indebtedness (644) (488)___________________________________________________________________________________________ Cash flows used in financing activities (644) (488)___________________________________________________________________________________________ net increase in cash and cash equivalents 1,418 2,112Cash and cash equivalents, beginning of the year 5,387 3,275___________________________________________________________________________________________ Cash and cash equivalents, end of the year $ 6,805 $ 5,387____________________________________________________________________________________________represented by: Cash $ 535 $ 112 Cash equivalents 6,270 5,275
Theaccompanyingnotesareanintegralpartofthesefinancialstatements.

24 P A C I F I C P I L O t A g E A u t H O R I t Y 2 0 1 0 A n n u A L R E P O R t
f i n A n C i A l s tAt e m e n t s
1. Authority and objectives
the Pacific Pilotage Authority (the Authority) was established in 1972 pursuant to the PilotageAct. the objectives of the Authority are to establish, operate, maintain and administer a safe and efficient pilotage service within designated Canadian waters. the Act further provides that the tariffs of pilotage charges shall be fixed at a level that permits the Authority to operate on a self-sustaining financial basis and shall be fair and reasonable.
Coastal pilotage services are provided by the British Columbia Coast Pilots Ltd. under an agreement for services. Pilotage services on the Fraser River are provided by employee pilots.
the Authority is a Crown corporation named in Part I of Schedule III to the FinancialAdministrationAct and is not subject to any income taxes.
regulation of tariffs of pilotage charges
the tariffs of pilotage charges that the Authority charges to vessels subject to compulsory pilotage are governed by the PilotageAct. With the approval of the governor in Council, the Authority makes regulations to prescribe tariffs of pilotage charges to be paid to the Authority.
As set out in the PilotageAct, the Authority must first publish the proposed tariffs of pilotage charges in the Canada gazette. Any person who has reason to believe that the proposed pilotage charges are not in the public interest may file a notice of objection, setting out the grounds therefore, with the Canadian transportation Agency (the Agency), an entity related to the Authority as a federal organization. In such a case, the Agency must investigate whether the proposed charges are in the public interest, including the holding of public hearings. After conducting the investigation, the Agency must make a recommendation within 120 days from the receipt of the notice of objection, and the Authority is required to govern itself accordingly.
the tariffs may come into force 30 days after their publication in the Canada gazette. However, where the Agency recommends pilotage charges that are lower than that prescribed by the Authority, the Authority is required to reimburse the difference between the prescribed charges and the charges recommended by the Agency, plus interest, to any person who has paid the prescribed charges. ThePilotageAct stipulates that the governor in Council may vary or rescind a recommendation of the Canadian transportation Agency.
the tariffs of pilotage charges must be fair and reasonable, and must enable the Authority to operate on a self-sustaining financial basis. thus, the tariffs are intended to allow the Authority to recover its costs and fund the acquisition of capital assets.
2 future accounting changes
International Financial Reporting Standards (IFRS)
In February 2008, the Canadian Institute of Chartered Accountants Accounting Standards Board (AcSB) confirmed the transition to IFRS from
Canadian generally accepted accounting principles (gAAP) will be required for publicly accountable enterprises for interim and annual financial statements effective for fiscal years beginning on or after January 1, 2011, including comparatives for 2010. As a government business enterprise, the Authority is required to adopt IFRS effective January 1, 2011.
the Authority has substantially completed the process of transitioning from current Canadian gAAP to IFRS. It has established a formal project plan, allocated internal resources and engaged expert consultants to assist with the transition from gAAP to IFRS reporting. the Audit Committee and the Board of Directors are regularly updated with the progress of the convergence project through communication and meetings. the Authority’s transition date for converting to IFRS is January 1, 2010 and comparative periods for 2010 will be restated under IFRS. the Authority continues to monitor developments in the standards issued by the International Accounting Standards Board and the AcSB. Based on the standards effective for our conversion, the required changes to our accounting policies will not have a significant impact on our financial results. there will be changes to our financial statement presentation and expanded financial statement note disclosure mostly in the area of employee benefits.
3. significant accounting policies
these financial statements have been prepared in accordance with Canadian generally accepted accounting principles. the significant accounting policies are as follows:
(a) Cash equivalents
Cash equivalents represent short-term, highly liquid investments and consist of Canadian dollar deposits held at Canadian chartered banks, earning a weighted average interest rate of 1.0% (2009 - 0.6%).
(b) Investments
the objective of the Authority’s long-term investment policy is to maximize the investment rate of return in a government of Canada guaranteed bond portfolio.
Pursuant to CICA Handbook Section 3855 “FinancialInstruments-RecognitionandMeasurement”, the Authority has elected to designate all investments as held for trading. Consequently, investments are initially recorded at fair value, and subsequently re-measured to fair value at each reporting date. Fair value is based on the quoted price of the securities at the reporting date. Purchases and sales of investments are recognized on a settlement date basis.
Realized gains and losses from the sale of investments are recognized in interest and other revenues in the period realized. unrealized gains and losses from fluctuations in fair value are recognized in interest and other revenues in the period in which they occur. Income from interest is recognized in the period earned. Interest and other revenues is presented net of investment expenses.

P A C I F I C P I L O t A g E A u t H O R I t Y 2 0 1 0 A n n u A L R E P O R t 25
f i n A n C i A l s tAt e m e n t s
(c) Property and equipment
Property and equipment are recorded at cost. the cost of assets constructed by the Authority includes design, project management, legal, materials, interest on construction loans, and construction costs. Spare engines are carried at cost and will be amortized when put into use. Amortization is calculated on a straight-line basis and is based on the estimated useful lives of the assets as follows:
Buildings and floats 10-20 years
Pilot boats 25 years
Pilot boat engines 7,500 - 10,000 running hours
Pilot boat generators 10 years
Equipment - communication and other 10 years - computers 3 years
Leasehold improvements 10 years or remaining term of lease
(d) Intangible assets
Intangible assets with a definite useful life are recorded at cost and amortized on a straight-line basis over their estimated useful lifes, as follows:
Software 5 years
(e) Employee severance benefits
Employees are entitled to specified severance benefits as provided for under collective agreements or employment contracts, based on their years of service and final salary. the liability for these payments is estimated and recorded in the accounts as the benefits accrue to the employees.
the costs and the benefit obligation are actuarially determined using the projected benefit method prorated on service that incorporates management’s best estimate of the rate of employee turnover, retirement age, future salary and benefit levels, and other actuarial factors.
the excess of the net accumulated actuarial gain (loss) over 10% of the greater of the benefit obligation and the fair value of plan assets is amortized over the expected average remaining service lifetime (EARSL) of active employees. this EARSL has been determined to be 10 years in 2010 (2009 – 10 years) for post-employment severance benefits.
(f) Pension plan
All eligible employees participate in the Public Service Pension Plan (the Plan) administered by the government of Canada. the Authority’s contribution to the Plan reflects the full cost of the employer contributions. this amount is currently based on a multiple of the employee’s required contributions, and may change from time to time depending on the experience of the Plan. these contributions represent the total pension obligations of the Authority and are expensed during the year in which the services are rendered. the Authority is not currently required to make contributions with respect to any actuarial deficiencies of the Public Service Pension Plan.
(g) Contributed capital
Amounts representing the values assigned to property and equipment transferred from the government of Canada in 1972 and the cost of property and equipment financed from previous parliamentary appropriations are shown as contributed capital.
(h) Revenue recognition
Revenues from pilotage charges are recognized on an accrual basis when pilotage services are provided.
(i) Financial instruments
the Authority has classified its financial instruments as follows:
• Cash and cash equivalents are designated as held for trading since they can be reliably measured at fair value and are measured at fair value.
• Long-term investments are classified as held for trading and are recorded at fair value with unrealized gains and losses from fluctuations in fair value recognized in interest and other revenues in the period in which they occur. Measuring these investments at fair value provides better alignment between the accounting results and how the portfolio is managed.
• Accounts receivable, classified as loans and receivables, and accounts payable and bank indebtedness, classified as other financial liabilities, are initially measured at fair value, and subsequently measured at amortized cost using the effective interest rate method. Due to the short-term nature of accounts receivable, accounts payable, and the bank indebtedness, their carrying values are deemed to approximate their fair values.
• Derivative financial instruments are financial contracts that derive their value from changes in an underlying variable. the Authority entered into an interest rate swap agreement during 2009 in order to manage cash flow interest rate risk. the Authority’s interest rate swaps are designated as held for trading and are thus recognized at fair value on the date a contract is entered into with any subsequent unrealized gains and losses reported in net income during the period in which the fair value movement occurred. the Authority does not enter into derivative financial instruments for trading or speculative purposes and does not apply hedge accounting to its derivatives. the fair value of derivative financial instruments is estimated using standard valuation techniques and is provided to the Authority by the financial institution that is the counterparty to the transactions.
(j) use of estimates
the preparation of the financial statements in accordance with Canadian generally accepted accounting principles requires management to make certain estimates and assumptions that affect the reported amounts of assets and liabilities at the date of the financial statements and reported amounts of revenues and expenses during the reporting year. this mainly affects the determination of useful lives for property and equipment, fair value for initial recognition of bank indebtedness, and employee severance benefits. Actual results could differ materially from these estimates.

26 P A C I F I C P I L O t A g E A u t H O R I t Y 2 0 1 0 A n n u A L R E P O R t
f i n A n C i A l s tAt e m e n t s
4. financial instruments
the Authority invests its excess funds in short-term investments with a Canadian chartered bank and in long-term fixed-income investments that are guaranteed.
Risk management
the Authority, through its financial assets and financial liabilities, is exposed to the following risks from its use of financial instruments: credit risk, liquidity risk, and interest rate risk. the Authority manages these risk exposures on an ongoing basis. the Authority is not presently exposed to currency risk as the Authority has no transactions denominated in foreign currencies.
Credit risk
Credit risk on financial instruments arises from the possibility that the issuer of a financial instrument fails to meet its obligation. to manage this risk, the Minister of Finance authorizes the Authority to only invest in bonds or other obligations of or guaranteed by Her Majesty in right of Canada or any province, or any municipality in Canada.
the carrying amount of cash and cash equivalents, accounts receivable and long-term investments represents the maximum credit exposure.
the Authority’s accounts receivable had a carrying value of $5,385,000 as at December 31, 2010 (2009 - $4,638,000). there is no concentration of accounts receivable with any one customer. As at December 31, 2010, approximately 0.1% (2009 - 0.1%) of accounts receivable were over 90 days past due, whereas 99.9% (2009 - 99.9%) were current, or less than 30 days past due. Historically, the Authority has not incurred any significant losses with respect to bad debts. the Authority’s allowance for doubtful accounts was nil at December 31, 2010 (2009 - nil).
the credit risk related to cash and cash equivalents is minimized as these assets are held with a Canadian chartered bank.
the credit risk related to long-term investments is minimized as the Authority only invests in government of Canada guaranteed bonds.
Liquidity risk
Liquidity risk is the risk that the Authority will not be able to meet its financial obligations as they become due. the Authority’s objective is to have sufficient liquidity to meet these liabilities when due. the Authority monitors its cash balances and cash flows generated from operations on a frequent basis to meet its requirements.
the carrying amount of accounts payable and accrued liabilities and bank indebtedness represents the maximum exposure to liquidity risk.
the Authority’s accounts payable had a carrying value of $3,809,000 as at December 31, 2010 (2009 - $3,026,000) and are all due within 60 days. the Authority’s accrued liabilities had a carrying value of $2,111,000 as at December 31, 2010 (2009 - $1,879,000).
the Authority has credit facilities with a Canadian chartered bank. At December 31, 2010, these financial liabilities totalled $3,632,000 (2009 - $4,276,000) and are due June 30, 2011. the facility is reviewed on an annual basis and the Authority expects it to be renewed and the obligation rolled over.
Interest rate risk
Interest rate risk arises because of the fluctuation in interest rates. the Authority is subject to interest rate risk on its cash and cash equivalents, the investments portfolio, and bank indebtedness. Interest rate risk is minimized by managing the duration of the fixed-term investments portfolio and rebalancing on a monthly basis to the Standard & Poor’s Canadian Short-term Composite Index. the interest rates on the long-term investments are fixed. the long-term investments will mature over the next five years.
the Authority has debt for which variable interest rates apply. the Authority has entered into an interest rate swap agreement to mitigate its cash flow exposure to changes in interest rates on its variable rate debt. the Authority is exposed to fair value risk due to changes in interest rates on its variable rate debt which has been converted from variable to fixed through the use of interest rate swap agreements.
As at December 31, 2010, the Authority had an interest rate swap agreement in place with a principal amount of $3,632,000 (2009 - $4,276,000). the agreement effectively changes the Authority’s interest rate exposure on the principal amount from a floating rate to a fixed rate of 1.98% plus a stamping fee of 0.8%.
the fair value of the interest rate swap agreement at December 31, 2010 has resulted in the recognition of a derivative financial asset in the amount of $13,000 (2009 - $61,000). the interest rate swap agreement covers the notional debt amount until 2016 at the fixed interest rate noted above. Fair values for the interest rate swap agreement are provided by the financial institution with whom the swap is held.
As at December 31, 2010, a shift in interest rates of 100 basis points, assuming that all other variables had remained the same, would have resulted in a $280 increase or decrease in the Authority’s net income for the year ended December 31, 2010.

P A C I F I C P I L O t A g E A u t H O R I t Y 2 0 1 0 A n n u A L R E P O R t 27
f i n A n C i A l s tAt e m e n t s
Fair values
the following table illustrates the fair value hierarchy of the Authority’s financial instruments as at December 31:
5. long-term investments and investment revenue
the Board of Directors of the Authority has established a policy for the management of the investments.
(a) Portfolio Investments
(b) Investment Revenue
2010 2009____________________________________________________________________________________________________________________________________ Quoted prices Other Quoted prices Other in active observable unobservable total in active observable unobservable total markets inputs inputs (in markets inputs inputs (in (Level 1) (Level 2) (Level 3) thousands) (Level 1) (Level 2) (Level 3) thousands)____________________________________________________________________________________________________________________________________financial assetsCash equivalents $ 6,805 $ - - $ 6,805 $ 5,387 $ - - $ 5,387Derivative financial asset - 13 - 13 - 61 - 61Long-term investments 3,059 - - 3,059 $ 2,418 - - $ 2,418____________________________________________________________________________________________________________________________________ $ 9,864 $ 13 - 9,877 $ 7,805 61 - $ 7,866____________________________________________________________________________________________________________________________________
2010 2009 (in thousands) (in thousands)
Interest $ 151 $ 95gains and lossesRealized (losses) gains in the year (12) 27unrealized losses in the year (47) (81)_______________________________________________________________________________________ (59) (54)
Investment management fees (12) (8)_______________________________________________________________________________________ $ 80 $ 33_______________________________________________________________________________________
2010 2009______________________________________________________________________________________________________________________________ Fair Face Fair Face Value Value Value Value______________________________________________________________________________________________________________________________ (in thousands) (in thousands)
government of Canada Bonds $ 1,238 $ 1,252 $ 872 $ 870 Canada Housing trust Bonds 1,821 1,824 1,546 1,543______________________________________________________________________________________________________________________________ $ 3,059 $ 3,076 $ 2,418 $ 2,413 ______________________________________________________________________________________________________________________________

28 P A C I F I C P I L O t A g E A u t H O R I t Y 2 0 1 0 A n n u A L R E P O R t
f i n A n C i A l s tAt e m e n t s
(c) Investment performance
the annualized rate of return during the year on these investments was 2.42 % (2009 – 1.16%).
6. property and equipment
7. intangible asset
8. bank indebtedness
non-revolving term credit facility of up to $4.8 million. the interest rate is equivalent to Bankers’ Acceptances plus 0.8%. the loan is payable over seven years on a monthly basis. the facility is reviewed on an annual basis at June 30th and either the bank or the Authority has the option to renew or cancel the facility. therefore, the loan is classified as current. During 2009, the Authority entered into a seven year interest rate swap with a Canadian chartered bank to convert the interest rate on the Bankers’ Acceptances amounts from a variable interest rate based on the Bankers’ Acceptances rates to a fixed rate of 1.98% per annum. Additional to the interest rate of 1.98%, the Authority pays a stamping fee of 0.8% until June 30, 2011. the stamping fee will be adjusted on an annual basis.
total bank indebtedness
the Authority has another operating credit facility of up to $2.0 million available at an interest rate equivalent to the bank’s prime lending rate. the Authority has not drawn on this facility at year-end (2009 - nil). the credit facility is available to the Authority as required and has no renewal date or fixed term.
2010 2009________________________________________________________________________________________________________________________________ Accumulated Accumulated Cost Amortization net Cost Amortization net________________________________________________________________________________________________________________________________ (in thousands) (in thousands)
Buildings and floats $ 320 $ 256 $ 64 $ 275 $ 241 $ 34 Pilot boats 11,037 1,736 9,301 11,490 2,104 9,386 Engines 1,413 726 687 1,237 597 640 generators 232 66 166 232 45 187 Spare Engines1 - - - 176 – 176Equipment - communication and other 332 282 50 329 273 56 - computers 1,408 394 1,014 398 248 150 Leasehold improvements 97 97 - 97 97 - ________________________________________________________________________________________________________________________________ $ 14,839 $ 3,557 $ 11,282 $ 14,234 $ 3,605 $ 10,629 ________________________________________________________________________________________________________________________________1Spare engines for pilot launch refurbishment.
2010 2009________________________________________________________________________________________________________________________________ Accumulated Accumulated Cost Amortization net Cost Amortization net________________________________________________________________________________________________________________________________ (in thousands) (in thousands)
Software $ 507 $ 227 $ 280 $ 435 $ 135 $ 300 ________________________________________________________________________________________________________________________________ $ 507 $ 227 $ 280 $ 435 $ 135 $ 300________________________________________________________________________________________________________________________________
2010 2009_______________________________ (in thousands) (in thousands)
3,632 4,276_______________________________
$ 3,632 $ 4,276 _______________________________

P A C I F I C P I L O t A g E A u t H O R I t Y 2 0 1 0 A n n u A L R E P O R t 29
f i n A n C i A l s tAt e m e n t s
9. pension plan
10. employee severance benefits
the Public Service Pension Plan requires the Authority to contribute to the Plan. this pension plan provides benefits based on years of service and average earnings at retirement. the benefits are fully indexed to the Consumer Price Index. the Authority contributes $1.94 (2009 - $1.91) for every dollar contributed by the employee. If an employee’s annual salary is greater than $139,500 (2009 - $136,700), the portion of the employee’s salary above this amount is subject to an employer
contribution of $8.90 (2009 - $7.50) for every dollar contributed by the employee. Contributions during the year were as follows:
the post-employment severance benefit is provided to all current employees under various collective agreements and employment contracts. the cost of the benefit is fully paid by the Authority. this plan is unfunded and requires no contributions from employees.
the value of the employee severance benefits liability is actuarially determined. A valuation is prepared every 3 years and the estimate for December 31, 2010 was projected from the valuation carried out at December 29, 2009.
the Authority measures its accrued benefit obligations of its post-employment severance benefit for accounting purposes as at December 31st of each year.
Information about the plan, measured as at the balance sheet date, is as follows:
2010 2009________________________________________________________
(in thousands) (in thousands)
Authority $ 761 $ 653Employees 345 317
Accrued benefit obligation, plan assets, and funded status
2010 2009________________________________________________________________________________ (in thousands) (in thousands)
Accrued benefit obligation, beginning of the year $ 736 $ 1,313Current service costs 41 37Interest cost 46 50Benefits paid during the year (126) (57)Actuarial loss (gain) 130 (607)_________________________________________________________________________________________Accrued benefit obligation, end of the year $ 827 $ 736_________________________________________________________________________________________
Accrued Benefit Obligation and Fair Value of Plan Assets
2010 2009________________________________________________________________________________
(in thousands) (in thousands)
Accrued benefit obligation $ 827 $ 736Fair value of plan assets - -_________________________________________________________________________________________Funded status - deficit, end of the year $ (827) $ (736)________________________________________________________________________________
Change in fair value of plan assets 2010 2009________________________________________________________________________________ (in thousands) (in thousands)
Fair value of plan assets, beginning of the year $ - $ -Employer contributions 126 57Benefits paid (126) (57)_________________________________________________________________________________________Fair value of plan assets, end of the year $ - $ -________________________________________________________________________________

30 P A C I F I C P I L O t A g E A u t H O R I t Y 2 0 1 0 A n n u A L R E P O R t
f i n A n C i A l s tAt e m e n t s
Reconciliation of funded status to accrued benefit liability
2010 2009_________________________________________________________________________________________ (in thousands) (in thousands)
Funded status, end of the year $ (827) $ (736)unamortized net actuarial gain (372) (550)_________________________________________________________________________________________Accrued benefit liability $ (1,199) $ (1,286)_________________________________________________________________________________________Current portion (included in Accounts payable and accrued liabilities) $ 207 $ 160
non-current portion 992 1,126_________________________________________________________________________________________ $ 1,199 $ 1,286_________________________________________________________________________________________
net benefit cost recognized in the year 2010 2009_________________________________________________________________________________________ (in thousands) (in thousands)
Current service cost $ 41 $ 37Interest cost 46 50Actuarial loss (gain) 130 (607)_________________________________________________________________________________________Costs arising in the year $ 217 $ (520)
Differences between costs arising in the year and costs recognized in the year in respect of:Actuarial (loss) gain (178) 550 _________________________________________________________________________________________Benefit cost recognized $ 39 $ 30_________________________________________________________________________________________
total cash amounts
total cash amounts for employee severance benefits consists of cash contributed in the normal course of business by the Authority to its post-employment severance benefits. Benefits consist of cash contributed of $126,000 in 2010 (2009 - $57,000).
the significant assumptions used in the actuarial valuation of the accrued benefit obligation were:
Weighted - average assumptions for expense 2010 2009Discount rate 6.1% 7.4%Salary escalation rate 2.0% 3.5%
Weighted - average assumptions for disclosure 2010 2009Discount rate 5.1% 6.1%Salary escalation rate 2.0% 2.0%Expected average remaining service life of active employees 10 years 10 years

f i n A n C i A l s tAt e m e n t s
11. pilotage charges
12. Capital management
13. related party transactions
14. Commitments
In addition to standard pilotage charges, the Authority charges users a fee of $205 (2009 - $180) every time an Authority-owned pilot launch is used to transport a pilot. this fee is intended to fund the launch replacement and portable pilotage unit capital costs.
the Authority’s capital is its equity, which is comprised of contributed surplus and retained earnings. Equity is represented by net assets.
the Authority is subject to financial management and accountability provisions of the FinancialAdministrationAct which imposes restrictions in relation to borrowings and acquisition of investments. On an annual basis the Authority must receive approval of all borrowings from the Minister of Finance. the Act limits investments to bonds or other obligations of, or guaranteed by, Her Majesty in right of Canada or any province, or any municipality in Canada. During the periods ended December 31, 2010
and 2009, the Authority has complied with these restrictions.
the Authority manages its equity as a by-product of managing its revenues, expenses, assets, liabilities, and general financial dealings to ensure that its objectives are achieved efficiently. the tariffs of pilotage charges must be fair and reasonable and must enable the Authority to operate on a self-sustaining financial basis, as required by the PilotageAct.
there were no changes in the Authority’s approach to capital management during the year.
the Authority is related in terms of common ownership to all government of Canada created departments, agencies and Crown corporations. the Authority enters into transactions with these entities in the normal course of business, under the same terms and conditions that
apply to unrelated parties. the transactions are recorded at the exchange amount, which approximates fair value. these transactions are not of significance and do not have a material effect on these financial statements.
the Authority has a contract with a computer software vendor to provide software maintenance at a cost of $45,000 per annum for the years 2011 and 2012.
the Authority has a long-term operating lease obligation for office accommodation of $166,000 per annum to December 31, 2012. the obligation also calls for payment of a pro-rata share of annual operating costs, estimated at $62,000 for 2011 (2010 - $64,000).
2010 2009_____________________________________________________________
(in thousands) (in thousands)
Pilotage charges $ 57,516 $ 54,392Launch replacement feeand portable pilotage unit fees 1,601 1,343_____________________________________________________________
total pilotage charges $ 59,117 $ 55,735_____________________________________________________________
P A C I F I C P I L O t A g E A u t H O R I t Y 2 0 1 0 A n n u A L R E P O R t 31
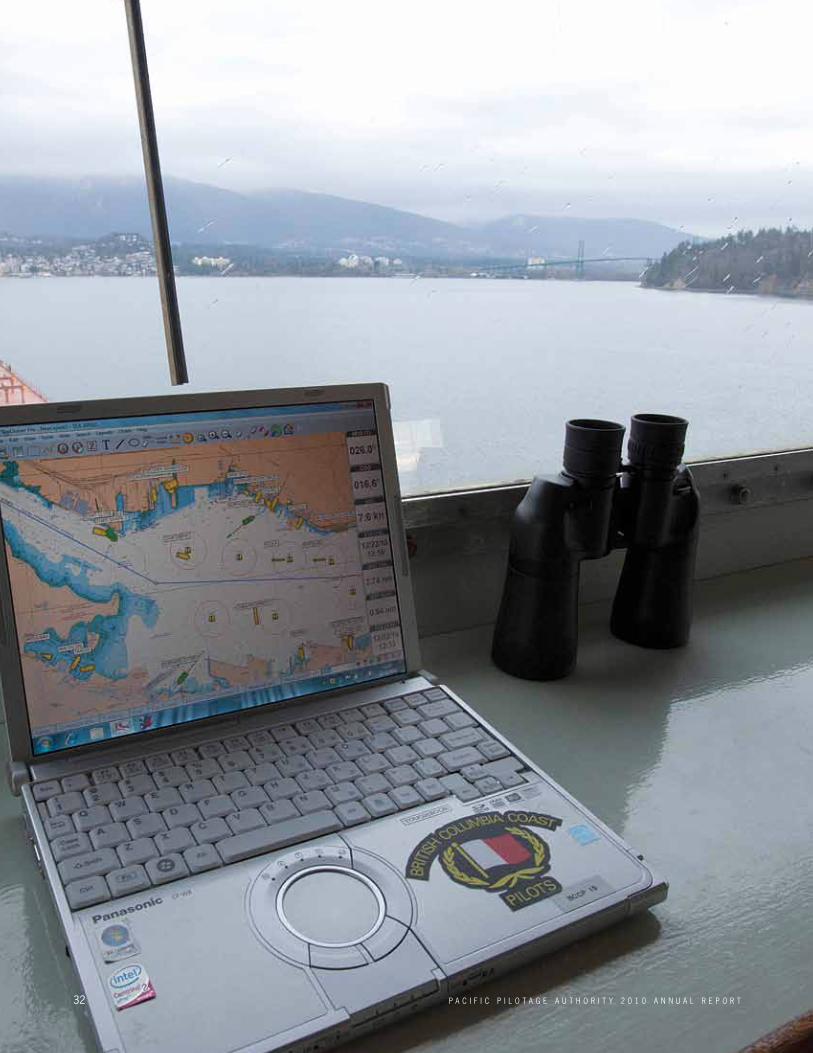
32 P A C I F I C P I L O t A g E A u t H O R I t Y 2 0 1 0 A n n u A L R E P O R t