pacific island food security: situation, challenges …...pacific island food security: situation,...
TRANSCRIPT
24
Pacific Economic BullEtin
Pacific Economic Bulletin Volume 24 number 2 July 2009 © the australian national university
Pacific island food security: situation, challenges and opportunities
Andrew McGregor, R. Michael Bourke, Marita Manley, Sakiusa Tubuna and Rajhnael Deo
Pacific island countries have generally managed to avoid acute food shortages except at times of major natural disasters. In recent years, there have been large and rapid increases in the prices of basic foods worldwide. Pacific island countries have not been isolated from the global food ‘crisis’. The prices of imported food products such as grains, meats, dairy products and vegetable oils all rose sharply. For example, in Solomon Islands, the prices of imported foods increased on average by 26 per cent in the first six months of 2008 (Communication from Central Bank of Solomon Islands). The
increase in staple food prices in Suva, Fiji (Figure 1), is typical of the increases in retail food prices experienced around the region in 2008. The price increases for domestically grown staples, however, have been much smaller than those for imported food. In the case of Papua New Guinea, consumer price index (CPI) data for the first quarter of 2008 indicated virtually no increase in the retail price of sweet potato.
These price increases have created renewed concerns regarding the food security and vulnerability of Pacific island countries. They have also provided a new
In recent years, there have been large and rapid increases in the prices of basic foods worldwide. Pacific island countries have not been isolated from the global food ‘crisis’. This article shows that there are substantial differences in the impacts within and between Pacific island countries. To be effective and not counterproductive, policy and donor responses need to be tailored accordingly. This article recommends a combination of measures directed at mitigating the threats and empowering rural people to take advantage of the opportunities.
Andrew McGregor is Managing Director of the Trade and Development Office, Suva, Fiji and is an AusAID Rural Development Advisor.
R. Michael Bourke is Adjunct Senior Fellow, Research School of Pacific and Asian Studies, The Australian National University, Canberra.
Marita Manley is an Agriculture and Forestry Policy Adviser at the Secretariat of the Pacific Community, Fiji.
Sakiusa Tubuna is Chief Economist, Ministry of National Planning, Fiji.
Rajhnael Deo is a Trade Statistician at the Secretariat of the Pacific Community, Fiji.

PAcific iSlAnD fooD SecuRiTy SiTuATion, chAllenGeS AnD oPPoRTuniTieS
25Pacific Economic Bulletin Volume 24 number 2 July 2009 © the australian national university
focus for governments and donors on the role and requirements of the agriculture and marine sectors in meeting the challenges and opportunities of food security in the region.
Food security exists when all people, at all times, have physical and economic access to sufficient, safe and nutritious food to meet their dietary needs and food prefer-ences for an active and healthy life (FAO 1996). Detailed assessment of food security in the region is, however, constrained by a lack of comprehensive data on food production, imports and exports. This article examines indicators of food availability and vulnerability to food insecurity in various Pacific island countries for which data are available, drawing on data collected as part of Household Income and Expenditure Surveys (HIES) to draw inferences at the national level. At the household level, it also
highlights the significant differences in the contribution of domestic food production to diets and incomes within Pacific island countries. Data aggregated at the national or regional level can tell only part of the story. The ability of individual households to access food of adequate nutritional value depends not only on food availability, but on adequate household incomes to access available food. Allocation of food within the household can also leave particular individuals, such as women and children, vulnerable to food insecurity.This article concentrates on the role of the agricultural sector in food security but acknowledges the importance of marine resources to food security in the region. There is a strong tradition of eating fish in Micronesia, Polynesia and the coastal areas of Melanesia. Per capita consumption of fish is remarkably high and constitutes the majority of animal protein in diets in these
Figure 1 A comparison of cassava, dalo and rice prices in Suva
0.4
0.6
0.8
1
1.2
1.4
2004 2005 2006 2007 2008
Cassava ($/kg)
Dalo (white) ($/kg)
Rice ($/kg)
Source: Data supplied to the authors by Fiji Ministry of Agriculture - Agtrade Unit and Fiji Consumer Council.
26
Pacific Economic BullEtin
Pacific Economic Bulletin Volume 24 number 2 July 2009 © the australian national university
areas (Bell, Kronen, Vunisea, Nash, Keeble, Demmke, Pontifex and Andréfouët 2008).
The diversity of Pacific island countries in assessing food security
Any assessment of food security for the Pacific island region needs to take into account the great diversity of the agricul-tural sectors in the region. Countries such as Tuvalu (population less than 10,000) and Papua New Guinea (population 6.5 million) have little in common other than proximity. These diverse Pacific island countries can be usefully summarised into three broad groups based on resource endowments, size and the importance of agriculture
group 1: relatively large countries of •Melanesia
group 2: middle-sized countries of •Polynesia
group 3: land-poor micro-states that are •predominantly atolls.
Traditional farming systems: the foundation of Pacific island food security and often the hidden strength of the economy
Traditional Pacific island subsistence crops can be of very high nutritional value. Many mature in less than a year and are grown on customary land. Virtually all inputs are supplied within the system, so there is no requirement for formal title, working capital or credit, all of which are major constraints to commercial agricultural development. Furthermore, traditional agro-forestry sys-tems based on established technologies have proven to be effective risk-management strategies.
Smallholder farming systems have •proven to be robust and productive in the face of adversity. In varying degrees, they have proven to be the hidden strength of otherwise structur-ally weak economies. The erosion of genetic diversity, in part due to com-mercial pressures, poses a threat to the nutritional value of staple crops and the susceptibility to pest and disease outbreaks. Increased urbanisation is also eroding some of the traditional support networks that help to safeguard food security. Nevertheless, some recent events provide evidence of the economic importance of traditional smallholder farming systems. These includethe rapid recovery of the Samoan •economy after successive natural (cyclones) and biological (taro leaf blight) disasters, with other traditional crops filling the voidthe remarkable turn around of the Fijian •economy after the devastating once in a 100 year drought of 1997–98the tempering of the humanitarian dis-•aster associated with the ethnic conflict in Solomon Islands and the civil war in Bougainvillethe production response of PNG root-•crop growers to the sharp increase in imported grain prices after depreciation of the kina in 1994.
Country-level indicators
Food self-sufficiency assessment
The importance of domestic food produc-tion varies significantly across the region. Throughout Melanesia, the main sources of food energy and protein include locally grown staple crops, other garden foods, fish, imported rice, imported wheat-

PAcific iSlAnD fooD SecuRiTy SiTuATion, chAllenGeS AnD oPPoRTuniTieS
27Pacific Economic Bulletin Volume 24 number 2 July 2009 © the australian national university
based foods and meat. These sources for Papua New Guinea in 2006 can be broken down (Figure 2). For most Melanesians, subsistence food production is by far the most important source of food. A small but growing proportion of locally grown food is marketed.
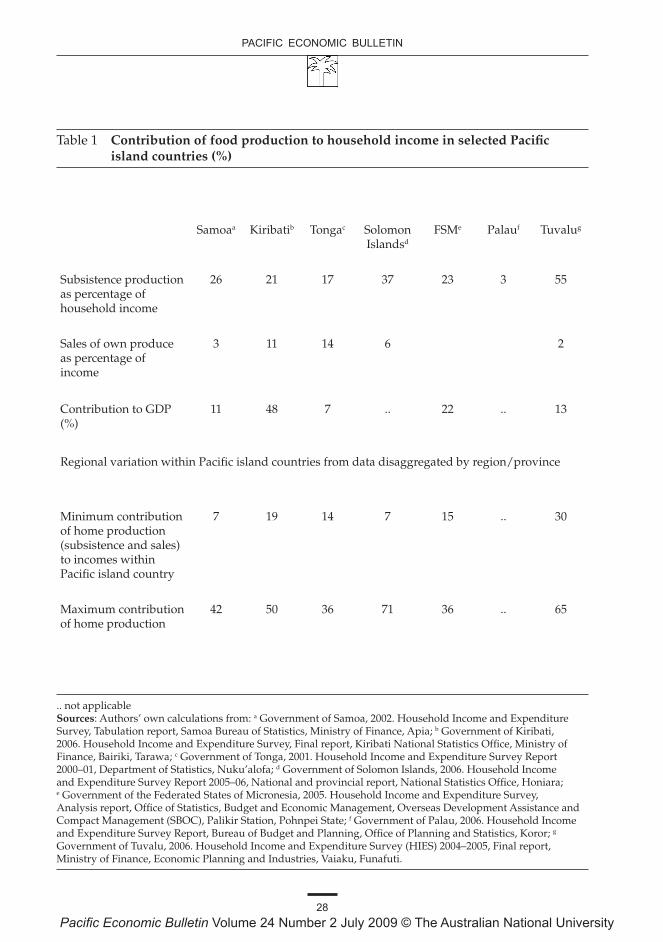
Throughout the region, it is generally the case that the value of production for home consumption significantly exceeds the value of production for sale, as illustrated by the data from recent HIES (Table 1). For example, the value of production for home consumption represents about 55 per cent of household income in Tuvalu, whereas sale of own produce represents only 3 per cent of household income. Solomon Islands and Samoa also have significantly higher contributions to income from subsistence production (37 per cent and 26 per cent, respectively) than from sales (6 per cent and 3 per cent, respectively). Kiribati and
Tonga show more equal contributions, with subsistence representing 21 per cent and 17 per cent of household income, respectively, and sales representing 11 per cent and 14 per cent, respectively.
Data from HIES (Table 1) also reveal significant differences within Pacific island countries. As expected, subsistence activi-ties and sales of home produce contribute most significantly to the incomes of rural dwellers. For example, subsistence and sales of food contribute only 7 per cent to household income in Honiara, whereas they contribute 71 per cent of income in Isabel Province. Similar differences, although less marked, are observed in Samoa, Kiribati, Tonga, the Federated States of Micronesia and Tuvalu.
Import dependency at the national level
Food security and food self-sufficiency are not necessarily the same thing. A country
Figure 2 Sources of food energy and food protein in Papua New Guinea, 2006
Food protein
Staple foods(42%)
Fish (12%)
Meat (13%)
Other garden foods (15%)
Rice (imported)(9%)
Wheat products(8%)
Sugar and minor foods (1%)
Food energy
Staple foods(68%)
Rice (imported)(9%)
Other garden foods (8%)
Wheat products(5%)
Sugar and minor foods (4%)
Fish (1%)Meat (5%)
Source: Bourke, R.M. and Harwood, T. (eds), 2009. Food and Agriculture in Papua New Guinea, The Australian National University, Canberra.
28
Pacific Economic BullEtin
Pacific Economic Bulletin Volume 24 number 2 July 2009 © the australian national university
Table 1 Contribution of food production to household income in selected Pacific island countries (%)
Samoaa Kiribatib Tongac Solomon Islandsd
FSMe Palauf Tuvalug
Subsistence production as percentage of household income
26 21 17 37 23 3 55
Sales of own produce as percentage of income
3 11 14 6 2
Contribution to GDP (%)
11 48 7 .. 22 .. 13
Regional variation within Pacific island countries from data disaggregated by region/province
Minimum contribution of home production (subsistence and sales) to incomes within Pacific island country
7 19 14 7 15 .. 30
Maximum contribution of home production
42 50 36 71 36 .. 65
.. not applicable Sources: Authors’ own calculations from: a Government of Samoa, 2002. Household Income and Expenditure Survey, Tabulation report, Samoa Bureau of Statistics, Ministry of Finance, Apia; b Government of Kiribati, 2006. Household Income and Expenditure Survey, Final report, Kiribati National Statistics Office, Ministry of Finance, Bairiki, Tarawa; c Government of Tonga, 2001. Household Income and Expenditure Survey Report 2000–01, Department of Statistics, Nuku’alofa; d Government of Solomon Islands, 2006. Household Income and Expenditure Survey Report 2005–06, National and provincial report, National Statistics Office, Honiara; e Government of the Federated States of Micronesia, 2005. Household Income and Expenditure Survey, Analysis report, Office of Statistics, Budget and Economic Management, Overseas Development Assistance and Compact Management (SBOC), Palikir Station, Pohnpei State; f Government of Palau, 2006. Household Income and Expenditure Survey Report, Bureau of Budget and Planning, Office of Planning and Statistics, Koror; g Government of Tuvalu, 2006. Household Income and Expenditure Survey (HIES) 2004–2005, Final report, Ministry of Finance, Economic Planning and Industries, Vaiaku, Funafuti.

PAcific iSlAnD fooD SecuRiTy SiTuATion, chAllenGeS AnD oPPoRTuniTieS
29Pacific Economic Bulletin Volume 24 number 2 July 2009 © the australian national university
could be a substantial importer of food and at a national level enjoy a high level of food security, provided households have sufficient income to purchase these imports. For small, vulnerable and some-times unstable Pacific island economies, however, the degree of food self-sufficiency is an important indicator of food security. To assess this indicator of food security, it is important to analyse the various compo-nents of nutrition that come from local and imported sources.
At a national level, the countries of western Melanesia have the lowest depend-ency on imported foods—although this is often not reflected in the urban centres. For example, for Papua New Guinea in 2006, Bourke and Harwood (2009) found that 83 per cent of the food energy consumed was from locally grown foods, with the remaining 17 per cent from imported foods—mainly rice and wheat-based foods,
with some meat, fish, animal fat, oils and other minor foods. Locally grown foods provided a lower proportion (76 per cent) of food protein (Figure 3).
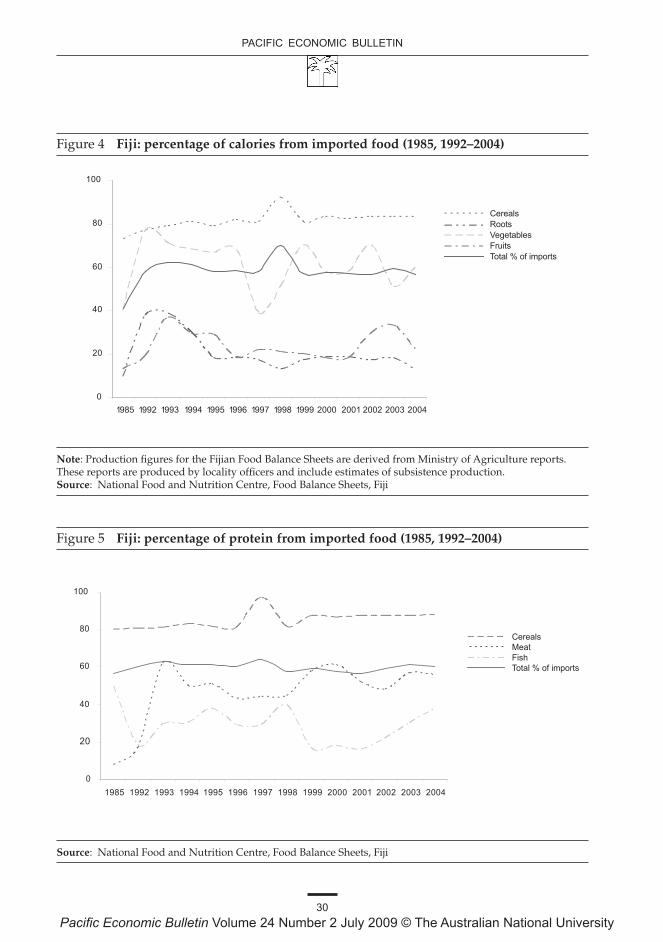
For Solomon Islands in 2004, it was calculated that imported grains contributed 21 per cent of the food energy consumed at the national level (Bourke, McGregor, Allen, Evans, Mullen, Pollard, Wairiu and Zotalis 2006:Table 8.3). For Vanuatu, a very detailed study of food production on Malo Island in 1997 found that 21 per cent of villagers’ food energy needs came from imported food and most of the rest from locally grown food (Allen 2001). Malo can be considered a ‘typical island’ in Vanuatu, being neither particularly remote nor influenced by urbanisation. Among the Melanesian countries, Fiji imports a much higher percentage of calorie (58 per cent) and protein (60 per cent) needs (Figures 4 and 5). Atoll countries and smaller islands
Figure 3 Proportion of energy and protein derived from locally produced and imported foods in Papua New Guinea, 2006
Imported(17%)
Local(83%)
Food energy
Imported(24%)
Local(76%)
Food protein
Source: Bourke, R.M. and Harwood, T. (eds), 2009. Food and Agriculture in Papua New Guinea, The Australian National University, Canberra.National University, Canberra.
30
Pacific Economic BullEtin
Pacific Economic Bulletin Volume 24 number 2 July 2009 © the australian national university
Figure 4 Fiji: percentage of calories from imported food (1985, 1992–2004)
1985 1992 1993 1994 1995 1996 1997 1998 1999 2000 2001 2002 2003 20040
20
40
60
80
100
CerealsRootsVegetablesFruitsTotal % of imports
Note: Production figures for the Fijian Food Balance Sheets are derived from Ministry of Agriculture reports. These reports are produced by locality officers and include estimates of subsistence production. Source: National Food and Nutrition Centre, Food Balance Sheets, Fiji
Figure 5 Fiji: percentage of protein from imported food (1985, 1992–2004)
0
20
40
60
80
100
1985 1992 1993 1994 1995 1996 1997 1998 1999 2000 2001 2002 2003 2004
CerealsMeatFishTotal % of imports
Source: National Food and Nutrition Centre, Food Balance Sheets, Fiji

PAcific iSlAnD fooD SecuRiTy SiTuATion, chAllenGeS AnD oPPoRTuniTieS
31Pacific Economic Bulletin Volume 24 number 2 July 2009 © the australian national university
tend to rely even more on imports. A recent study in Pohnpei estimated that imports contributed 73 per cent of energy and 64 per cent of protein intake (Englberger, Lorens, Levendusky, Pedrus, Albert, Hagilmai, Paul, Nelber, Moses, Shaeffer and Gallen 2008).
Comparable nutrition-based data are not available for other Pacific island countries. It is, however, possible to estimate the level of dependency on imports using data on household consumption and sales (Table 2), recognising that the proportion of expenditure on imports cannot proxy for nutritional information.
For these six countries, import depend-ency ranges from 36 per cent in Kiribati to more than 80 per cent in Palau. These figures represent import dependency at the national level; but significant differences exist within countries, especially between urban centres and rural areas. For example, food import dependency in South Tarawa is estimated at about 61 per cent, whereas at the national level it is about 36 per cent (Government of Kiribati 2006). Similarly, for the Federated
States of Micronesia, food import depend-ency is more than 50 per cent in Pohnpei and Kosrae compared with less than 20 per cent in Yap (Government of the Federated States of Micronesia 2005).
Vulnerability indicators: the capacity of a country to import the food it does not produce itself
Food import dependency is not necessar-ily correlated with food insecurity. A key factor in the determination of food security is the ability of countries and individual households to pay for the food they import. Factors that influence this are export earn-ings (including tourism earnings), levels of debt service payments and remittances.
The UN Food and Agriculture Organiza-tion (FAO) has developed the Food Import Capability Index (FICI) as an indicator of such vulnerability. The FICI measures the proportion of food imports to total exports. Any country with a FICI of more than 0.5 is considered vulnerable in terms of food security, while a country with a FICI above
Table 2 Dependency on imported foods in selected Pacific island countries (per cent)
Samoaa Kiribatib Tongac Solomon Islandsd
FSMe Palauf
Food imports as percentage of total food expenditure
56 36 45 35–44 39 81–84
Sources: Authors’ own calculations from: a Government of Samoa, 2002. Household Income and Expenditure Survey, Tabulation report, Samoa Bureau of Statistics, Ministry of Finance, Apia; b Government of Kiribati, 2006. Household Income and Expenditure Survey, Final report, Kiribati National Statistics Office, Ministry of Finance, Bairiki, Tarawa; c Government of Tonga, 2001. Household Income and Expenditure Survey Report 2000–01, Department of Statistics, Nuku’alofa; d Government of Solomon Islands, 2006. Household Income and Expenditure Survey Report 2005–06, National and provincial report, National Statistics Office, Honiara; e Government of the Federated States of Micronesia, 2005. Household Income and Expenditure Survey, Analysis report, Office of Statistics, Budget and Economic Management, Overseas Development Assistance and Compact Management (SBOC), Palikir Station, Pohnpei State; f Government of Palau, 2006. Household Income and Expenditure Survey Report, Bureau of Budget and Planning, Office of Planning and Statistics, Koror.
32
Pacific Economic BullEtin
Pacific Economic Bulletin Volume 24 number 2 July 2009 © the australian national university
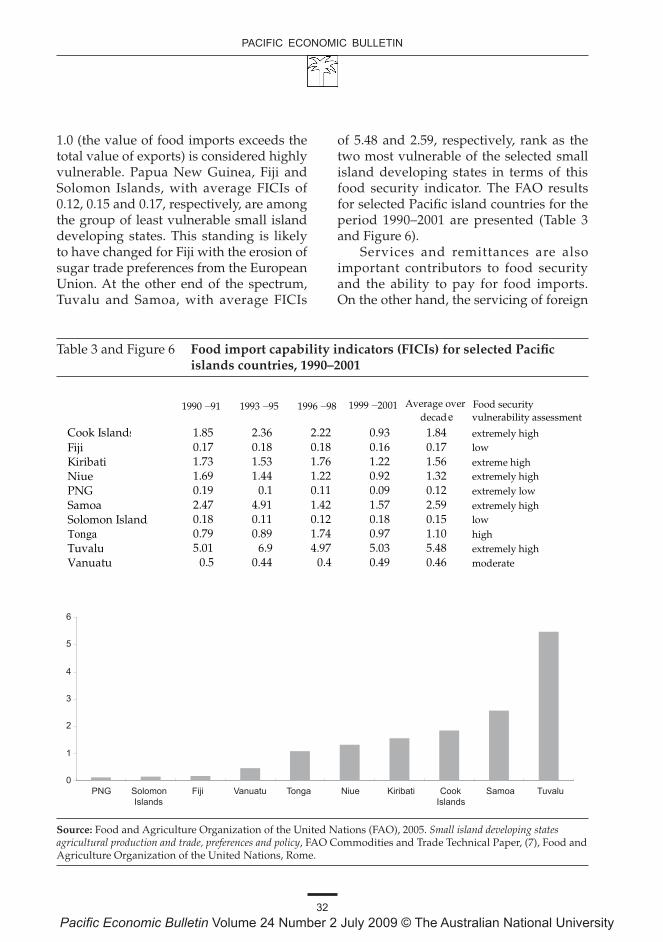
1.0 (the value of food imports exceeds the total value of exports) is considered highly vulnerable. Papua New Guinea, Fiji and Solomon Islands, with average FICIs of 0.12, 0.15 and 0.17, respectively, are among the group of least vulnerable small island developing states. This standing is likely to have changed for Fiji with the erosion of sugar trade preferences from the European Union. At the other end of the spectrum, Tuvalu and Samoa, with average FICIs
of 5.48 and 2.59, respectively, rank as the two most vulnerable of the selected small island developing states in terms of this food security indicator. The FAO results for selected Pacific island countries for the period 1990–2001 are presented (Table 3 and Figure 6).
Services and remittances are also important contributors to food security and the ability to pay for food imports. On the other hand, the servicing of foreign
Table 3 and Figure 6 Food import capability indicators (FICIs) for selected Pacific islands countries, 1990–2001
1990 –91 1993 –95 1996 –98 1999 –2001 Average over
Food security decade e vulnerability assessment
Cook Islands 1.85 2.36 2.22 0.93 1.84 extremely high Fiji 0.17 0.18 0.18 0.16 0.17 low
Kiribati 1.73 1.53 1.76 1.22 1.56 extreme high Niue 1.69 1.44 1.22 0.92 1.32 extremely high
PNG 0.19 0.1 0.11 0.09 0.12 extremely low Samoa 2.47 4.91 1.42 1.57 2.59 extremely high Solomon Islands 0.18 0.11 0.12 0.18 0.15 low
Tonga 0.79 0.89 1.74 0.97 1.10 high Tuvalu 5.01 6.9 4.97 5.03 5.48 extremely high Vanuatu 0.5 0.44 0.4 0.49 0.46 moderate
0
1
2
3
4
5
6
PNG Solomon Fiji Vanuatu Tonga Niue Kiribati Cook Samoa Tuvalu Islands Islands
Source: Food and Agriculture Organization of the United Nations (FAO), 2005. Small island developing states agricultural production and trade, preferences and policy, FAO Commodities and Trade Technical Paper, (7), Food and Agriculture Organization of the United Nations, Rome.

PAcific iSlAnD fooD SecuRiTy SiTuATion, chAllenGeS AnD oPPoRTuniTieS
33Pacific Economic Bulletin Volume 24 number 2 July 2009 © the australian national university
debt reduces a country’s ability to purchase food. These factors are included to create the FICI ‘plus’ indicator for the same period as the FAO data. When these factors are taken into account, a different pattern emerges (Table 4). For example, Samoa moves from a rating of ‘extremely high food security vulnerability’ (FICI = 2.59) to ‘moderate food security vulnerability’ (FICI plus = 0.46). This change demonstrates the critical role of remittances in Samoa’s food security. In the case of Tonga, remittances constitute a greater proportion of gross national income and so are even more important. The contribution of earnings from services, such as tourism and remittances, illustrates the vulnerability of Pacific island countries’ food security to external economic shocks such as the current global financial crisis, which is likely to reduce these earnings.The trends in the FICI ‘plus’ indicator for selected Pacific island countries are visible (Figure 7). Some highlights that emerge are
the low and declining overall food secu-•rity vulnerability of Papua New Guineathe marked improvement in Solomon •Islands’ food security vulnerability since 2001–03
the deterioration in Fiji’s FICI ‘plus’ •indicator from a highly favourable situ-ation several years ago—this is due to a combination of declining sugar export earnings and increasing external debt servicingTonga and Samoa have the least favour-•able FICI ‘plus’ indicators.Data on services, remittances and debt
servicing were unavailable for Tuvalu and Kiribati but these Pacific island countries were likely to be significantly more vulnerable than others given their low export earnings. Tuvaluan and Kiribati households are to some extent reliant on income from seafarers to finance their food imports. The wages paid by government, used by households to buy food, are financed by income earned from trust funds, fishing licences and, in the case of Tuvalu, the sale of an Internet domain name (dot.tv). This reliance on external income makes these atoll countries especially vulnerable to a global recession and a downturn in equity markets.
Table 4 Food import capability indicators for selected Pacific island countries, 1990–2001
FICI FICI plusFood imports as a Food imports as a % of export% of exports plus sevices plus debt payments
Fiji 0.17 0.15PNG 0.12 0.14Solomon Islands 0.15 0.12Samoa 2.59 0.46Vanuatu 0.46 0.18
Source: Food and Agriculture Organization of the United Nations (FAO), 2005. Small island developing states agricultural production and trade, preferences and policy, FAO Commodities and Trade Technical Paper, (7), Food and Agriculture Organization of the United Nations, Rome.

34
Pacific Economic BullEtin
Pacific Economic Bulletin Volume 24 number 2 July 2009 © the australian national university
Household-level indicators
Who benefits and who loses from increases in global food prices?
Households in any particular Pacific island country fit into one of three categories in terms of the impact of the global food ‘crisis’
category 1: those that are made substan-•tially worse offcategory 2: those that are made substan-•tially better offcategory 3: those that are essentially unaf-•fected.Category one households fit into two
broad groupspoor urban households that buy most of •their foodrural households whose increased expend-•iture on food is significantly more than any increase in income from selling produce.
Category two households are those whose increased expenditure on food is significantly less than their increase in income from selling produce that has also increased in price.
Category three households fit into two broad groups and fall at the two ends of the poverty spectrum
the poorest rural households, which live •largely outside the cash economyaffluent households for which expendi-•ture on food represents a relatively small portion of their budget.Many households in western Melanesia
fall into category two: they are made substantially better off by global food price increases when this is part of a more general commodities price boom. Rural households producing export tree-crop commodities have enjoyed strong income growth in recent years. Farm-gate prices received by PNG farmers in 2008 for tree-crop export
Figure 7 FICI ‘plus’ indicators for selected Pacific island countries, 1986–2007
0
0.1
0.2
0.3
0.4
0.5
0.6
1986-88 1989-91 1992-94 1995-97 1998-00 1998-03 2004-06 2007
PNGFijiSolomon IslandsVanuatuSamoaTonga
Source: Authors’ calculations.

PAcific iSlAnD fooD SecuRiTy SiTuATion, chAllenGeS AnD oPPoRTuniTieS
35Pacific Economic Bulletin Volume 24 number 2 July 2009 © the australian national university
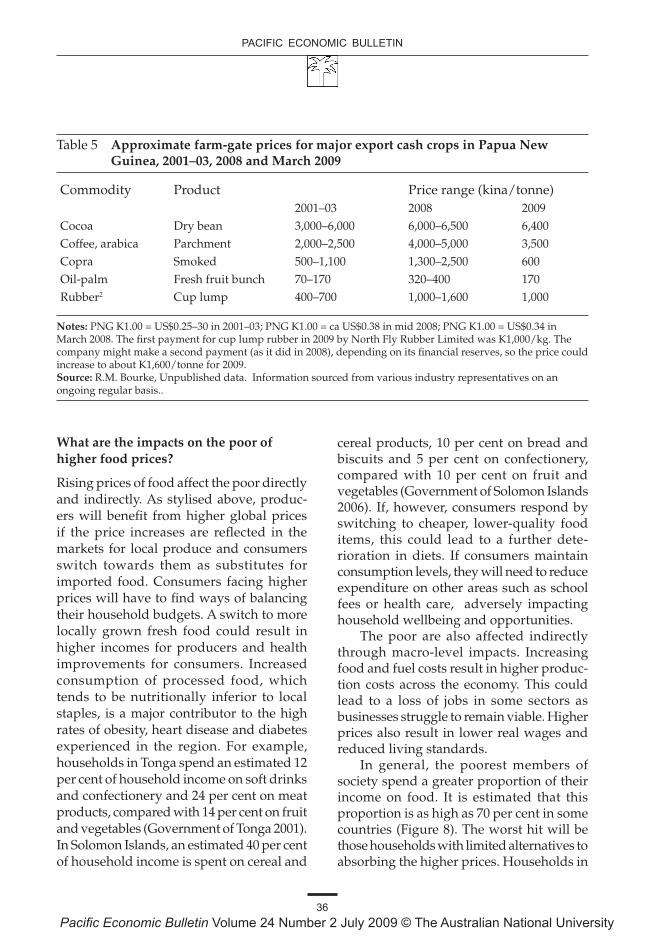
commodities increased significantly rela-tive to average prices received in 2001–03. In kina terms, these price increases have ranged from about 40 per cent for cocoa to some 230 per cent for copra (Table 5). Large numbers of rural households have benefited from these commodity price increases. An estimated 670,000 rural households (3.4 million people and more than 50 per cent of the population) are involved in export tree-crop industries in Papua New Guinea. There has been a further distribution of this cash income through an extensive network of fresh produce and betel-nut growers and traders. A similar situation is found in Solomon Islands and Vanuatu.
The region’s producers of vegetable oils (copra and palm-oil) were the major beneficiaries of this commodity price boom, and households engaged in these activities received significantly higher income. A key factor driving the increases in vegetable oil prices has been the diversion of supply for use in biodiesel as well as increased demand from China and other countries for use in foods and food preparation. In recent years, prices of vegetable and crude oils have become increasingly correlated (von Braun 2007), making their prices and consequently the incomes of those who depend on them increasingly volatile. Copra and palm-oil producers have suffered much sharper drops in prices received than the producers of other commodities since the beginning of 2009 (Table 5).
Significant numbers of western Melanesian households are also found in categories one and three. The urban poor households fall into category one. In Papua New Guinea, for example, an estimated 1.3 million people (in mid 2008) were living in urban centres or in non-village rural locations. There are a further one million rural people in Papua New Guinea who fit into category three. These are subsistence farmers, who essentially live outside
the cash economy and are particularly disadvantaged and poor. They have relied less on markets in the past, due to multiple constraints, including poor infrastructure and unreliable transport, and have had to be more self-sufficient out of necessity. Rising prices are unlikely to alter their daily struggle for survival as they have limited access to external markets, negligible cash incomes and are unable to afford imported produce. Many of the residents of the Guadalcanal Weather Coast in Solomon Islands and parts of Tanna in Vanuatu are in a similar situation.
The majority of Fiji’s population falls into category one and has been made substantially worse off by the global food price increases. These include urban and peri-urban dwellers, who make up almost half the population, and the sugarcane farmers and labourer households, who make up a further 11 per cent of the popula-tion. These cane farmers face declining incomes and grow little of their own food. There are, however, a significant number of rural household beneficiaries (category two) among copra producers and rice and root-crop farmers.
The populations of Polynesia and the atoll micro-states overwhelmingly fall into category one and have been made substantially worse off by the global food price increases. These countries have no significant exports to benefit from global commodities booms. Some farmers in the Polynesian countries benefit from increased incomes from sales in local markets provided higher global food prices are transmitted to local markets. The atoll micro-states are particularly vulnerable as they have limited scope for increasing production, are heavily dependent on imports and have insufficient export revenues to finance these imports.
36
Pacific Economic BullEtin
Pacific Economic Bulletin Volume 24 number 2 July 2009 © the australian national university
What are the impacts on the poor of higher food prices?
Rising prices of food affect the poor directly and indirectly. As stylised above, produc-ers will benefit from higher global prices if the price increases are reflected in the markets for local produce and consumers switch towards them as substitutes for imported food. Consumers facing higher prices will have to find ways of balancing their household budgets. A switch to more locally grown fresh food could result in higher incomes for producers and health improvements for consumers. Increased consumption of processed food, which tends to be nutritionally inferior to local staples, is a major contributor to the high rates of obesity, heart disease and diabetes experienced in the region. For example, households in Tonga spend an estimated 12 per cent of household income on soft drinks and confectionery and 24 per cent on meat products, compared with 14 per cent on fruit and vegetables (Government of Tonga 2001). In Solomon Islands, an estimated 40 per cent of household income is spent on cereal and
cereal products, 10 per cent on bread and biscuits and 5 per cent on confectionery, compared with 10 per cent on fruit and vegetables (Government of Solomon Islands 2006). If, however, consumers respond by switching to cheaper, lower-quality food items, this could lead to a further dete-rioration in diets. If consumers maintain consumption levels, they will need to reduce expenditure on other areas such as school fees or health care, adversely impacting household wellbeing and opportunities.
The poor are also affected indirectly through macro-level impacts. Increasing food and fuel costs result in higher produc-tion costs across the economy. This could lead to a loss of jobs in some sectors as businesses struggle to remain viable. Higher prices also result in lower real wages and reduced living standards.
In general, the poorest members of society spend a greater proportion of their income on food. It is estimated that this proportion is as high as 70 per cent in some countries (Figure 8). The worst hit will be those households with limited alternatives to absorbing the higher prices. Households in
Table 5 Approximate farm-gate prices for major export cash crops in Papua New Guinea, 2001–03, 2008 and March 2009
Commodity Product Price range (kina/tonne)2001–03 2008 2009
Cocoa Dry bean 3,000–6,000 6,000–6,500 6,400Coffee, arabica Parchment 2,000–2,500 4,000–5,000 3,500Copra Smoked 500–1,100 1,300–2,500 600Oil-palm Fresh fruit bunch 70–170 320–400 170Rubber2 Cup lump 400–700 1,000–1,600 1,000
Notes: PNG K1.00 = US$0.25–30 in 2001–03; PNG K1.00 = ca US$0.38 in mid 2008; PNG K1.00 = US$0.34 in March 2008. The first payment for cup lump rubber in 2009 by North Fly Rubber Limited was K1,000/kg. The company might make a second payment (as it did in 2008), depending on its financial reserves, so the price could increase to about K1,600/tonne for 2009. Source: R.M. Bourke, Unpublished data. Information sourced from various industry representatives on an ongoing regular basis..

PAcific iSlAnD fooD SecuRiTy SiTuATion, chAllenGeS AnD oPPoRTuniTieS
37Pacific Economic Bulletin Volume 24 number 2 July 2009 © the australian national university
atoll countries and low-income households in urban areas are particularly vulnerable, as they have limited access to land and tend to be more dependent on imported food.
The customary land-ownership struc-ture of most countries and strong family and cultural norms of giving and sharing in the Pacific provide an important safety net for the most vulnerable in many communities. These traditional safety nets are under threat from the growing importance of the cash economy, meeting cash needs such as school fees, healthcare costs and energy requirements, and the increasing rates of urbanisation.
Future food security threats and opportunities
A number of threats to future food security have been identified
rapid urban population growth in •Melanesiadeclining land productivity and land •degradation in major parts of some Pacific island countrieserosion of the genetic diversity that can •contribute to improved agricultural productivity and resilience to pests and diseasesclimate change and increasing natural •disastersbreakdown in traditional coping mecha-•nismsthe dependency of Polynesian countries •on remittances for food securitythe limited opportunities for Polynesian •countries and micro-states to expand their export earnings.Increasing global food and commodity
prices improve the terms of trade for Pacific
Figure 8 Proportion of food in total expenditure of low-income households
0 10 20 30 40 50 60 70 80 90
Rural
per c
ent o
f exp
endi
ture
National Urban Rural
Tuvalu FSM Fiji Samoa Tonga SolomonIslands
1994 2004/05 1998 2006 2002/03 2002 2001 2006
Note: Low-income households are those in the lower three income deciles. Source: Abbott, D. 2008, UNDP Pacific Centre from National Household Income and Expenditure Surveys.
38
Pacific Economic BullEtin
Pacific Economic Bulletin Volume 24 number 2 July 2009 © the australian national university
island country agriculture and marine sectors. For rural households that are in a position to take advantage of this situation, it means increased earnings either from exporting commodities or selling more food on the domestic market. Given the volatility of food and other commodity prices, Pacific island countries need to ensure that they can respond quickly to changing prices. A number of factors constrain the ability of households to take advantage of higher prices. Poor marketing infrastructure, including transport links, limits the ability of Highlanders in Papua New Guinea to supply the main urban centres even where significant demand for local foods exists. The same situation exists in the outer islands of many other countries. Under-resourced extension and research services prevent farmers receiving the technical assistance required to improve productivity. Access to inputs such as planting material, credit and land, and the increasing costs of fertiliser and fuel inputs, also limit the opportunities for increased agricultural production. These constraints have been well documented elsewhere (for example, McGregor 2005).
Appropriate policy and donor responses
This article has drawn on available data to illustrate the substantial differences in the impacts of the global food ‘crisis’ within and between Pacific island countries. Thus, to be effective and not counterproductive, policy and donor responses need to be tailored accordingly. What is required is a combina-tion of measures directed at ameliorating the threats and empowering rural people to take advantage of the opportunities.
Low-income urban households face widespread problems of access to food of adequate quality at affordable prices. Where sufficient food production exists at a
national level, inadequacies in the produce marketing system and insufficient cash income reduce the ability of households to access the food. This needs to be reflected in the food security policy and donor response. Attention needs to be paid to infrastructure that supports the ability of farmers to respond to higher prices and get food to where it is demanded.
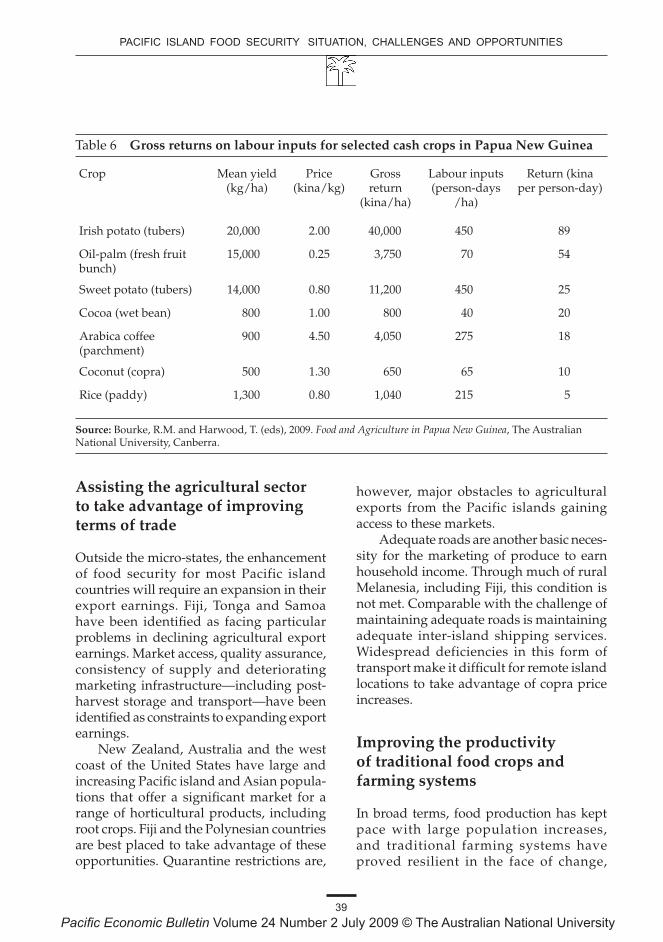
Rice policy is an important example of inappropriate policies being developed under the guise of food security. The priority given to domestic rice production in Papua New Guinea, Solomon Islands and, to some extent, Fiji is based on two premises: that a high level of grain imports is a good indicator of food insecurity and that the most appropriate way to reduce the foreign exchange drain from importing rice is to grow rice. In the context of Melanesia, these premises, and thus the policy, are flawed. Rural communities meet their calorific needs by growing staples (particularly sweet potato) and producing export commodities (copra, oil-palm, cocoa and coffee) that provide the cash to purchase food (particularly rice). With low yields and returns to labour from rice production, grower interest is usually not maintained once high levels of assistance are withdrawn. Moreover, the tariff protection given to encourage domestic rice production raises the local price of rice for everybody. With regard to the returns to labour from selected cash crops in Papua New Guinea, the returns to labour for sweet potato are some five times those for rice (Table 6).
A more appropriate policy to reduce grain imports would be to encourage increased substitution of other locally grown staples. In the past, however, limited resources have been devoted to improving the production and marketing of traditional staples.
PAcific iSlAnD fooD SecuRiTy SiTuATion, chAllenGeS AnD oPPoRTuniTieS
39Pacific Economic Bulletin Volume 24 number 2 July 2009 © the australian national university
Assisting the agricultural sector to take advantage of improving terms of trade
Outside the micro-states, the enhancement of food security for most Pacific island countries will require an expansion in their export earnings. Fiji, Tonga and Samoa have been identified as facing particular problems in declining agricultural export earnings. Market access, quality assurance, consistency of supply and deteriorating marketing infrastructure—including post-harvest storage and transport—have been identified as constraints to expanding export earnings.
New Zealand, Australia and the west coast of the United States have large and increasing Pacific island and Asian popula-tions that offer a significant market for a range of horticultural products, including root crops. Fiji and the Polynesian countries are best placed to take advantage of these opportunities. Quarantine restrictions are,
however, major obstacles to agricultural exports from the Pacific islands gaining access to these markets.
Adequate roads are another basic neces-sity for the marketing of produce to earn household income. Through much of rural Melanesia, including Fiji, this condition is not met. Comparable with the challenge of maintaining adequate roads is maintaining adequate inter-island shipping services. Widespread deficiencies in this form of transport make it difficult for remote island locations to take advantage of copra price increases.
Improving the productivity of traditional food crops and farming systems
In broad terms, food production has kept pace with large population increases, and traditional farming systems have proved resilient in the face of change,
Table 6 Gross returns on labour inputs for selected cash crops in Papua New Guinea
Crop Mean yield (kg/ha)
Price (kina/kg)
Gross return
(kina/ha)
Labour inputs (person-days
/ha)
Return (kina per person-day)
Irish potato (tubers) 20,000 2.00 40,000 450 89
Oil-palm (fresh fruit bunch)
15,000 0.25 3,750 70 54
Sweet potato (tubers) 14,000 0.80 11,200 450 25
Cocoa (wet bean) 800 1.00 800 40 20
Arabica coffee (parchment)
900 4.50 4,050 275 18
Coconut (copra) 500 1.30 650 65 10
Rice (paddy) 1,300 0.80 1,040 215 5
Source: Bourke, R.M. and Harwood, T. (eds), 2009. Food and Agriculture in Papua New Guinea, The Australian National University, Canberra.
40
Pacific Economic BullEtin
Pacific Economic Bulletin Volume 24 number 2 July 2009 © the australian national university
with households combining production of traditional crops such as taro, yam and older banana varieties with more productive ones, particularly sweet potato, cassava, Xanthosoma taro, new banana varieties, maize and African yam. Future gains in food crop production will have to come from increases in the productivity of existing food crop species, increased use of under-utilised species and better land management as population growth and climate change place even greater pressure on food production in the Pacific. Plant genetic diversity is crucial to improving productivity by providing farmers with a variety of crop production options to choose from to suit their particular circumstances. This will become increasingly important, as climate change will necessitate adaptation to new environmental conditions.
Continuing applied research and out-reach are vital if food production is to keep pace with rapid population growth and populations are to be shielded from increasing prices for staple foods and fuel. It is important, however, that research and outreach be directed at crops and issues that are both significant and amenable to change. In most cases, it is a waste of scarce resources to continue to attempt to increase production of rice. Rather, the greatest gains will come from applied research on sweet potato, banana, sago, taro and yam. For example, recent research on the impact of viruses on sweet potato production in Papua New Guinea clearly indicates that large gains can be made by making virus-free planting material available to subsistence and commercial sweet potato growers.
Serious attention, supported by appro-priate resources, also needs to be given to the opportunities and requirements of urban and peri-urban gardening and food production.
The special needs of the micro-states
For the atoll micro-states, there is little opportunity to expand export earnings. Sustaining and improving domestic food production through appropriate applied research and soil improvements are vital to avoid any worsening in the vulnerability of these countries to food insecurity. The newly established Centre for Atoll Agriculture in Kiribati aims to support atoll countries in this regard. Emphasis should be placed on appropriately designed social protection mechanisms, including making available offshore income-earning opportunities. Expansion of regional seasonal labour schemes could help to increase remittance levels, which are an important mechanism for reducing food security vulnerability.
Conclusions
This study has drawn on available trade and nutrition data and household income and expenditure surveys to assess the vulnerability of Pacific island countries to food insecurity. Some key conclusions are highlighted below. Most are not new but deserve emphasis in light of renewed concern about food security in Pacific island countries.
Traditional smallholder farming systems •have proven to be robust and productive in the face of adversity. These systems need to be supported and strengthened to enable Pacific island countries to meet the challenges of increased food prices, rural–urban migration and climate change.There are big differences in vulnerability •to food insecurity between and within Pacific island countries. Reducing vul-nerability therefore requires targeting assistance where it is most needed. Atoll
PAcific iSlAnD fooD SecuRiTy SiTuATion, chAllenGeS AnD oPPoRTuniTieS
41Pacific Economic Bulletin Volume 24 number 2 July 2009 © the australian national university
countries and poor urban households are particularly vulnerable.There is a need to look beyond import •dependency in assessing vulnerabil-ity to food insecurity. Export earnings, remittances, services and the contain-ment of external debt are vital to food security. Atoll countries are especially vulnerable, as they do not have access to sufficient export earnings or remittances to support their level of imports.Maintaining and increasing export earn-•ings are crucial to supporting income security and hence food security. Market access for Pacific island countries’ agri-cultural, forestry and marine products is therefore an important contributor to food security.Increasing investment in marketing •infrastructure is vital in making avail-able food accessible to households.At the national level, Melanesian coun-•tries are significantly less vulnerable to food insecurity due to their relatively large and resilient subsistence sectors and their ability to generate agricultural export earnings. In contrast, atoll coun-tries are particularly vulnerable due to their poor climates for agricultural production and limited exports.There are major opportunities for Pacific •island countries to enhance their food security by taking advantage of the opportunities that increasing food prices present to boost their domestic agricul-tural and marine sectors. Constraints to increased agricultural production, including transport infrastructure and lack of extension and research capabil-ity, need to be addressed to enable this to happen.Genetic diversity is crucial in ensur-•ing farmers can manage risks to food security and adapt to climate change.
There is a need to conserve and increase utilisation of this traditional diversity and facilitate access to global diversity.Improving land productivity is vital to •improving food security.Pacific island countries are vulnerable •to natural disasters that can cause tem-porary food insecurity. Climate change will put pressure on food production systems and adaptation measures must be put in place to deal with these impacts.
Note
This article is based on a paper that was presented to the third conference of Ministers of Agriculture and Forestry (MOAF) in Apia, Samoa, on 8–9 September 2008, organised by the Secretariat of the Pacific Community. The authors were commissioned to produce a paper for the conference and the paper reflected their own views and not necessarily those of the Secretariat or AusAID.
References
Abbott, D. 2008 A macroeconomic assessment of poverty and hardship in the Pacific Pacific Economic Governance Agencies Seminar Series.
Allen, M., 2001. Change and continuity: land use and agriculture on Malo Island, Vanuatu, MSc thesis, The Australian National University, Canberra.
Bell, J.D., Kronen, M., Vunisea, A., Nash, W.J., Keeble, G., Demmke, A., Pontifex, S. and Andréfouët, S., 2008. ‘Planning the use of fish for food security in the Pacific’, Marine Policy.
Bourke, R.M. and Harwood, T. (eds), 2009. Food and Agriculture in Papua New Guinea, The Australian National University, Canberra.

42
Pacific Economic BullEtin
Pacific Economic Bulletin Volume 24 number 2 July 2009 © the australian national university
Bourke, R.M., McGregor, A., Allen, M., Evans, B.R., Mullen, B.F., Pollard, A.A., Wairiu, A. and Zotalis, S., 2006. Solomon Islands Smallholder Agriculture Study, Australian Agency for International Development (AusAID), Canberra.
Englberger, L., Lorens, A., Levendusky, A., Pedrus, P., Albert, K., Hagilmai, W., Paul, Y., Nelber, D., Moses, P., Shaeffer, S. and Gallen, M., 2008. ‘Documentation of the traditional food system of Pohnpei’, in H.V. Kuhnlein, B. Erasmus and D. Spigelski (eds), Indigenous Peoples’ Food Systems: the many dimensions of culture, diversity and environment for nutrition and health, Food and Agriculture Organization of the United Nations, Rome.
Food and Agriculture Organization of the United Nations (FAO), 1996. Report of the World Food Summit, Food and Agriculture Organization of the United Nations, Rome.
——, 2005. Small island developing states agricultural production and trade, preferences and policy, FAO Commodities and Trade Technical Paper, (7), Food and Agriculture Organization of the United Nations, Rome.
Government of the Federated States of Micronesia 2005. Household Income and Expenditure Survey, Analysis report, Office of Statistics, Budget and Economic Management, Overseas Development Assistance and Compact Management (SBOC), Palikir Station, Pohnpei State.
Government of Fiji, 1997-2009, Fiji Food Balance Sheets 1985-2005, National Food and Nutrition Centre, Suva
Government of Kiribati, 2006. Household Income and Expenditure Survey, Final report, Kiribati National Statistics
Office, Ministry of Finance, Bairiki, Tarawa.
Government of Palau, 2006. Household Income and Expenditure Survey Report, Bureau of Budget and Planning, Office of Planning and Statistics, Koror.
Government of Samoa, 2002. Household Income and Expenditure Survey, Tabulation report, Samoa Bureau of Statistics, Ministry of Finance, Apia.
Government of Solomon Islands, 2006. Household Income and Expenditure Survey Report 2005–06, National and provincial report, National Statistics Office, Honiara.
Government of Tonga, 2001. Household Income and Expenditure Survey Report 2000–01, Department of Statistics, Nuku’alofa.
Government of Tuvalu, 2006. Household Income and Expenditure Survey (HIES) 2004–2005, Final report, Ministry of Finance, Economic Planning and Industries, Vaiaku, Funafuti.
McGregor, A., 2005. Pacific 2020 Background Paper: agriculture, Australian Agency for International Development (AusAID), Canberra
von Braun, J., 2007. Promises and challenges when food makes fuel, The Crawford Fund Conference on Biofuels, Energy and Agriculture—Powering Towards World Food Security, August, Canberra, Australia.
Acknowledgment
Our thanks go to team coordinators within the Land Resources Division of the Secretar-iat of the Pacific Community and Professor Ron Duncan for helpful comments on an earlier draft, as well as to an anonymous reviewer of this paper.