pacific harbor seal, - national oceanic and ... harbor seal, phoca vitulina richardii, census in...
TRANSCRIPT


PACIFIC HARBOR SEAL, Phoca vitulina richardii,
CENSUS IN CALIFORNIA DURING MAY-JULY 2002
Mark S. Lowry and James V. Carretta
National Marine Fisheries ServiceSouthwest Fisheries Science Center
8604 La Jolla Shores DriveLa Jolla, CA 92037
[email protected]@NOAA.gov
NOAA Tech. Memo. NMFS-SWFSC-353

1
ABSTRACTAn aerial photographic census of Pacific harbor seals (Phoca vitulina richardii) was
conducted in California 22 May-1 July 2002 to document the number of seals hauled out duringthe molt period. To compensate for latitudinal differences in the timing of the molt, the state ofCalifornia was divided into three sections and each section was surveyed on different dates. Thethree sections were: (1) Channel Islands and mainland coast of southern California from theU.S./Mexico border to Pismo Beach, (2) central California from Pismo Beach to Point Reyes andSan Francisco Bay, and (3) northern California from Point Reyes to the California/Oregonborder. Aerial photographic surveys at the Channel Islands and the mainland coast of southernCalifornia occurred during the high-low tide cycle in the afternoon on 22-25 May and the low-low tide cycle during the morning of 16 June. Surveys in central California and northernCalifornia occurred during the low-low tide cycle at tides under one foot on 16-17 June and 28June-1 July, respectively. Color transparency photographs of harbor seals were taken with a126-mm-format camera equipped with image motion compensation. The geographical positionof each photograph was recorded by linking the camera to a computer and Global PositioningSystem (GPS). Three observers searched for hauled-out seals and photographed them, as theaircraft was flown over the coastline at 213 m (700 feet). A total of 467 haulout sites within thestate of California was found during the surveys. At the Channel Islands there were 3,878 sealscounted out of the water and 5 in the water near haulout sites. Along the mainland coast ofCalifornia and San Francisco Bay there were 17,555 seals counted hauled out and 136 sealscounted in the water near haulout sites. Statewide, a total of 21,433 seals were counted hauledout of the water and 141 seals were counted in the water. The mainland coast of California wasstratified into nineteen 0.5 degree latitude segments with counts from the San Francisco Bayestuary making up the twentieth stratum. Stratum 37.50° to 37.99° had the most seals (n =3,005), most seals per haulout site (n = 835), second highest number of haulout sites (n = 34),and third highest mean number of seals per haulout site (0 = 88.4). Of the eight Channel Islandsin southern California, Santa Cruz Island had the most seals (n =1,085) and Santa Barbara Islandthe fewest (n = 15).

2
INTRODUCTIONPacific harbor seals (Phoca vitulina richardii) are widely distributed along the mainland
coast, islands and bays of California. California Department of Fish and Game (CDFG)conducted annual aerial photographic surveys of harbor seals in California during the pre-moltand molt period (when the expected greatest number of seals were hauled out) during early Junethrough early July from 1982 through 1995 (Hanan 1996, Fluharty 1999). Seals from thosesurveys were counted from near-vertical aerial color-transparency photographs taken with a 70-mm-format Hasselblad camera as the aircraft flew over the coastline at an altitude of 183-213meters (600-700 feet).
In 1987, biologists from Southwest Fisheries Science Center (SWFSC) began to usephotographs taken with a 126-mm-format military recognizance camera equipped with imagemotion compensation to census California sea lions, northern elephant seals, and Steller sea lions(Lowry et al. 1996, Lowry 1999, Westlake et al. 1997). At a workshop on methods and timingof harbor seal surveys in California (Barlow 2002), it was recommended that SWFSC should usethe 126-mm-format camera for the 2002 California harbor seal surveys. This report describesmethods and results of the harbor seal census in California conducted by SWFSC during May-July 2002. In addition to providing a total count of harbor seals for California, counts werestratified by 0.5 degrees latitude for coastal mainland sites, for each of the Channel Islands, andfor sections of California.
METHODSThe state of California was divided into three sections to adjust for latitudinal differences
in the timing of the molt by harbor seals: (1) Channel Islands and mainland coast of southernCalifornia from the U.S./Mexico border to Pismo Beach, (2) central California from PismoBeach to Point Reyes and San Francisco Bay, and (3) northern California from Point Reyes tothe California/Oregon border (Table 1, Figure 1).
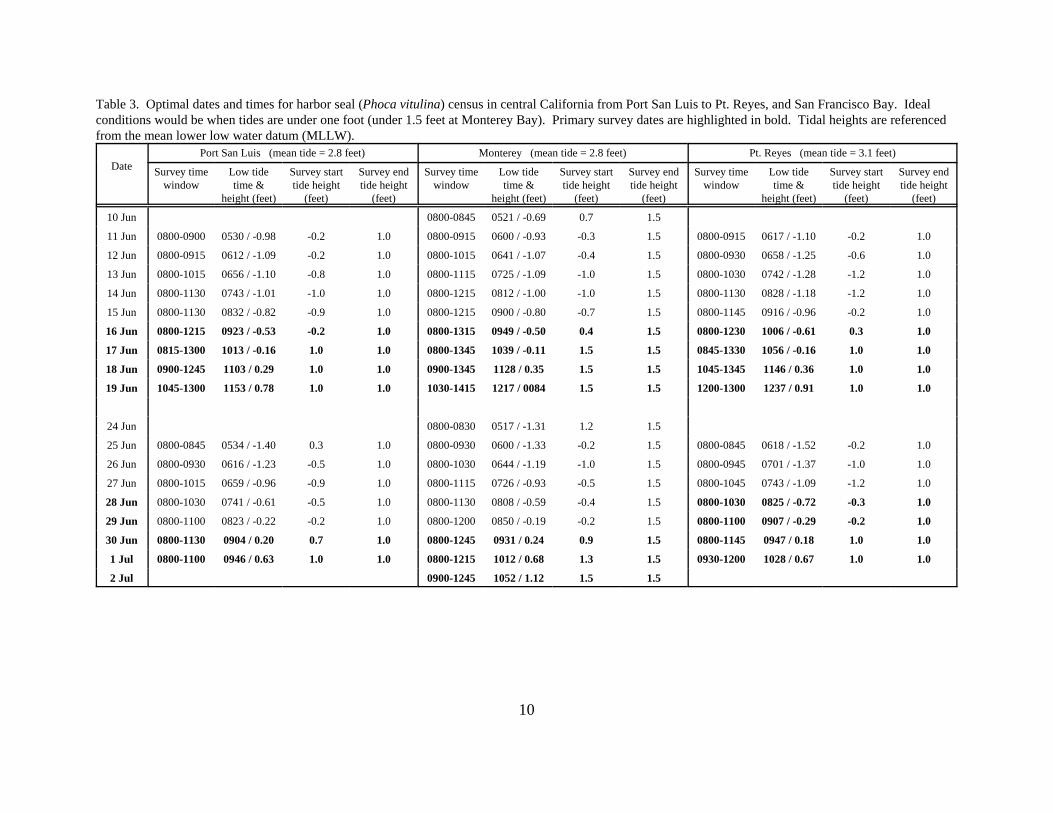
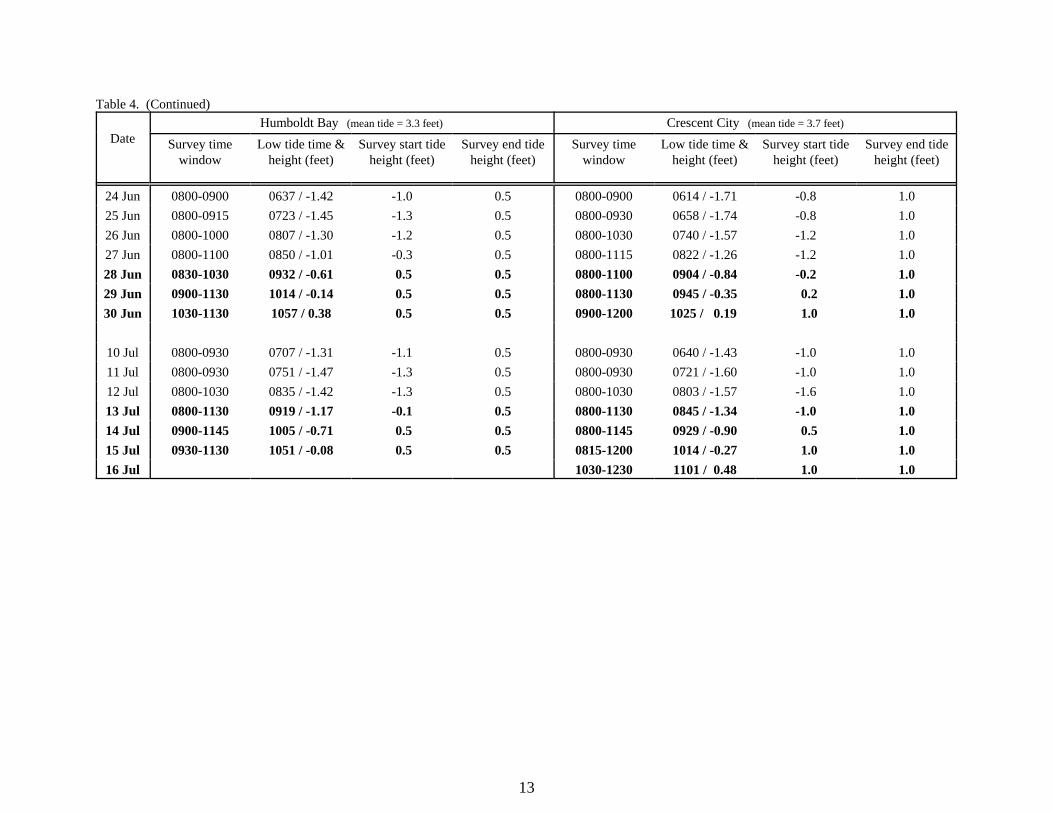
Aerial photographic surveys of harbor seals at the Channel Islands and the mainlandcoast of southern California were scheduled during the lowest tide cycle in the afternoon (high-low tide) in late-May through mid-June (Table 2) when previous studies at the Channel Islandsdetermined that the greatest number of harbor seals would be hauled out (Stewart and Yochem1994). Surveys in central California were scheduled during mid-to-late June during the low-lowtide cycle at tides under one foot, however, Monterey Bay was scheduled at tides under 1.5 feet(Table 3) based on recommendations made at the California harbor seal abundance workshop(Barlow 2002). Surveys in northern California were scheduled in late-June through mid-Julyduring the low-low tide cycle at tides under one foot, however, Humboldt Bay was scheduled attides under a half foot (Table 4) based on recommendations made at the California harbor sealabundance workshop (Barlow 2002). Optimal survey dates during favorable tides weredetermined to be days with the least amount of difference in tidal height, which corresponded tothe troughs in the daily tidal cycle. Surveys were also scheduled after 0800 hours when lightconditions were optimal for locating and photographing seals.
A twin-engine, high-wing Partenavia PN68-observer model aircraft was flown at aground speed of 185 km/h (100 knots) and at an altitude of 213 m (700 feet) above sea level(ASL). However, the altitude was raised at Elkhorn Slough to 305 m (1000 feet) and to 427 m(1400 feet) at Southeast Farallon Islands due to permit restrictions, to 366 m (1200 feet) at

3
Castro Rocks (San Francisco Bay) due to Federal Aviation Administration (FAA) restrictions,and to 274 m (900 feet) at Humboldt Bay to limit disturbance to seals. The survey wasconducted counterclockwise around the Channel Islands and from south to north along themainland. During the survey, the aircraft was flown directly over the coastline or slightlyoffshore. Seals were photographed as the aircraft traveled over the coastline, or if the seals wereout of camera range or sighted too late to be photographed, the aircraft doubled back tophotograph them. Multiple photographic passes were made over large rocks or islands to ensurethat the entire rock or island was photographed.
Harbor seals were photographed with a 126-mm-format Chicago Aerial Industries, Inc.KA-76 camera equipped with image motion compensation (IMC) and operated at a cycle ratethat achieved 67% overlap between adjacent frames. The geographical position of eachphotograph was recorded by linking the camera (mounted vertically inside the belly of theaircraft) to a computer and Global Positioning System (GPS.). A 152 mm focal-length lens wasused for low altitude photography (i.e., altitude of 213 to 366 m) and a 305 mm focal–length lenswas used for higher altitude photography (i.e., altitude of 427 m). Kodak Aerochrome HS FilmSO-359, a very fine-grained, high-speed, color transparency film, was used. The camera was setat an aperture of f/5.6 with a shutter speed between 1/400 and 1/2000 second.
The survey team consisted of three observers and the pilot. The observer in the right frontseat looked for seals in front and to the right of the aircraft and entered data into the computerlinked to the camera and to a Garmin 12XL GPS unit. The second observer was seated on theleft rear side of the aircraft and looked for seals to the left and below the aircraft. During thecentral and northern California surveys, the second observer also operated a second computerthat was linked to a Garmin GPSMAP 76 GPS unit for tracking the aircraft on a topographic mapdisplayed on the computer screen (National Geographic Topographic Maps of California onCD’s were used) that was loaded with all known harbor seal haulout sites. Locations of hauloutsites were provided by Bob Read, California Department of Fish and Game. This computerallowed us to know where the aircraft was in relation to previously known haulout sites as weflew over the coast. Additionally, the second observer monitored the local tide level displayedby the Garmin GPSMAP 76 to ensure that the survey was conducted at optimal tide levels. Thethird observer looked for seals under the aircraft from the belly viewing port located behind thecamera, and operated the camera when seals were sighted. The pilot also looked for seals andflew the aircraft over the coastline so that seals could be photographed without having to doubleback to optimize the time available for surveying under proper tidal conditions and to cover asmuch distance as possible during that day’s survey.
Aerial surveys were conducted on 22-25 May in southern California and Channel Islands,on 16-17 June in the northern portion of southern California (from Point Mugu to Point PismoBeach), central California and San Francisco Bay estuary, and, on 28 June-1 July in northernCalifornia (Table 1). Ground surveys were conducted at Purisima Point (34.738°N, 120.627°W)on 12 June, and at Yerba Buena Island (37.807°N, 122.363°W) on 18 June (Debbie Green, pers.commun. 20 June 2002; Table 1). The 22 May survey of the mainland coast from Point Mugu toPismo Beach was not completed due to military operations at Mugu Lagoon and due torestrictions within Vandenberg Air Force Base (this survey was repeated on 16 June). Commercial aircraft towing advertising banners made it too dangerous to survey the entiresouthern California coastline; however, known or suspected harbor seal hauling areas were

4
surveyed in the following locations (Figure 1): (1) La Jolla (32.851°N, 117.271°W) to PointLoma (32.663°N, 117.240°W), (2) Seal Beach (33.733°N, 118.098°W) and vicinity, (3) PalosVerdes Peninsula from Point Fermin (33.708°N, 118.287°W) to Malaga Cove, Redondo Beach(33.802°N, 118.393°W) , and (4) Pacific Palisades (34.038°N, 118.555°W) to Point Mugu(34.085°N, 119.060°W). Within San Francisco Bay, the FAA restricted access to the central SanFrancisco Bay area, however, the following areas were surveyed (Figure 2): (1) Richardson Bay,(2) Tiburon Peninsula (Angel Island was not surveyed), (3) Richmond San Rafael Bridge andPoint San Pablo, (4) San Rafael Bay, (5) northern shoreline of San Pablo Bay, (6) Suisun,Honker, and Grissly Bays, and (7) San Francisco Bay south of the San Mateo Bridge. WithinSan Francisco Bay estuary the following haulout sites were not surveyed: (1) AlamedaBreakwater, (2) Brook’s Island, (3) Point Ione, Angel Island, and (4) Point Blunt, Angel Island.
Surveys of the Channel Islands were conducted during afternoon hours at tides rangingbetween 1.8 feet and 0.9 feet from mean lower low water datum reference (MLLW) on 23 May,and at tides between 2.2 feet and 1.3 feet on 24 May (Table 2, Figure 3). Surveys of themainland coast of southern California from San Diego to Point Mugu were conducted duringafternoon hours at tides ranging from 1.3 feet to 1.2 feet on 25 May (Figure 3). Surveys of themainland coast of southern California from Point Mugu to Pismo Beach were conducted duringmorning hours at -0.2 foot tide from MLLW on 16 June (Figure 3). All surveys in central andnorthern California were conducted in the morning at tide levels under one foot from MLLW(and under a half foot in Humboldt Bay; Tables 3 and 4, Figures 4-7).
Harbor seal images were counted through a 7-70X zoom binocular microscope as thephotographs were illuminated on a light table. Images of animals were marked on a clear acetateoverlay as each was counted. Marks on the acetate were compared and verified with overlappingphotographs. If all animals could not be counted in one photograph, the overlay was placed onthe adjacent photograph at the exact location where the count ended previously and the countcontinued. Seals were counted in this manner until all were counted. One count was made foreach rock, island, or mainland haulout site. Seals in the water were tabulated separately. Haulout sites were defined as groups of seals or single seals found either on a rock, a group ofrocks, or a cove. Counts obtained for each haulout site were entered onto a spreadsheet andtallied. A single latitude and longitude was assigned to each haulout site.
Counts were tabulated by 0.5 degrees latitude for coastal mainland sites (including theFarallon Islands and Año Nuevo Island), and for San Francisco Bay estuary, each of the ChannelIslands, and northern, central and southern California sections of the state. Summary statisticswere compiled for each group.
RESULTS Using our criteria for identifying a haulout site, we identified 467 haulout sites within the
state of California (Tables 5 and 6). In the Channel Islands there were 3,878 seals countedonshore and 5 in the water near haulout sites at 144 haulout sites (Table 5, Figures 8 and 9). Along the mainland coast of California and San Francisco Bay estuary there were 17,555 sealscounted hauled out and 136 seals counted in the water near haulout sites at 323 haulout sites(Table 6, Figures 8 and 9). Statewide, a total of 21,433 seals were counted hauled out of thewater and 141 seals were counted in the water adjacent to a haulout site at 467 haulout sites(Table 7, Figures 8 and 9). On average there were 26.9 seals per haulout site in the Channel

1Read, R and E. Roberts. [2001]. Final report: Census/survey of harbor seals inCalifornia. Report submitted to Pacific States Marine Fisheries Commission. Available fromRobert Read, California Department of Fish and Game, Marine Region, San Diego Field Office,4949 Viewridge Avenue, San Diego, CA 92123.
5
Islands , 54.3 seals per haulout site along the mainland coast of California, and 45.9 seals perhaulout site statewide (Table 7, Figure 10).
The counts of harbor seals at the mainland coast of California were stratified intonineteen 0.5 degree latitude-segments with counts from the San Francisco Bay estuary makingup the twentieth stratum (Table 8). Stratum 37.50° to 37.99° had the most seals (n = 3,005),most seals per haulout site (n = 835), second highest number of haulout sites (n = 34), and thirdhighest mean number of seals per haulout site (0 = 88.4). Stratum 40.50° to 40.99° had thelargest median number of seals per haulout site (median = 70.0); stratum 34.00° to 34.49° hadthe highest mean number of seals per haulout site (0 = 134.3); and stratum 38.50° to 38.99° hadthe highest number of haulout sites (n = 49).
The counts of harbor seals at the Channel Islands in southern California were stratifiedfor each island (Table 8). Santa Cruz Island had the most seals (n =1,085) and Santa BarbaraIsland the fewest (n = 15). Santa Rosa Island and San Nicolas Island had the highest meannumber of seals per haulout site (0 = 35.0 and 0 = 34.3, respectively). Santa Cruz Island alsohad the most haulout sites (n = 38).
DISCUSSIONBased on counts obtained at all haulout sites in California during 2002, the population of
harbor seals in the state of California appears to be stable (Figure 8; Hanan 1996, Fluharty 1999,Read and Roberts 20011). Harbor seal counts at Channel Islands and along the mainland showno increase from counts obtained during the early-to-mid 1990's. The number of haulout sitesfound in 2002 were fewer than previous years and the average number of seals found per hauloutsite in 2002 was greater than previous years (Figures 9 and 10). Possible reasons for thesediscrepancies could be due to (1) differences in defining haulout sites between researchers, (2)differences in surface area covered by different camera systems (e.g., 70-mm-formatphotographs vs 126-mm-format photographs), or (3) accuracy in geographical positions ofphotographs (Loran vs GPS). Although survey date is another possibility because the number ofharbor seals on land differs throughout the year, our surveys were conducted during comparableperiods to those conducted by CDFG. Future surveys by SWFSC may indicate if the differencein harbor seal counts is real or due to methodological differences.
Many seals were foraging at sea; therefore, haulout counts are not a complete census ofthe population. Studies have been made to estimate total abundance from counts of seals foundout of the water at haulout sites. These studies used radio transmitters on a subset of seals toestimate the proportion of animals on land. Unfortunately, the majority of these studies(reviewed in Boveng 1988) documented the proportion of seals out of the water during certaintime periods of the day, instead of at an instantaneous time (as would occur when an aircraft fliesover during aerial surveys), and some were made during months that seals were not molting. The only study that estimated proportion of seals on land during aerial surveys was Huber et al.

6
(2001). Their estimated correction factor is probably not appropriate for our counts because thatstudy was done in the pupping season and was north of our study area. For the California stockof harbor seals, a correction factor of 1.3, derived from data of radio tagged seals collected by D.Hanan (Barlow et al. 1997, Hanan 1996), is currently used for estimating total abundance ofharbor seals in California from counts obtained at haulouts (Carretta et al. 2001). Multiplying21,433, the number of seals counted onshore at haulouts in 2002, by the 1.3 correction factor,estimates the total harbor seal population in California to be 27,862.
Our 2002 survey of San Francisco Bay estuary and Point Reyes was conducted slightlybefore the peak of the molt (Sarah Allen, pers. comm. 26 June 2002) and thus had the potentialfor slightly lower counts. The counts we obtained were considered an adequate representationbased on past surveys of the area by local biologists (Sarah Allen, pers. comm. 26 June 2002). The earlier survey was scheduled as a contingency against having to cancel the survey becauseof fog. Fortunately, the fog did not present a problem on the first low-tide survey window and asurvey during the second low-tide cycle was not needed. As it turned out, the coast of centraland northen California was covered in fog during the later low tide survey window. Ideally,when good results are obtained for the first survey a second survey should be conducted ifweather conditions allow, but that would add additional cost which would have to be weighedagainst the benefit of getting a second count that may or may not be better.
The 126-mm-format camera was used successfully for censusing Pacific harbor seals inCalifornia. This camera system could also be applied for censusing harbor seals in other regionsoutside California. One advantage to using this camera system is that lengths of seals can beestimated from the vertical photographs obtained by the camera system, a project that will beundertaken at a later date. This project would be useful because it could be used to infer theproportion of age classes represented in the census.
ACKNOWLEDGMENTSWe are grateful to Dan Richards of Channel Islands National Park, and to Kerri Danil,
Erin LaCasella, and Karin Forney of the Southwest Fisheries Science Center (SWFSC) forassisting us during our surveys. Aspen Helicopters, Oxnard, California, provided aircraftsupport, and Tim McLaughlin was the pilot. We are also indebted to Wayne Perryman of theSWFSC for providing his camera equipment, and to Morgan Lynn of the SWFSC formaintaining the camera. We thank all the participants of the harbor seal workshop held at theSWFSC during 28-29 March 2002 for helping us plan our survey, and Debbie Green of theRichmond Bridge Harbor Seal Survey, San Francisco State University, Bill Sydeman and PeterPyle of PRBO Conservation Science, and Bob Read of California Department of Fish and Gamefor sharing their unpublished data with us. The research was conducted under Marine MammalResearch Permit No. 774-1437, and National Marine Sanctuary Permit No.GFNMS/MBNMS/CINMS-04-98. The manuscript was reviewed by Jay Barlow, Robin Brown,Sarah Allen, and Harriet Huber.
LITERATURE CITEDBarlow, J. 2002. Report of the California harbor seal workshop, March 28-29, 2002, Southwest
Fisheries Science Center.

7
Barlow, J., K. A. Forney, P. Scott Hill, R. L. Brownell Jr., J. V. Carretta, D. P. DeMaster, F.Julian, M. S. Lowry, T. Ragen, R. and R. Reeves. 1997. U.S. Pacific marine mammalstock assessments: 1996. NOAA Technical Memorandum NMFS, NOAA-TM-NMFS-SWFSC-248. 223 pp.
Boveng, P. 1988. Status of the Pacific harbor seal population on the U.S. west coast. Administrative Report LJ-88-06, Southwest Fisheries Center, La Jolla, California. 43 pp.
Carretta, J. V., J. Barlow, K. A. Forney, M. M. Muto, and J. Baker. 2001. U.S. Pacific marinemammal stock assessments: 2001. NOAA Technical Memorandum: NOAA-TM-NMFS-SWFSC-307. 280 pp.
Fluharty, M. J. 1999. Summary of Pacific harbor seal, Phoca vitulina richardsi, surveys inCalifornia, 1982-1995. California Department of Fish and Game, Marine RegionAdministrative Report 99-1. 49 pp.
Hanan, D. A. 1996. Dynamics of abundance and distribution for Pacific harbor seals, Phocavitulina richardsi, on the coast of California. PhD Dissertation, University of California,Los Angeles. 158 pp.
Huber, H. R., S. J. Jeffries, R. F. Brown, R. L. DeLong, and G. VanBlaricom. 2001. Correctingaerial survey counts of harbor seals (Phoca vitulina richardsi) in Washington andOregon. Marine Mammal Science 17:276-293.
Lowry, M. S., W. L. Perryman, M. S. Lynn, R. L. Westlake, and F. Julian. 1996. Counts ofnorthern elephant seals, Mirounga angustirostris, from large-format aerial photographstaken at rookeries in southern California during the breeding season. Fishery Bulletin, U.S. 94:176-185.
Lowry, M. S. 1999. Counts of California sea lion (Zalophus californianus) pups from aerialcolor photographs and from the ground: a comparison of two methods. Marine MammalScience 15:143-158.
Stewart, B. S. and P. K. Yochem. 1994. Ecology of harbor seals in the Southern CaliforniaBight. In W. L. Halvorson and G. J. Maender (editors), The Fourth California IslandsSymposium: Update on the status of resources, p. 123-134. Santa Barbara Museum ofNatural History, Santa Barbara, CA.
Westlake, R. L., W. L. Perryman, and K. A. Ono. 1997. Comparison of vertical photographicand ground censuses of Steller sea lions at Año Nuevo Island, July 1990-1993. MarineMammal Science 13:207-218.

8
Table 1. Dates and areas surveyed for harbor seals (Phoca vitulina) within three sections of Californiaduring 22 May through 1 July 2002.
SectionBoundaries of section
Survey coverage Datesurveyed
TimesurveyedLat/Long Lat/Long
SouthernCalifornia(IncludingChannelIslands)
U.S./Mexicoborder
(32.533°N,117.117°W)
PismoBeach
(35.139°N,120.645°W)
Port Hueneme to PointConception
22 May 2002 1320-1428
Mugu Lagoon and Northern Channel Islands(Anacapa Is., Santa Cruz Is.,Santa Rosa Is., and SanMiguel Is.)
23 May 2002 1236-1240;1247-1550
Southern Channel Islands (SantaBarbara Is., San Nicolas Is., San Clemente Is., and Santa Catalina Is.)
24 May 20021301-1307; 1316-1345; 1404-1441;1450-1527
Southern California mainlandcoast (Point Loma to La Jolla,Seal Beach and vicinity, PalosVerdes Peninsula, PacificPalisades to Point Mugu)
25 May 2002 1403-1535
Purisima Point 12 June 2002 0820
Point Mugu to Pismo Beach 16 June 2002 0848-1005
CentralCaliforniaand SanFranciscoBayestuary
PismoBeach
(35.139°N,120.645°W)
Point Reyes(37.995°N,123.023°W)
Pismo Beach to Monterey 16 June 2002 1005-1238
Monterey to Point Reyes, and San Francisco Bay estuary
17 June 2002 1000-1211; 1227-1353
Yerba Buena Island, SanFrancisco Bay
18 June 2002 1430
NorthernCalifornia
Point Reyes(37.995°N,123.023°W)
California/Oregonborder
(42.000°N,124.212°W)
Point Reyes to Fort Ross Point 28 June 2002 1001-1102
Fort Ross Point to JughandleState Reserve (6 km south ofFort Bragg)
29 June 2002 0836-1007
Jughandle State Reserve toCalifornia/Oregon border
30 June 2002 0858-1159
S. E. Farallon Islands 1 July 2002 1009-1023

9
Table 2. Optimal dates and times for harbor seal (Phoca vitulina) census in the Southern California Bight (SCB). Ideal conditions would be during an afternoonlow tide. Primary survey dates are highlighted in bold. Tidal heights are referenced from the mean lower low water datum (MLLW).
DateSanta Rosa Island (mean tide = 2.4 feet) Ventura (mean tide = 2.7 feet) Pt. Arguello
Survey timewindow
Low/high tidetime & height
Survey start tideheight (feet)
Survey end tideheight (feet)
Survey timewindow
Low-high tidetime & height
(feet)
Survey start tideheight (feet)
Survey end tideheight (feet)
Low tide time & height(feet)
20 May 1300-1600 0.1 2.3 1300-1600 0.5 3.5 1201 / -0.1
21 May 1300-1600 -0.1 2.1 1300-1600 0.2 2.5 1250 / 0.1
22 May 1300-1545 1317 / 0.29 0.2 2.3 1300-1600 1306 / 0.27 0.3 2.0 1333 / 0.3
23 May 1300-1600 1357 / 0.57 1.0 1.8 1300-1600 1346 / 0.55 0.6 2.2 1414 / 0.6
24 May 1300-1600 1436 / 0.92 1.8 1.3 1300-1600 1425 / 0.88 1.5 1.8 1453 / 0.8
25 May 1300-1600 1514 / 1.29 2.2 1.8 1300-1600 1503 / 1.24 2.5 1.4 1531 / 1.1
26 May 1345-1600 1552 / 1.67 2.3 1.7 1300-1600 1541 / 1.61 2.5 1.8 1609 / 1.5
27 May 1300-1600 1631 / 2.05 3.4 2.1 1330-1600 1620 / 1.97 2.6 2.0 1647 / 1.9
28 May 1300-1600 1712 / 2.42 3.4 2.2 1530-1600 1701 / 2.33 2.6 2.4 1728 / 2.2
2 Jun 1300-1600 1.2 3.1 1300-1445 1.6 2.6 1102 / 0.4
3 Jun 1300-1600 1.0 2.9 1300-1515 1.1 2.6 1151 / 0.7
4 Jun 1300-1600 1.2 3.0 1300-1600 1.0 2.5 1233 / 0.8
5 Jun 1300-1600 1.2 2.7 1300-1545 1.2 2.6 1309 / 1.1
6 Jun 1300-1600 1324 / 1.47 1.8 2.3 1300-1600 1313 / 1.41 1.4 2.5 1341 / 1.3
7 Jun 1300-1530 1354 / 1.69 1.9 2.3 1300-1600 1343 / 1.63 1.9 2.3 1411 / 1.5
8 Jun 1300-1600 1424 / 1.89 2.3 2.3 1300-1600 1413 / 1.82 2.1 2.5 1440 / 1.7
9 Jun 1300-1600 1454 / 2.07 2.8 2.2 1300-1600 1443 / 1.99 2.5 2.3 1511 / 1.9
10 Jun 1300-1600 1526 / 2.25 2.8 2.3 1330-1600 1515 / 2.16 2.6 2.2 1543 / 2.1
11 Jun 1300-1600 1600 / 2.42 3.0 2.2 1330-1600 1549 / 2.32 2.2 2.5 1617 / 2.2
10
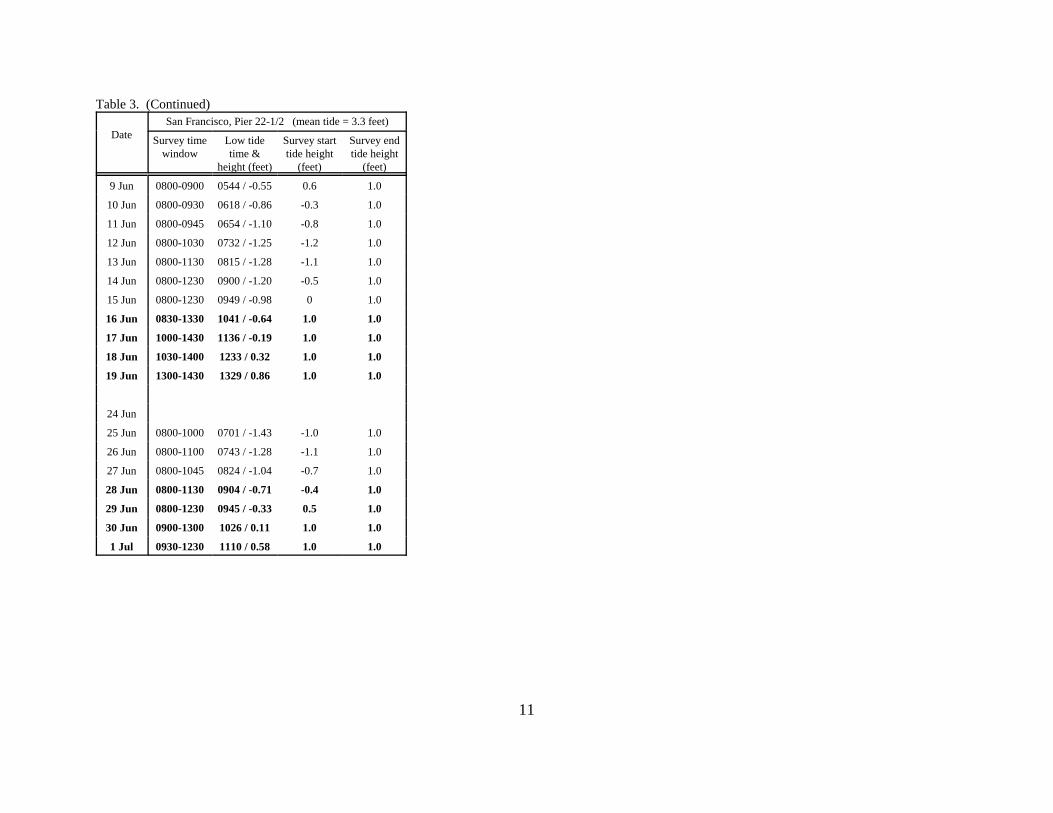
Table 3. Optimal dates and times for harbor seal (Phoca vitulina) census in central California from Port San Luis to Pt. Reyes, and San Francisco Bay. Idealconditions would be when tides are under one foot (under 1.5 feet at Monterey Bay). Primary survey dates are highlighted in bold. Tidal heights are referencedfrom the mean lower low water datum (MLLW).
DatePort San Luis (mean tide = 2.8 feet) Monterey (mean tide = 2.8 feet) Pt. Reyes (mean tide = 3.1 feet)
Survey timewindow
Low tidetime &
height (feet)
Survey starttide height
(feet)
Survey endtide height
(feet)
Survey timewindow
Low tidetime &
height (feet)
Survey starttide height
(feet)
Survey endtide height
(feet)
Survey timewindow
Low tidetime &
height (feet)
Survey starttide height
(feet)
Survey endtide height
(feet)
10 Jun 0800-0845 0521 / -0.69 0.7 1.5
11 Jun 0800-0900 0530 / -0.98 -0.2 1.0 0800-0915 0600 / -0.93 -0.3 1.5 0800-0915 0617 / -1.10 -0.2 1.0
12 Jun 0800-0915 0612 / -1.09 -0.2 1.0 0800-1015 0641 / -1.07 -0.4 1.5 0800-0930 0658 / -1.25 -0.6 1.0
13 Jun 0800-1015 0656 / -1.10 -0.8 1.0 0800-1115 0725 / -1.09 -1.0 1.5 0800-1030 0742 / -1.28 -1.2 1.0
14 Jun 0800-1130 0743 / -1.01 -1.0 1.0 0800-1215 0812 / -1.00 -1.0 1.5 0800-1130 0828 / -1.18 -1.2 1.0
15 Jun 0800-1130 0832 / -0.82 -0.9 1.0 0800-1215 0900 / -0.80 -0.7 1.5 0800-1145 0916 / -0.96 -0.2 1.0
16 Jun 0800-1215 0923 / -0.53 -0.2 1.0 0800-1315 0949 / -0.50 0.4 1.5 0800-1230 1006 / -0.61 0.3 1.0
17 Jun 0815-1300 1013 / -0.16 1.0 1.0 0800-1345 1039 / -0.11 1.5 1.5 0845-1330 1056 / -0.16 1.0 1.0
18 Jun 0900-1245 1103 / 0.29 1.0 1.0 0900-1345 1128 / 0.35 1.5 1.5 1045-1345 1146 / 0.36 1.0 1.0
19 Jun 1045-1300 1153 / 0.78 1.0 1.0 1030-1415 1217 / 0084 1.5 1.5 1200-1300 1237 / 0.91 1.0 1.0
24 Jun 0800-0830 0517 / -1.31 1.2 1.5
25 Jun 0800-0845 0534 / -1.40 0.3 1.0 0800-0930 0600 / -1.33 -0.2 1.5 0800-0845 0618 / -1.52 -0.2 1.0
26 Jun 0800-0930 0616 / -1.23 -0.5 1.0 0800-1030 0644 / -1.19 -1.0 1.5 0800-0945 0701 / -1.37 -1.0 1.0
27 Jun 0800-1015 0659 / -0.96 -0.9 1.0 0800-1115 0726 / -0.93 -0.5 1.5 0800-1045 0743 / -1.09 -1.2 1.0
28 Jun 0800-1030 0741 / -0.61 -0.5 1.0 0800-1130 0808 / -0.59 -0.4 1.5 0800-1030 0825 / -0.72 -0.3 1.0
29 Jun 0800-1100 0823 / -0.22 -0.2 1.0 0800-1200 0850 / -0.19 -0.2 1.5 0800-1100 0907 / -0.29 -0.2 1.0
30 Jun 0800-1130 0904 / 0.20 0.7 1.0 0800-1245 0931 / 0.24 0.9 1.5 0800-1145 0947 / 0.18 1.0 1.0
1 Jul 0800-1100 0946 / 0.63 1.0 1.0 0800-1215 1012 / 0.68 1.3 1.5 0930-1200 1028 / 0.67 1.0 1.0
2 Jul 0900-1245 1052 / 1.12 1.5 1.5
11
Table 3. (Continued)
DateSan Francisco, Pier 22-1/2 (mean tide = 3.3 feet)
Survey timewindow
Low tidetime &
height (feet)
Survey starttide height
(feet)
Survey endtide height
(feet)
9 Jun 0800-0900 0544 / -0.55 0.6 1.0
10 Jun 0800-0930 0618 / -0.86 -0.3 1.0
11 Jun 0800-0945 0654 / -1.10 -0.8 1.0
12 Jun 0800-1030 0732 / -1.25 -1.2 1.0
13 Jun 0800-1130 0815 / -1.28 -1.1 1.0
14 Jun 0800-1230 0900 / -1.20 -0.5 1.0
15 Jun 0800-1230 0949 / -0.98 0 1.0
16 Jun 0830-1330 1041 / -0.64 1.0 1.0
17 Jun 1000-1430 1136 / -0.19 1.0 1.0
18 Jun 1030-1400 1233 / 0.32 1.0 1.0
19 Jun 1300-1430 1329 / 0.86 1.0 1.0
24 Jun
25 Jun 0800-1000 0701 / -1.43 -1.0 1.0
26 Jun 0800-1100 0743 / -1.28 -1.1 1.0
27 Jun 0800-1045 0824 / -1.04 -0.7 1.0
28 Jun 0800-1130 0904 / -0.71 -0.4 1.0
29 Jun 0800-1230 0945 / -0.33 0.5 1.0
30 Jun 0900-1300 1026 / 0.11 1.0 1.0
1 Jul 0930-1230 1110 / 0.58 1.0 1.0

12
Table 4. Optimal dates and times for harbor seal (Phoca vitulina) census in northern California from Pt. Reyes to Crescent City, and Humboldt Bay. Idealconditions would be when tides are under one foot (under 0.5 feet at Humboldt Bay). Primary survey dates are highlighted in bold. Tidal heights are referencedfrom the mean lower low water datum (MLLW).
DatePt. Reyes (mean tide = 3.1 feet) Shelter Cove (mean tide = 3.2 feet)
Survey timewindow
Low tide time &height (feet)
Survey start tideheight (feet)
Survey end tideheight (feet)
Survey timewindow
Low tide time &height (feet)
Survey start tideheight (feet)
Survey end tideheight (feet)
24 Jun 0800-0845 0539 / -1.3 0.5 1.025 Jun 0800-0845 0618 / -1.52 -0.2 1.0 0800-0930 0622 / -1.3 -0.5 1.026 Jun 0800-0945 0701 / -1.37 -1.0 1.0 0800-1030 0705 / -1.2 -1.2 1.027 Jun 0800-1045 0743 / -1.09 -1.2 1.0 0800-1015 0746 / -0.9 -0.8 1.028 Jun 0800-1030 0825 / -0.72 -0.3 1.0 0800-1100 0828 / -0.6 -0.6 1.029 Jun 0800-1100 0907 / -0.29 -0.2 1.0 0800-1130 0911 / -0.2 0.2 1.030 Jun 0800-1145 0947 / 0.18 1.0 1.0 0800-1130 0954 / 0.2 0.6 1.01 Jul 0930-1200 1028 / 0.67 1.0 1.0 0930-1130 1038 / 0.7 1.0 1.0
10 Jul 0800-0900 0558 / -1.23 -0.2 1.0 0800-0845 0603 / -1.1 0.3 1.011 Jul 0800-0900 0640 / -1.35 -0.3 1.0 0800-0945 0644 / -1.2 -0.8 1.012 Jul 0800-1000 0722 / -1.30 -1.2 1.0 0800-1030 0727 / -1.2 -1.1 1.013 Jul 0800-1045 0804 / -1.07 -1.0 1.0 0800-1030 0810 / -0.9 -0.9 1.014 Jul 0800-1100 0848 / -0.66 -0.2 1.0 0800-1115 0856 / -0.6 -0.4 1.015 Jul 0800-1130 0932 / -0.10 0.3 1.0 0800-1130 0943 / 0 1.0 1.016 Jul 0930-1145 1018 / 0.55 1.0 1.0 0900-1100 1033 / 0.6 1.0 1.0
13
Table 4. (Continued)
DateHumboldt Bay (mean tide = 3.3 feet) Crescent City (mean tide = 3.7 feet)
Survey timewindow
Low tide time &height (feet)
Survey start tideheight (feet)
Survey end tideheight (feet)
Survey timewindow
Low tide time &height (feet)
Survey start tideheight (feet)
Survey end tideheight (feet)
24 Jun 0800-0900 0637 / -1.42 -1.0 0.5 0800-0900 0614 / -1.71 -0.8 1.025 Jun 0800-0915 0723 / -1.45 -1.3 0.5 0800-0930 0658 / -1.74 -0.8 1.026 Jun 0800-1000 0807 / -1.30 -1.2 0.5 0800-1030 0740 / -1.57 -1.2 1.027 Jun 0800-1100 0850 / -1.01 -0.3 0.5 0800-1115 0822 / -1.26 -1.2 1.028 Jun 0830-1030 0932 / -0.61 0.5 0.5 0800-1100 0904 / -0.84 -0.2 1.029 Jun 0900-1130 1014 / -0.14 0.5 0.5 0800-1130 0945 / -0.35 0.2 1.030 Jun 1030-1130 1057 / 0.38 0.5 0.5 0900-1200 1025 / 0.19 1.0 1.0
10 Jul 0800-0930 0707 / -1.31 -1.1 0.5 0800-0930 0640 / -1.43 -1.0 1.011 Jul 0800-0930 0751 / -1.47 -1.3 0.5 0800-0930 0721 / -1.60 -1.0 1.012 Jul 0800-1030 0835 / -1.42 -1.3 0.5 0800-1030 0803 / -1.57 -1.6 1.013 Jul 0800-1130 0919 / -1.17 -0.1 0.5 0800-1130 0845 / -1.34 -1.0 1.014 Jul 0900-1145 1005 / -0.71 0.5 0.5 0800-1145 0929 / -0.90 0.5 1.015 Jul 0930-1130 1051 / -0.08 0.5 0.5 0815-1200 1014 / -0.27 1.0 1.016 Jul 1030-1230 1101 / 0.48 1.0 1.0

14
Table 5. Counts of harbor seals (Phoca vitulina) obtained from 126-mm-format aerial color photographs taken at 144 haulout sites onthe Channel Islands on 23-24 May 2002.
Island Location of haulout site Degreeslatitude
Degreeslongitude Date
Count ofseals
onshore
Count ofseals inwater
Anacapa Island NE West (Anacapa) Island 34.011 119.415 23-May-02 2Anacapa Island SW West (Anacapa) Island 34.010 119.436 23-May-02 2Anacapa Island SW West (Anacapa) Island 34.011 119.434 23-May-02 41Anacapa Island SW West (Anacapa) Island 34.010 119.433 23-May-02 5Anacapa Island SW West (Anacapa) Island 34.010 119.433 23-May-02 10Anacapa Island SW West (Anacapa) Island 34.009 119.431 23-May-02 7Anacapa Island SW West (Anacapa) Island 34.008 119.430 23-May-02 31Anacapa Island SW West (Anacapa) Island 34.008 119.428 23-May-02 24Anacapa Island SW West (Anacapa) Island 34.008 119.427 23-May-02 22Anacapa Island SW West (Anacapa) Island 34.008 119.426 23-May-02 36Anacapa Island SW West (Anacapa) Island 34.008 119.425 23-May-02 1Anacapa Island E of Cat Rock Point, West (Anacapa)
Island34.005 119.420 23-May-02 8
Anacapa Island E of Cat Rock Point, West (Anacapa)Island
34.006 119.419 23-May-02 6
Anacapa Island SW Middle (Anacapa) Island 34.005 119.401 23-May-02 14Anacapa Island SW Middle (Anacapa) Island 34.004 119.401 23-May-02 11Anacapa Island SW Middle (Anacapa) Island 34.003 119.397 23-May-02 11San Clemente Island Northwest Harbor Islet 33.038 118.590 24-May-02 29San Clemente Island Northwest Harbor Islet 33.038 118.592 24-May-02 21San Clemente Island 3.8 km N of Eel Point 32.952 118.557 24-May-02 12San Clemente Island 3.2 km N of Eel Point 32.947 118.554 24-May-02 1San Clemente Island 1.7 km SSE of Mail Point 32.874 118.508 24-May-02 35San Clemente Island Pyramid Head 32.817 118.356 24-May-02 16San Clemente Island 11.2 km SSE Wilson Cove 32.925 118.487 24-May-02 1
Table 5. (Continued)

15
Island Location of haulout site Degreeslatitude
Degreeslongitude Date
Count ofseals
onshore
Count ofseals inwater
San Miguel Island Cardwell Point 34.026 120.308 23-May-02 3San Miguel Island Cardwell Point 34.027 120.308 23-May-02 30San Miguel Island Challenge Point 34.037 120.314 23-May-02 25San Miguel Island Hoffman Point 34.045 120.327 23-May-02 124San Miguel Island Harbor Seal Cove 34.067 120.360 23-May-02 10San Miguel Island Harbor Seal Cove 34.068 120.361 23-May-02 51San Miguel Island Harbor Seal Cove 34.068 120.362 23-May-02 23San Miguel Island Harbor Seal Cove 34.069 120.362 23-May-02 35San Miguel Island West end of Simonton Cove 34.052 120.405 23-May-02 18San Miguel Island West end of Simonton Cove 34.052 120.407 23-May-02 24San Miguel Island Otter Harbor 34.053 120.411 23-May-02 1San Miguel Island Otter Harbor 34.054 120.412 23-May-02 3San Miguel Island Oil Point 34.055 120.414 23-May-02 2San Miguel Island Oil Point 34.055 120.415 23-May-02 4San Miguel Island Oil Point 34.055 120.416 23-May-02 38San Miguel Island Oil Point 34.055 120.417 23-May-02 48San Miguel Island 3.2 km WNW of Crook Point 34.026 120.390 23-May-02 4San Miguel Island 3.1 km WNW of Crook Point 34.025 120.389 23-May-02 31San Miguel Island 1.9 km WNW of Crook Point 34.020 120.377 23-May-02 3San Miguel Island 1.5 km WNW of Crook Point 34.019 120.374 23-May-02 34San Miguel Island Crook Point 34.015 120.358 23-May-02 32San Miguel Island Crook Point 34.014 120.359 23-May-02 2San Miguel Island Crook Point 34.016 120.358 23-May-02 57San Miguel Island Crook Point 34.017 120.356 23-May-02 8San Miguel Island Crook Point 34.017 120.356 23-May-02 1
Table 5. (Continued)

16
Island Location of haulout site Degreeslatitude
Degreeslongitude Date
Count ofseals
onshore
Count ofseals inwater
San Miguel Island SE Beach, 1.1 km ENE of Crook Point 34.020 120.349 23-May-02 27San Miguel Island SE Beach, 2.0 km WSW of Cardwell
Point34.019 120.323 23-May-02 57
San Miguel Island SE Beach, 2.0 km WSW of CardwellPoint
34.019 120.321 23-May-02 31
San Miguel Island SE Beach, 1.9 km WSW of CardwellPoint
34.019 120.317 23-May-02 5
San Nicolas Island Pirates Cove 33.279 119.518 24-May-02 154 1San Nicolas Island 0.7 km WNW Pirates Cove 33.283 119.524 24-May-02 26San Nicolas Island Vizcaino Point, Rocks NW of Red Eye
Beach33.273 119.565 24-May-02 45
San Nicolas Island Vizcaino Point, Rocks NW of Red EyeBeach
33.273 119.566 24-May-02 63
San Nicolas Island Vizcaino Point 33.273 119.576 24-May-02 18San Nicolas Island Hercules Beach 33.245 119.559 24-May-02 3San Nicolas Island Beach SSE of Hercules Beach 33.243 119.557 24-May-02 25San Nicolas Island Flat Rock 33.216 119.477 24-May-02 48San Nicolas Island Flat Rock 33.216 119.476 24-May-02 38San Nicolas Island Flat Rock 33.215 119.471 24-May-02 65San Nicolas Island Flat Rock 33.215 119.470 24-May-02 3San Nicolas Island Flat Rock 33.215 119.468 24-May-02 16San Nicolas Island Flat Rock 33.216 119.464 24-May-02 1San Nicolas Island Flat Rock 33.216 119.459 24-May-02 7San Nicolas Island Flat Rock 33.216 119.458 24-May-02 26San Nicolas Island Rocks east of Daytona Beach 33.220 119.442 24-May-02 45San Nicolas Island East Sand Spit 33.225 119.437 24-May-02 1
Table 5. (Continued)

17
Island Location of haulout site Degreeslatitude
Degreeslongitude Date
Count ofseals
onshore
Count ofseals inwater
Santa Barbara Island Webster Point 33.480 119.049 24-May-02 8Santa Barbara Island Webster Point 33.481 119.047 24-May-02 7Santa Catalina Island Palisades 33.304 118.340 24-May-02 49 1Santa Catalina Island Palisades 33.303 118.338 24-May-02 1Santa Catalina Island 0.8 km SSE West End 33.473 118.603 24-May-02 3Santa Catalina Island 0.6 km E of Whale Rock 33.434 118.554 24-May-02 19Santa Catalina Island Kelp Point 33.435 118.545 24-May-02 4Santa Catalina Island Cape Cortes/Lobster Bay 33.431 118.531 24-May-02 4Santa Catalina Island 1.1 km NNE of China Point 33.338 118.474 24-May-02 20Santa Catalina Island 0.9 km NNE of China Point 33.336 118.473 24-May-02 103Santa Catalina Island 0.2 km N of China Point 33.331 118.468 24-May-02 33Santa Cruz Island 1.3 km SE of San Pedro Point 34.026 119.530 23-May-02 8Santa Cruz Island Between Chinese Harbor and Prisoners
Harbor34.016 119.641 23-May-02 25
Santa Cruz Island Between Chinese Harbor and PrisonersHarbor
34.016 119.644 23-May-02 43
Santa Cruz Island Between Chinese Harbor and PrisonersHarbor
34.019 119.656 23-May-02 85
Santa Cruz Island Between Chinese Harbor and PrisonersHarbor
34.019 119.657 23-May-02 25 1
Santa Cruz Island Twin Harbors 34.043 119.716 23-May-02 3Santa Cruz Island Between Twin Harbors and Platts Harbor 34.046 119.724 23-May-02 5Santa Cruz Island Platts Harbor 34.050 119.741 23-May-02 1Santa Cruz Island Diablo Anchorage, Diablo Point 34.058 119.764 23-May-02 1Santa Cruz Island Diablo Anchorage, Diablo Point 34.056 119.765 23-May-02 2Santa Cruz Island Ladys Harbor 34.055 119.786 23-May-02 15
Table 5. (Continued)

18
Island Location of haulout site Degreeslatitude
Degreeslongitude Date
Count ofseals
onshore
Count ofseals inwater
Santa Cruz Island Vicinity of Arch Rock 34.054 119.799 23-May-02 33Santa Cruz Island Vicinity of Arch Rock 34.057 119.795 23-May-02 39Santa Cruz Island Vicinity of Arch Rock 34.056 119.797 23-May-02 37Santa Cruz Island 3.5 km ESE of Profile Point 34.058 119.825 23-May-02 6Santa Cruz Island 3.1 km ESE of Profile Point 34.059 119.829 23-May-02 5Santa Cruz Island 1.7 km W of Profile Point 34.073 119.880 23-May-02 2Santa Cruz Island 1.8 km W of Profile Point 34.073 119.881 23-May-02 7Santa Cruz Island 1.2 km NNE of Black Point 34.046 119.893 23-May-02 2Santa Cruz Island Klinton Point 34.008 119.887 23-May-02 16Santa Cruz Island Klinton Point 34.006 119.886 23-May-02 70Santa Cruz Island Vicinity of Klinton Point 34.004 119.885 23-May-02 25Santa Cruz Island Vicinity of Klinton Point 34.003 119.885 23-May-02 26Santa Cruz Island Vicinity of Klinton Point 34.003 119.884 23-May-02 11Santa Cruz Island Vicinity of Klinton Point 34.000 119.883 23-May-02 36Santa Cruz Island Vicinity of Klinton Point 33.999 119.883 23-May-02 15Santa Cruz Island Vicinity of Klinton Point 33.998 119.882 23-May-02 3Santa Cruz Island Vicinity of Klinton Point 33.997 119.882 23-May-02 52Santa Cruz Island Vicinity of Klinton Point 33.996 119.881 23-May-02 128Santa Cruz Island Vicinity of Klinton Point 33.995 119.881 23-May-02 49Santa Cruz Island Klinton Point 34.007 119.886 23-May-02 12Santa Cruz Island Klinton Point 34.007 119.886 23-May-02 71Santa Cruz Island Vicinity of Klinton Point 34.005 119.885 23-May-02 30Santa Cruz Island Vicinity of Klinton Point 33.991 119.879 23-May-02 5Santa Cruz Island Vicinity of Klinton Point 33.989 119.879 23-May-02 13 1Santa Cruz Island Laguna Harbor 33.963 119.797 23-May-02 1Santa Cruz Island 2.3 km W of Sandstone Point 33.989 119.593 23-May-02 94
Table 5. (Continued)

19
Island Location of haulout site Degreeslatitude
Degreeslongitude Date
Count ofseals
onshore
Count ofseals inwater
Santa Cruz Island 3.1 km WSW of Sandstone Point 33.993 119.585 23-May-02 54Santa Rosa Island Vicinity of Southeast Anchorage,
Beechers Bay33.983 120.014 23-May-02 7
Santa Rosa Island Vicinity of Southeast Anchorage,Beechers Bay
33.985 120.021 23-May-02 21
Santa Rosa Island Vicinity of Northwest Anchorage andCorral Point, Beechers Bay
34.020 120.048 23-May-02 15
Santa Rosa Island Vicinity of Carrington Point 34.035 120.050 23-May-02 10 1Santa Rosa Island 3.7 km E of Brockway Point 34.020 120.107 23-May-02 7Santa Rosa Island 3.1 km E of Brockway Point 34.020 120.114 23-May-02 36Santa Rosa Island 2.9 km E of Brockway Point 34.021 120.117 23-May-02 100Santa Rosa Island 2.1 km E of Brockway Point 34.023 120.125 23-May-02 40Santa Rosa Island 1.6 km E of Brockway Point 34.024 120.130 23-May-02 2Santa Rosa Island 3.7 km ENE of Sandy Point 34.007 120.211 23-May-02 19Santa Rosa Island 1.2 km ESE of Sandy Point 33.996 120.239 23-May-02 134Santa Rosa Island 1.3 km ESE of Sandy Point 33.996 120.239 23-May-02 77Santa Rosa Island 1.4 km ESE of Sandy Point 33.995 120.238 23-May-02 65Santa Rosa Island 3.4 km ESE of Sandy Point 33.983 120.221 23-May-02 1Santa Rosa Island 3.5 km ESE of Sandy Point 33.982 120.221 23-May-02 44Santa Rosa Island 3.2 km NNW of Cluster Point 33.951 120.194 23-May-02 19Santa Rosa Island 3.1 km ESE of Cluster Point 33.911 120.151 23-May-02 22Santa Rosa Island 3.4 km ESE of Cluster Point 33.910 120.149 23-May-02 6Santa Rosa Island 3.4 km ESE of Cluster Point 33.910 120.148 23-May-02 32Santa Rosa Island 4.5 km ESE of Cluster Point 33.905 120.139 23-May-02 9Santa Rosa Island 1.3 km NE of Ford Point 33.924 120.039 23-May-02 12Santa Rosa Island 1.6 km NE of Ford Point 33.925 120.035 23-May-02 63
Table 5. (Continued)

20
Island Location of haulout site Degreeslatitude
Degreeslongitude Date
Count ofseals
onshore
Count ofseals inwater
Santa Rosa Island 2.3 km NE of Ford Point 33.928 120.029 23-May-02 76Santa Rosa Island 2.7 km NE of Ford Point 33.931 120.025 23-May-02 58Santa Rosa Island 3.0 km NE of Ford Point 33.931 120.023 23-May-02 5Santa Rosa Island 1 km N of East Point 33.951 119.970 23-May-02 31

21
Table 6. Counts of harbor seals (Phoca vitulina) obtained from 126-mm-format aerial color photographs taken at 323 haulout sitesalong the mainland coast of California and San Francisco Bay estuary on 16-17, 28-30 June and 1 July 2002. Counts for PurisimaPoint and Yerba Buena Island were obtained by biologists onshore on 12 June and 18 June, respectively.
Mainlandsection Location of haulout site Degrees
latitudeDegreeslongitude Date
Count ofseals
onshore
Count ofseals inwater
Northern CA Smith River 41.934 124.200 30-Jun-02 52Northern CA Vicinity of Castle Rock, Crescent City 41.765 124.245 30-Jun-02 143 1Northern CA Vicinity of Castle Rock, Crescent City 41.765 124.243 30-Jun-02 74 1Northern CA Vicinity of Castle Rock, Crescent City 41.763 124.244 30-Jun-02 260 2Northern CA Vicinity of Castle Rock, Crescent City 41.762 124.245 30-Jun-02 61 1Northern CA Pelican Rock, Crescent City 41.744 124.186 30-Jun-02 2 1Northern CA Floating marina, Crescent City 41.744 124.185 30-Jun-02 45 1Northern CA 3.8 km N of Midway Point 41.691 124.144 30-Jun-02 54Northern CA 1.8 km NNE of Midway Point 41.673 124.142 30-Jun-02 120 8Northern CA 2.0 km SSE of Midway Point 41.642 124.124 30-Jun-02 53 3Northern CA 2.7 km NW of Klamath River 41.566 124.100 30-Jun-02 11Northern CA Flint Rock Head 41.524 124.086 30-Jun-02 4Northern CA 1.1 km NNE of Split Rock 41.503 124.079 30-Jun-02 4Northern CA 1.4 km S of Split Rock 41.482 124.071 30-Jun-02 1Northern CA 0.6 km N of Mussel Point 41.328 124.086 30-Jun-02 4Northern CA 1.2 km SSW of Mussel Point 41.313 124.092 30-Jun-02 13Northern CA 0.5 km N of Redwood Creek 41.297 124.093 30-Jun-02 11Northern CA 0.3 km S of Rocky Point 41.136 124.163 30-Jun-02 22Northern CA Palmers Point 41.129 124.165 30-Jun-02 138Northern CA 0.6 km SSE of Palmers Point 41.125 124.162 30-Jun-02 10Northern CA 0.7 km SSE of Palmers Point 41.124 124.162 30-Jun-02 63Northern CA 0.2 km S of Scotty Point 41.099 124.164 30-Jun-02 2

22
Table 6. (Continued)
Mainlandsection Location of haulout site Degrees
latitudeDegreeslongitude Date
Count ofseals
onshore
Count ofseals inwater
Northern CA 1.1 km SSE of Scotty Point 41.091 124.158 30-Jun-02 4Northern CA 1.7 km SSE of Scotty Point 41.087 124.156 30-Jun-02 38Northern CA 0.4 km N of Elk Head 41.071 124.159 30-Jun-02 68Northern CA 0.8 km NE of Trinidad Head, 41.059 124.158 30-Jun-02 20Northern CA 0.8 km E of Trinidad Head, Trinidad Bay 41.056 124.142 30-Jun-02 18Northern CA 0.6 km E of Trinidad Head, Trinidad Bay 41.055 124.144 30-Jun-02 34Northern CA 1.2 km E of Trinidad Head, Trinidad Bay 41.054 124.136 30-Jun-02 20Northern CA 1.8 km ESE of Trinidad Head, Trinidad
Bay41.051 124.130 30-Jun-02 48 1
Northern CA Arcata Bay, Humboldt Bay 40.839 124.160 30-Jun-02 136Northern CA Arcata Bay, Humboldt Bay 40.838 124.112 30-Jun-02 126Northern CA Arcata Bay, Humboldt Bay 40.813 124.146 30-Jun-02 31Northern CA South Bay, Humboldt Bay 40.703 124.225 30-Jun-02 116Northern CA South Bay, Humboldt Bay 40.703 124.236 30-Jun-02 142Northern CA South Bay, Humboldt Bay 40.702 124.255 30-Jun-02 40Northern CA South Bay, Humboldt Bay 40.701 124.227 30-Jun-02 238Northern CA South Bay, Humboldt Bay 40.700 124.236 30-Jun-02 21Northern CA South Bay, Humboldt Bay 40.700 124.234 30-Jun-02 21Northern CA South Bay, Humboldt Bay 40.700 124.238 30-Jun-02 29Northern CA South Bay, Humboldt Bay 40.699 124.236 30-Jun-02 242Northern CA South Bay, Humboldt Bay 40.699 124.235 30-Jun-02 98Northern CA South Bay, Humboldt Bay 40.698 124.239 30-Jun-02 225Northern CA Mouth of Eel River 40.644 124.309 30-Jun-02 17 7Northern CA 0.6 km S of False Cape 40.505 124.388 30-Jun-02 29

23
Table 6. (Continued)
Mainlandsection Location of haulout site Degrees
latitudeDegreeslongitude Date
Count ofseals
onshore
Count ofseals inwater
Northern CA 0.8 km S of False Cape 40.503 124.388 30-Jun-02 42Northern CA 0.9 km N of Cape Mendocino 40.447 124.407 30-Jun-02 20Northern CA Hair Seal Rock 40.326 124.354 30-Jun-02 141 1Northern CA 0.6 km S of Hair Seal Rock 40.321 124.352 30-Jun-02 1Northern CA 1.1 km N of Punta Gorda 40.271 124.365 30-Jun-02 62 3Northern CA Vicinity of Punta Gorda Lighthouse 40.249 124.353 30-Jun-02 107 2Northern CA 11.6 km NNE of Point Delgada, Shelter
Cove40.113 124.134 30-Jun-02 34
Northern CA Point Delgada, Shelter Cove 40.020 124.068 30-Jun-02 38Northern CA Vicinity of Double Rock 39.942 123.968 30-Jun-02 13 2Northern CA High Tip 39.922 123.955 30-Jun-02 10Northern CA 0.8 km NNW of Mistake Point, Anderson
Cliff39.866 123.909 30-Jun-02 314
Northern CA 0.8 km SE of Mistake Point 39.855 123.897 30-Jun-02 9 5Northern CA 0.3 km N of Soldier Frank Point 39.760 123.839 30-Jun-02 23Northern CA Rockport Bay 39.737 123.833 30-Jun-02 66 1Northern CA 2.7 km N of Abalone Point 39.691 123.797 30-Jun-02 65Northern CA Abalone Point 39.666 123.794 30-Jun-02 6Northern CA 0.4 km N of Bell Point 39.630 123.786 30-Jun-02 39Northern CA 0.4 km SSE of Bruhel Point 39.605 123.789 30-Jun-02 132Northern CA Vicinity of Newport 39.582 123.778 30-Jun-02 36 3Northern CA Vicinity of Newport 39.580 123.778 30-Jun-02 17Northern CA 1.1 km NE of Laguna Point 39.495 123.795 30-Jun-02 136Northern CA Laguna Point 39.490 123.804 30-Jun-02 49

24
Table 6. (Continued)
Mainlandsection Location of haulout site Degrees
latitudeDegreeslongitude Date
Count ofseals
onshore
Count ofseals inwater
Northern CA Laguna Point 39.490 123.806 30-Jun-02 23Northern CA Laguna Point 39.489 123.805 30-Jun-02 13 2Northern CA 1.0 km NNE of Soldier Point, Fort Bragg 39.448 123.817 30-Jun-02 1Northern CA 0.9 km NNE of Soldier Point, Fort Bragg 39.447 123.817 30-Jun-02 46Northern CA 0.3 km SSW of Soldier Point, Fort Bragg 39.437 123.821 30-Jun-02 47Northern CA 0.7 km SSE of Soldier Point, Fort Bragg 39.433 123.818 30-Jun-02 24Northern CA 1.7 km NNE of Caspar Point 39.383 123.821 30-Jun-02 35Northern CA 0.8 km S of Caspar Point, vicinity of
Caspar Anchorage39.361 123.826 29-Jun-02 5
Northern CA 0.3 km SSE of Point Cabrillo 39.346 123.826 29-Jun-02 48Northern CA Goat Island 39.307 123.813 29-Jun-02 65 1Northern CA Goat Island 39.306 123.813 29-Jun-02 13Northern CA 2.0 km SSE of Goat Island, vicinity of
Mendocino Bay39.289 123.804 29-Jun-02 155 2
Northern CA Buckhorn Cove 39.258 123.785 29-Jun-02 3Northern CA Stillwell Point 39.255 123.786 29-Jun-02 31Northern CA 0.8 km SSE of Stillwell Point 39.247 123.783 29-Jun-02 14 1Northern CA 1.3 km N of Albion Head 39.243 123.781 29-Jun-02 14Northern CA 0.8 km S of Salmon Point 39.207 123.774 29-Jun-02 34Northern CA Navarro Point 39.194 123.771 29-Jun-02 24Northern CA 0.3 km SSE of Saddle Point 39.174 123.752 29-Jun-02 4Northern CA Devils Basin 39.170 123.748 29-Jun-02 58Northern CA 2.2 km N of Cuffeys Point 39.161 123.739 29-Jun-02 28 1Northern CA 2.2 km N of Cuffeys Point 39.161 123.738 29-Jun-02 21

25
Table 6. (Continued)
Mainlandsection Location of haulout site Degrees
latitudeDegreeslongitude Date
Count ofseals
onshore
Count ofseals inwater
Northern CA Cuffeys Point 39.143 123.740 29-Jun-02 56Northern CA 4.0 km SSE of Cuffeys Point 39.109 123.715 29-Jun-02 10 1Northern CA 5.3 km SSE of Cuffeys Point 39.098 123.711 29-Jun-02 51Northern CA 11.3 km NNE of Point Arena 39.050 123.692 29-Jun-02 11 2Northern CA 10.4 km NNE of Point Arena 39.042 123.694 29-Jun-02 3Northern CA 10.4 km NNE of Point Arena 39.042 123.695 29-Jun-02 24Northern CA 9.9 km NNE of Point Arena, Mouth of
Mallo Pass Creek39.035 123.692 29-Jun-02 95 6
Northern CA Point Arena 38.957 123.743 29-Jun-02 77 3Northern CA 1.5 km SSE of Point Arena 38.943 123.733 29-Jun-02 107 1Northern CA 1.8 km SSE of Point Arena 38.941 123.732 29-Jun-02 20 1Northern CA 1.4 km SE of Iverson Point, Morrison
Gulch38.839 123.634 29-Jun-02 95
Northern CA 0.6 km ESE of Steens Landing 38.826 123.612 29-Jun-02 7Northern CA 1.7 km N of Havens Neck 38.823 123.607 29-Jun-02 23 1Northern CA 1.4 km N of Havens Neck 38.821 123.605 29-Jun-02 33Northern CA 1.4 km NNE of Havens Neck 38.820 123.607 29-Jun-02 28Northern CA Havens Neck 38.807 123.602 29-Jun-02 9Northern CA Havens Anchorage 38.802 123.590 29-Jun-02 7Northern CA Fish Rocks 38.800 123.591 29-Jun-02 5Northern CA 1.8 km NW of Robinson Point 38.783 123.556 29-Jun-02 5Northern CA 1.6 km NW of Robinson Point 38.782 123.552 29-Jun-02 5Northern CA Bourns Rock 38.779 123.557 29-Jun-02 41Northern CA Robinson Point 38.771 123.540 29-Jun-02 7

26
Table 6. (Continued)
Mainlandsection Location of haulout site Degrees
latitudeDegreeslongitude Date
Count ofseals
onshore
Count ofseals inwater
Northern CA 1.6 km SE of Gualala Point 38.742 123.515 29-Jun-02 29Northern CA 4.7 km SE of Gualala Point 38.727 123.485 29-Jun-02 257 2Northern CA 4.7 km SE of Gualala Point 38.727 123.484 29-Jun-02 5Northern CA 4.7 km SE of Gualala Point 38.727 123.482 29-Jun-02 3Northern CA 5.3 km SE of Gualala Point 38.723 123.479 29-Jun-02 37Northern CA 5.9 km NNE of Black Point 38.721 123.472 29-Jun-02 21Northern CA 4.8 km NNE of Black Point 38.715 123.462 29-Jun-02 62Northern CA 3.4 km NNE of Black Point 38.705 123.451 29-Jun-02 59 2Northern CA 2.5 km NNE of Black Point 38.699 123.443 29-Jun-02 2Northern CA 0.5 km NNE of Black Point 38.682 123.435 29-Jun-02 9Northern CA 0.5 km ESE of Black Point 38.677 123.427 29-Jun-02 39 1Northern CA 1.1 km ESE of Black Point 38.674 123.421 29-Jun-02 17Northern CA Stewarts Point 38.654 123.409 29-Jun-02 134Northern CA 0.7 km SE of Stewarts Point 38.651 123.403 29-Jun-02 51Northern CA Sandy Point 38.644 123.400 29-Jun-02 46Northern CA Sandy Point 38.644 123.400 29-Jun-02 1Northern CA 0.5 km N of Rocky Point 38.635 123.390 29-Jun-02 10Northern CA 0.3 km ESE of Rocky Point 38.628 123.389 29-Jun-02 74 1Northern CA 0.4 km SE of Rocky Point 38.628 123.387 29-Jun-02 13Northern CA Horseshoe Cove 38.613 123.368 29-Jun-02 4Northern CA 3.2 km SE of Horseshoe Point 38.589 123.344 29-Jun-02 6Northern CA 3.3 km SE of Horseshoe Point 38.587 123.344 29-Jun-02 42Northern CA Salt Point 38.565 123.333 29-Jun-02 39 1Northern CA 1.1 km SE of Salt Point 38.560 123.323 29-Jun-02 78 1

27
Table 6. (Continued)
Mainlandsection Location of haulout site Degrees
latitudeDegreeslongitude Date
Count ofseals
onshore
Count ofseals inwater
Northern CA 1.5 km SE of Salt Point 38.559 123.318 29-Jun-02 4Northern CA 1.7 km NW of Windermere Point 38.536 123.283 29-Jun-02 20Northern CA 1.6 km NW of Windermere Point 38.536 123.281 29-Jun-02 24 1Northern CA 1.0 km NW of Windermere Point, Timber
Cove38.531 123.278 29-Jun-02 20
Northern CA Vicinity of Northwest Cape 38.517 123.259 28-Jun-02 5Northern CA Clam Beach, Vicinity of Northwest Cape 38.516 123.255 28-Jun-02 11Northern CA Fort Ross Cove 38.513 123.246 28-Jun-02 19Northern CA Fort Ross Cove 38.512 123.248 28-Jun-02 51 2Northern CA Northwest Cape 38.512 123.254 28-Jun-02 41Northern CA Vicinity of Fort Ross Reef 38.504 123.233 28-Jun-02 34Northern CA 3.6 km ESE of Northwest Cape 38.496 123.213 28-Jun-02 1Northern CA 3.6 km ESE of Northwest Cape 38.496 123.212 28-Jun-02 4Northern CA 5.4 km WNW of Mouth of Russian River 38.480 123.178 28-Jun-02 46 1Northern CA Mouth of Russian River 38.451 123.130 28-Jun-02 45 18Northern CA Rock off Wrights Beach, 1.3 km NNE of
Duncans Point38.403 123.101 28-Jun-02 16
Northern CA Gleason Beach, 0.8 km ESE of DuncansPoint
38.391 123.087 28-Jun-02 32
Northern CA Vicinity of Horshoe Cove, Bodega Head 38.319 123.075 28-Jun-02 18Northern CA Vicinity of Horshoe Cove, Bodega Head 38.317 123.073 28-Jun-02 67Northern CA Bodega Rock 38.296 123.048 28-Jun-02 64Northern CA Tomales Point 38.236 122.994 28-Jun-02 14Northern CA Bird Rock, Tomales Point 38.230 122.994 28-Jun-02 408 15

28
Table 6. (Continued)
Mainlandsection Location of haulout site Degrees
latitudeDegreeslongitude Date
Count ofseals
onshore
Count ofseals inwater
Northern CA Tomales Point 38.228 122.988 28-Jun-02 60 1Northern CA Tomales Point 38.227 122.988 28-Jun-02 4Northern CA Tomales Point 38.226 122.987 28-Jun-02 17Northern CA Tomales Point 38.226 122.986 28-Jun-02 70 1Northern CA Tomales Point 38.225 122.986 28-Jun-02 2Northern CA Tomales Point 38.225 122.985 28-Jun-02 2Northern CA Tomales Point 38.223 122.983 28-Jun-02 13Northern CA 0.9 km WNW of Toms Point, Tomales
Bay38.218 122.962 28-Jun-02 472
Northern CA Tomales Point 38.207 122.973 28-Jun-02 103 2Central CA Fisherman Bay, SE Farallon Island 37.701 123.003 01-Jul-02 6Central CA Maintop Bay, SE Farallon Island 37.700 123.006 01-Jul-02 30Central CA Mussel Flat, Mirounga Bay, SE Farallon
Island37.696 123.003 01-Jul-02 105
Central CA Point Reyes 37.994 122.994 17-Jun-02 18Central CA Point Reyes 37.994 122.996 17-Jun-02 137Central CA Point Reyes 37.994 123.001 17-Jun-02 24Central CA Point Reyes 37.994 123.000 17-Jun-02 7Central CA Point Reyes 37.993 122.995 17-Jun-02 30Central CA Point Reyes 37.993 122.994 17-Jun-02 70Central CA Point Reyes 37.993 122.984 17-Jun-02 6Central CA Drake's Estero 38.038 122.937 17-Jun-02 588 1Central CA Drake's Estero 38.034 122.933 17-Jun-02 267Central CA Drake's Estero 38.033 122.927 17-Jun-02 114

29
Table 6. (Continued)
Mainlandsection Location of haulout site Degrees
latitudeDegreeslongitude Date
Count ofseals
onshore
Count ofseals inwater
Central CA Double Point 37.945 122.776 17-Jun-02 835Central CA Double Point 37.945 122.777 17-Jun-02 50Central CA Bolinas Lagoon 37.916 122.667 17-Jun-02 92Central CA Bolinas Lagoon 37.914 122.666 17-Jun-02 59Central CA Bolinas Lagoon (Kent Isl.) 37.911 122.675 17-Jun-02 197 1Central CA Duxbury Point 37.889 122.699 17-Jun-02 60Central CA 2.9 km NW Point Bonita 37.845 122.560 17-Jun-02 6Central CA 0.9 km NNE Point Bonita 37.823 122.524 17-Jun-02 3Central CA 0.5 km N Point Bonita 37.820 122.528 17-Jun-02 14Central CA 0.4 km N Point Bonita 37.819 122.528 17-Jun-02 33Central CA 0.31 km NNW Point Bonita 37.818 122.529 17-Jun-02 25Central CA 1.5 km S Point Montara Light 37.524 122.519 17-Jun-02 11Central CA Garnet Point, Ryer Island 38.095 122.039 17-Jun-02 31Central CA Castro Rocks 37.933 122.418 17-Jun-02 120Central CA Marina at north end of Sausalito 37.873 122.499 17-Jun-02 41Central CA Yerba Buena Island 37.807 122.363 18-Jun-02 90Central CA Newark Slough 37.506 122.086 17-Jun-02 22Central CA Mowry Slough 37.493 122.046 17-Jun-02 13Central CA Mowry Slough 37.493 122.044 17-Jun-02 70Central CA Mowry Slough 37.493 122.044 17-Jun-02 85Central CA Mowry Slough 37.488 122.034 17-Jun-02 13Central CA Coyote Creek 37.464 122.030 17-Jun-02 36Central CA Coyote Creek 37.464 122.034 17-Jun-02 37Central CA Reefs 1.2 km W of Half Moon Bay airport 37.519 122.516 17-Jun-02 2

30
Table 6. (Continued)
Mainlandsection Location of haulout site Degrees
latitudeDegreeslongitude Date
Count ofseals
onshore
Count ofseals inwater
Central CA Reefs 1.2 km W of Half Moon Bay airport 37.518 122.516 17-Jun-02 67Central CA Reefs 1.2 km W of Half Moon Bay airport 37.516 122.515 17-Jun-02 53Central CA Reefs 1.2 km W of Half Moon Bay airport 37.516 122.514 17-Jun-02 11Central CA Reefs 1.2 km W of Half Moon Bay airport 37.511 122.512 17-Jun-02 7Central CA Reefs 1-1.5 km NW Pillar Point 37.505 122.506 17-Jun-02 50Central CA Reefs 1-1.5 km NW Pillar Point 37.504 122.503 17-Jun-02 1Central CA Reefs 1-1.5 km NW Pillar Point 37.503 122.502 17-Jun-02 10Central CA Sail Rock. - Pillar Point 37.494 122.500 17-Jun-02 17Central CA 2.0 km SSE Miramontes Point 37.417 122.435 17-Jun-02 138Central CA 2.2 km SSE Miramontes Point 37.415 122.434 17-Jun-02 1Central CA 3.8 km SSE Miramontes Point 37.402 122.426 17-Jun-02 51 1Central CA Martins Beach 37.376 122.412 17-Jun-02 27Central CA 0.3 km SW Pescadero Creek mouth 37.266 122.414 17-Jun-02 54Central CA Bean Hollow State Beach 37.234 122.417 17-Jun-02 40Central CA Bean Hollow State Beach 37.233 122.416 17-Jun-02 24Central CA Bean Hollow State Beach 37.231 122.415 17-Jun-02 90Central CA Bean Hollow State Beach 37.230 122.414 17-Jun-02 9Central CA 1.6 km NNW Bolsa Point 37.211 122.409 17-Jun-02 19Central CA 1.6 km NNW Bolsa Point 37.210 122.408 17-Jun-02 68 3Central CA Bolsa Point 37.195 122.405 17-Jun-02 7Central CA Point Año Nuevo 37.120 122.339 17-Jun-02 12Central CA Point Año Nuevo 37.117 122.338 17-Jun-02 10Central CA Point Año Nuevo 37.116 122.337 17-Jun-02 9Central CA Point Año Nuevo 37.111 122.330 17-Jun-02 12 2

31
Table 6. (Continued)
Mainlandsection Location of haulout site Degrees
latitudeDegreeslongitude Date
Count ofseals
onshore
Count ofseals inwater
Central CA Año Nuevo Island 37.110 122.339 17-Jun-02 10Central CA Año Nuevo Island 37.110 122.338 17-Jun-02 62Central CA Año Nuevo Island 37.107 122.336 17-Jun-02 7Central CA Año Nuevo Island 37.106 122.337 17-Jun-02 5Central CA 0.81 km NW Greyhound Rock 37.084 122.273 17-Jun-02 8Central CA 5.7 km NW El Jarro Point 37.068 122.259 17-Jun-02 31Central CA 5.3 km NW El Jarro Point 37.066 122.257 17-Jun-02 61Central CA 4.6 km NW El Jarro Point 37.060 122.253 17-Jun-02 1Central CA 4.4 km NW El Jarro Point 37.058 122.252 17-Jun-02 146Central CA 4.2 km NW El Jarro Point 37.057 122.250 17-Jun-02 53 1Central CA 0.4 km NW Davenport Pier 37.013 122.204 17-Jun-02 22Central CA Vicinity Table Rock 36.968 122.133 17-Jun-02 332Central CA Elkhorn Slough 36.816 121.746 17-Jun-02 116Central CA Elkhorn Slough 36.815 121.746 17-Jun-02 10Central CA Elkhorn Slough 36.814 121.761 17-Jun-02 95Central CA Elkhorn Slough 36.811 121.770 17-Jun-02 82Central CA Point Cabrillo 36.622 121.904 17-Jun-02 131Central CA Point Alone 36.619 121.901 17-Jun-02 29Central CA Cannery Row 36.617 121.900 17-Jun-02 32Central CA Cannery Row 36.616 121.899 17-Jun-02 1Central CA Cannery Row 36.616 121.898 17-Jun-02 18Central CA Seal Rock 36.588 121.966 16-Jun-02 111Central CA Cypress Point 36.581 121.979 16-Jun-02 96Central CA 0.4 km NNE Pescadero Point 36.564 121.951 16-Jun-02 86

32
Table 6. (Continued)
Mainlandsection Location of haulout site Degrees
latitudeDegreeslongitude Date
Count ofseals
onshore
Count ofseals inwater
Central CA Pescadero Rocks 36.562 121.945 16-Jun-02 55Central CA 0.2 km E Arrowhead Point 36.561 121.938 16-Jun-02 42Central CA Point Lobos State Preserve 36.522 121.945 16-Jun-02 37Central CA Point Lobos State Preserve 36.522 121.944 16-Jun-02 7Central CA Point Lobos State Preserve 36.516 121.950 16-Jun-02 11Central CA 5.9 km SSE Yankee Point 36.442 121.924 16-Jun-02 37Central CA 1.7 km ESE Point Sur Light 36.300 121.885 16-Jun-02 12Central CA 1.7 km ESE Point Sur Light 36.300 121.886 16-Jun-02 84Central CA 2.6 km SE Point Sur Light 36.292 121.880 16-Jun-02 14Central CA 3.2 km SE Point Sur Light 36.287 121.877 16-Jun-02 25Central CA 7.0 km SE Point Sur Light 36.265 121.844 16-Jun-02 63Central CA 4.0 km ESE Pfeiffer Point 36.224 121.773 16-Jun-02 17Central CA 4.0 km ESE Pfeiffer Point 36.224 121.773 16-Jun-02 10Central CA Vicinity of Lafler Rock 36.200 121.728 16-Jun-02 7Central CA Vicinity of Lafler Rock 36.199 121.726 16-Jun-02 6Central CA Vicinity of Lafler Rock 36.198 121.723 16-Jun-02 5Central CA 0.5 km WNW Anderson Landing 36.148 121.663 16-Jun-02 19 1Central CA 1.4 km NNW Dolan Rock 36.098 121.622 16-Jun-02 22Central CA Square Black Rock 36.075 121.607 16-Jun-02 134Central CA 8.3 km NNW Cape San Martin 35.962 121.486 16-Jun-02 27Central CA 7.7 km NNW Cape San Martin 35.957 121.485 16-Jun-02 3Central CA 4.5 km NNW Cape San Martin 35.929 121.474 16-Jun-02 26Central CA 1.3 km SE Cape San Martin 35.881 121.455 16-Jun-02 10Central CA 1.6 km SE Cape San Martin 35.880 121.453 16-Jun-02 16

33
Table 6. (Continued)
Mainlandsection Location of haulout site Degrees
latitudeDegreeslongitude Date
Count ofseals
onshore
Count ofseals inwater
Central CA 4.6 km SE Cape San Martin 35.861 121.428 16-Jun-02 9Central CA 10.4 km NW Ragged Point 35.834 121.398 16-Jun-02 14Central CA 2.6 km SSE Ragged Point 35.738 121.318 16-Jun-02 38Central CA 2.7 km SSE Ragged Point 35.737 121.319 16-Jun-02 175Central CA La Cruz Rock 35.708 121.312 16-Jun-02 25Central CA Piedras Blancas 35.664 121.287 16-Jun-02 19Central CA Piedras Blancas 35.664 121.288 16-Jun-02 21Central CA 2.8 km ESE Piedras Blancas Light 35.659 121.255 16-Jun-02 32Central CA 3.6 km ESE Piedras Blancas Light 35.654 121.247 16-Jun-02 48Central CA 3.7 km ESE Piedras Blancas Light 35.653 121.246 16-Jun-02 23Central CA 1.2 km WNW San Simeon Point 35.640 121.206 16-Jun-02 54Central CA 1.5 km ENE San Simeon Point 35.640 121.179 16-Jun-02 35Central CA 3.2 km ESE San Simeon Point 35.627 121.160 16-Jun-02 1Central CA 1.6 km NW San Simeon Creek/River 35.604 121.141 16-Jun-02 62Central CA 1.4 km NW San Simeon Creek/River 35.603 121.139 16-Jun-02 73Central CA San Simeon State Beach 35.576 121.117 16-Jun-02 26Central CA 10.3 km NW Point Estero 35.529 121.080 16-Jun-02 21Central CA 8.2 km NW Point Estero 35.514 121.065 16-Jun-02 48Central CA 3.7 km NW Point Estero 35.486 121.029 16-Jun-02 54Central CA 2.2 km NW Point Estero 35.476 121.019 16-Jun-02 56Central CA 1.6 km NW Point Estero 35.472 121.015 16-Jun-02 29Central CA 4.6 km WNW Cayucos Point 35.460 120.986 16-Jun-02 36Central CA 2.1 km WNW Cayucos Point 35.453 120.960 16-Jun-02 38Central CA 1.4 km E Cayucos Point 35.447 120.923 16-Jun-02 18

34
Table 6. (Continued)
Mainlandsection Location of haulout site Degrees
latitudeDegreeslongitude Date
Count ofseals
onshore
Count ofseals inwater
Central CA 1.2 km W Cayucos Point 35.447 120.951 16-Jun-02 11Central CA Cayucos Point 35.446 120.938 16-Jun-02 41Central CA Morro Bay 35.340 120.848 16-Jun-02 50Central CA 9.5 km WNW Point San Luis 35.203 120.846 16-Jun-02 33Central CA 8.5 km WNW Point San Luis 35.198 120.837 16-Jun-02 98Central CA 7.6 km WNW Point San Luis 35.196 120.828 16-Jun-02 32Central CA 6.7 km WNW Point San Luis 35.191 120.820 16-Jun-02 19Central CA 6.7 km WNW Point San Luis 35.191 120.819 16-Jun-02 114Central CA 5.3 km WNW Point San Luis 35.185 120.807 16-Jun-02 23 1
Southern CA 0.3 km NNE Point Sal 34.906 120.670 16-Jun-02 47 1Southern CA 0.6 km SE Point Sal 34.901 120.667 16-Jun-02 16Southern CA 6.6 km SE Point Sal 34.866 120.617 16-Jun-02 12Southern CA 2.3 km SSE of Purisima Point 34.738 120.627 12-Jun-02 25Southern CA 2.7 km SE Point Arguello 34.560 120.631 16-Jun-02 102Southern CA 2.8 km SE Point Arguello 34.560 120.630 16-Jun-02 213 2Southern CA 3.0 km SE Point Arguello 34.558 120.628 16-Jun-02 17Southern CA 0.32 km ENE Point Conception 34.449 120.469 16-Jun-02 444 2Southern CA 0.9 km ESE Point Conception 34.447 120.462 16-Jun-02 44Southern CA 3.8 km ENE Goleta Point 34.417 119.806 16-Jun-02 31Southern CA Point Mugu Lagoon 34.102 119.098 16-Jun-02 24Southern CA Point Mugu Lagoon 34.102 119.096 16-Jun-02 258 5Southern CA Point Mugu Lagoon 34.102 119.094 16-Jun-02 5Southern CA La Jolla Children’s Pool -outside reef 32.848 117.279 25-May-02 8Southern CA La Jolla Children’s Pool -beach 32.848 117.279 25-May-02 83

35
Table 6. (Continued)
Mainlandsection Location of haulout site Degrees
latitudeDegreeslongitude Date
Count ofseals
onshore
Count ofseals inwater
Southern CA La Jolla Children’s Pool -inside reef 32.848 117.277 25-May-02 64 1

36
Table 7. Summary statistics for the number of harbor seals (Phoca vitulina) counted onshore athaulout sites for sections of California, and California statewide from surveys conducted during23 May-1 July 2002.
Section
Mean #of seals
perhaulout
Median #of seals
perhaulout
Minimum # of
seals perhaulout
Maximum# of seals
perhaulout
Sum ofseals
from allhaulouts
Total #of
haulouts
Northern California 51.02 29.00 1 472 8,418 165
Central California 54.54 30.00 1 835 7,744 142
Southern California,mainland
87.06 37.50 5 444 1,393 16
Southern California,Channel Islands
26.93 19.00 1 154 3,878 144
Southern California total
32.94 20.50 1 444 5,271 160
California mainland total
54.35 30.00 1 835 17,555 323
California total 45.90 25.00 1 835 21,433 467

37
Table 8. Summary statistics for the number of harbor seals (Phoca vitulina) counted onshore athaulout sites by 0.5 degree latitude increments for mainland coastal sites (see footnotes), SanFrancisco Bay estuary, and each of the Channel Islands in southern California from surveysconducted during 23 May-1 July 2002.
Latitude range,estuary, or island
Mean #of seals
perhaulout
Median #of seals
perhaulout
Minimum # of
seals perhaulout
Maximum# of seals
perhaulout
Sum ofseals
from allhaulouts
Total #of
haulouts
41.50° to 42.00° 67.92 53.00 2 260 883 1341.00° to 41.49 30.24 20.00 1 138 514 1740.50° to 40.99° 97.06 70.00 17 242 1,553 1640.00° to 40.49° 57.57 38.00 1 141 403 739.50° to 39.99° 60.83 29.50 6 314 730 1239.00° to 39.49° 36.81 24.00 1 155 1,141 3138.50° to 38.99° 35.43 21.00 1 257 1,736 4938.00° to 38.49° 72.90 25.00 1 472 1,458 2037.50° to 37.99° 1, 2 88.38 30.00 1 835 3,005 34San Francisco Bayestuary 2
50.73 37.00 13 120 558 11
37.00° to 37.49° 2 36.19 22.00 1 146 977 2736.50° to 36.99° 71.72 48.50 1 332 1,291 1836.00° to 36.49° 32.50 18.00 5 134 455 1435.50° to 35.99° 35.04 26.00 1 175 806 2335.00° to 35.49° 43.47 36.00 11 114 652 1534.50° to 34.99° 61.71 25.00 12 213 432 734.00° to 34.49° 134.33 37.50 5 444 806 633.50° to 33.99° 0 0 0 0 0 033.00° to 33.49° 0 0 0 0 0 032.50° to 32.99° 51.67 64.00 8 83 175 3Anacapa Island 14.44 10.50 1 41 231 16Santa Cruz Island 27.76 15.50 1 128 1,055 38Santa Rosa Island 35.04 21.50 1 134 911 26San Miguel Island 25.21 24.00 1 124 731 29San Nicolas Island 34.35 26.00 1 154 584 17Santa Barbara Island 7.50 7.50 7 8 15 2Santa Catalina Island 26.22 19.00 1 103 236 9San Clemente Island 16.43 16.00 1 35 115 7
1 SE Farallon Islands and Drake’s Estero are included in latitude segment 37.50° to 37.99°.2 San Francisco Bay estuary is excluded in latitude segments 37.50° to 37.99° and 37.00° to 37.49°.

38
W125 W123 W121 W119 W117N32
N33
N34
N35
N36
N37
N38
N39
N40
N41
N42
N43
Farallon Islands
La Jolla toPoint Loma
Seal Beach
Palos VerdesPeninsula
Pacific Palisades
California-OregonBorder
PointReyes
Point Mugu
Port San Luis
Humboldt Bay
San Francisco Bay
Point Conception
Pismo Beach
Monterey
Fort Ross Point
Jughandle State Reserve
Channel Islands
Figure 1. California coastline and Channel Islands surveyed for harbor seals (Phoca vitulina)in California during 22 May-1 July 2002. Bold line shows survey coverage along the mainlandcoastline and in San Francisco Bay; the coastline of all Channel Islands and Southeast FarallonIsland were surveyed. There are no known haulout sites that are within the unsurveyedportions between La Jolla and Pacific Palisades.

39
Figure 2. Coastline of San Francisco Bay estuary surveyed for harbor seals (Phoca vitulina)during 17 June 2002. Within the bay area, seals were surveyed in Richardson Bay, TiburonPeninsula, San Rafael Bay, Point San Pedro, north shoreline of San Pablo Bay, Suisun Bay,Grizzly Bay, Honker Bay, and San Francisco Bay south of the San Mateo Bridge.

40
Figure 3. Predicted tide cycle for dates that harbor seals (Phoca vitulina) were surveyed at theChannel Islands (charts for Santa Rosa Island and San Nicolas Island are shown) and southernCalifornia coastline (chart of La Jolla, California is shown). Bottom row of numbers for eachchart correspond to hour of the day; date and time of high and low tide heights are given at thetop of each chart.

41
Figure 4. Predicted tide cycle for dates that harbor seals (Phoca vitulina) were surveyed incentral California (charts for Mugu Lagoon, Port San Luis, and Monterey are shown). Bottomrow of numbers for each chart correspond to hour of the day; date and time of high and low tideheights are given at the top of each chart.

42
Figure 5. Predicted tide cycle for dates that harbor seals (Phoca vitulina) were surveyed incentral California (charts for Point Reyes and San Francisco are shown). Bottom row ofnumbers for each chart correspond to hour of the day; date and time of high and low tide heightsare given at the top of each chart.

43
Figure 6. Predicted tide cycle for dates that harbor seals (Phoca vitulina) were surveyed innorthern California (charts for Point Reyes, Fort Ross, and Fort Bragg are shown). Bottom rowof numbers for each chart correspond to hour of the day; date and time of high and low tideheights are given at the top of each chart.

44
Figure 7. Predicted tide cycle for dates that harbor seals (Phoca vitulina) were surveyed innorthern California (charts for Humboldt Bay, Crescent City, and Point Reyes are shown). Bottom row of numbers for each chart correspond to hour of the day; date and time of high andlow tide heights are given at the top of each chart.

45
Harbor seals counted in California
0
5,000
10,000
15,000
20,000
25,000
1982
1983
1984
1985
1986
1987
1988
1989
1990
1991
1992
1993
1994
1995
1996
1997
1998
1999
2000
2001
2002
Year
Cou
nt
Mainland Channel Is. Calif. Total
Figure 8. Counts of harbor seals (Phoca vitulina) in California (mainland and Channel Islands)for 1982-2002. Data from 1982-1995 obtained from Hanan (1996) and Fluharty (1999); data for2001 is unpublished data from Bob Read, California Department of Fish and Game; data for2002 is from this report.

46
Harbor seal haulout sites in California
0
100
200
300
400
500
600
700
1982
1983
1984
1985
1986
1987
1988
1989
1990
1991
1992
1993
1994
1995
1996
1997
1998
1999
2000
2001
2002
Year
Num
ber o
f hau
lout
site
s
Mainland Channel Islands Statewide
Figure 9. Number of harbor seal (Phoca vitulina) haulout sites found in California duringannual aerial photographic surveys. Data for 1982-1995 is from Fluharty (1995); data for 2002is from this report.

47
0
10
20
30
40
50
60
1982
1983
1984
1985
1986
1987
1988
1989
1990
1991
1992
1993
1994
1995
1996
1997
1998
1999
2000
2001
2002
Year
Ave
rage
num
ber o
f sea
ls p
er h
auol
ut s
ite
Mainland Channel Islands CA State wide
Average number of harbor seals per haulout site in California
Figure 10. Average number of harbor seals (Phoca vitulina) per haulout site found in Californiaduring annual surveys in the molt season. Data for 1982-1995 obtained from Fluharty (1999);data for 2002 is from this report.