pacific enso update page 1 - national weather service
TRANSCRIPT
Page 1 Pacific ENSO Update
2nd Quarter, 2018
Weather conditions across Micronesia during the 1st Quarter of 2018 were generally wetter than average, with abnormally dry conditions restricted to the Mariana Islands and some of the at-olls of northern Chuuk State (Figures 2 and 3 on page 16). Ex-traordinarily high rainfall occurred on Pohnpei Island during April, with the 57.92 inches of rain at the WSO Pohnpei setting the record for the month of April, and the all time high for any month of the year. The previous record high rainfall for any month at the WSO Pohnpei was the 43.65 inches recorded there during May 2015 (see the Pohnpei LVS for more details). Rain-fall during April 2018 was near average across Pohnpei State. Large month-to-month variability of rainfall is common at loca-tions in the tropical western Pacific, and is related, in part, to a large-scale tropical rainfall pattern known as the Madden–Julian Oscillation (MJO) which causes rainfall to vary sharply from month to month (see Sidebar on MJO below). Dry conditions at Guam and in the CNMI during the 1st Quarter of 2018 exacerbat-ed the wild fire hazard. In late March 2018, large fires scorched over 400 acres of brush land on the east side of Saipan’s Wireless Ridge (see the Saipan LVS).
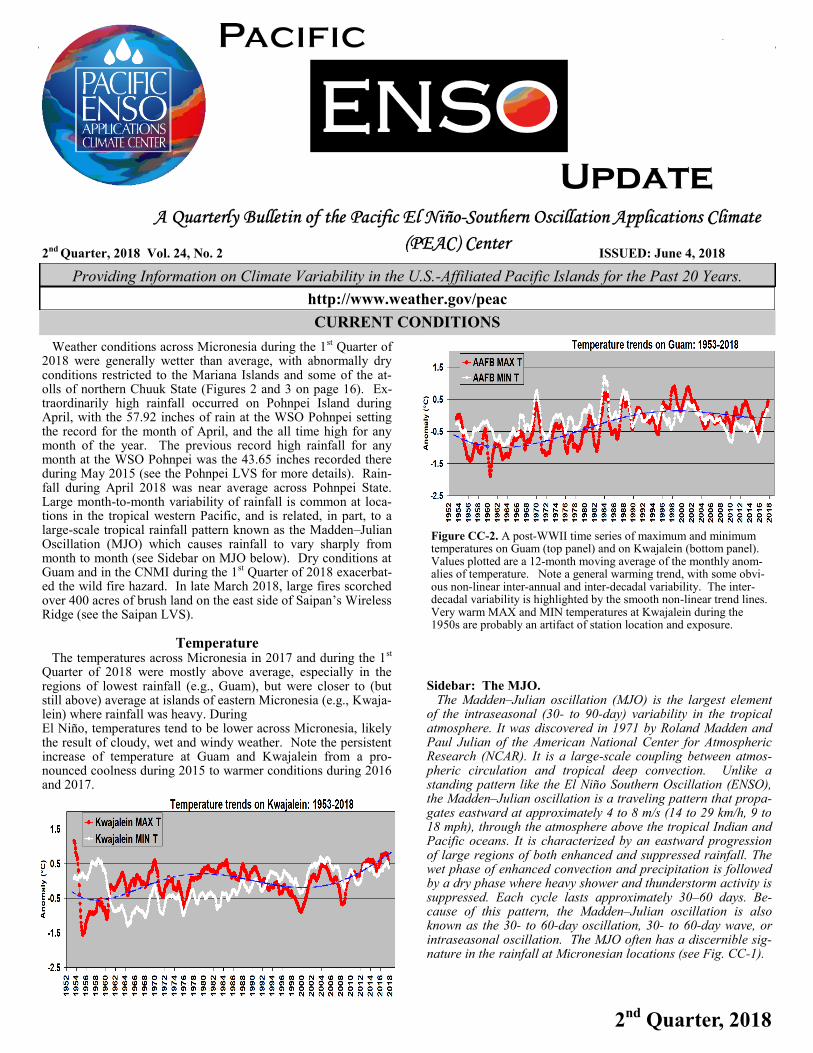
Temperature The temperatures across Micronesia in 2017 and during the 1st Quarter of 2018 were mostly above average, especially in the regions of lowest rainfall (e.g., Guam), but were closer to (but still above) average at islands of eastern Micronesia (e.g., Kwaja-lein) where rainfall was heavy. During El Niño, temperatures tend to be lower across Micronesia, likely the result of cloudy, wet and windy weather. Note the persistent increase of temperature at Guam and Kwajalein from a pro-nounced coolness during 2015 to warmer conditions during 2016 and 2017.
CURRENT CONDITIONS
2nd Quarter, 2018 Vol. 24, No. 2 ISSUED: June 4, 2018
http://www.weather.gov/peac
Providing Information on Climate Variability in the U.S.-Affiliated Pacific Islands for the Past 20 Years.
Sidebar: The MJO. The Madden–Julian oscillation (MJO) is the largest element of the intraseasonal (30- to 90-day) variability in the tropical atmosphere. It was discovered in 1971 by Roland Madden and Paul Julian of the American National Center for Atmospheric Research (NCAR). It is a large-scale coupling between atmos-pheric circulation and tropical deep convection. Unlike a standing pattern like the El Niño Southern Oscillation (ENSO), the Madden–Julian oscillation is a traveling pattern that propa-gates eastward at approximately 4 to 8 m/s (14 to 29 km/h, 9 to 18 mph), through the atmosphere above the tropical Indian and Pacific oceans. It is characterized by an eastward progression of large regions of both enhanced and suppressed rainfall. The wet phase of enhanced convection and precipitation is followed by a dry phase where heavy shower and thunderstorm activity is suppressed. Each cycle lasts approximately 30–60 days. Be-cause of this pattern, the Madden–Julian oscillation is also known as the 30- to 60-day oscillation, 30- to 60-day wave, or intraseasonal oscillation. The MJO often has a discernible sig-nature in the rainfall at Micronesian locations (see Fig. CC-1).
Figure CC-2. A post-WWII time series of maximum and minimum temperatures on Guam (top panel) and on Kwajalein (bottom panel). Values plotted are a 12-month moving average of the monthly anom-alies of temperature. Note a general warming trend, with some obvi-ous non-linear inter-annual and inter-decadal variability. The inter-decadal variability is highlighted by the smooth non-linear trend lines. Very warm MAX and MIN temperatures at Kwajalein during the 1950s are probably an artifact of station location and exposure.
Page 2 Pacific ENSO Update
2nd Quarter, 2018
CURRENT STATE OF ENSO
CURRENT CONDITIONS
Synopsis: ENSO-neutral is favored through September-November 2018, with the possibility of El Niño nearing 50% by Northern Hemisphere winter 2018-19.
ENSO Alert System Status: Final La Niña Advisory
ENSO Evolution
La Niña-like weather patterns persisted through the 4th Quarter of 2017 into the 1st Quarter of 2018, as the climate system con-tinued to be within the SST bounds of La Niña (see Fig. CC-5). During March and April, the Oceanic Niño Index (ONI) warmed to the threshold of ENSO-neutral, and (with the antici-pation of further warming) the CPC’s latest ENSO diagnostic discussion (appended below) provides the final La Niña Adviso-ry. Some weather features more typical of El Niño have recent-ly occurred, including a very wet eastern Micronesia, several early season tropical disturbances in eastern Micronesia and some unusual westerly winds in eastern Micronesia (see the LVS
section for more details).
El Niño Diagnostic Discussion1 CLIMATE PREDICTION CENTER/NCEP/NWS and the International Research Institute for Climate and Society 10 May 2018
“During April 2018, the tropical Pacific returned to ENSO-neutral, as indicated by mostly near-to- below average sea sur-face temperatures (SSTs) along the equator. The latest weekly Niño indices were near zero in all regions (between +0.2°C and -0.3°C), except for Niño-1+2, which remained negative (-0.6°C). Subsurface temperature anomalies (averaged across 180°-100°W) remained positive, due to the continued influence of a downwelling oceanic Kelvin wave. Atmospheric indictors relat-ed to La Niña also continued to fade. While convection re-mained suppressed near and east of the Date Line, rainfall near Indonesia was also below average during the month. Low-level winds were near average over most of the tropical Pacific
Sea Level
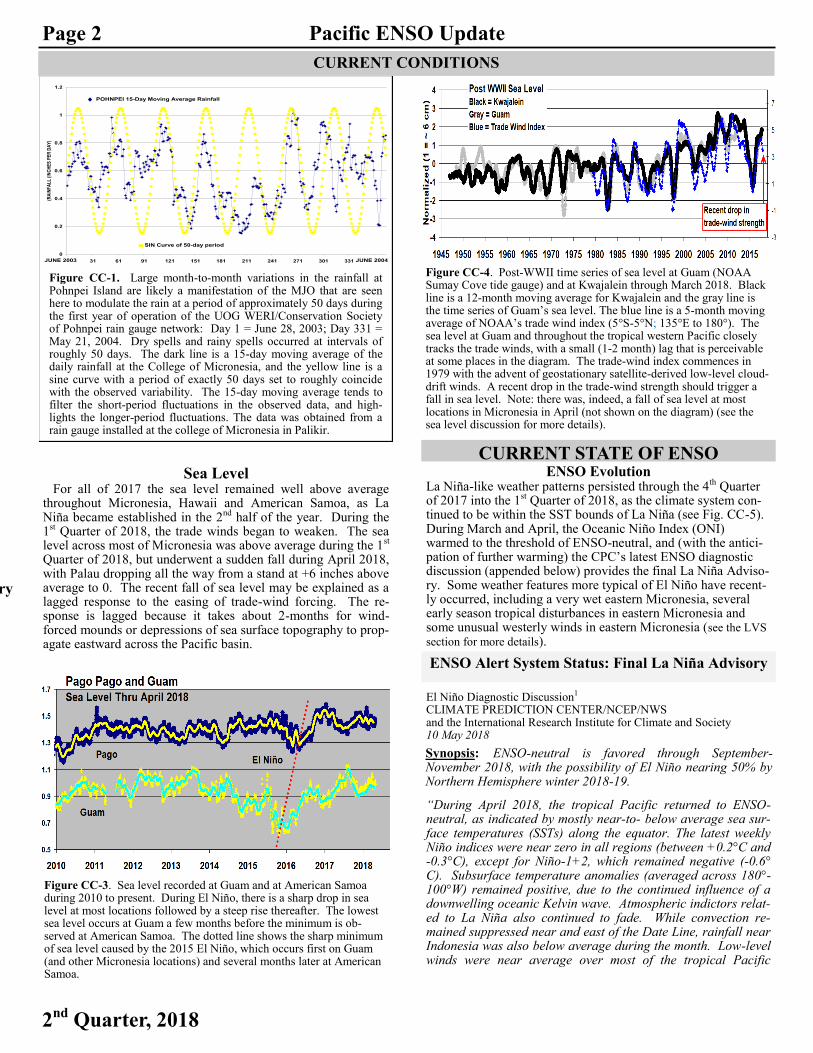
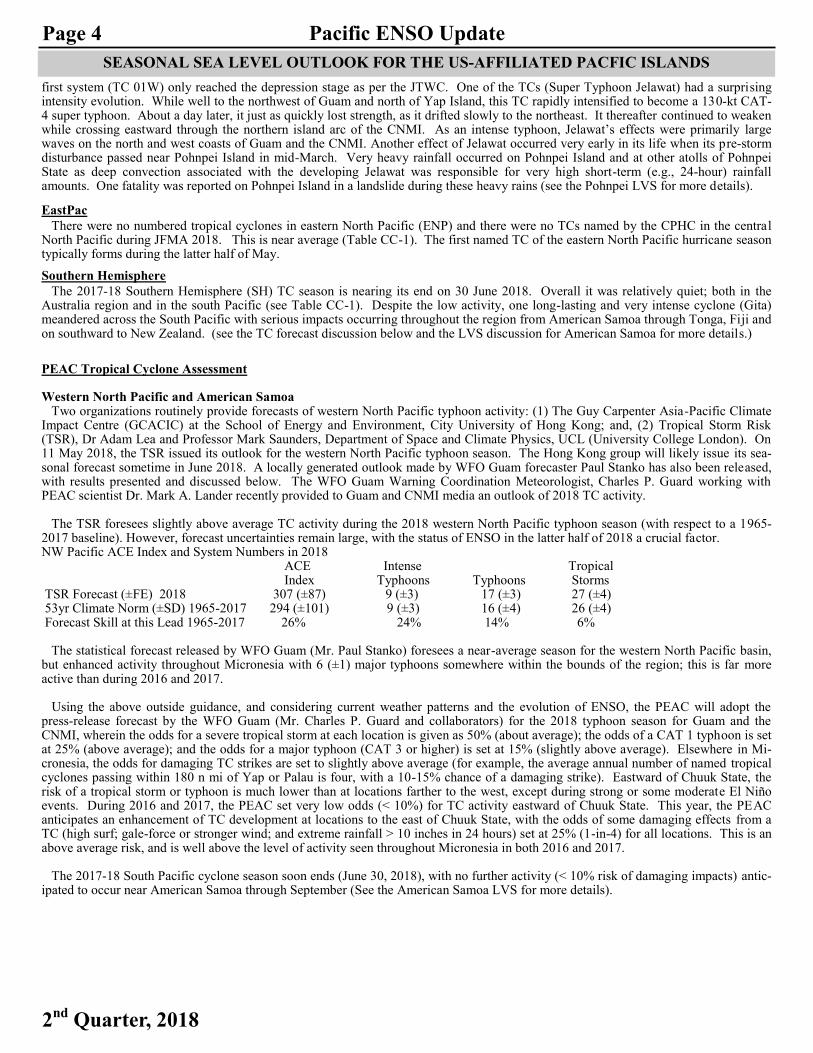
For all of 2017 the sea level remained well above average throughout Micronesia, Hawaii and American Samoa, as La Niña became established in the 2nd half of the year. During the 1st Quarter of 2018, the trade winds began to weaken. The sea level across most of Micronesia was above average during the 1st Quarter of 2018, but underwent a sudden fall during April 2018, with Palau dropping all the way from a stand at +6 inches above average to 0. The recent fall of sea level may be explained as a lagged response to the easing of trade-wind forcing. The re-sponse is lagged because it takes about 2-months for wind-forced mounds or depressions of sea surface topography to prop-agate eastward across the Pacific basin.
Figure 3. A plot of the CPC’s Oceanic Niño Index (ONI) for the past two decades. Note that it made a run toward El Niño early in 2017, but then reversed and entered the La Niña category at mid-year (where it remains at the time of this writing).
Figure CC-1. Large month-to-month variations in the rainfall at Pohnpei Island are likely a manifestation of the MJO that are seen here to modulate the rain at a period of approximately 50 days during the first year of operation of the UOG WERI/Conservation Society of Pohnpei rain gauge network: Day 1 = June 28, 2003; Day 331 = May 21, 2004. Dry spells and rainy spells occurred at intervals of roughly 50 days. The dark line is a 15-day moving average of the daily rainfall at the College of Micronesia, and the yellow line is a sine curve with a period of exactly 50 days set to roughly coincide with the observed variability. The 15-day moving average tends to filter the short-period fluctuations in the observed data, and high-lights the longer-period fluctuations. The data was obtained from a rain gauge installed at the college of Micronesia in Palikir.
0
0.2
0.4
0.6
0.8
1
1.2
1 31 61 91 121 151 181 211 241 271 301 331 361
(RA
INF
AL
L (
INC
HE
S P
ER
DA
Y)
JUNE 2003 JUNE 2004
POHNPEI 15-Day Moving Average Rainfall
SIN Curve of 50-day period
Figure CC-3. Sea level recorded at Guam and at American Samoa during 2010 to present. During El Niño, there is a sharp drop in sea level at most locations followed by a steep rise thereafter. The lowest sea level occurs at Guam a few months before the minimum is ob-served at American Samoa. The dotted line shows the sharp minimum of sea level caused by the 2015 El Niño, which occurs first on Guam (and other Micronesia locations) and several months later at American Samoa.
Figure CC-4. Post-WWII time series of sea level at Guam (NOAA Sumay Cove tide gauge) and at Kwajalein through March 2018. Black line is a 12-month moving average for Kwajalein and the gray line is the time series of Guam’s sea level. The blue line is a 5-month moving average of NOAA’s trade wind index (5°S-5°N; 135°E to 180°). The sea level at Guam and throughout the tropical western Pacific closely tracks the trade winds, with a small (1-2 month) lag that is perceivable at some places in the diagram. The trade-wind index commences in 1979 with the advent of geostationary satellite-derived low-level cloud-drift winds. A recent drop in the trade-wind strength should trigger a fall in sea level. Note: there was, indeed, a fall of sea level at most locations in Micronesia in April (not shown on the diagram) (see the sea level discussion for more details).
ENSO Alert System Status: Final La Niña Advisory
Page 3 Pacific ENSO Update
2nd Quarter, 2018
TROPICAL CYCLONE ACTIVITY
Ocean, and upper-level winds were anomalous westerly over the eastern Pacific. Overall, the ocean and atmosphere system reflected a return to ENSO-neutral.” ““The majority of models in the IRI/CPC plume predict ENSO-neutral to continue at least through the Northern Hemisphere summer 2018. As the fall and winter approaches, many models indicate an increasing chance for El Niño. Therefore, the forecaster consensus hedges in the direction of El Niño as the winter approaches, but given the considerable uncertainty in ENSO forecasts made at this time of year, the probabilities for El Niño are below 50%. In summary, ENSO-neutral is favored through September-November 2018, with the possibility of El Niño nearing 50% by Northern Hemisphere winter 2018-19. ).” (click CPC/IRI consensus forecast for the chance of each outcome for each 3-month period):
http://iri.columbia.edu/our-expertise/climate/forecasts/enso/current/?enso_tab=enso-cpc_plume
PEAC archives western North Pacific tropical cyclone (TC) numbers, track coordinates, and 1-minute average maximum sustained wind taken from operational warnings issued by the Joint Typhoon Warning Center (JTWC) of the U. S. Air Force and Navy, located at Pearl Harbor, Hawaii. Western North Pacific tropical cyclone names are obtained from warnings issued by the Japan Meteorological Agency (JMA), which is the World Meteorological Organization's Regional Specialized Meteorological Center (RSMC) for the western North Pacific basin. The PEAC archives South Pacific TC names, track coordinates, central pressures, and 10-minute average maxi-mum sustained wind estimates from advisories issued by the Tropical Cyclone Warning Centers at Brisbane, and Wellington, and RSMC-Nadi (Fiji). The numbering scheme and the 1-minute average maximum sustained wind estimates are taken from warnings is-sued by the JTWC. There are sometimes differences in the statistics (e.g., storm maximum intensity) for a given cyclone among the agencies that are noted in this summary.
Western North Pacific
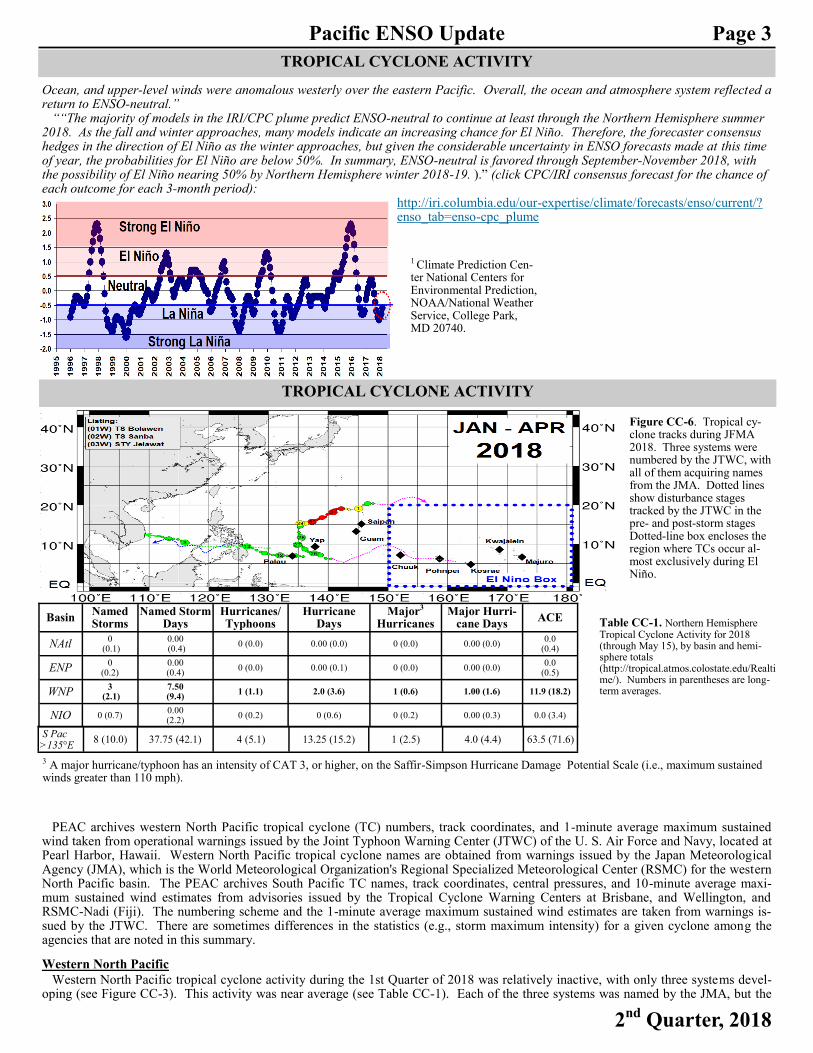
Western North Pacific tropical cyclone activity during the 1st Quarter of 2018 was relatively inactive, with only three systems devel-oping (see Figure CC-3). This activity was near average (see Table CC-1). Each of the three systems was named by the JMA, but the
1 Climate Prediction Cen-ter National Centers for Environmental Prediction, NOAA/National Weather Service, College Park, MD 20740.
TROPICAL CYCLONE ACTIVITY
Figure CC-6. Tropical cy-clone tracks during JFMA 2018. Three systems were numbered by the JTWC, with all of them acquiring names from the JMA. Dotted lines show disturbance stages tracked by the JTWC in the pre- and post-storm stages Dotted-line box encloses the region where TCs occur al-most exclusively during El Niño.
Basin Named Storms
Named Storm Days
Hurricanes/ Typhoons
Hurricane Days
Major3 Hurricanes
Major Hurri-cane Days
ACE
NAtl 0
(0.1) 0.00 (0.4)
0 (0.0) 0.00 (0.0) 0 (0.0) 0.00 (0.0) 0.0
(0.4)
ENP 0
(0.2) 0.00 (0.4)
0 (0.0) 0.00 (0.1) 0 (0.0) 0.00 (0.0) 0.0
(0.5)
WNP 3
(2.1) 7.50 (9.4)
1 (1.1) 2.0 (3.6) 1 (0.6) 1.00 (1.6) 11.9 (18.2)
NIO 0 (0.7) 0.00 (2.2)
0 (0.2) 0 (0.6) 0 (0.2) 0.00 (0.3) 0.0 (3.4)
S Pac >135°E
8 (10.0) 37.75 (42.1) 4 (5.1) 13.25 (15.2) 1 (2.5) 4.0 (4.4) 63.5 (71.6)
Table CC-1. Northern Hemisphere Tropical Cyclone Activity for 2018 (through May 15), by basin and hemi-sphere totals (http://tropical.atmos.colostate.edu/Realtime/). Numbers in parentheses are long-term averages.
3 A major hurricane/typhoon has an intensity of CAT 3, or higher, on the Saffir-Simpson Hurricane Damage Potential Scale (i.e., maximum sustained winds greater than 110 mph).
Page 4 Pacific ENSO Update
2nd Quarter, 2018
SEASONAL SEA LEVEL OUTLOOK FOR THE US-AFFILIATED PACFIC ISLANDS
first system (TC 01W) only reached the depression stage as per the JTWC. One of the TCs (Super Typhoon Jelawat) had a surprising intensity evolution. While well to the northwest of Guam and north of Yap Island, this TC rapidly intensified to become a 130-kt CAT-4 super typhoon. About a day later, it just as quickly lost strength, as it drifted slowly to the northeast. It thereafter continued to weaken while crossing eastward through the northern island arc of the CNMI. As an intense typhoon, Jelawat’s effects were primarily large waves on the north and west coasts of Guam and the CNMI. Another effect of Jelawat occurred very early in its life when its pre-storm disturbance passed near Pohnpei Island in mid-March. Very heavy rainfall occurred on Pohnpei Island and at other atolls of Pohnpei State as deep convection associated with the developing Jelawat was responsible for very high short-term (e.g., 24-hour) rainfall amounts. One fatality was reported on Pohnpei Island in a landslide during these heavy rains (see the Pohnpei LVS for more details).
EastPac
There were no numbered tropical cyclones in eastern North Pacific (ENP) and there were no TCs named by the CPHC in the central North Pacific during JFMA 2018. This is near average (Table CC-1). The first named TC of the eastern North Pacific hurricane season typically forms during the latter half of May.
Southern Hemisphere
The 2017-18 Southern Hemisphere (SH) TC season is nearing its end on 30 June 2018. Overall it was relatively quiet; both in the Australia region and in the south Pacific (see Table CC-1). Despite the low activity, one long-lasting and very intense cyclone (Gita) meandered across the South Pacific with serious impacts occurring throughout the region from American Samoa through Tonga, Fiji and on southward to New Zealand. (see the TC forecast discussion below and the LVS discussion for American Samoa for more details.)
PEAC Tropical Cyclone Assessment Western North Pacific and American Samoa Two organizations routinely provide forecasts of western North Pacific typhoon activity: (1) The Guy Carpenter Asia-Pacific Climate Impact Centre (GCACIC) at the School of Energy and Environment, City University of Hong Kong; and, (2) Tropical Storm Risk (TSR), Dr Adam Lea and Professor Mark Saunders, Department of Space and Climate Physics, UCL (University College London). On 11 May 2018, the TSR issued its outlook for the western North Pacific typhoon season. The Hong Kong group will likely issue its sea-sonal forecast sometime in June 2018. A locally generated outlook made by WFO Guam forecaster Paul Stanko has also been released, with results presented and discussed below. The WFO Guam Warning Coordination Meteorologist, Charles P. Guard working with PEAC scientist Dr. Mark A. Lander recently provided to Guam and CNMI media an outlook of 2018 TC activity. The TSR foresees slightly above average TC activity during the 2018 western North Pacific typhoon season (with respect to a 1965-2017 baseline). However, forecast uncertainties remain large, with the status of ENSO in the latter half of 2018 a crucial factor. NW Pacific ACE Index and System Numbers in 2018 ACE Intense Tropical Index Typhoons Typhoons Storms TSR Forecast (±FE) 2018 307 (±87) 9 (±3) 17 (±3) 27 (±4) 53yr Climate Norm (±SD) 1965-2017 294 (±101) 9 (±3) 16 (±4) 26 (±4) Forecast Skill at this Lead 1965-2017 26% 24% 14% 6% The statistical forecast released by WFO Guam (Mr. Paul Stanko) foresees a near-average season for the western North Pacific basin, but enhanced activity throughout Micronesia with 6 (±1) major typhoons somewhere within the bounds of the region; this is far more active than during 2016 and 2017.
Using the above outside guidance, and considering current weather patterns and the evolution of ENSO, the PEAC will adopt the press-release forecast by the WFO Guam (Mr. Charles P. Guard and collaborators) for the 2018 typhoon season for Guam and the CNMI, wherein the odds for a severe tropical storm at each location is given as 50% (about average); the odds of a CAT 1 typhoon is set at 25% (above average); and the odds for a major typhoon (CAT 3 or higher) is set at 15% (slightly above average). Elsewhere in Mi-cronesia, the odds for damaging TC strikes are set to slightly above average (for example, the average annual number of named tropical cyclones passing within 180 n mi of Yap or Palau is four, with a 10-15% chance of a damaging strike). Eastward of Chuuk State, the risk of a tropical storm or typhoon is much lower than at locations farther to the west, except during strong or some moderate El Niño events. During 2016 and 2017, the PEAC set very low odds (< 10%) for TC activity eastward of Chuuk State. This year, the PEAC anticipates an enhancement of TC development at locations to the east of Chuuk State, with the odds of some damaging effects from a TC (high surf; gale-force or stronger wind; and extreme rainfall > 10 inches in 24 hours) set at 25% (1-in-4) for all locations. This is an above average risk, and is well above the level of activity seen throughout Micronesia in both 2016 and 2017. The 2017-18 South Pacific cyclone season soon ends (June 30, 2018), with no further activity (< 10% risk of damaging impacts) antic-ipated to occur near American Samoa through September (See the American Samoa LVS for more details).

Page 5 Pacific ENSO Update
2nd Quarter, 2018
SEASONAL SEA LEVEL OUTLOOK FOR THE US-AFFILIATED PACFIC ISLANDS
Table 1: Forecasts of sea level anomalies in inches (MJJ, JJA, JAS, and ASO)
Table 1 and Supporting Statistics: : (-) indicate negative anomalies (fall of sea level from the mean), and (+) indicate positive anomalies (rise of sea level from the mean), n/a: data not available. Anomalies from -1 to +1 inches are considered negligible and anomalies from -2 to +2 inches are unlikely to cause any adverse climatic impact. Forecasts for Chuuk (**) are estimated subjectively based on information from WSO Chuuk and observations from neighboring stations of Pohnpei and Yap. *** There was a level shift (approximately 5 inches) in American Samoa at the time of September 2009 earthquake. So, -5 inches needs to adjust to the current tide-gauge values of Pago Pago. See PEAC website for the explanations of footnote (1 to 5). Also note that all information is based upon the 1983-2001 epoch.
The sea level throughout Micronesia has been high to very high over the past two years and, since April 2018, it started to fall. This is a sign of El Niño as sea level recorded considerable fall across most of Micronesia recently (March-April). Palau registered significant fall (6 inches) in one month (See Fig. SL-2) and currently showing normal level. This station will start to show negative anomaly from the next month. This is a typical picture in any El Nino year as Palau tracks ENSO so well that it makes a good ENSO index in its own right!
Seasonal Sea Level Forecast (anomalies with respect to climatology) for JMJJ, JJA, JAS, and ASO of 2018
Forecasts of the sea-level anomalies in the USAPI are presented using CCA statistical model (see Chowdhury M. R., Chu P-S, and Guard C. (2014): An Improved Sea Level Forecasting Scheme for Hazards Management in the U.S.-Affiliated Pacific Islands. Int. Journal of Climatology 6, 2320-2329.). Based on the independent SST and zonal wind (U) (SST-U) values in FMA of 2018, the resulting CCA model has been used to forecast the sea level of four consecutive seasons: MJJ, JJA, JAS, and ASO (see Table 1: left panel shows values for seasonal mean while the right panel shows the seasonal maxima). All the tide gauge stations (at 0 to 3-months lead time) provided skillful forecasts for all sea-sons (CCA skills 0.7-0.9).
The current sea level forecasts (Fig. SL-1) indicate that most of north Pacific stations are likely to be normal to marginally below-normal (normal and average are synonymously used throughout the sea level section) in the forthcoming MJJ-ASO seasons. If El Niño develops as per projections, then the lowest anomalies of sea level may likely to occur at the later part of 2018. In Hawaii, both Honolulu and Hilo are likely to be slightly elevated, but still close to normal. The fall is somewhat expected and it corresponds very well with the current developing phase of ENSO-neutral condition and/or developing phase of El Niño. Note that the south Pacific station (i.e., Pago Pago) maintains a 4-6 month time-lag to change (rise or fall) when compared to the north Pacific stations (i.e., Guam and the Marshalls).
The following sections describe: (i) the Canonical Correlation Analysis (CCA) forecasts for seasonal (mean and maxima) sea level anomalies (seasonal cycle removed) for the forthcoming seasons May-June-July (MJJ), June-July-August (JJA), July-August-September (JAS), and August-September-October (ASO) of 2018 , (ii) MJJ return values at 20 and 100-yr period, (iii) the observed monthly mean and maximum sea-level anomalies for the previous season January-Fenruary-March-April (JFMA) of 2018, and (iv) synopsis of last 2-years Sea Level variability and forecasts. Note that, seasonal cycles have been removed for the data anomalies that are defined as ‘deviations or departures from the normal’ using the 1983 through 2001 mean sea level value com-puted at each station. Also note that CCA-forecasting technique adopted here does not account for sea level deviations created by other atmospheric or geological factors.
Seasonal Mean Deviations 1 Seasonal Max Deviations 2
Tide Gauge Station MJJ JJA JAS Seasonal Outlook3 MJJ JJA JAS
MJJ: Return Period4 ASO ASO
Lead Time 5 0-M 1M 2M Seasonal Outlook3
0-M 1M 2M 20- YR
100-YR
3M 3M
Marianas, Guam +3 +2 +1 Normal +21 +20 +19 5.6 6.7 0 +17
Malakal, Palau -4 -3 -3 Below ++32 +33 +35 9.6 14.3 -3 +36
Yap, FSM 0 -1 -1 Below +28 +27 +27 16.7 33.0 -2 +28
Chuuk, FSM** +1 +1 0 Normal +28 +28 +29 n/a n/a 0 +29
Pohnpei, FSM 0 0 0 Normal +30 +29 +28 5.8 7.1 0 +28
Majuro, RMI 0 0 0 Normal +40 +40 +40 4.1 5.1 0 +40
Kwajalein, RMI +1 0 0 Normal +40 +38 +37 4.5 5.9 0 +38
Pago Pago, Am. Samoa***
+7 (+2)
+7 (+2)
+7 (+2)
Above +33
(+28) +34
(+29) +33
(+28) 3.9 5.4
+7 (+2)
+32 (+27)
Honolulu, Hawaii +2 +2 +2 Normal +23 +23 +21 4.1 5.9 +2 +20
Hilo, Hawaii +2 +2 +2 Normal +26 +26 +24 7.9 11.4 +2 +23
-4
-2
0
2
4
6
8
Gu
am
Ma
lak
al
Ya
p
Po
hn
pei
Ma
juro
Kw
aja
lein
Pa
go
Pa
go
Sea
son
al
Me
an
anom
aly
(in
ches)
Stations
MJJ JJA JAS ASO
Figure SL-1. Seasonal mean sea level (MSL) forecasts for MJJ to ASO of 2018

Page 6 Pacific ENSO Update
2nd Quarter, 2018
SEASONAL SEA LEVEL OUTLOOK FOR THE US-AFFILIATED PACFIC ISLANDS
Observed Monthly Mean Sea Level Anomalies (with respect to climatology) for Jan-Feb-Mar-Apr (JFMA) of 2018 Monthly Anomaly: Weak La Niña to ENSO neutral conditions were observed in the tropical Pacific. As a result, all stations were dis-played considerably above normal sea level during JFMA. In April, sea level started to fall and currently most of the north Pacific sta-tions are marginally above normal. Most of the stations may still remain marginally elevated in May and June, but likely to fall below normal after July 2018. Only Palau is currently reading normal. Earlier, Hawaii sea levels returned to normal, but Hilo recorded some considerable rise in April. Impacts: Tides have been very high with high waves all over Micronesia and Marshalls Islands during JFMA. Most of the events were associated with northerly swell from northern Pacific storm. There have been regular minor-to-moderate inundations in low-lying atolls and Pohnpei, Kosrae, and Chuuk reported road damage during this quarter. (See some of the damaged pictures attached on page 7)
Table 2: Monthly observed mean/maximum sea-level anomalies (inches) during Oct-Nov-Dec of 2017
Tide Gauge Station Monthly Mean Deviations1 Monthly Max Deviations2
Jan Feb Mar Standard
Deviations Jan Feb Mar
Sea level Trend
Apr Apr
Marianas, Guam +8 +7.5 +8 4.2 +25(6) +24(5) +23(4) Above-Stable +6 +20(1)
Malakal, Palau +3 +1.5 +6 4.8 +39(3) +39(3) +41(5) Above-Stable 0 +37(1)
Yap, FSM +9.5 +8.5 +7 4.7 +37(9) +35(7) +35(7) Above-Stable
+6 +32(4)
Chuuk, FSM* +6 +4 +5 ** ** ** ** ** +3 **
Pohnpei, FSM +10 +8.5 +7 4.5 +42 +39(9) +34(4) Above-Stable +6 +32(2)
Majuro, RMI +10.5 +9 +5 2.0 +51 +48(8) +45(5) Above-Stable +5 +43(3)
Kwajalein, RMI +9 +7 +5 2.8 +47(10) +47(6) +46(10) Above-Stable +2 +36(10)
Pago Pago, American Samoa*** +11.5 [6.5]
+10.5 [6.5]
+10.5 [6.5] 3.9
+38(5) [33]
+38(1) [29]
+34(5) [33] Above-Stable +10.5
[6.5] +31(5) [33]
Honolulu, Hawaii +4.7 +3 +2 1.7 +27(7) +25(4) +18(6) Above-Stable +2 +16(7)
Hilo, Hawaii +3.5 +4 +1 1.9 +31(8) +29(3) +21(5) Above-Stable +3.5 +23(8)
Table 2. +/- indicate positive anomaly (rise) and negative anomaly (fall) respectively. Note that any changes between (0~ ±1) inch is considered to be negligible. Also note that changes within the range of (+/-) 2 inches are unlikely to cause any adverse climatic impact. *** Guesstimated values, ** Data currently unavailable; Figures in parenthesis are year-to-year seasonal anomaly. 1: Difference between the mean sea level for the given month and the 1983 through 2001 mean sea level value at each station (seasonal cycle removed); 2: Same as 1 except for maxima; SD stands for standard deviations. Red: Falling trend, Black: Stable SL, and Blue: Rising trend. * In
Pago Pago, there was a level shift (approximately 2-4 inches) at the time of September 2009 earthquake. Data Source: University of Hawaii Sea Level Center (UHSLC). ftp://ilikai.soest.hawaii.edu/islp/slpp.anomaliess.
Synopsis of 2-years Sea Level Variability and Forecasts
-8.0
-4.0
0.0
4.0
8.0
12.0
ON
D-1
5
JFM
-16
AM
J-1
6
JAS-1
6
ON
D-1
6
JFM
-17
AM
J-1
7
JAS-1
7
No
v-1
7*
De
c-1
7*
Jan
-18
*
FM
A-1
8*
*
Se
aso
na
l se
le
ve
l a
no
ma
ly
(in
)
*Observed monthly value; Note that Pago Pago values are adjusted by -5 inches; **FMA-2018 values are PEAC-CCA forecasts
Seasonal Sea Level Variations in 2015-18: USAPI Region
Guam
Palau
Yap
Pohnpei
Majuro
Kwajalein
Pago Pago
Figure SL-2 A comparative perspective of Island-wise seasonal sea level variations (JFM 2016 to JJA 2018) (*Note that Pago Pago data needs correction because of level shift after 2009 earthquake. ,There was a level shift (approximately 2-4 inches) at that time which has not been adjusted).
Starting from JFM of 2016, a compara-tive perspective of two years seasonal sea level variations is given below (Fig. SL-2). The sea level in the western Pacific started to rise from JFM of 2016 and has stayed elevated until recently. It began to fall in March 2018 and is currently show-ing a falling trend. The current forecast for JJA of 2018 also signals a significant fall. See page 15 for sea level observations from Jason-2 satellite picture (SL-3).

Page 7 Pacific ENSO Update
2nd Quarter, 2018
Picture. 2: Tides and Inundation pictures in Majuro during Feb-ruary 3-4 high tides (top: inundated roads, bottom: inundated houses). Event is associated with northerly swell from northern Pacific storm. (Photo Credit: Mr. Charles C Guard).
Picture. 1: Tides and Inundation pictures in Kwajalein (Pictures attached are day after evening high tide 4 Feb). The site is locat-ed north of runway on Roi Namur, near 9 24’ 4.75”N, 167 28’ 30.96E. Event is associated with northerly swell from northern Pacific storm. (Photo Credit: Mr. Eugene Bell, Kwajalein Atoll, RMI).
Picture. 1: Pictures of landslides (top) and flooded roads (middle), and damaged roads (bottom) on March 16-17 at Pohnpei, FSM (Photo Credit: M/s Wilfred and Wallace, WSO. These damages are the combined impacts of heavy downpour and high waves.
Damaged roads at Pohnpei
Flooding at Pohnpei
Land slides at Sokehs, Pohnpei
Page 8 Pacific ENSO Update
2nd Quarter, 2018
LOCAL SUMMARY AND FORECAST LOCAL SUMMARY AND FORECAST
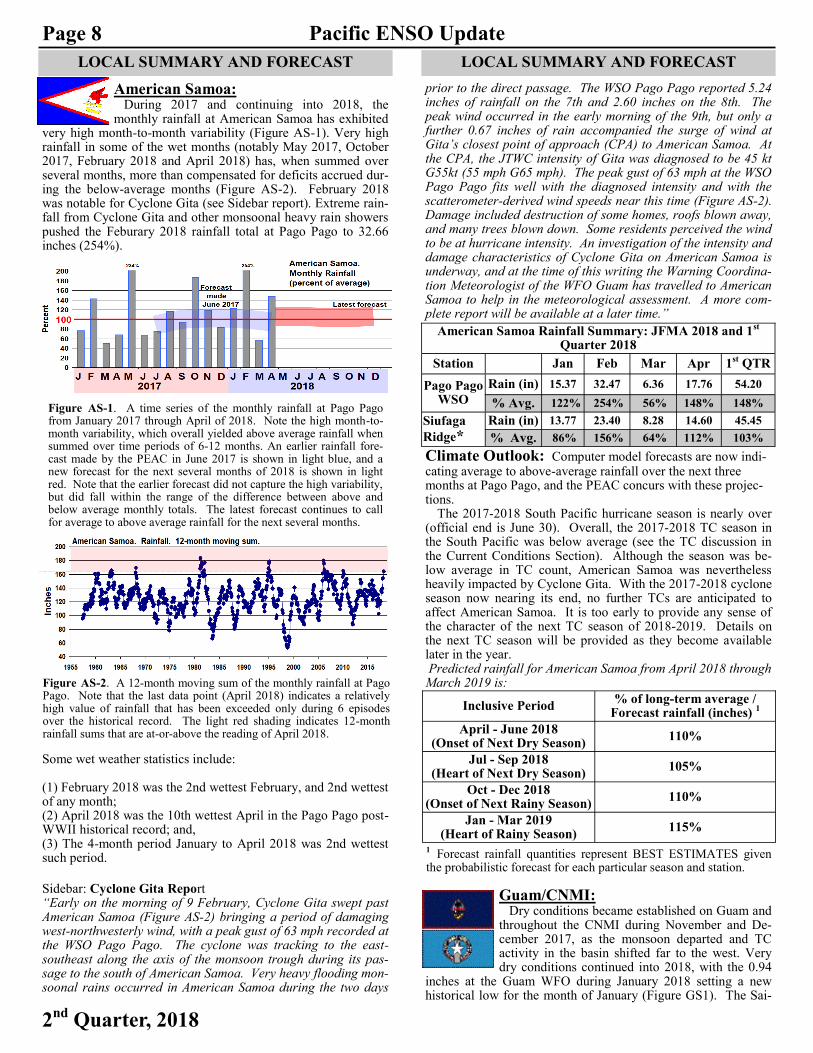
American Samoa: During 2017 and continuing into 2018, the monthly rainfall at American Samoa has exhibited
very high month-to-month variability (Figure AS-1). Very high rainfall in some of the wet months (notably May 2017, October 2017, February 2018 and April 2018) has, when summed over several months, more than compensated for deficits accrued dur-ing the below-average months (Figure AS-2). February 2018 was notable for Cyclone Gita (see Sidebar report). Extreme rain-fall from Cyclone Gita and other monsoonal heavy rain showers pushed the Feburary 2018 rainfall total at Pago Pago to 32.66 inches (254%).
Some wet weather statistics include: (1) February 2018 was the 2nd wettest February, and 2nd wettest of any month; (2) April 2018 was the 10th wettest April in the Pago Pago post-WWII historical record; and, (3) The 4-month period January to April 2018 was 2nd wettest such period.
Sidebar: Cyclone Gita Report “Early on the morning of 9 February, Cyclone Gita swept past American Samoa (Figure AS-2) bringing a period of damaging west-northwesterly wind, with a peak gust of 63 mph recorded at the WSO Pago Pago. The cyclone was tracking to the east-southeast along the axis of the monsoon trough during its pas-sage to the south of American Samoa. Very heavy flooding mon-soonal rains occurred in American Samoa during the two days
prior to the direct passage. The WSO Pago Pago reported 5.24 inches of rainfall on the 7th and 2.60 inches on the 8th. The peak wind occurred in the early morning of the 9th, but only a further 0.67 inches of rain accompanied the surge of wind at Gita’s closest point of approach (CPA) to American Samoa. At the CPA, the JTWC intensity of Gita was diagnosed to be 45 kt G55kt (55 mph G65 mph). The peak gust of 63 mph at the WSO Pago Pago fits well with the diagnosed intensity and with the scatterometer-derived wind speeds near this time (Figure AS-2). Damage included destruction of some homes, roofs blown away, and many trees blown down. Some residents perceived the wind to be at hurricane intensity. An investigation of the intensity and damage characteristics of Cyclone Gita on American Samoa is underway, and at the time of this writing the Warning Coordina-tion Meteorologist of the WFO Guam has travelled to American Samoa to help in the meteorological assessment. A more com-plete report will be available at a later time.”
Climate Outlook: Computer model forecasts are now indi-cating average to above-average rainfall over the next three months at Pago Pago, and the PEAC concurs with these projec-tions. The 2017-2018 South Pacific hurricane season is nearly over (official end is June 30). Overall, the 2017-2018 TC season in the South Pacific was below average (see the TC discussion in the Current Conditions Section). Although the season was be-low average in TC count, American Samoa was nevertheless heavily impacted by Cyclone Gita. With the 2017-2018 cyclone season now nearing its end, no further TCs are anticipated to affect American Samoa. It is too early to provide any sense of the character of the next TC season of 2018-2019. Details on the next TC season will be provided as they become available later in the year. Predicted rainfall for American Samoa from April 2018 through March 2019 is:
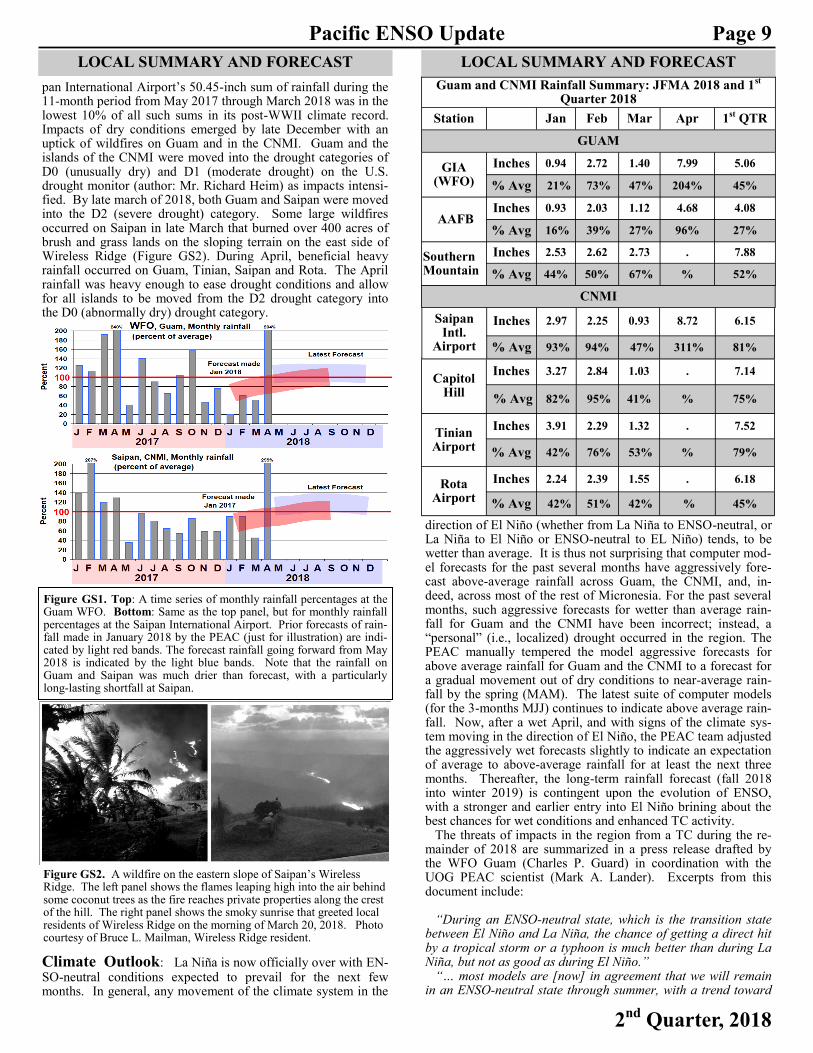
Guam/CNMI: Dry conditions became established on Guam and throughout the CNMI during November and De-cember 2017, as the monsoon departed and TC activity in the basin shifted far to the west. Very dry conditions continued into 2018, with the 0.94
inches at the Guam WFO during January 2018 setting a new historical low for the month of January (Figure GS1). The Sai-
American Samoa Rainfall Summary: JFMA 2018 and 1st
Quarter 2018
Station Jan Feb Mar Apr 1st QTR
Pago Pago WSO
Rain (in) 15.37 32.47 6.36 17.76 54.20
% Avg. 122% 254% 56% 148% 148%
Siufaga
Ridge* Rain (in) 13.77 23.40 8.28 14.60 45.45
% Avg. 86% 156% 64% 112% 103%
1 Forecast rainfall quantities represent BEST ESTIMATES given the probabilistic forecast for each particular season and station.
Inclusive Period % of long-term average /
Forecast rainfall (inches) 1
April - June 2018 (Onset of Next Dry Season)
110%
Jul - Sep 2018 (Heart of Next Dry Season)
105%
Oct - Dec 2018 (Onset of Next Rainy Season)
110%
Jan - Mar 2019 (Heart of Rainy Season)
115%
Figure AS-1. A time series of the monthly rainfall at Pago Pago from January 2017 through April of 2018. Note the high month-to-month variability, which overall yielded above average rainfall when summed over time periods of 6-12 months. An earlier rainfall fore-cast made by the PEAC in June 2017 is shown in light blue, and a new forecast for the next several months of 2018 is shown in light red. Note that the earlier forecast did not capture the high variability, but did fall within the range of the difference between above and below average monthly totals. The latest forecast continues to call for average to above average rainfall for the next several months.
Figure AS-2. A 12-month moving sum of the monthly rainfall at Pago Pago. Note that the last data point (April 2018) indicates a relatively high value of rainfall that has been exceeded only during 6 episodes over the historical record. The light red shading indicates 12-month rainfall sums that are at-or-above the reading of April 2018.
Page 9 Pacific ENSO Update
2nd Quarter, 2018
LOCAL SUMMARY AND FORECAST LOCAL SUMMARY AND FORECAST
pan International Airport’s 50.45-inch sum of rainfall during the 11-month period from May 2017 through March 2018 was in the lowest 10% of all such sums in its post-WWII climate record. Impacts of dry conditions emerged by late December with an uptick of wildfires on Guam and in the CNMI. Guam and the islands of the CNMI were moved into the drought categories of D0 (unusually dry) and D1 (moderate drought) on the U.S. drought monitor (author: Mr. Richard Heim) as impacts intensi-fied. By late march of 2018, both Guam and Saipan were moved into the D2 (severe drought) category. Some large wildfires occurred on Saipan in late March that burned over 400 acres of brush and grass lands on the sloping terrain on the east side of Wireless Ridge (Figure GS2). During April, beneficial heavy rainfall occurred on Guam, Tinian, Saipan and Rota. The April rainfall was heavy enough to ease drought conditions and allow for all islands to be moved from the D2 drought category into the D0 (abnormally dry) drought category.
Climate Outlook: La Niña is now officially over with EN-SO-neutral conditions expected to prevail for the next few months. In general, any movement of the climate system in the
direction of El Niño (whether from La Niña to ENSO-neutral, or La Niña to El Niño or ENSO-neutral to EL Niño) tends, to be wetter than average. It is thus not surprising that computer mod-el forecasts for the past several months have aggressively fore-cast above-average rainfall across Guam, the CNMI, and, in-deed, across most of the rest of Micronesia. For the past several months, such aggressive forecasts for wetter than average rain-fall for Guam and the CNMI have been incorrect; instead, a “personal” (i.e., localized) drought occurred in the region. The PEAC manually tempered the model aggressive forecasts for above average rainfall for Guam and the CNMI to a forecast for a gradual movement out of dry conditions to near-average rain-fall by the spring (MAM). The latest suite of computer models (for the 3-months MJJ) continues to indicate above average rain-fall. Now, after a wet April, and with signs of the climate sys-tem moving in the direction of El Niño, the PEAC team adjusted the aggressively wet forecasts slightly to indicate an expectation of average to above-average rainfall for at least the next three months. Thereafter, the long-term rainfall forecast (fall 2018 into winter 2019) is contingent upon the evolution of ENSO, with a stronger and earlier entry into El Niño brining about the best chances for wet conditions and enhanced TC activity. The threats of impacts in the region from a TC during the re-mainder of 2018 are summarized in a press release drafted by the WFO Guam (Charles P. Guard) in coordination with the UOG PEAC scientist (Mark A. Lander). Excerpts from this document include: “During an ENSO-neutral state, which is the transition state between El Niño and La Niña, the chance of getting a direct hit by a tropical storm or a typhoon is much better than during La Niña, but not as good as during El Niño.” “… most models are [now] in agreement that we will remain in an ENSO-neutral state through summer, with a trend toward
Guam and CNMI Rainfall Summary: JFMA 2018 and 1st
Quarter 2018
Station Jan Feb Mar Apr 1st QTR
GUAM
GIA (WFO)
Inches 0.94 2.72 1.40 7.99 5.06
% Avg 21% 73% 47% 204% 45%
AAFB Inches 0.93 2.03 1.12 4.68 4.08
% Avg 16% 39% 27% 96% 27%
Southern Mountain
Inches 2.53 2.62 2.73 . 7.88
% Avg 44% 50% 67% % 52%
Capitol Hill
Inches 3.27 2.84 1.03 . 7.14
% Avg 82% 95% 41% % 75%
Tinian Airport
Inches 3.91 2.29 1.32 . 7.52
% Avg 42% 76% 53% % 79%
Rota Airport
Inches 2.24 2.39 1.55 . 6.18
% Avg 42% 51% 42% % 45%
Saipan Intl.
Airport
Inches 2.97 2.25 0.93 8.72 6.15
% Avg 93% 94% 47% 311% 81%
CNMI
Figure GS1. Top: A time series of monthly rainfall percentages at the Guam WFO. Bottom: Same as the top panel, but for monthly rainfall percentages at the Saipan International Airport. Prior forecasts of rain-fall made in January 2018 by the PEAC (just for illustration) are indi-cated by light red bands. The forecast rainfall going forward from May 2018 is indicated by the light blue bands. Note that the rainfall on Guam and Saipan was much drier than forecast, with a particularly long-lasting shortfall at Saipan.
Figure GS2. A wildfire on the eastern slope of Saipan’s Wireless Ridge. The left panel shows the flames leaping high into the air behind some coconut trees as the fire reaches private properties along the crest of the hill. The right panel shows the smoky sunrise that greeted local residents of Wireless Ridge on the morning of March 20, 2018. Photo courtesy of Bruce L. Mailman, Wireless Ridge resident.
Page 10 Pacific ENSO Update
2nd Quarter, 2018
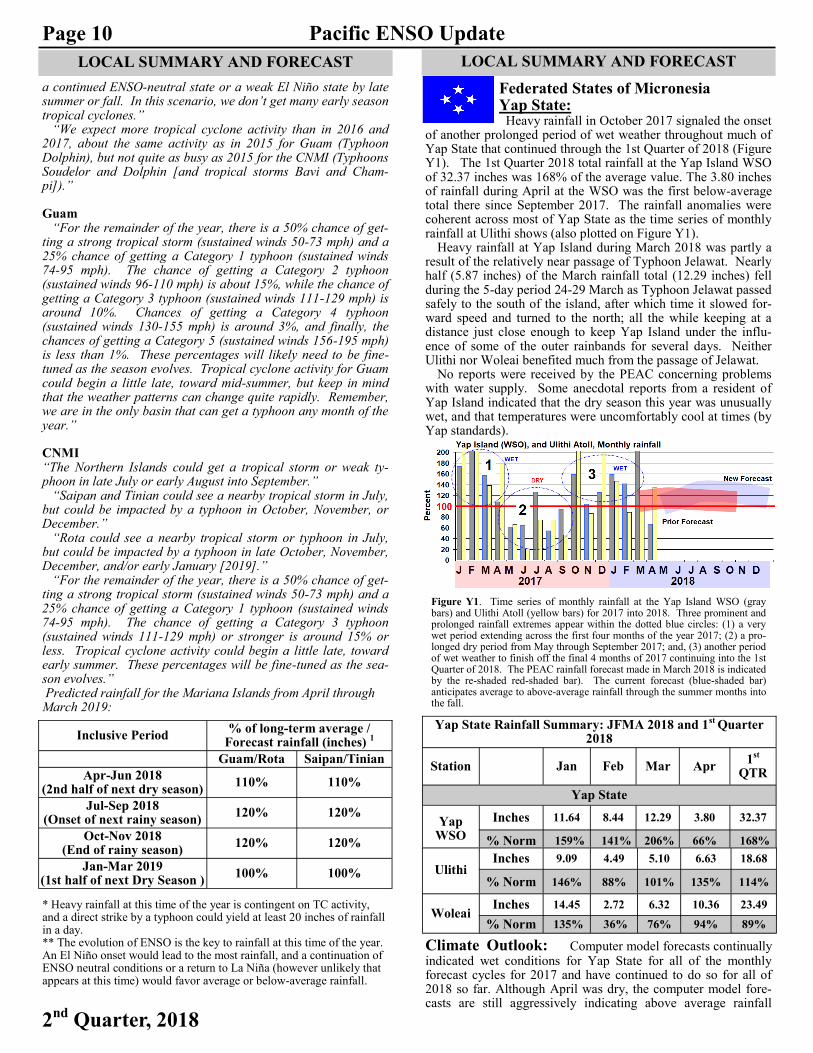
Federated States of Micronesia Yap State: Heavy rainfall in October 2017 signaled the onset
of another prolonged period of wet weather throughout much of Yap State that continued through the 1st Quarter of 2018 (Figure Y1). The 1st Quarter 2018 total rainfall at the Yap Island WSO of 32.37 inches was 168% of the average value. The 3.80 inches of rainfall during April at the WSO was the first below-average total there since September 2017. The rainfall anomalies were coherent across most of Yap State as the time series of monthly rainfall at Ulithi shows (also plotted on Figure Y1). Heavy rainfall at Yap Island during March 2018 was partly a result of the relatively near passage of Typhoon Jelawat. Nearly half (5.87 inches) of the March rainfall total (12.29 inches) fell during the 5-day period 24-29 March as Typhoon Jelawat passed safely to the south of the island, after which time it slowed for-ward speed and turned to the north; all the while keeping at a distance just close enough to keep Yap Island under the influ-ence of some of the outer rainbands for several days. Neither Ulithi nor Woleai benefited much from the passage of Jelawat. No reports were received by the PEAC concerning problems with water supply. Some anecdotal reports from a resident of Yap Island indicated that the dry season this year was unusually wet, and that temperatures were uncomfortably cool at times (by Yap standards).
Climate Outlook: Computer model forecasts continually indicated wet conditions for Yap State for all of the monthly forecast cycles for 2017 and have continued to do so for all of 2018 so far. Although April was dry, the computer model fore-casts are still aggressively indicating above average rainfall
LOCAL SUMMARY AND FORECAST
a continued ENSO-neutral state or a weak El Niño state by late summer or fall. In this scenario, we don’t get many early season tropical cyclones.” “We expect more tropical cyclone activity than in 2016 and 2017, about the same activity as in 2015 for Guam (Typhoon Dolphin), but not quite as busy as 2015 for the CNMI (Typhoons Soudelor and Dolphin [and tropical storms Bavi and Cham-pi]).” Guam “For the remainder of the year, there is a 50% chance of get-ting a strong tropical storm (sustained winds 50-73 mph) and a 25% chance of getting a Category 1 typhoon (sustained winds 74-95 mph). The chance of getting a Category 2 typhoon (sustained winds 96-110 mph) is about 15%, while the chance of getting a Category 3 typhoon (sustained winds 111-129 mph) is around 10%. Chances of getting a Category 4 typhoon (sustained winds 130-155 mph) is around 3%, and finally, the chances of getting a Category 5 (sustained winds 156-195 mph) is less than 1%. These percentages will likely need to be fine-tuned as the season evolves. Tropical cyclone activity for Guam could begin a little late, toward mid-summer, but keep in mind that the weather patterns can change quite rapidly. Remember, we are in the only basin that can get a typhoon any month of the year.” CNMI “The Northern Islands could get a tropical storm or weak ty-phoon in late July or early August into September.” “Saipan and Tinian could see a nearby tropical storm in July, but could be impacted by a typhoon in October, November, or December.” “Rota could see a nearby tropical storm or typhoon in July, but could be impacted by a typhoon in late October, November, December, and/or early January [2019].” “For the remainder of the year, there is a 50% chance of get-ting a strong tropical storm (sustained winds 50-73 mph) and a 25% chance of getting a Category 1 typhoon (sustained winds 74-95 mph). The chance of getting a Category 3 typhoon (sustained winds 111-129 mph) or stronger is around 15% or less. Tropical cyclone activity could begin a little late, toward early summer. These percentages will be fine-tuned as the sea-son evolves.” Predicted rainfall for the Mariana Islands from April through March 2019:
LOCAL SUMMARY AND FORECAST
Inclusive Period % of long-term average /
Forecast rainfall (inches) 1
Guam/Rota Saipan/Tinian
Apr-Jun 2018 (2nd half of next dry season)
110% 110%
Jul-Sep 2018 (Onset of next rainy season)
120% 120%
Oct-Nov 2018 (End of rainy season)
120% 120%
Jan-Mar 2019 (1st half of next Dry Season )
100% 100%
* Heavy rainfall at this time of the year is contingent on TC activity, and a direct strike by a typhoon could yield at least 20 inches of rainfall in a day. ** The evolution of ENSO is the key to rainfall at this time of the year. An El Niño onset would lead to the most rainfall, and a continuation of ENSO neutral conditions or a return to La Niña (however unlikely that appears at this time) would favor average or below-average rainfall.
Yap State Rainfall Summary: JFMA 2018 and 1st Quarter 2018
Station
Jan Feb Mar Apr 1st
QTR
Yap State
Yap WSO
Inches 11.64 8.44 12.29 3.80 32.37
% Norm 159% 141% 206% 66% 168%
Ulithi
Inches 9.09 4.49 5.10 6.63 18.68
% Norm 146% 88% 101% 135% 114%
Woleai
Inches 14.45 2.72 6.32 10.36 23.49
% Norm 135% 36% 76% 94% 89%
Figure Y1. Time series of monthly rainfall at the Yap Island WSO (gray bars) and Ulithi Atoll (yellow bars) for 2017 into 2018. Three prominent and prolonged rainfall extremes appear within the dotted blue circles: (1) a very wet period extending across the first four months of the year 2017; (2) a pro-longed dry period from May through September 2017; and, (3) another period of wet weather to finish off the final 4 months of 2017 continuing into the 1st Quarter of 2018. The PEAC rainfall forecast made in March 2018 is indicated by the re-shaded red-shaded bar). The current forecast (blue-shaded bar) anticipates average to above-average rainfall through the summer months into the fall.

Page 11 Pacific ENSO Update
2nd Quarter, 2018
LOCAL SUMMARY AND FORECAST LOCAL SUMMARY AND FORECAST
across Yap State over the next three months. High rainfall dur-ing the 1st Quarter of 2018 was successfully anticipated by the models and, for the most part, by the consensus PEAC forecast. With the long-range evolution of ENSO hinting at a move in the direction of El Niño, and with some climatic signals indicat-ing a possible enhancement to typhoon activity in Micronesia (see the TC section of the Current Conditions section), the PEAC anticipates an elevation of the risk of impacts to Yap State by the near passages of tropical storms and typhoons. The following statements in a risk assessment of typhoon impacts to Guam during 2018 made by the WFO Guam in coordination with PEAC are valid for Yap State as well:
“During an ENSO-neutral state, which is the transition state between El Niño and La Niña, the chance of getting a direct hit by a tropical storm or a typhoon is much better than during La Niña, but not as good as during El Niño.”
“… most models are [now] in agreement that we will remain in an ENSO-neutral state through summer, with a trend toward a continued ENSO-neutral state or a weak El Niño state by late summer or fall. In this scenario, we don’t get many early season tropical cyclones.” “We expect more tropical cyclone activity than in 2016 and 2017…”
The greatest risk is anticipated to be later in the year (September through December), with at least a 50% chance of a severe tropical storm affecting Yap Island, and the other atolls of Yap State (e.g., Ngulu, Ulithi and Fais). The risk of a direct hit by a typhoon on any individual island is deemed to be above average at 25% (1-in-4) with the average value being 20% (1-in-5). At this point, we don’t anticipate typhoon activity during the Micronesian games in the second half of July. However, it could be wet due to some monsoon activity.
Predicted rainfall for Yap State from April 2018 through March 2019 is:
Chuuk State: During the calendar year 2017 and continuing into the 1st Quarter of 2018 there was high seasonal variability of rainfall throughout Chuuk State. Four major anomalies are apparent on Figure CH-1: (1) A period of high rainfall during the 6-month period OND (2016) – JFM (2017); (2) Another period of persistent dryness during the 5-month pe-riod AMJJA (2017); (3) A wet finish to the year (SOND) 2017 (particularly in the Chuuk lagoon and some of the atolls of the southern Mortlocks); and, (4) A continuation of wet conditions in the 1st Quarter of 2018 in the central and southern atolls of Chuuk State, but with some dryness evident in March and April in the northern atolls, and a dry April at the WSO Chuuk. The first four days of February 2018 were very wet in Chuuk Lagoon. From 1-4 February, the WSO recorded 9.33 inches of
rain. We did not receive any reports of damages from this ex-cessive rainfall. During the 3rd week of March 2018, the tropical disturbance that became Typhoon Jelewat passed to the north of Chuuk State, bringing some heavy showers. But unlike the ex-traordinary rainfall experienced in portions of Pohnpei State (just to the east of Chuuk State) during the passage of the pre-Jelewat tropical disturbance there, the rainfall in Chuuk associat-ed with the pre-Jelewat tropical disturbance was not excessive, and there was only some minor flooding of roadways reported. Gusty trade winds on the 12th of April drove a boat aground on the east side of Weno. These gusty trade winds also accompa-nied rough seas that contributed to inundation at high tide on some of the islets (e.g., Piis Panew) of Chuuk Lagoon. With the recent demise of La Niña, the regional sea level fell across nearly all major island groups of Micronesia. The April mean sea level at Chuuk during April was 2.8 inches above aver-age, which was a fall of 2.4 inches from its stand in March. A move of the climate system toward El Niño is usually accompa-nied by a drop of mean sea level (see the sea level section for details).
Chuuk State Rainfall Summary: JFMA 2018 and 1st Quarter 2018
Station Jan Feb Mar Apr 1st QTR
Chuuk Lagoon
Chuuk WSO
10.01 12.70 10.86 5.60 39.17 Inches
94% 205% 130% 45% 155% % Avg
Northern Mortlocks
Nama 12.30 8.16 8.52 3.46* 28.98 Inches
115% 132% 102% % 115% % Avg
Northern Mortlocks
Losap 6.64 11.70 10.06 .** 28.40 Inches
55% 80% 87% % 74% % Avg
Western Atolls
Polowat 1.95** 11.11 5.28 3.45 18.34 Inches
24% 178% 84% % 89% % Avg
% of long-term average / Forecast rainfall (inches) 1 Inclusive Period
Woleai Yap & Ulithi
April-June 2018 (End of Dry Season)
95% 105%
July-September 2018 (Onset of next Dry Season)
95% 110%
October-December 2018 (End of next Dry Season)
95% 110%
January-March 2019 (End of next Dry Season)
95% 100%
Figure CH-1. A time series of the monthly rainfall at the WSO Chuuk (black bars) and at Lukunoch (yellow bars) during 2017 and early 2018. The transition from an extended dry period (the blue circle “1”) to a period of wet weather (blue circle “2) was well-captured by the long-range forecast made in June (light-blue band). The light red band is the latest rainfall prediction for the next several months.
Southern Mortlocks
Lukunoch 10.83 9.50 7.76 6.28 28.09 Inches
102% 100% 65% 48% 87% % Avg
Northern Atolls
Fananu Inches 9.07 7.31 2.53 1.09* 18.91
% Avg 85% 118% 30% % 75%
Inches 6.73 2.47 4.59 3.09* 13.79 Onoun
% Avg 63% 40% 55% % 55%
* A small part of the April total was measured on 1 May and was added to the April total. ** It is possible that persistent dryness at Polowat is exaggerated by an exposure problem with the rain gauge; although February and March appear reasonable.
Page 12 Pacific ENSO Update
2nd Quarter, 2018
PN-Table 1. The top monthly rainfall totals of 30 inches, or more, in the histori-cal record at the indicated locations. Col-or coding depicts categories as shown by the key below the table. Cells are colored gray if there are fewer than eight months at-or-above 30 inches in any location’s record.
LOCAL SUMMARY AND FORECAST LOCAL SUMMARY AND FORECAST
Climate Outlook: Computer model forecasts continually indicated wet conditions for the WSO Chuuk for nearly all of the monthly forecast cycles for 2017 and have continued to do so for all of 2018 to-date. The latest 3-month forecast (MJJ 2018) again suggests above average rainfall across Chuuk State. The PEAC team decided to let the computer forecasts stand; that is, the tercile probabilities for below average/near average/above average rainfall are 25%/35%/40%. From this, the PEAC has predicted average to above average rainfall for the Island State. With the long-range evolution of ENSO hinting at a move in the direction of El Niño, and with some climatic signals indicat-ing a possible enhancement to typhoon activity in Micronesia (see the TC section of the Current Conditions section), the PEAC anticipates an elevation of the risk of impacts in Chuuk State by the near passages of tropical storms and typhoons. The PEAC assesses the risk of potentially damaging effects from a passing TC at 15% (a 1-in-7 chance), through September 2018. This level of risk is a little above average. The risk is anticipat-ed to rise in the final months of the year (OND) to 40% chance (to 1-in-3) for the at least the occurrence of large TC-related waves (> 15 feet), gales (35 kt or greater) or very heavy rainfall (> 10 inches in 24 hours). Predicted rainfall for Chuuk State from April 2018 through March 2019 is:
Pohnpei State: The 1st Quarter of 2018 was wet throughout Pohnpei State, including all stations on Pohnpei Island and all recording loca-tions on the outer atolls. But, the big story of the 1st Quarter of 2018 was the enormous amount of rainfall on Pohnpei Island and some of the outer atolls during March 2018. The March monthly total of 57.93 inches at the WSO Pohnpei was the high-est March rainfall total, the highest total for any month at that station, and the highest monthly total for any month at any sta-tion across Micronesia! (see PN-Table 1 below).
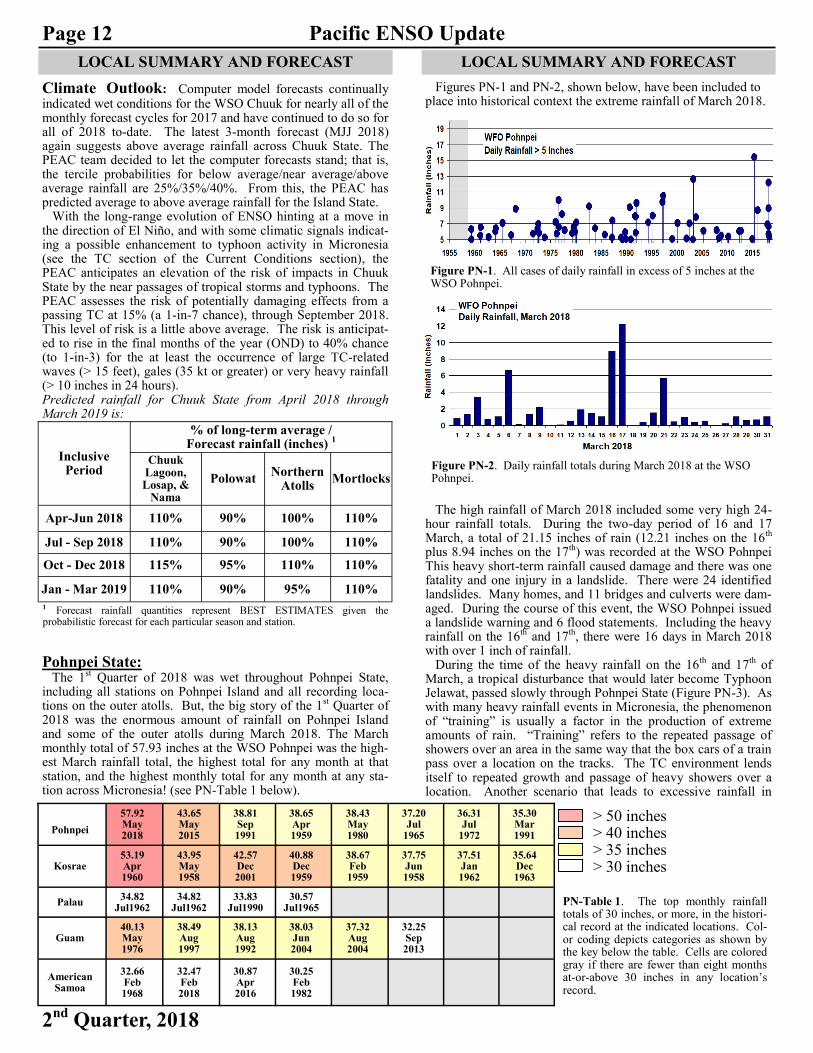
Figures PN-1 and PN-2, shown below, have been included to place into historical context the extreme rainfall of March 2018.
The high rainfall of March 2018 included some very high 24-hour rainfall totals. During the two-day period of 16 and 17 March, a total of 21.15 inches of rain (12.21 inches on the 16th plus 8.94 inches on the 17th) was recorded at the WSO Pohnpei This heavy short-term rainfall caused damage and there was one fatality and one injury in a landslide. There were 24 identified landslides. Many homes, and 11 bridges and culverts were dam-aged. During the course of this event, the WSO Pohnpei issued a landslide warning and 6 flood statements. Including the heavy rainfall on the 16th and 17th, there were 16 days in March 2018 with over 1 inch of rainfall. During the time of the heavy rainfall on the 16th and 17th of March, a tropical disturbance that would later become Typhoon Jelawat, passed slowly through Pohnpei State (Figure PN-3). As with many heavy rainfall events in Micronesia, the phenomenon of “training” is usually a factor in the production of extreme amounts of rain. “Training” refers to the repeated passage of showers over an area in the same way that the box cars of a train pass over a location on the tracks. The TC environment lends itself to repeated growth and passage of heavy showers over a location. Another scenario that leads to excessive rainfall in
1 Forecast rainfall quantities represent BEST ESTIMATES given the probabilistic forecast for each particular season and station.
% of long-term average / Forecast rainfall (inches) 1
Inclusive Period
Chuuk Lagoon, Losap, &
Nama
Polowat Northern
Atolls Mortlocks
Apr-Jun 2018 110% 90% 100% 110%
Jul - Sep 2018 110% 90% 100% 110%
Oct - Dec 2018 115% 95% 110% 110%
Jan - Mar 2019 110% 90% 95% 110%
Pohnpei
57.92 May 2018
43.65 May 2015
38.81 Sep 1991
38.65 Apr 1959
38.43 May 1980
37.20 Jul
1965
36.31 Jul
1972
35.30 Mar 1991
Kosrae 53.19 Apr 1960
43.95 May 1958
42.57 Dec 2001
40.88 Dec 1959
38.67 Feb 1959
37.75 Jun 1958
37.51 Jan 1962
35.64 Dec 1963
Palau 34.82
Jul1962 34.82
Jul1962 33.83
Jul1990 30.57
Jul1965
Guam 40.13 May 1976
38.49 Aug 1997
38.13 Aug 1992
38.03 Jun 2004
37.32 Aug 2004
32.25 Sep 2013
American Samoa
32.66 Feb 1968
32.47 Feb 2018
30.87 Apr 2016
30.25 Feb 1982
> 50 inches > 40 inches > 35 inches > 30 inches
Figure PN-2. Daily rainfall totals during March 2018 at the WSO Pohnpei.
Figure PN-1. All cases of daily rainfall in excess of 5 inches at the WSO Pohnpei.

Page 13 Pacific ENSO Update
2nd Quarter, 2018
LOCAL SUMMARY AND FORECAST LOCAL SUMMARY AND FORECAST
Micronesia is the passage of the eyewall of a mature TC over a location. In this case, the rainfall in the eyewall is so heavy (6-8 inches per hour) that extreme amounts occur over a very short time. This was not the case in the March 16-17 event at Pohnpei, but is more often the case on Guam or in the CNMI, where nearly all the top extreme daily rainfall events occur in the cores of typhoons
Climate Outlook: Computer model forecasts continually indicated wet conditions for Pohnpei Island and nearby atolls for all of the monthly forecast cycles for 2017 and have continued to do so for all of 2018, so far. The very latest computer rainfall forecast has receded slightly from its aggressive wet forecast, and the PEAC let stand the latest forecast for average- to above-average rainfall for the next three months (MJJ). High rainfall during the 1st Quarter of 2018 was successfully anticipated by the models and, for the most part, by the consensus PEAC fore-cast (although the extreme magnitude of the rainfall in March was not foreseen). With the long-range evolution of ENSO hinting at a move in the direction of El Niño, and with some climatic signals indicat-ing a possible enhancement to typhoon activity in Micronesia (see the TC section of the Current Conditions section), the PEAC anticipates an elevation of the risk of impacts Pohnpei
Island and atolls by the near passages of tropical storms and ty-phoons. The following statements extracted from a risk assess-ment of typhoon impacts to Guam during 2018 made by the WFO Guam in coordination with PEAC are valid for Pohnpei State as well: “During an ENSO-neutral state, which is the transition state between El Niño and La Niña, the chance of getting [damaging effects from] a tropical storm or a typhoon is much better than during La Niña, but not as good as during El Niño.” “… most models are [now] in agreement that we will remain in an ENSO-neutral state through summer, with a trend toward a continued ENSO-neutral state or a weak El Niño state by late summer or fall. ...” “We expect more tropical cyclone activity than in 2016 and 2017…” The greatest risk is anticipated to rise in the final months of the year (OND) to 25% chance (to 1-in-4) for the at least the occur-rence of large TC-related waves (> 15 feet), gales (35 kt or greater) or very heavy rainfall (> 10 inches in 24 hours). Lastly, because of recent weakening of the Pacific trade wind system as the climate transitions to ENSO-neutral, the sea level in Pohnpei State now has begun to fall away from its earlier stand of approximately 6-8 inches above the long term average, (see the sea level section for details). Predicted rainfall for Pohnpei State from April 2018 through March 2019 is:
Kosrae State: Ten of the past 16 months have been wetter than average on Kosrae (Figure KS-1). This represents a substantial and pro-longed recovery from the dry conditions experienced in 2016 (Figure KS-2). Kosrae had very heavy rainfall during March, with all recording locations (i.e., SAWRS, Utwe, Tofol and the Nautilus Hotel) reporting over 20 inches of rain. The March total of 29.00 inches at SAWRS was the 5th highest March total in its historical record. Despite the high rainfall, there were no reports of serious flooding or landslides. High water levels were noted in some rivers, and on one wet day, debris was caught under a bridge that caused flooding on the road to the airport. On the 29th of April, a flood warning was issued. On that day, 3.46 inches of rainfall was recorded at SAWRS. No reports were received by the PEAC of any problems during this event. Kosrae is one of the wettest locations in Micronesia. At 206 inches per year, the annual rainfall at Kosrae SAWRS is roughly equivalent to that on Palikir, Pohnpei Island (204 inches per year). Only at some unusual locations, such as the summit of Pohnpei’s highest mountain (Nahna Laud), are found higher values. A UOG project, in association with the Conservation Society of Pohnpei, measured 330 inches of rain per year on the summit of Nahna Laud! At Aasufou (a USGS rain gauge that was located at an elevation of 1,340 feet in the mountains of American Samoa), an annual average of 203.31 inches was ob-served. Hawaii holds the US-API record, where the annual rain-fall at Waialeale (a rain gauge located at 5, 148 feet elevation in the mountains of Kauai) averages 452 inches per year in a record that goes back to 1912.
% of long-term average Inclusive Period Pohnpei Island/ atolls Kapingamarangi
Apr – Jun 2018 110% 105%
Jul – Sep 2018 100% 100%
Oct – Dec 2018 110% 105%
Jan – Mar 2019 100% 110%
Pohnpei State Rainfall Summary: JFMA 2018 and 1st Quarter 2018
Station
Jan Feb Mar Apr 1st
QTR
Pohnpei WSO
Rain (Inches)
22.03 20.94 57.92 18.80 119.69
% of Average
169% 194% 428% 114% 320%
Rain (Inches)
20.00*
14.23 47.80 15.37 82.03 PNI
Airport % of Average
186% 160% 430% % 267%
Atolls of Phonpei State
Station
Oct Nov Dec 4thQ Annual
Nukuoro
Rain (Inches)
12.45 23.28 6.62 10.07 52.42
% of Average
106% 221% 49% 67% 146%
Pingelap
Rain (Inches)
16.39 13.02 40.32 10.73 80.46
% of Average
153% 147% 363% 79% 262%
Kapinga
Rain (Inches)
8.71 20.59 19.60 17.39 66.29
% of Average
79% 197% 153% 143% 193%
Figure PN-3. Infra-red satellite image showing the pre-Jelawat tropical dis-turbance passing through Pohnpei State. The “P” indi-cates the location of Pohnpei, and the “G” the location of Guam. The dotted circle broadly en-compasses the pre-Jelawat disturbance.
Page 14 Pacific ENSO Update
2nd Quarter, 2018
LOCAL SUMMARY AND FORECAST LOCAL SUMMARY AND FORECAST
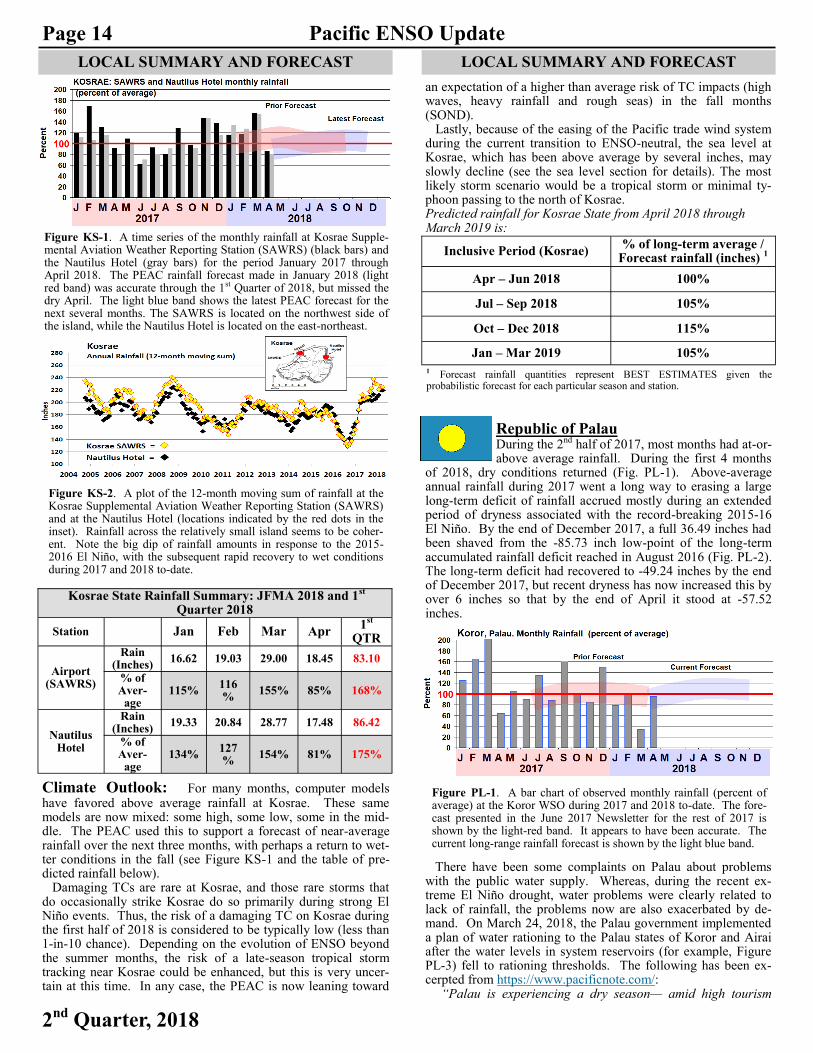
Climate Outlook: For many months, computer models have favored above average rainfall at Kosrae. These same models are now mixed: some high, some low, some in the mid-dle. The PEAC used this to support a forecast of near-average rainfall over the next three months, with perhaps a return to wet-ter conditions in the fall (see Figure KS-1 and the table of pre-dicted rainfall below). Damaging TCs are rare at Kosrae, and those rare storms that do occasionally strike Kosrae do so primarily during strong El Niño events. Thus, the risk of a damaging TC on Kosrae during the first half of 2018 is considered to be typically low (less than 1-in-10 chance). Depending on the evolution of ENSO beyond the summer months, the risk of a late-season tropical storm tracking near Kosrae could be enhanced, but this is very uncer-tain at this time. In any case, the PEAC is now leaning toward
an expectation of a higher than average risk of TC impacts (high waves, heavy rainfall and rough seas) in the fall months (SOND). Lastly, because of the easing of the Pacific trade wind system during the current transition to ENSO-neutral, the sea level at Kosrae, which has been above average by several inches, may slowly decline (see the sea level section for details). The most likely storm scenario would be a tropical storm or minimal ty-phoon passing to the north of Kosrae. Predicted rainfall for Kosrae State from April 2018 through March 2019 is:
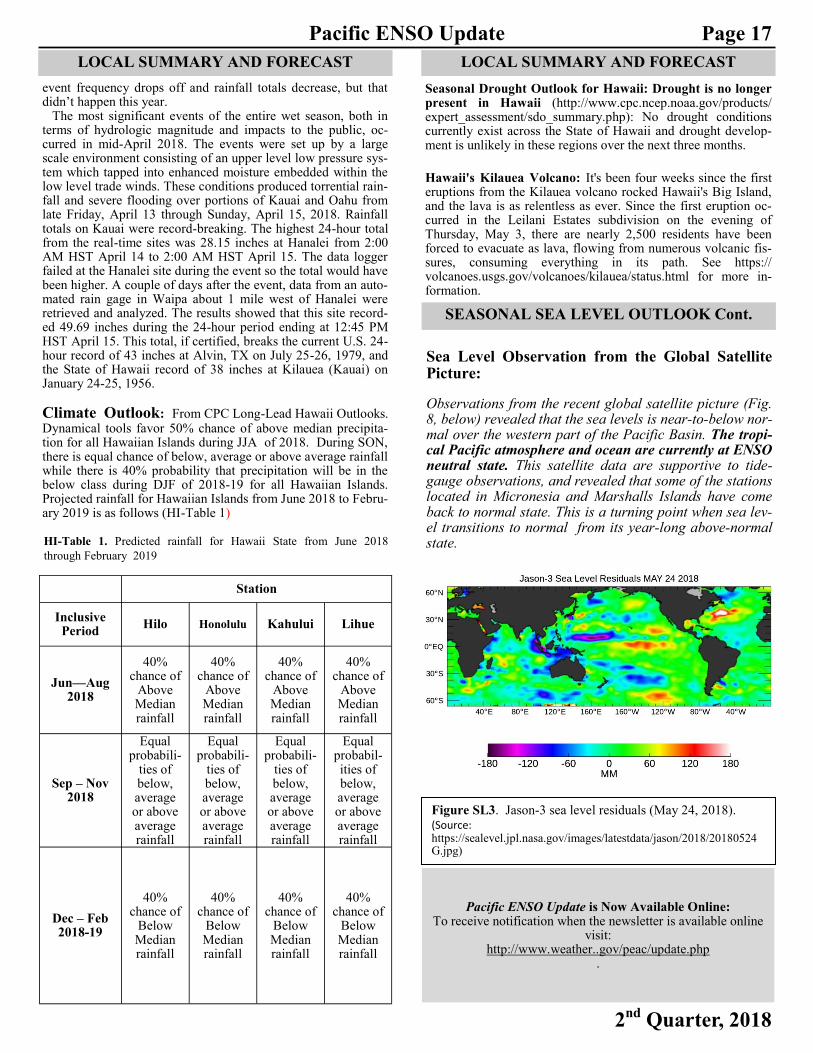
Republic of Palau During the 2nd half of 2017, most months had at-or-above average rainfall. During the first 4 months
of 2018, dry conditions returned (Fig. PL-1). Above-average annual rainfall during 2017 went a long way to erasing a large long-term deficit of rainfall accrued mostly during an extended period of dryness associated with the record-breaking 2015-16 El Niño. By the end of December 2017, a full 36.49 inches had been shaved from the -85.73 inch low-point of the long-term accumulated rainfall deficit reached in August 2016 (Fig. PL-2). The long-term deficit had recovered to -49.24 inches by the end of December 2017, but recent dryness has now increased this by over 6 inches so that by the end of April it stood at -57.52 inches.
There have been some complaints on Palau about problems with the public water supply. Whereas, during the recent ex-treme El Niño drought, water problems were clearly related to lack of rainfall, the problems now are also exacerbated by de-mand. On March 24, 2018, the Palau government implemented a plan of water rationing to the Palau states of Koror and Airai after the water levels in system reservoirs (for example, Figure PL-3) fell to rationing thresholds. The following has been ex-cerpted from https://www.pacificnote.com/: “Palau is experiencing a dry season— amid high tourism
Figure KS-1. A time series of the monthly rainfall at Kosrae Supple-mental Aviation Weather Reporting Station (SAWRS) (black bars) and the Nautilus Hotel (gray bars) for the period January 2017 through April 2018. The PEAC rainfall forecast made in January 2018 (light red band) was accurate through the 1st Quarter of 2018, but missed the dry April. The light blue band shows the latest PEAC forecast for the next several months. The SAWRS is located on the northwest side of the island, while the Nautilus Hotel is located on the east-northeast.
Figure KS-2. A plot of the 12-month moving sum of rainfall at the Kosrae Supplemental Aviation Weather Reporting Station (SAWRS) and at the Nautilus Hotel (locations indicated by the red dots in the inset). Rainfall across the relatively small island seems to be coher-ent. Note the big dip of rainfall amounts in response to the 2015-2016 El Niño, with the subsequent rapid recovery to wet conditions during 2017 and 2018 to-date.
Inclusive Period (Kosrae) % of long-term average /
Forecast rainfall (inches) 1
Apr – Jun 2018 100%
Jul – Sep 2018 105%
Oct – Dec 2018 115%
Jan – Mar 2019 105%
1 Forecast rainfall quantities represent BEST ESTIMATES given the probabilistic forecast for each particular season and station.
Figure PL-1. A bar chart of observed monthly rainfall (percent of average) at the Koror WSO during 2017 and 2018 to-date. The fore-cast presented in the June 2017 Newsletter for the rest of 2017 is shown by the light-red band. It appears to have been accurate. The current long-range rainfall forecast is shown by the light blue band.
Kosrae State Rainfall Summary: JFMA 2018 and 1st Quarter 2018
Station
Jan Feb Mar Apr 1st
QTR
Airport (SAWRS)
Rain (Inches)
16.62 19.03 29.00 18.45 83.10
% of Aver-
age 115%
116%
155% 85% 168%
Nautilus Hotel
Rain (Inches)
19.33 20.84 28.77 17.48 86.42
% of Aver-
age 134%
127%
154% 81% 175%

Page 15 Pacific ENSO Update
2nd Quarter, 2018
LOCAL SUMMARY AND FORECAST LOCAL SUMMARY AND FORECAST
season — with little rain for the past three months. The in-creased water use is also being attributed to the water levels decreasing. Koror and Airai have a combined population of 13,899.” In the past, Palau managed to cope with dry season despite lack of regard to water use. However, [because of] increasing water consumption, customers of the Koror-Airai Public Water System have been placed under mandatory water rationing. “The water rationing follows the National Emergency Com-mittee placing the Republic of Palau under ‘Water Shortage Warning –Stage 2’ that began on March 24.” Current water levels at Ngerimel Reservoir and Ngerikiil wa-ter sources- the two main water sources here, have fallen drasti-cally in recent weeks due to lack of rainfall and high consump-tion of water.” “As of March 24, 2018, Ngerimel Dam water level is at 10.5 feet (45 percent) and Ngerikiil Dam water level is at 7.9 feet (98 percent) with a total production percentage at 72 percent which puts Palau at Stage 2 (Warning) requiring mandatory actions of water rationing …”
Climate Outlook: Computer model forecasts continually indicated wet conditions for the Republic of Palau for nearly all of the monthly forecast cycles for 2017 and have continued to do so for all of 2018 so far. Using a blend of a declining influence of persistence with the computer projections, the PEAC believes that the rainfall at Palau should be at least near average for the remainder of 2018 and above average in the final months of the year. Low rainfall during the 1st Quarter of 2018 was unsuccess-fully anticipated by the models, but aggressive forecasts for above-average rainfall were tempered in the right direction by the PEAC team. With the long-range evolution of ENSO hinting at a move in the direction of El Niño, and with some climatic signals indicat-ing a possible enhancement to typhoon activity in Micronesia (see the TC section of the Current Conditions section), the
PEAC anticipates an elevation of the risk of impacts to Palau by the near passages of tropical storms and typhoons. The PEAC assesses the risk of potentially damaging effects from a passing TC at 10% (a 1-in-10 chance), through June 2018. This level of risk is near average. The risk is anticipated to rise in the final months of the year (OND) to 25% chance (to 1-in-4) for the occurrence of large TC-related waves (> 15 feet), gales (35 kt or greater) or very heavy rainfall (> 10 inches in 24 hours). Lastly, with the recent demise of La Niña the regional sea level fell quite dramatically from +6 inches above normal in March to zero (near average) in April (see the sea level section for details). Predicted rainfall for Palau from April 2018 through March 2019 is:
Republic of the Marshall Islands (RMI) During the final months of 2017 and continuing into January 2018, there was very heavy rainfall at
some of the atolls of the RMI. Some wet weather statistics in-clude:
(1) The January 2018 total rainfall at Kwajalein of 14.46 inches was the 2nd wettest January in their post WWII historical record; (2) The January rainfall of 15.76 inches at Majuro was the 7th wettest January in its 64-year historical record; (3) For multi-month totals, the 50.98 inches of rainfall at Kwaja-lein during the 5-month period December 2017 through April 2018 was the 3rd wettest such period in the historical record; and, (4) The 133.38 inches of rainfall at Majuro during the 8-month period September 2017 through April 2018 is the highest sum of rainfall over 8 months in that station’s 64-year historical record (see Figure RMI-1). Over the past two years (2016, 2017 and to-date in early 2018), the RMI has undergone substantial variations of rainfall. The pattern of rainfall variation was very similar during both
Figure PL-2. Over three years of
cumulative rainfall at Koror. Red line
shows the normal accumulated rainfall
from JAN 2015 through APR 2018,
and the dark blue line shows the ob-
served accumulated rainfall over the
same time period. The accumulated
deficit reached its extreme low of -
85.73 inches in August 2016. Abun-
dant rainfall in late 2016 and through
2017 erased 36 inches of the deficit
which stood at -49.24 inches in De-
cember 2017. Recent dryness has
once again slightly increased the long-
term deficit by about 6 inches to its
stand now at -57.52 inches.
Figure PL-3. The Ngerimel Reservoir in Palau, one of the main municipal water sources, is down to 13ft from the overflow at 23ft. (Photo con-tained in featured re-port in the March 25, 2018 web posting of the “Pacific Note” https://www.pacificnote.com
Republic of Palau Rainfall summary
JFMA 2018 and 1st Quarter 2018
Station Jan Feb Mar Apr 1st
QTR
Koror WSO
Rain (Inches)
8.83 9.03 2.75 8.25 20.16
% of avg.
76% 95% 33% 101% 70%
Intl. Airport
Rain (Inches)
10.78 10.27 3.92 7.61 24.97
% of avg.
88% 98% 43% % 79%
Mele-keok*
Rain (Inches)
6.32 7.95 4.06 5.21 18.33
% of avg.
57%* 83%* 49%* %* 63%*
Peleliu
Rain (Inches)
13.12 9.57 10.67 4.26 33.36
% of avg.
123% 105% 130% % 119%
Palau Inclusive Period % of long-term average /
Forecast rainfall (inches) 1
Apr-Jun 2018 100%
Jul-Sep 2018 110%
Oct-Nov 2018 120%
Jan-Mar 2019 100%
1 Forecast rainfall quantities represent BEST ESTIMATES given the probabilistic forecast for each particular season and station.

Page 16 Pacific ENSO Update
2nd Quarter, 2018
LOCAL SUMMARY AND FORECAST LOCAL SUMMARY AND FORECAST
2016 and 2017; with both years beginning very dry and then ending very wet (Figure RMI-1). For two years in a row, drought conditions were experienced in the northern atolls (e.g., at or north of Kwajalein). During early 2016, drought condi-tions were part of widespread dryness associated with El Niño. Then, in early 2017, there was another period of dryness that was most pronounced in the northern atolls. Once again in early 2018, some many of the northern atolls (i.e., Enewetak eastward to Utirik and Wotje) became dry. A drought statement was is-sued by the WFO Guam, but was short-lived as high rainfall occurred in the northern RMI in both March and April. No im-pacts from dryness were reported. Very heavy rainfall in the RMI early in the year is often asso-ciated with El Niño onset; however, a wet spring has also oc-curred during other phases of ENSO, thus limiting the useful-ness of this phenomenon as a predictor of El Niño. The heavy 2018 spring rains in the RMI are being treated as a red flag that the status of ENSO may soon shift to El Niño, and it was a fac-tor in the forecast of enhanced TC activity throughout Microne-sia in the 2nd half of 2018.
Climate Outlook: Recent computer model forecasts are still projecting above-average rainfall for at least the next three months at Kwajalein and, to a lesser extent, at Majuro. The PEAC team, in coordination with RMI partners, accepts these projections. The PEAC outlook for the northern RMI contained in the pre-vious ENSO newsletter was accurate: “The extreme dryness in the northern atolls of the RMI during the first half 2016 and again during the first half of 2017 is con-sidered to be an unusual combination of a major El Niño-related drought coupled with a follow-on localized drought. There are no factors at this time that would suggest yet another widespread or localized severe drought in the northern RMI, and indeed recent rainfall has been adequate for island water needs.”
Damaging TCs are rare in the RMI, and those rare storms that pass through the RMI do so primarily during strong El Niño events. Depending on the evolution of ENSO beyond the sum-mer months, the risk of a late-season tropical storm tracking through the RMI could be enhanced, but this is uncertain at this time. In any case, the PEAC is now leaning toward an expecta-tion of a higher-than-average risk of TC impacts (high waves, heavy rainfall and rough seas) in the fall months (SOND). The TC risk has two main scenarios: (1) a Central Pacific TC forms and is named to the south of Hawaii and then moves westward into or just north of the RMI; and (2) The western North Pacific monsoon trough undergoes an episodic extension into the RMI accompanied by the in-situ development of a monsoon depres-sion. Both these scenarios will be in-play late in 2018. Lastly, because of the easing of the Pacific trade wind system during the current transition to ENSO-neutral, the sea levels at Kwajalein and Majuro have fallen, substantially at Kwajalein (+ 7 inches in February to +1.7 inches in April (see the sea level section for details). Predicted rainfall for the atolls of the RMI from April 2018 through March 2019:
Hawaii: After a very wet February, the month of March started with fresh to strong trade winds followed
by the passage of a weak cold front on March 5. The front did not produce significant rainfall, but it did pull in a cool and sta-ble air mass within moderate to fresh northeasterly low level winds that persisted until March 13. April is the last month of the wet season for the Hawaiian Islands. Usually, heavy rain
Figure RMI-1A time series of rainfall at the WSO Majuro (gray bars) during 2016 through April 2018. Note two repeated dramatic rises from dry conditions early in the year to the return of abundant rainfall in the both fall of 2016 and the fall of 2017. The PEAC long-term forecast of rainfall made in June 2017 (light blue band) was reasonable.
Figure RMI-2. A 12-month moving sum of rainfall at Majuro Atoll. Note that by April 2018 the sum had risen to its 4th highest value in the historical record (red dot).
RMI Rainfall Summary: JFMA 2018 and 1st Quarter 2018
Station
Jan Feb Mar Apr 1st QTR
RMI Central and Southern Atolls
Majuro WSO
Inches 15.76 8.29 22.54 17.79 46.59
% Avg 187% 135% 272% 173% 204%
Ailing Inches 10.78 4.32 9.77 8.85 24.87
% Avg 166% 92% 158% 99% 143%
Jaluit Inches 7.80 8.19 11.02 6.48 27.01
% Avg 93% 133% 133% 63% 118%
Mili Inches 10.66 7.06 16.35 20.16 34.07
% Avg 126% 115% 197% 196% 149%
RMI Northern Atolls
Kwajalein Inches 14.46 4.20 15.55 12.05 34.21
% Avg 317% 130% 379% 160% 288%
Wotje Inches 4.37 2.00 10.61 15.92 16.98
% Avg 199% 95% 379% 408% 239%
Utirik Inches 3.56 0.61 8.50 7.43 12.67
% Avg 175% 31% 328% 206% 193%
Inclusive Period
% of long-term average
South of 6ºN 6ºN to 8ºN North of 8ºN*
Apr-Jun 2018 110% 120% 115%
Jul - Sep 2018 100% 110% 110%
Oct - Dec 2018 100% 120% 120%
Jan - Mar 2019 110% 115% 110%
Page 17 Pacific ENSO Update
2nd Quarter, 2018
LOCAL SUMMARY AND FORECAST LOCAL SUMMARY AND FORECAST
Figure SL3. Jason-3 sea level residuals (May 24, 2018). (Source: https://sealevel.jpl.nasa.gov/images/latestdata/jason/2018/20180524G.jpg)
event frequency drops off and rainfall totals decrease, but that didn’t happen this year. The most significant events of the entire wet season, both in terms of hydrologic magnitude and impacts to the public, oc-curred in mid-April 2018. The events were set up by a large scale environment consisting of an upper level low pressure sys-tem which tapped into enhanced moisture embedded within the low level trade winds. These conditions produced torrential rain-fall and severe flooding over portions of Kauai and Oahu from late Friday, April 13 through Sunday, April 15, 2018. Rainfall totals on Kauai were record-breaking. The highest 24-hour total from the real-time sites was 28.15 inches at Hanalei from 2:00 AM HST April 14 to 2:00 AM HST April 15. The data logger failed at the Hanalei site during the event so the total would have been higher. A couple of days after the event, data from an auto-mated rain gage in Waipa about 1 mile west of Hanalei were retrieved and analyzed. The results showed that this site record-ed 49.69 inches during the 24-hour period ending at 12:45 PM HST April 15. This total, if certified, breaks the current U.S. 24-hour record of 43 inches at Alvin, TX on July 25-26, 1979, and the State of Hawaii record of 38 inches at Kilauea (Kauai) on January 24-25, 1956.
Climate Outlook: From CPC Long-Lead Hawaii Outlooks. Dynamical tools favor 50% chance of above median precipita-tion for all Hawaiian Islands during JJA of 2018. During SON, there is equal chance of below, average or above average rainfall while there is 40% probability that precipitation will be in the below class during DJF of 2018-19 for all Hawaiian Islands. Projected rainfall for Hawaiian Islands from June 2018 to Febru-ary 2019 is as follows (HI-Table 1)
Station
Inclusive Period
Hilo Honolulu Kahului Lihue
Jun—Aug 2018
40% chance of
Above Median rainfall
40% chance of
Above Median rainfall
40% chance of
Above Median rainfall
40% chance of
Above Median rainfall
Sep – Nov 2018
Equal probabili-
ties of below, average or above average rainfall
Equal probabili-
ties of below, average or above average rainfall
Equal probabili-
ties of below, average or above average rainfall
Equal probabil-ities of below, average or above average rainfall
Dec – Feb 2018-19
40% chance of
Below Median rainfall
40% chance of
Below Median rainfall
40% chance of
Below Median rainfall
40% chance of
Below Median rainfall
HI-Table 1. Predicted rainfall for Hawaii State from June 2018
through February 2019
SEASONAL SEA LEVEL OUTLOOK Cont.
Sea Level Observation from the Global Satellite Picture:
Observations from the recent global satellite picture (Fig. 8, below) revealed that the sea levels is near-to-below nor-mal over the western part of the Pacific Basin. The tropi-cal Pacific atmosphere and ocean are currently at ENSO neutral state. This satellite data are supportive to tide-gauge observations, and revealed that some of the stations located in Micronesia and Marshalls Islands have come back to normal state. This is a turning point when sea lev-el transitions to normal from its year-long above-normal state.
Pacific ENSO Update is Now Available Online: To receive notification when the newsletter is available online
visit: http://www.weather..gov/peac/update.php
.
Seasonal Drought Outlook for Hawaii: Drought is no longer present in Hawaii (http://www.cpc.ncep.noaa.gov/products/expert_assessment/sdo_summary.php): No drought conditions currently exist across the State of Hawaii and drought develop-ment is unlikely in these regions over the next three months.
Hawaii's Kilauea Volcano: It's been four weeks since the first eruptions from the Kilauea volcano rocked Hawaii's Big Island, and the lava is as relentless as ever. Since the first eruption oc-curred in the Leilani Estates subdivision on the evening of Thursday, May 3, there are nearly 2,500 residents have been forced to evacuate as lava, flowing from numerous volcanic fis-sures, consuming everything in its path. See https://volcanoes.usgs.gov/volcanoes/kilauea/status.html for more in-formation.

Page 18 Pacific ENSO Update
2nd Quarter, 2018
The Pacific ENSO Update is a bulletin of the Pacific El Niño-Southern Oscillation (ENSO) Applications Climate (PEAC) Center. PEAC conducts research & produces information products on climate variability related to the ENSO climate cycle in the U.S. Affiliated Pacific Islands (USAPI). This bulletin is intended to supply information for the benefit of those involved in such climate-sensitive sectors as civil defense, resource management, and developmental planning in the various jurisdictions of the USAPI.
The Pacific ENSO Update is produced quarterly both online and in hard copy, with additional special reports on important changes in ENSO conditions as needed. For more information about this issue please contact the PEAC Center at [email protected] or at the address listed below.
PEAC is part of the Weather Forecast Office (WFO) Honolulu’s mission and roles/responsibilities. All oversight and direction for PEAC is provided by the Weather Forecast Office Honolulu in collaboration with the Joint Institute for Marine and Atmospheric Research (JIMAR) at the University of Hawaii. Publication of the Pacific ENSO Update is supported by the National Oceanic and Atmospheric Administration (NOAA), National Weather Service-Pacific Region Climate Services. The views expressed herein are those of the authors and do not necessarily reflect the views of NOAA, any of its sub-agencies, or cooperating organizations.
ACKNOWLEDGEMENTS AND FURTHER INFORMATION
Pacific ENSO Applications Climate (PEAC) Center: HIG #340, 2525 Correa Road, Honolulu, Hawai’i 96822 Contact at 808-956-2324: for information on PEAC, the Pacific ENSO Update and ENSO-related climate data for the Pacific Islands. Dr. Rashed Chowdhury, Principal Research Scientist, at 808-956-2324 ([email protected]): for infor-mation on ENSO and sea level variability in the USAPI.
University of Hawai’i - Joint Institute of Marine and Atmospheric Research (JIMAR), School of Ocean and Earth Science and Technology (SOEST), MSB #317, 1000 Pope Road , Honolulu, Hawai’i 96822 Dr. Jim Potemra, PEAC Principal Investigator at [email protected] for more information on climate in Hawai’i.
NOAA National Weather Service Weather Forecast Office (WFO) Honolulu: HIG #250, 2525 Correa Rd., Honolulu, HI, 96822 Tom Evans, PEAC Director, at 808-973-5270: for information related to NWS.
NOAA National Weather Service—Weather Forecast Office (WFO) Guam: 3232 Hueneme Road, Barrigada, Guam, 96913 Chip Guard, Warning Coordination Meteorologist, at 671-472-0900: for information on tropical cyclones and climate in the USAPI.
University of Guam - Water and Environmental Research Institute (WERI): UOG Station, Mangilao, Guam 96913 Dr. Mark Lander, PEAC Meteorologist, at 671-735-2685 for: information on tropical cyclones and climate in the USAPI.
Pacific ENSO Update Editors: Joseph Brinkley and Rashed Chowdhury
SEASONAL RAINFALL OUTLOOK FOR THE US-AFFILIATED PACFIC ISLANDS In
ch
es
2016 3rd QTR (JAS) Rainfall. Percent of Average.
% o
f N
orm
al
2)
626%
Figure 1. 2017 First Quarter (JFM) rainfall amounts in inches at the indicated locations . Figure 2. 2017 First Quarter rainfall as a percent-of-average at the indicated locations. Note the strong pattern of dry-west, wet-east across Micronesia. The northern RMI atolls of Utirik and Wotje recovered nicely from dry conditions earlier in the year.
1.
2.