p6 eppm user's guide
DESCRIPTION
Primavera R8TRANSCRIPT

PP66 EEPPPPMM UUsseerr''ss GGuuiiddee
RReelleeaassee 88..00

2
Copyright © 2010, Oracle and/or its affiliates. All rights reserved.
The Programs (which include both the software and documentation) contain proprietary
information; they are provided under a license agreement containing restrictions on use
and disclosure and are also protected by copyright, patent, and other intellectual and
industrial property laws. Reverse engineering, disassembly, or decompilation of the
Programs, except to the extent required to obtain interoperability with other
independently created software or as specified by law, is prohibited.
The information contained in this document is subject to change without notice. If you
find any problems in the documentation, please report them to us in writing. This
document is not warranted to be error-free. Except as may be expressly permitted in your
license agreement for these Programs, no part of these Programs may be reproduced or
transmitted in any form or by any means, electronic or mechanical, for any purpose.
The platform-specific hardware and software requirements included in this document
were current when this document was published. However, because new platforms and
operating system software versions might be certified after this document is published,
review the certification matrix on the My Oracle Support (formerly OracleMetaLink) Web
site for the most up-to-date list of certified hardware platforms and operating system
versions. The My Oracle Support (formerly OracleMetaLink) Web site is available at the
following URL:
http://metalink.oracle.com/
or
http://support.oracle.com/
If the Programs are delivered to the United States Government or anyone licensing or
using the Programs on behalf of the United States Government, the following notice is
applicable: U.S. GOVERNMENT RIGHTS Programs, software, databases, and related
documentation and technical data delivered to U.S. Government customers are
"commercial computer software" or "commercial technical data" pursuant to the
applicable Federal Acquisition Regulation and agency-specific supplemental
regulations. As such, use, duplication, disclosure, modification, and adaptation of the
Programs, including documentation and technical data, shall be subject to the licensing
restrictions set forth in the applicable Oracle license agreement, and, to the extent
applicable, the additional rights set forth in FAR 52.227-19, Commercial Computer
Software -- Restricted Rights (June 1987). Oracle USA, Inc., 500 Oracle Parkway,
Redwood City, CA 94065.
Copyright

Copyright
3
The Programs are not intended for use in any nuclear, aviation, mass transit, medical, or
other inherently dangerous applications. It shall be the licensee's responsibility to take all
appropriate fail-safe, backup, redundancy and other measures to ensure the safe use of
such applications if the Programs are used for such purposes, and we disclaim liability for
any damages caused by such use of the Programs.
Oracle and Primavera are registered trademarks of Oracle Corporation and/or its
affiliates. Other names may be trademarks of their respective owners. The Programs may
provide links to Web sites and access to content, products, and services from third
parties. Oracle is not responsible for the availability of, or any content provided on,
third-party Web sites. You bear all risks associated with the use of such content. If you
choose to purchase any products or services from a third party, the relationship is directly
between you and the third party. Oracle is not responsible for: (a) the quality of
third-party products or services; or (b) fulfilling any of the terms of the agreement with the
third party, including delivery of products or services and warranty obligations related to
purchased products or services. Oracle is not responsible for any loss or damage of any
sort that you may incur from dealing with any third party.
To view the P6 Commercial Notices and Disclosures for Documentation, go to the
\Documentation\<language>\Notices and Disclosures folder of the P6 physical media
or download.


5
Contents
Copyright ........................................................................................................................................... 2
Preface ............................................................................................................................................ 17
About Oracle Primavera P6 Enterprise Project Portfolio Management ....................................... 17
Working with Oracle Primavera P6 Enterprise Project Portfolio Management Suite .................. 18
About P6 ..................................................................................................................................... 20 About P6 Professional................................................................................................................ 21 About P6 Progress Reporter ...................................................................................................... 22 About the Oracle Business Process Management Suite ......................................................... 22 About Oracle BI Publisher and the OBIEE Platform ................................................................. 23 About P6 Reporting Database ................................................................................................... 23 About P6 Analytics ..................................................................................................................... 23 About the P6 Integration API ..................................................................................................... 25 About P6 Web Services .............................................................................................................. 25 About Oracle Universal Content Management ......................................................................... 25
P6 EPPM Release 8 New Feature Summary ................................................................................. 26
Web Administration and Configuration ..................................................................................... 26 Easy Web Setup, Configuration, and Administration........................................................ 26 Web-Based User Administration ........................................................................................ 27 One Source for All Enterprise Data .................................................................................... 27
Project and Portfolio Management ........................................................................................... 29 Web-Based EPS and Project Views ................................................................................... 29 Enhanced Portfolio Filtering .............................................................................................. 29 Schedule Preview ............................................................................................................... 29 Recalculate Assignment Costs .......................................................................................... 30 Project Baselines ................................................................................................................ 30
Project Templates ...................................................................................................................... 30 Reusable Project Templates .............................................................................................. 30
Resource Management ............................................................................................................. 31 Completely Redesigned Resource and Role UI ................................................................ 31 Improved Resource Planning and Analysis ....................................................................... 31 Optimized Resource and Role Team Handling ................................................................. 31
Risk Management ...................................................................................................................... 31 Qualitative Risk Management ........................................................................................... 31 Risk Scoring Matrix, Categories, and Thresholds ............................................................. 32
Enterprise Reporting .................................................................................................................. 32 Integrated On-Demand or Scheduled Reports ................................................................. 32
Workflow ..................................................................................................................................... 33 Oracle BPM Integration ...................................................................................................... 33
Technological Advances ............................................................................................................ 34 Integrated LDAP Provisioning ............................................................................................ 34 Enhanced and Expanded Job Services ............................................................................. 34 Expanded Event Support ................................................................................................... 35 Integration Ready ............................................................................................................... 35 P6 Web Services Security Enhancements ........................................................................ 35 Platforms............................................................................................................................. 35
User Productivity ........................................................................................................................ 36

P6 EPPM User's Guide
6
Auto-Complete Field Values ............................................................................................... 36 Customizable Toolbars ....................................................................................................... 36 Enhanced Activity, Assignment, and EPS Filters .............................................................. 36 E-mail Activity Views ........................................................................................................... 37 Keyboard Shortcuts ............................................................................................................ 37 Menus and Icons ................................................................................................................ 37 Redesigned Detail Windows .............................................................................................. 37
Learning Assistance ................................................................................................................... 38 Completely Redesigned Online Help ................................................................................. 38 UPK Multimedia Tutorials .................................................................................................. 38
P6 Professional .......................................................................................................................... 38 Timescaled Logic Diagrams ............................................................................................... 38 Tabbed Views ...................................................................................................................... 38 Customizable Menus .......................................................................................................... 39 Customizable Toolbars ....................................................................................................... 39 Page Breaks by Group Band .............................................................................................. 39 Apply Actuals and Summarize Project Now Run as Services ........................................... 39 Auto-Refresh Grouped Data by Window ............................................................................ 39 Client-Web Delineation and Integration ............................................................................ 39 Streamlined Installer .......................................................................................................... 40 Improved HTML Editor ....................................................................................................... 40 Command Line Support ..................................................................................................... 40
P6 EPPM Documentation ............................................................................................................... 40
Where to Get Support ..................................................................................................................... 43
Implementation Strategy ................................................................................................................ 45
Roles and Responsibilities ............................................................................................................. 45
Set Your Goals and Business Objectives ....................................................................................... 47
Develop an Implementation Strategy ............................................................................................ 47
Assess Needs .................................................................................................................................. 49
Communicate the Plan ................................................................................................................... 51
The Implementation Process .......................................................................................................... 53
Understanding Data Structures in P6 EPPM ................................................................................. 53
Connecting Data Structures ........................................................................................................... 55
Structuring Projects ........................................................................................................................ 57
Process Overview: Structuring Data in P6 EPPM .......................................................................... 57
Setting Up the Enterprise Project Structure .................................................................................. 58
About the Enterprise Project Structure (EPS) ........................................................................... 58 Working with the EPS ......................................................................................................... 59 Creating EPS Elements ...................................................................................................... 61 Configuring the EPS............................................................................................................ 61
About Projects ............................................................................................................................ 62 Creating Projects ................................................................................................................ 62 Creating Projects from Existing Projects or Templates .................................................... 63 Deleting Projects or EPSs .................................................................................................. 64 Opening Projects or Templates in the EPS ....................................................................... 64 Customizing Detail Windows ............................................................................................. 65 Configuring Project Preferences ........................................................................................ 66 Configuring Project Calculations........................................................................................ 66

Contents
7
Linking P6 and Contract Management Projects ............................................................... 67
Configuring Project Defaults .............................................................................................. 67
Configuring General Project Preferences .......................................................................... 68
Configuring P6 Progress Reporter ..................................................................................... 68
Configuring Project Summarization ................................................................................... 68
About Project Templates ............................................................................................................ 69 Working with Project Templates ........................................................................................ 69 Creating Project Templates................................................................................................ 70
Setting Up the Organizational Breakdown Structure .................................................................... 71
About the OBS ............................................................................................................................ 71 Creating an OBS ................................................................................................................. 71 Assigning Users to an OBS ................................................................................................. 72
Defining Resources and Roles ....................................................................................................... 73
About Roles ................................................................................................................................ 73 Creating Roles ............................................................................................................................ 73 Assigning a Resource to a Role ................................................................................................. 74 Assigning a Role Team to a Role ............................................................................................... 75 Assigning Rates to Roles ........................................................................................................... 75 Assigning Work Limits to Roles ................................................................................................. 76 About Role Teams ...................................................................................................................... 77 Creating Role Teams .................................................................................................................. 77 Assigning a Role to a Role Team ............................................................................................... 77 About Resources ........................................................................................................................ 78 Adding Resources ...................................................................................................................... 78 Assigning a Role to a Resource ................................................................................................. 79 Assigning a Resource Team to a Resource .............................................................................. 80 Configuring Resource Settings .................................................................................................. 81 Assigning Calendars to Resources ............................................................................................ 82 Configuring Timesheet Reporting for Resources ..................................................................... 82
Configuring Resource Settings for Timesheet Reporting ................................................. 83 Assigning Resource Codes ........................................................................................................ 84 Assigning Resource Rates ......................................................................................................... 85 Assigning Resource Curves to Resource or Role Assignments from the Resources Assignments
Page ............................................................................................................................................ 85 About Resource Teams .............................................................................................................. 86 Creating Resource Teams ......................................................................................................... 86 Assigning a Resource to a Resource Team .............................................................................. 87
Setting Up The Work Breakdown Structure ................................................................................... 88
About Work Breakdown Structures (WBS) ................................................................................ 88 Working with WBS Elements .............................................................................................. 88 Creating a WBS ................................................................................................................... 89 Adding a WBS from Template ............................................................................................ 90 Configuring General WBS Information .............................................................................. 90
Establishing Project Codes ............................................................................................................. 91
About Project Codes ................................................................................................................... 91 Working with Project Codes ....................................................................................................... 91 Creating Project Codes .............................................................................................................. 94

P6 EPPM User's Guide
8
Creating Project Code Values .................................................................................................... 94 Assigning Project Codes............................................................................................................. 95
Working With User Defined fields ................................................................................................... 95
About User Defined Fields ......................................................................................................... 95 Creating Activity UDFs ........................................................................................................ 96 Creating Assignment UDFs ................................................................................................ 96 Creating Document UDFs................................................................................................... 96 Creating Expense UDFs ...................................................................................................... 97 Creating Issue UDFs ........................................................................................................... 97 Creating Project UDFs ........................................................................................................ 97 Creating Resource UDFs .................................................................................................... 98 Creating Risk UDFs ............................................................................................................. 99 Creating Step UDFs ............................................................................................................ 99 Creating WBS UDFs ............................................................................................................ 99 Defining Formulas for User Defined Fields ..................................................................... 100 Defining Indicators for User Defined Fields .................................................................... 100 Defining Statements for User Defined Fields ................................................................. 101
About Calendars ............................................................................................................................ 103
Working with Calendars ........................................................................................................... 103 Creating Global Calendars ....................................................................................................... 104 Configuring Global Calendars .................................................................................................. 104
Setting Work Hours Per Time Period for Global Calendars ............................................ 104 Configuring the Standard Work Week for Global Calendars .......................................... 105 Modifying Calendar Days on Global Calendars .............................................................. 105 Setting the Default Global Calendar ............................................................................... 105
Creating Project Calendars ...................................................................................................... 106 Configuring Project Calendars ................................................................................................. 106
Assigning a Base Calendar to a Project Calendar .......................................................... 106 Setting Work Hours Per Period for a Project Calendar ................................................... 107 Configuring the Standard Work Week for Project Calendars ......................................... 107 Modifying Calendar Days on Project Calendars.............................................................. 108 Changing a Project Calendar to a Global Calendar ........................................................ 108
Creating Resource Calendars .................................................................................................. 109 Configuring Resource Calendars ............................................................................................. 110
Assigning a Base Calendar to a Resource Calendar ...................................................... 110 Assigning a Resource to a Resource Calendar ............................................................... 110 Setting Work Hours Per Time Period for a Resource Calendar ..................................... 111 Configuring the Standard Work Week for Resource Calendars ..................................... 111 Modifying Calendar Days ................................................................................................. 112 Changing the Calendar Type ............................................................................................ 112
Implementing the Schedule .......................................................................................................... 115
Establishing Activity Codes ........................................................................................................... 116
About Activity Codes ................................................................................................................. 116 Working with Activity Codes ..................................................................................................... 116
Creating Activity Codes ..................................................................................................... 118 Creating Activity Code Values .......................................................................................... 119 Creating Activity Code Values for Activities ..................................................................... 120
About Activities .............................................................................................................................. 121
Working with Activities ............................................................................................................. 121 Creating Activities ..................................................................................................................... 122

Contents
9
Configuring General Activity Information ................................................................................ 123 Recalculating Assignment Costs ............................................................................................. 124 Sending Project Data to ERP ................................................................................................... 125 Customizing Detail Windows ................................................................................................... 125
About Activity Types ....................................................................................................................... 126
About WBS Summary Activities .................................................................................................... 127
About Gantt Charts ........................................................................................................................ 127
Working with the Activity Gantt Chart ..................................................................................... 127 Configuring Gantt Charts ......................................................................................................... 128
About the Activity Table ................................................................................................................. 129
About Activity Networks ................................................................................................................ 129
Working with Activities in the Activity Network ....................................................................... 130
About Calendar View ..................................................................................................................... 131
Working with Activities in Calendar View ................................................................................ 132
About Progress Spotlight .............................................................................................................. 133
About Relationship Lines .............................................................................................................. 133
About Progress Lines .................................................................................................................... 133
About Activity Views ....................................................................................................................... 134
Working with Activity Views ...................................................................................................... 134 Creating Views .......................................................................................................................... 135 Configuring Activity Views ........................................................................................................ 136
Configuring Activity View Columns................................................................................... 137 Configuring Activity View Grouping .................................................................................. 137 Configuring Activity View Filters ....................................................................................... 138 Applying Filters ................................................................................................................. 139
Creating Filters ................................................................................................................. 140
Configuring Filters ............................................................................................................ 141
Configuring Activity View Bars.......................................................................................... 141 Configuring Activity View Gantt Chart .............................................................................. 142 Configuring Activity Network ............................................................................................ 143 Configuring Activity View Access ...................................................................................... 143
Sending E-Mail of an Activity View........................................................................................... 144
About Grouping and Sorting ......................................................................................................... 145
About Resource Assignments ....................................................................................................... 145
Assigning Activity Resources ................................................................................................... 145 Configuring Activity Resources ................................................................................................ 146 Requesting Resources for Activities ....................................................................................... 147 Specifying Resource Assignment Rates ................................................................................. 147 Adding Activity Resource Estimates ........................................................................................ 148
Assigning Activity Roles ................................................................................................................. 148
Configuring Activity Roles.............................................................................................................. 149
Assigning Resource Curves to Resource or Role Assignments from the Activities Page ......... 150
About Activity Codes ...................................................................................................................... 151
Creating Activity Code Values for Activities ............................................................................ 151 Assigning Activity Code Values to Activities ............................................................................ 152

P6 EPPM User's Guide
10
About Expenses ............................................................................................................................. 153
Creating Expenses ................................................................................................................... 153 Configuring Expenses .............................................................................................................. 153 Configuring Auto Compute Actuals for Expenses ................................................................... 154
About Feedback ............................................................................................................................. 154
Adding Feedback ...................................................................................................................... 154 Adding the New Feedback Column ......................................................................................... 155 Acknowledging Feedback ........................................................................................................ 156
About Status .................................................................................................................................. 157
Configuring Status .................................................................................................................... 157 Configuring Status Units and Costs ........................................................................................ 157
About Duration Types .................................................................................................................... 158
Working with Duration Types ................................................................................................... 159 Configuring Status Durations .................................................................................................. 159
About Constraints .......................................................................................................................... 160
Working with Activity Constraints ............................................................................................ 160 Configuring Status Constraints ............................................................................................... 161
About Issues .................................................................................................................................. 161
Creating Activity Issues ............................................................................................................ 162 Configuring Activity Issues ....................................................................................................... 163
About Notebooks ........................................................................................................................... 163
Working with Notebooks .......................................................................................................... 163
About Notebook Topics ................................................................................................................. 164
Assigning Notebook Topics ...................................................................................................... 164
About Relationships ...................................................................................................................... 164
Creating Activity Relationships ................................................................................................ 165 Configuring Activity Relationships ........................................................................................... 166 Assigning Predecessor Relationships ..................................................................................... 167 Configuring Predecessor Relationships .................................................................................. 167 Assigning Successor Relationships ......................................................................................... 168 Configuring Successor Relationships ..................................................................................... 169
About Risks .................................................................................................................................... 170
Working with Project Risks ...................................................................................................... 170 Assigning a Risk to an Activity ................................................................................................. 172
About Steps ................................................................................................................................... 172
Working with Activity Steps ...................................................................................................... 172 Creating Activity Steps ............................................................................................................. 173 Configuring Activity Steps ........................................................................................................ 174
About Step Templates ................................................................................................................... 174
Adding Activity Steps from a Step Template .......................................................................... 175
About Trace Logic .......................................................................................................................... 175
Viewing Relationships with Trace Logic .................................................................................. 176
About Budget Change Logs .......................................................................................................... 176
Creating Budget Change Requests ......................................................................................... 177 Approving/Denying Budget Change Requests ..................................................................... 177

Contents
11
About Earned Value ....................................................................................................................... 178
Configuring WBS Earned Value ............................................................................................... 179
About Milestones ........................................................................................................................... 179
Creating WBS Milestones ........................................................................................................ 180
About Cost Accounts ..................................................................................................................... 180
Creating Cost Accounts ............................................................................................................ 181
About Expenses ............................................................................................................................. 181
Creating Expense Categories .................................................................................................. 181
Managing the Schedule ................................................................................................................ 183
About Baselines ............................................................................................................................. 183
Working with Baselines ............................................................................................................ 184 Creating Baselines ................................................................................................................... 185
About Critical Path Activities ......................................................................................................... 186
Working with Critical Path Activities ........................................................................................ 187
About Schedule Preview ............................................................................................................... 188
Enabling Schedule Preview ..................................................................................................... 188
About Resource Leveling .............................................................................................................. 189
Leveling Resources .................................................................................................................. 189 Configuring Resource Leveling Options and Priorities ................................................... 190
About The Apply Actuals Feature .................................................................................................. 192
Working with the Apply Actuals Feature ................................................................................. 192 Applying Actuals to a Project ................................................................................................... 194
About Updating Progress .............................................................................................................. 195
Working with Updating Progress ............................................................................................. 195 About Suspending and Resuming Activities ........................................................................... 196
About the Auto Compute Actuals Feature.................................................................................... 196
Working with the Auto-Compute Actuals Feature................................................................... 196 Applying Auto Compute Actuals to Activities .......................................................................... 197
About Store Period Performance .................................................................................................. 198
Storing Period Performance .................................................................................................... 198
About the Summarizer Service ..................................................................................................... 199
Working with the Summarizer Service .................................................................................... 199 Summarizing Projects .............................................................................................................. 200
Issues ............................................................................................................................................. 201
About Issues ............................................................................................................................. 201 Working with Issues ......................................................................................................... 201 Creating Project Issues .................................................................................................... 202 Configuring Project Issues ............................................................................................... 203 Customizing Project Issues .............................................................................................. 203 Assigning Related Items to Issues................................................................................... 204 Sending E-Mail about Issues ........................................................................................... 205
About Issue Codes ................................................................................................................... 206 Assigning Issue Codes...................................................................................................... 206
About Issue Forms ................................................................................................................... 206 Creating Issue Forms ....................................................................................................... 207

P6 EPPM User's Guide
12
Assigning Projects to Issue Forms ................................................................................... 208
Risks ............................................................................................................................................... 208
About Risks ............................................................................................................................... 208 Working with Risk Scoring Matrices ........................................................................................ 209
Configuring Risk Enterprise Data .................................................................................... 212 Creating Risk Thresholds ................................................................................................. 212
Modifying Risk Thresholds ............................................................................................... 213 Creating Risk Scoring Matrices........................................................................................ 213
Assigning a Risk Scoring Matrix to a Project ................................................................... 214
Creating Risk Categories .................................................................................................. 215
Creating Risk UDFs ........................................................................................................... 215
Working with Project Risks ...................................................................................................... 216 Managing Project Risks ................................................................................................... 218 Creating Project Risks ...................................................................................................... 218
Adding Detailed Project-Level Risks ................................................................................ 218 Adding Project Risks to Activities .................................................................................... 219 Adding High-Level Project Risks ...................................................................................... 220 Assigning a Risk to an Activity ......................................................................................... 221
About Risk Response Plans ............................................................................................. 221
Working with Risk Response Plans ................................................................................. 222
Developing a Risk Response Plan ................................................................................... 223 Adding Risk Response Plans ........................................................................................... 223 Adding Risk Response Plan Action Items ....................................................................... 224 Assigning Activities to Risk Response Plan Action Items ............................................... 225
About Documents .......................................................................................................................... 225
Assigning Documents to Activities .......................................................................................... 226
About Workflows ............................................................................................................................ 226
Working with Workflows ........................................................................................................... 227 Participating in Workflows ....................................................................................................... 230
Customizing the P6 User Experience ............................................................................................ 231
About the User Interface ............................................................................................................... 232
Working with the P6 User Interface ........................................................................................ 232 About Screen Controls ..................................................................................................... 235 Working with the Main Menus ......................................................................................... 235 About the Most Recently Used List.................................................................................. 237
Working with Tables ......................................................................................................... 238 About Columns (Fields) .................................................................................................... 239
Showing or Hiding Columns in a Table ............................................................................ 239 Configuring Columns or Values ....................................................................................... 239 Working with Toolbars ...................................................................................................... 240 Customizing Toolbars ....................................................................................................... 241
Working with "Select a Value" Dialog Boxes ................................................................... 242 Selecting Values from "Select a Value" Dialog Boxes .................................................... 244
Working with Data in P6................................................................................................... 245 Working with Detail Windows .......................................................................................... 246

Contents
13
About Portlets ................................................................................................................... 248 About Data Entry Controls ................................................................................................ 248
Printing Pages Using P6 Printing Tools ........................................................................................ 248
Printing Pages Using Your Web Browser ...................................................................................... 249
Managing Project Portfolios .......................................................................................................... 251
About Portfolios ............................................................................................................................. 251
Working with Portfolios ................................................................................................................. 251
Creating Portfolios .................................................................................................................... 252 Creating Projects While Working with Portfolios .................................................................... 253 Creating Projects in a Portfolio View Scorecard Portlet ......................................................... 253 Creating Projects on the Portfolio Analysis Page ................................................................... 254 Assigning Projects to a Portfolio .............................................................................................. 254 Defining Performance Thresholds........................................................................................... 255
Portfolio Views ............................................................................................................................... 257
About Portfolio Views ............................................................................................................... 257 Working with Portfolio Views ................................................................................................... 257
Creating Portfolio Views ................................................................................................... 258 Working with Portfolio View Scorecards ................................................................................. 258 Working with Portfolio View Bubble Charts ............................................................................ 261 Working with Portfolio View Pie Charts ................................................................................... 263 Working with Portfolio View Histograms ................................................................................. 265
About Portfolio Scenarios ............................................................................................................. 266
About What-if Analysis................................................................................................................... 266
Working with Portfolio Scenarios ................................................................................................. 267
Creating Portfolio Scenarios .................................................................................................... 267
Capacity Planning .......................................................................................................................... 268
About Capacity Planning .......................................................................................................... 268 Working with the Capacity Planning Page .............................................................................. 268
Analyzing Role Allocation (Capacity Planning) ................................................................ 270
Using Reports ............................................................................................................................... 273
About Reports ................................................................................................................................ 273
Working with Reports ............................................................................................................... 274 Scheduling Reports .................................................................................................................. 275 Running Reports On-Demand.................................................................................................. 276 Viewing the Report Run History ............................................................................................... 277 Pre-defined BI Publisher Reports ............................................................................................ 277
Introducing P6 Progress Reporter ................................................................................................ 285
What Can I Do with P6 Progress Reporter? ................................................................................. 285
Working in Timesheet View ........................................................................................................... 285
Overview of Timesheet View .................................................................................................... 285 Opening a Timesheet ............................................................................................................... 286 Navigating in a Timesheet ....................................................................................................... 287 Adding Activities to a Timesheet ............................................................................................. 288 Assigning Yourself to an Activity .............................................................................................. 288 Removing Activities from a Timesheet .................................................................................... 289

P6 EPPM User's Guide
14
Recording Actual Work Time on a Timesheet ......................................................................... 289 Adding or Viewing Timesheet Notes........................................................................................ 290 Submitting a Timesheet ........................................................................................................... 290 Saving or Printing a Timesheet ............................................................................................... 290 Closing a Timesheet ................................................................................................................. 291 Viewing Your Project List and Project Web Sites .................................................................... 291 Searching for Data ................................................................................................................... 291
Working with Activities .................................................................................................................. 292
Displaying a List of Your Activities ........................................................................................... 292 Filtering and Sorting the Activity List ....................................................................................... 292 Selecting Activity Data Columns .............................................................................................. 293 Saving or Printing Your Activity List ......................................................................................... 294 Assigning Yourself to an Activity .............................................................................................. 294 Viewing Activity Details ............................................................................................................ 295 Reporting Actual Work Time without a Timesheet ................................................................. 295 Reporting Dates for an Activity ................................................................................................ 296 Reporting Remaining Work Estimates .................................................................................... 296 Reporting a Completed Assignment ....................................................................................... 297 Viewing and Reporting Progress for Activity Steps ................................................................. 298 Viewing and Sending Activity Feedback.................................................................................. 298 Viewing Your Project List and Project Web Sites .................................................................... 299 Searching for Data ................................................................................................................... 299
About Importing and Exporting Data............................................................................................. 301
Importing Activities from Excel ..................................................................................................... 301
Exporting Activities to Excel .......................................................................................................... 302
Creating Import Templates ........................................................................................................... 302
Exporting Risk Data ....................................................................................................................... 303
Exporting a List of Reports ............................................................................................................ 304
P6 Professional ............................................................................................................................. 305
Reflection Projects ........................................................................................................................ 305
What is a reflection .................................................................................................................. 305 Creating and using reflections ................................................................................................ 306 Create a Reflection .................................................................................................................. 306 Printing a reflection difference report ..................................................................................... 307 Merging a Reflection with the Source project ........................................................................ 307 Using Reflection projects and Activity Owner features to collect and review activity status310 Frequently asked questions about reflections ....................................................................... 310
Future Period Bucket Planning ..................................................................................................... 312
Future period bucket planning ................................................................................................ 312 Future period bucket planning FAQ ........................................................................................ 314 Create a future period bucket planning layout....................................................................... 337 Manually enter future period assignment values .................................................................. 339
Editing Past Period Actual Spreads .............................................................................................. 343
Edit past period actual data .................................................................................................... 343
Project Check Out and Check In ................................................................................................... 344
Managing remote projects....................................................................................................... 344

Contents
15
Check out a project .................................................................................................................. 344 View the check-out status of a project .................................................................................... 344 Modify check in update options .............................................................................................. 345 Check in a project .................................................................................................................... 345
Import from Contract Management ............................................................................................. 346
Linking Contract Management data ....................................................................................... 346 Link P6 Professional to Contract Management ..................................................................... 346 Link your project to a Contract Management project ............................................................ 347 Import Contract Management data ........................................................................................ 348 How data is imported from Contract Management ............................................................... 348 Viewing Contract Management documents ........................................................................... 350 View Contract Management documents ................................................................................ 350


17
In This Chapter
About Oracle Primavera P6 Enterprise Project Portfolio Management ............ 17
Working with Oracle Primavera P6 Enterprise Project Portfolio Management Suite
..................................................................................................................................... 18
P6 EPPM Release 8 New Feature Summary ........................................................... 25
P6 EPPM Documentation ......................................................................................... 40
Where to Get Support .............................................................................................. 43
About Oracle Primavera P6 Enterprise Project Portfolio Management
Oracle Primavera P6 Enterprise Project Portfolio Management (P6 EPPM) is a robust and
easy-to-use integrated solution for globally prioritizing, planning, managing, and
executing projects, programs, and portfolios. It optimizes role-specific functionality to
satisfy each team member's needs, responsibilities, and skills. It provides a single solution
for managing projects of any size, adapts to various levels of complexities within a
project, and intelligently scales to meet the needs of various roles, functions, or skill levels
in your organization and on your project team.
Thousands of companies rely on P6 EPPM to:
Plan, schedule, and manage the right strategic mix of projects
Make informed project, cost, and resource management decisions
Enhance team collaboration and workflow productivity
Maximize each project contributor's skills and responsibilities
Track progress and optimize capacity for maximum profitability
Deliver programs and projects on time and within budget
Share data with human capital, financial management, and enterprise resource
planning systems
Actual deployments require a variety of databases, servers, applications, and supporting
technologies. Review the topics below to get a general understanding of the primary
components of the suite:
P6 (see "About P6" on page 20)
P6 Professional (see "About P6 Professional" on page 21) for EPPM
P6 Reporting Database (see "About P6 Reporting Database" on page 23)
P6 Progress Reporter (see "About P6 Progress Reporter" on page 22)
P6 Integration API (see "About the P6 Integration API" on page 25)
P6 Web Services (see "About P6 Web Services" on page 25)
Preface

P6 EPPM User's Guide
18
BI Publisher (see "About Oracle BI Publisher and the OBIEE Platform" on page 23)
P6 Analytics (see "About P6 Analytics" on page 23)
Oracle Business Process Management Suite (see "About the Oracle Business Process
Management Suite" on page 22)
Oracle Universal Content Management (see "About Oracle Universal Content
Management" on page 25)
P6 EPPM also integrates with many other optional Oracle solutions such as Contract
Management, Oracle Risk Analysis, Oracle PPM, and Cost Manager.
Working with Oracle Primavera P6 Enterprise Project Portfolio Management Suite
Depending on your organization's specific deployment, P6 EPPM generally consists of the
applications, functions, and databases depicted below.
Applications:
P6: Most users will rely almost exclusively on the P6 web application running in a standard
web browser. Simply termed P6, it is the primary interface for administering and
managing projects.

Preface
19
P6 Professional for EPPM: The P6 web application is the main interface for all project
management functionality; however, you can also use the optional P6 Professional
software to take advantage of its core project planning and scheduling functionality.
The P6 Professional application and its features, including the built-in TSLD viewer, run on
the Microsoft Windows operating system.
P6 Progress Reporter: P6 EPPM includes the P6 Progress Reporter integrated timesheet
entry software. Resources use P6 Progress Reporter to record their time spent working on
assignments via electronic timesheets, and approving managers use P6 to review and
approve them.
P6 Integration API: A Java-based application programming interface (API) enabling your
P6 EPPM deployment to interface with other components and systems.
P6 Web Services : P6 Web Services is an integration technology that extends P6 business
objects and functionality. Based on open standards including SOAP, XML and WSDL, P6
Web Services enables developers to leverage standard interfaces to create integrated
software solutions that interoperate with a wide variety of enterprise software
applications running on a diversity of hardware and operating system platforms.
P6 Analytics: An optional integrated dynamic reporting tool with advanced visual
features, including dashboards.
Functionality (included with P6 EPPM):
Core Enterprise Functionality: Use P6 for all of the following core enterprise functionality:
Administration and Enterprise Data: Administer user accounts, preferences, views,
application settings, and enterprise data.
Project, Portfolio, and Resource Management: P6 provides an extensive array of
features designed to optimize all phases of Project Management, Resource
Management, and Portfolio Management. It includes full support for activities,
work breakdown structures, costs, resource administration and assignment, roles,
teams, portfolio analysis, capacity planning, and convenient dashboards for
measuring status at any level at every moment.
Document Management: P6 includes document management support with or
without the optional document repository option. Use the optional document
collaboration features to conduct document reviews with key stakeholders to
keep projects moving or meet regulatory compliance.
Workflows: The workflow engine bundled with P6 EPPM provides Business Process
Modeling Notation (BPMN) compliant graphical notation that depicts the steps in
your project initiation workflows. Use the integrated Workflows portlet to
coordinate the sequence of tasks that flow between different process participants
in a series of stages.
Reports: Generate and view reports using your standard web browser running P6.
Reports can be generated electronically and routed via e-mail, saved to a shared
or local file, or printed to a traditional printer.

P6 EPPM User's Guide
20
Planning and Scheduling: The optional P6 Professional component of the suite provides a
robust set of features primarily for planners and schedulers, including reflections,
schedule comparison (Claim Digger), and a report designer. Use the new built-in
Timescaled Logic Diagram (TSLD) viewer to create and customize condensed visual
depictions of complex project schedule information.
Time Reporting: P6 EPPM includes P6 Progress Reporter, an optional integrated timesheet
entry application.
Integrated Solutions: Build or deploy other systems and use the P6 Integration API or P6
Web Services to integrate them with P6 EPPM.
P6 Analytics: Extend your solution by adding P6 Analytics with the Oracle Business
Intelligence (OBI) metadata layer to facilitate the creation of ad-hoc reports and
interactive custom dashboards reflecting trends and metrics for activities, portfolios,
resource assignments, utilization, and project history. Also receive proactive alerts based
on integrated report data mined from the ODS and star databases.
Technology:
The P6 EPPM Database: The main database for all your P6 EPPM data.
BPM Workflow: The separate workflow engine bundled with P6 EPPM.
Oracle BI Publisher: The database server hosting the reporting library, templates, and
views required to build complex reports with ease.
The Reporting Database: The P6 Reporting Database portion of the suite consists of the
Star database and the Operational Data Store (ODS) database used to extract,
transform, and load data from the P6 EPPM database. This data is specifically designed
to be used to create reports.
Oracle Universal Content Management: This server hosts documents in a shared
repository enabling collaborative functionality such as document check-out/check-in
and versioning.
About P6
P6 is the main web application of the P6 EPPM solution. P6 provides enterprise-wide web
access to features arranged into the following main sections:
Dashboards
Portfolios
Projects
Resources
Reports
Administration

Preface
21
P6 is a complete Enterprise Project Portfolio Management application with a powerful
but easy-to-use interface. It completely tracks projects, portfolios, and resources across
their full project lifecycles capturing all related costs, issues, risks, and performance
metrics along the way. It also supports project templates, allowing you to reuse projects
in full or in part. It is designed for organizations that need to simultaneously manage
multiple projects and support multi-user access across job sites and throughout the entire
organization.
The user interface provides structured menus where you can access a wide range of
data views and features that enable you to manage your projects from initial concept
review and approval through to completion. You can customize your own web pages,
called dashboards, to create a custom view of the specific projects and categories of
project data that are most relevant to your role in managing projects and resources.
Project workspaces and workgroups extend the model of customizable, focused data
views by enabling designated project members to create a uniform view of data that
relates to one specific project or to a subset of activities within a project.
P6 provides centralized resource administration, planning, and management, which
even includes resource timesheet approval and the ability to communicate with project
resources who use P6 Progress Reporter, the Web-based timesheet management
application of P6 EPPM. Use P6 to match people with roles and proficiency levels, and
then use that information to assign tasks effectively.
P6 includes robust reporting, workflow, e-mail notifications, events, and document
collaboration and review features.
Finally, P6 is the single source for administrative functions, including centralized enterprise
data, user accounts, application settings, and security for all users in P6 EPPM.
About P6 Professional
P6 Professional is a separate optional module that integrates traditional project
management with streamlined resource and cost management. It is ideal for planners
and schedulers.
Note: If you decide to use P6 Professional, you must still use P6 to
administer user accounts, enterprise data, and other settings.
The P6 Professional software includes a subset of the P6 features, as well as several of its
own specialized features. As a primary example, P6 Professional includes the new
Timescaled Logic Diagrams viewer for the creation, viewing, and modification of
timescaled logic diagrams (TSLDs). TSLDs condense the project plan displayed in the
Gantt chart into a more concise visual snapshot illustrating the chain of activities that
drive the project schedule. When you create a TSLD, it appears in the TSLD viewer.
Note: The TSLD viewer is designed for use with only the P6
Professional application.

P6 EPPM User's Guide
22
About P6 Progress Reporter
The P6 Progress Reporter module is a Web-based project communication and
timekeeping system. As a team-level tool for project participants, it helps project
participants focus on the work at hand with a simple cross-project to-do list of their
upcoming assignments. Project team members can record time worked and enter
information about their project assignments. Regardless of location, team members can
communicate timesheet and activity status directly to their managers.
Because all project participants can use P6 Progress Reporter to enter up-to-the-minute
information about their assignments and to record the time they spent working on each
one, project managers can make crucial project decisions with the confidence that only
comes from having the most current information possible. Timesheet review and
approval takes place directly from within P6.
About the Oracle Business Process Management Suite
The Oracle Business Process Management (BPM) Suite provides an integrated
environment for developing, administering, and using business applications centered
around business processes. BPM supports BPMN and BPEL standards from modeling and
implementation to run time and monitoring.
P6 directly integrates with BPM allowing you to initiate and manage workflows. Take
advantage of the ready-to-run project initiation workflow sample included with P6 EPPM
or design your own workflows.
You can also expand your use of BPM to include all stages of your application, program,
project, or product development life cycle from design-time and implementation to
run-time and application management.
The Oracle BPM Suite enables you to:
Create and customize business processes, models, and standards using pre-defined
components for web-based applications.
Collaborate between process developers and process analysts.
Expand business process management to include flexible, unstructured processes.
Add dynamic tasks and support approval routing using declarative patterns and
rules-driven flow determination.
Unify different stages of your development life cycle by addressing end-to-end
requirements for developing process-based applications. Oracle BPM unifies the
design, implementation, run time, and monitoring stages based on an SCA
infrastructure. This allows different personas to participate through all stages of the
workflow life-cycle.

Preface
23
About Oracle BI Publisher and the OBIEE Platform
BI Publisher and the Operational Data Store (ODS) are integrated with the P6 EPPM suite.
These components deliver on-demand web-based reporting through P6.
You have the option of expanding the capabilities of P6 EPPM using these components.
Oracle Business Intelligence Publisher: Oracle Business Intelligence Publisher (formerly
XML Publisher) is an enterprise reporting solution allowing you to design, manage, and
deliver highly formatted documents. Because it is built on open standards, your IT
developers can create data models against practically any data source and use BI
Publisher APIs to build custom applications leveraging existing data sources and
infrastructure. BI Publisher users can design report layouts using familiar desktop tools,
reducing the time and cost needed to develop and maintain reports. Extremely efficient
and highly scalable, BI Publisher can generate documents with minimal impact to
transactional systems. Using the convenient P6 web interface, reports can be viewed
online or scheduled for delivery to a wide range of destinations.
Oracle Business Intelligence Enterprise Edition (OBIEE): Expand your business intelligence
capabilities with this optional foundation platform. OBIEE enables your organization to
buy and plug in ready-to-run analytics packages or to build your own applications on
one common BI architecture.
About P6 Reporting Database
The P6 Reporting Database works with the P6 EPPM database to provide a robust and
powerful reporting solution. Project data from the P6 EPPM database is periodically
extracted, transformed, and loaded into an Operational Data Store (ODS) database.
Use P6 Reporting Database with BI Publisher to create and administer reports.
About P6 Analytics
P6 Analytics provides an in-depth and comprehensive method for gathering, analyzing,
sharing, and storing project performance, project history, resource assignment, and
utilization data. Use the P6 Analytics add-on application with P6 EPPM to create powerful
custom dashboards and reports to help your organization make better business
decisions. P6 Analytics requires Oracle Business Intelligence Enterprise Edition (OBIEE) or
Oracle Business Intelligence Standard Edition.
Built upon the Oracle Business Intelligence (OBI) suite, P6 Analytics delivers a catalog of
requests called Dashboards and Answers that provide an interactive way of viewing,
analyzing, and evaluating P6 EPPM data. In addition, it provides a Repository (RPD) file
which contains the data mappings between the physical data and the presentation
layer of OBI.
P6 EPPM User's Guide
24
The dashboards provide detailed insight into your P6 EPPM data, through the use of
analytical charts, tables, and graphics. Dashboards have the ability to navigate to other
requests, to provide precise root cause analysis. In addition, you can configure individual
requests with the P6 EPPM Action Link, which enables you to navigate directly to your P6
site for true "Insight to Action" capabilities. Reports created with Oracle BI Answers can be
saved in the Oracle BI Presentation Catalog, and can be integrated into any Oracle BI
home page or dashboard. Results can be enhanced through options such as charting,
result layout, calculation, and drill-down features.
In summary, use P6 Analytics to:
Perform root-cause analysis and employ management-by-exception.
Gather critical insights into current and historical performance of all projects,
programs, and portfolios.
Make better decisions to eliminate project failure.
Quickly visualize critical project performance in early stages from dashboards.
Predict and identify cost trends early in project lifecycle to rescue troubled projects.
Gain visibility into resource performance through s-curves in dashboards with
interactive dashboards you can drill down to examine the root-cause problem.
Show staffing needs by portfolio with early warning indicators for upcoming
under-staffed project work.
Performance Data
P6 Analytics provides an RPD file to be used with the Oracle Business Intelligence suite.
The RPD file contains:
A physical representation of the Star schema.
A business layer where customized calculations are performed.
A presentation layer that groups all of the Star database fields into logical subject
areas.
The RPD delivers an extensive amount of earned value, cost, unit, percent complete,
and other key performance indicators. It enables data to be sliced by items such as time,
project, eps, portfolios, activities, and resources.
P6 Analytics delivers a sample dataset (P6 EPPM, Stage, ODS, and Star) from which the
Dashboards and Answers requests in the catalog are built. This sample data can be used
to view the power of Dashboards and Answers requests delivered in the catalog, which
will give the user an idea of how the catalog can be integrated with their data. For
information on configuring the sample dataset, see the SampleData.pdf document that
is included in the P6Analytics\Sample folder on your release media pack or download.

Preface
25
The Star Database
The Star database enables your organization to perform advanced business analysis on
project and portfolio data. It supplies a dimensional schema that organizes P6 EPPM
hierarchical relationships, enables the highest level of query efficiency and flexibility in
data analysis, and accumulates project data over time. This provides organizations with
baselines for tracking trends and for advanced business intelligence.
About the P6 Integration API
The P6 Integration API is a Java-based Application Programming Interface (API) and
server that enables developers to create application code aligned with P6 EPPM
business rules in order to seamlessly access P6 EPPM data.
About P6 Web Services
P6 Web Services enables your organization to seamlessly integrate P6 EPPM functionality
into other applications using open standards, languages, and protocols, including XML,
SOAP, SOA, and WSDL. P6 Web Services enables your organization to share P6 EPPM
data between applications independent of operating system or programming
language. Use P6 Web Services when you need to extend or customize integrated
functionality, for example, with BPM workflows, events, or forms-based applications.
About Oracle Universal Content Management
Integrated with P6, Oracle Universal Content Management (UCM) turns cluttered, often
unstructured content into organized assets by making it easier to catalog, access,
search, and reuse. All popular document formats such as HTML, XML, DOC, XLS, GIF, and
PDF are supported.
Using P6 with UCM, project participants can better manage their documents. Specific
functions include:
Upload new documents for storage in the unified UCM database
Categorize documents within folders for better organization
Link projects, WBS elements, activities, and issues to documents
Check in and check out documents (version control)
Review documents
You can also extend UCM to deliver content via Web sites, desktops, RSS feeds, mobile
devices, and P6 Web Services.

P6 EPPM User's Guide
26
P6 EPPM Release 8 New Feature Summary
Building on a tradition that includes worldwide sales and recognition spanning the last
quarter century, this release of P6 EPPM offers significant new or improved functionality
described in the following topics.
Note: This New Feature Summary is intended solely to remind
readers of various P6 EPPM documentation deliverables of the
major new or changed features since the last release. Refer to the
separate online help systems and individual documents for the
various components that comprise the P6 EPPM suite to learn more
about the features.
In This Section
Web Administration and Configuration ................................................................ 26
Project and Portfolio Management ....................................................................... 29
Project Templates ..................................................................................................... 30
Resource Management .......................................................................................... 31
Risk Management ..................................................................................................... 31
Enterprise Reporting ................................................................................................. 32
Workflow .................................................................................................................... 33
Technological Advances ........................................................................................ 34
User Productivity ....................................................................................................... 36
Learning Assistance .................................................................................................. 38
P6 Professional ........................................................................................................... 38
Web Administration and Configuration
Easy Web Setup, Configuration, and Administration
Routine setup, configuration, and administration tasks can be achieved using only the P6
application from a single centralized new menu with the following options:
My Calendar: Customize your personal work schedule.
My Preferences: Customize P6 for the way you prefer to work. Personalize the units,
formats, views, and other settings unique to each user.
Application Settings: Configure global application settings for data limits, earned
value calculations, timesheets, IDs, and time periods.
Enterprise Data: Define the data entities, types, categories, and user-defined fields
recognized by your industry or organization.
User Access: Configure who will use the various components of the P6 EPPM suite and
the P6 application, and what permissions to assign to them.
User Interface Views: In a single convenient location, configure the main menus and
pages of the application users of each view are permitted to access. This improved
feature helps you enforce a consistent enterprise-wide user experience.

Preface
27
Web-Based User Administration
Create and administer user accounts for all P6 EPPM users via the P6 web application. Set
each user's contact and login information, and configure their security privileges, profiles,
access, and user interface views. Configure the management hierarchy at your
organization (the organizational breakdown structure, or OBS) and manage project
assignments to reflect the areas of responsibility within your entire enterprise.
Also new in this release, you can use the P6 web application to define privileges for a set
of global and project security profiles and then assign them to users to restrict access in
accordance with your organization's information assurance and security policies.
In addition, the P6 web application now includes integrated Lightweight Directory
Access Protocol (LDAP) support for user provisioning. In the previous release, a Windows
PC was required to perform these tasks. You can now configure, search for, and add
users directly from your company's central LDAP directory using P6 in your web browser.
Enterprise deployments can also batch import multiple user accounts from an LDIF file.
The P6 Web Services module now supports single sign-on via Security Assertion Markup
Language (SAML).
In summary, improvements have been made in this release to the native, single-sign on
(SSO), LDAP, API, and Oracle Access Manager (OAM) features supporting more secure
user authentication for P6.
One Source for All Enterprise Data
Use P6 as a one-stop shop for administering all the enterprise data used by P6 and P6
Professional users. Centrally manage all enterprise data grouped by category, including:
Global category
Currencies
Financial Periods
Global Calendars
Overhead Codes
Timesheet Periods
Projects category
Baseline Types
Funding Sources
Notebook Topics
Project Calendars
Project Codes
Project User-Defined Fields
WBS Categories
WBS User-Defined Fields

P6 EPPM User's Guide
28
Activities category
Activity Codes
Activity User-Defined Fields
Cost Accounts
Expense Categories
Expense User-Defined Fields
Step Templates
Step User-Defined Fields
Resources category
Assignment User-Defined Fields
Rate Types
Resource Calendars
Resource Codes
Resource Curves
Resource User-Defined Fields
Units of Measure
Risks category
Risk Thresholds
Risk Scoring Matrix
Risk Categories
Risk User-Defined Fields
Issues category
Issue Codes
Issue User-Defined Fields
Documents category
Document Categories
Document Statuses
Document User-Defined Fields

Preface
29
Project and Portfolio Management
Web-Based EPS and Project Views
Configure the project hierarchy at your organization (the enterprise project structure, or
EPS) and use it to structure projects and control user access to project and portfolio data.
Project managers will also use the new web-based EPS features to create and edit
projects, templates, preferences, baselines, and summaries. Other useful new features
include configuring multi-user EPS views that target key data, importing and exporting
Primavera XML, Microsoft Excel, and Microsoft Project 2007 data, and creating new
projects and templates directly within the EPS hierarchy.
Similar to the traditional activity views users have relied on for multiple releases, this
release now offers project managers more robust project views at the EPS level. Now, you
will be able to configure the entire EPS and monitor the status of multiple projects, all from
this single page.
The new EPS Gantt chart view on the web is also included. It shows a flat list or grouped
list of projects on a timeline. You can choose to display multiple bars, such as current
dates versus baseline dates for a comparison view. The timescale can be shown in
increments of years (for a long-range view), quarters, months, all the way down to days
(for a more granular view.)
Enhanced Portfolio Filtering
Automatic filter refreshing helps keep your portfolios in sync with the latest project data,
without the need for user intervention. This release also supports an expanded number of
filter parameters offering greater precision when configuring and comparing filtered
portfolios.
Schedule Preview
When hundreds or thousands of activities appear in a Gantt chart, P6 allows you to add,
modify, or delete them; however, historically, it wouldn't immediately update the results
in order to maximize performance. You could reschedule the project in order to view the
impacts of your changes and share them with other users, but what if you wanted to
preview the results before applying them?
New in P6 for this release is the optional Schedule Preview feature which will instantly
generate a preview of any schedule changes locally on your PC. This allows you to
preview the impact of adding, deleting, or modifying activities on the overall project
schedule before deciding to save the schedule changes or discard them.

P6 EPPM User's Guide
30
Recalculate Assignment Costs
The web application now provides an optional command for updating resource and
role assignment cost data in your project to reflect recent changes to one or more rates.
Use this command during or after scheduling a project in case changes to dates cause
assignments to span periods with more than one rate in effect. This command can also
be run during leveling.
Project Baselines
In addition to supporting the administration of baseline types, this release of the P6 web
application also enables you to convert projects into baselines and then restore
baselines back into projects.
Project Templates
Reusable Project Templates
The new templates feature in P6 represents a significant feature improvement for this
release, replacing the Methodology Management functionality from the previous
release.
A template is a stored copy of, or blueprint for, a project. It includes all the details, best
practices, and de facto standards your organization associates with projects of a
particular type. For example, use project templates to create a library of predefined
project structures that can later be used as starting points for new projects. In addition,
specific WBS branches and their activities can be copied from projects or templates and
inserted wherever you need them.
Organize your template projects within the EPS, assign them project codes, and provide
them with descriptions to aid in reuse. Because templates and projects now share a
common database and user interface, it is easy to create templates from projects or to
create projects from templates. You can also create projects based on other projects,
and templates based on other templates.
Note: Methodologies from the previous release can be converted
into P6.

Preface
31
Resource Management
Completely Redesigned Resource and Role UI
The entire Resources section has been redesigned with a new, more intuitive interface
that offers robust and responsive enterprise-wide resource management features. A
single centralized resource page now provides point-and-click access to resource, role,
and team administration, assignments, detailed and high-level planning, and resource
and role usage and analysis. Editable tables and supplemental windows empower you
to manage enterprise resource information quickly and efficiently. You'll see all resources
at a glance and be able to edit details and make resource team and primary role
assignments with ease.
Other new highlights include:
Access important enterprise data for resources directly from a convenient new menu
item and dialog box without navigating away from your current work.
Ability to view an assigned resource's calendar.
Improved Resource Planning and Analysis
Navigate to a central location to view and evaluate resources by project, role, resource,
allocation, or your own custom filter. Toggle between resource analysis and resource
planning modes.
Optimized Resource and Role Team Handling
Select the resources that make up a team faster with fewer steps using the redesigned
resource team components. Rather than creating and configuring new resource teams,
save time by first duplicating the closest matching team and then simply editing its
configuration. When you use this "copy and paste" technique for creating a resource
team, all its resources are included in the new copy. You can also use copy and paste to
create and manage role teams.
Risk Management
This release of P6 includes significantly expanded Risk Management functionality based
on industry best practices and standards for project risk management.
Qualitative Risk Management
Using the new Risk Register, project managers can now assess potential risks on a project
plan, associate risks with activities, assign risk probabilities, calculate impacts to schedule
and cost, and develop risk response and contingency plans to mitigate risks.
The application's built-in qualitative risk management features are complemented by
the quantitative risk analysis features available with the full Oracle Primavera Risk Analysis
solution, an optional integrated component.

P6 EPPM User's Guide
32
Risk Scoring Matrix, Categories, and Thresholds
Define risk probability, tolerance, and impact thresholds using the new risk scoring matrix.
When assigned to a project, users can assess risks in order to calculate relative project risk
scores. This feature includes a new color-coded probability and impact diagram (PID),
probability threshold scale, tolerance scale, and impact severity table.
Enhanced support for risk categories enables you to manage, track, and analyze your
own particular conventions for grouping and managing risk. A new risk threshold page
provides ways to configure color-coded assessment levels to measure the probability,
cost, and schedule impacts of each risk.
Enterprise Reporting
Integrated On-Demand or Scheduled Reports
This release of P6 includes the P6 Reporting Database integrated with Oracle Business
Intelligence Publisher. BI Publisher is an enterprise reporting solution allowing you to
design, manage, and deliver highly formatted documents. Report formats include
Microsoft Word, Excel, OpenOffice, PDF, and support an array of familiar columnar and
graphical styles. P6 provides more than 30 new reports dynamically generated when BI
Publisher accesses P6 data in the Operational Data Store (ODS).
Other key features include:
Ready-to-Run Reports: Run pre-defined reports to quickly get started
Room to Grow: Create reports via data models or templates (also includes custom
layout designer)
E-mail or save a report to a file: E-mail reports to your predefined distribution lists and
even save reports to a shared content repository.
Deliver the same report in multiple formats to satisfy different users: BI Publisher
supports several file formats including HTML, PDF, Excel, PPT, MHTML, RTF, XML, and
CSV. Each report can be published to all these formats or configured to only specific
formats and will have a default format defined.
Schedule reports or generate ad hoc reports on-demand: Schedule reports to be
generated on a defined interval. Reports can be scheduled to execute once, daily,
weekly or monthly. A report can have multiple schedule runs defined, each with its
own interval, delivery recipients, template and parameters. Of course, any report can
also be instantly generated on-demand.
Store archives and access report histories: Previous runs of a report can be saved,
providing a report archiving solution to allow for access to historical reports.
Organizations can configure BI Publisher to save reports for a defined time period,
and individuals can access the historical reports through BI Publisher.

Preface
33
Adjustable Parameters: To further reduce the effort and cost of creating and
maintaining reports, parameters can be defined within a report, and passed in during
runtime. Parameters can be used to filter and organize the information on a report. By
using parameters, a single report can meet the need of several project managers,
planners and stakeholders. The new P6 reports also include easy lists of values you
can browse to select the values you need to run your report.
Secure Access: The new reporting capabilities provide three layers of security to
ensure data is protected and individuals only have access to the reports they are
permitted to run.
The entire reporting section can be hidden through the new Enterprise Reporting
module access setting. Provisioning this new module will expose the reporting
section and create database views in the ODS for each user.
The hierarchical folder structure used for organizing the reports can also define
which reports each user has access to run.
Reports pulling project information from the ODS will only return data for projects a
user has access to, as determined by P6 application security settings.
Also provided with this release are the ODS and its associated Extract, Transform and
Load (ETL) process. The ODS is part of the P6 Reporting Database and provides secure
access to information in an easy to use data schema.
Users seeking even greater leverage and analysis of their report data should consider
deploying P6 Analytics, available separately from Oracle.
Note: Users of the previous version of P6 may notice the removal of
the Project Reports and My Reports portlets. The new Reports
section replaces those old features. Users still interested in viewing
P6 Professional reports in a P6 portlet can select the Store report in
Work Products and Documents option in P6 Professional when
creating report batches or printing reports. See the P6 Professional
Help for more information.
Workflow
Oracle BPM Integration
Teams can collaborate with greater efficiency using the built-in project initiation
workflow included with P6. Additional workflows can be managed and customized using
the separate and optional Oracle Business Process Management (BPM) Suite. Oracle
BPM supports BPMN and BPEL at all stages from modeling and implementation to run
time and monitoring.

P6 EPPM User's Guide
34
In prior versions of P6, there were embedded workflow engines (jBPM or Interwoven) to
automate only three P6 EPPM processes: project initiation, project processes, and
document review. While easy to configure, these lacked the depth of functionality to
truly model real-world processes. The prospect of using that legacy workflow integration
to automate additional processes was limiting. Beginning with Release 8, P6 leverages
Oracle’s Unified Business Process Management (OBPM) solution to serve as the engine to
automate any process related to the management of projects, programs, and portfolios.
All users participating in workflows are not required to use any other application besides
P6. Users can initiate, participate, approve, reject, delegate, escalate, and continuously
monitor any project workflow process flow by launching it from within a P6 dashboard.
Note: BPM is not the only solution for deploying custom workflows in
P6. This release also supports creation of an unlimited number of
custom workflows using P6 Web Services and P6 Events.
Technological Advances
Integrated LDAP Provisioning
The web application now directly includes Lightweight Directory Access Protocol (LDAP)
provisioning support for seamless LDAP or SSO user authentication. In the previous
release, a Windows PC was required to configure and add users from an LDAP repository.
You can now configure, search for, and add users from your company's central LDAP
directory using the P6 web application.
Note: Improvements have also been made in this release to the
native, LDAP, single-sign on (SSO), API, and Oracle Access
Manager (OAM) features supporting more secure user
authentication for P6.
Enhanced and Expanded Job Services
The historic client/server job services architecture has been completely redesigned. Now,
all jobs can be invoked and run in real-time from the web. Examples of on-demand jobs
include Recalculate Assignment Costs and Store Period Performance.
In addition, job scheduling also takes place in a web-based environment. The following
key jobs can be scheduled, for example, you might run these every Tuesday at a
particular time:
Summarize Project
Schedule Project
Level Project Resources
Apply Actuals

Preface
35
Expanded Event Support
In alignment with all its new features, this release also supports an expanded number of
events, triggered by interactions with various classes of objects that comprise the
solution. For example, specific types of interactions with activities, projects, EPS elements,
risks, documents, jobs such as Apply Actuals, and other special operations such as
copying a project will now trigger events. Compared with the previous release, nearly
three times as many events are available to developers at organizations where they are
used for a variety of purposes such as workflows, notifications, data warehousing, or
integrations with other enterprise software.
For more information, refer to the Using Events with P6 manual.
Integration Ready
P6 is now designed and tested to support major integrated enterprise management
solutions, including Oracle Primavera Portfolio Management 8.0 (formerly ProSight),
Oracle Enterprise Business Suite (EBS), JD Edwards, and other ERP products. Other popular
integrations include P6 Progress Reporter for timesheets, Contract Management for
contract management, and new in this release, BPM for workflows and BI Publisher or P6
Analytics for reporting.
P6 Web Services Security Enhancements
The P6 Web Services module now supports:
Single sign-on via Security Assertion Markup Language (SAML)
XML encryption
Digital signatures
Improvements have also been made in this release to the native, single sign-on (SSO),
LDAP, API, and Oracle Access Manager (OAM) features supporting more secure user
authentication.
Platforms
With each release of P6 EPPM, the supported platforms are updated to reflect new
technologies and the discontinuation of support for older technologies.
New Supported Platforms:
Apple Mac OS X with Safari browser for P6
Oracle Business Intelligence Publisher 10g for reporting
Oracle BPM 10g & 11g for workflows
HP Itanium application servers
Oracle Enterprise Manager 11g for enterprise administration
Components or Versions No Longer Supported:

P6 EPPM User's Guide
36
JackRabbit previously used for document management
jBPM previously used for workflows
JBoss application server
WebLogic 10g application servers
Oracle HTTP 2.0 (10.1.3.2.0), IIS 6.0, and Apache 2.0 web servers
SiteMinder previously used for Single Sign-On
User Productivity
Auto-Complete Field Values
Available on select pages and dialog boxes, the new Auto-Complete feature offers
helpful functionality while entering new values in fields. As you key in an entry in a field
that only accepts values from a predefined list of existing values, including some
calendar fields, the closest single matching value is automatically selected for you. If
multiple values match your input, they are displayed in a list for you to make a selection.
Customizable Toolbars
On most pages of the application, fixed toolbars appear by default wherever they are
needed based on your current selection. This functionality existed in the last release and
was continued where needed for new pages in this release. However, on three of the
most commonly used pages of the application, the Activities, EPS, and Resource
Assignments pages, you can now customize the toolbars. Optimize your productivity by
hiding the commands you rarely use to make room for the ones you use most often. In
addition, you can rearrange and dock toolbars on these pages by clicking and
dragging.
Enhanced Activity, Assignment, and EPS Filters
Apply filters to the Activities, Assignments, and EPS pages to constrain the number of
activities, resource assignments, and projects, respectively, based on precise criteria you
specify. Filter enhancements in this release include:
Create, configure, and apply your own custom filters independent of the current
activity view. Even apply multiple combinations of custom or shared filters at the
same time. The filters you want to apply can also be saved with a customizable view,
so they are automatically reapplied along with all the other settings stored in the
view.
Share filters globally with all users, designate them only for certain users, or keep them
private for your own exclusive use.
Cut, copy, and paste filters.
Specify a greatly expanded number of filter criteria rules, a significant improvement
over the previous release's 10-rule limit.

Preface
37
Define nested logical filter rules for pinpoint accuracy when scanning rows of data.
For example, define inclusive (any of the following) and exclusive (all of the following)
rules.
E-mail Activity Views
Instantly capture one or more projects in your current multi-user view as a hyperlink you
can e-mail to others so they can also view the same project, WBS, activity, and step data
with all your customized settings applied.
Keyboard Shortcuts
The menus on the EPS, Activities, and Resource Assignments pages include new
time-saving keyboard equivalents for important commands. The Enterprise Data pages in
the administration section of the application also include keyboard equivalents for many
of its popular commands (for example, press the Insert key to add a new item). Most
pages and dialog boxes generally support Tab key traversal for easy access and
navigation between fields.
Menus and Icons
New in this release, the Activities, EPS, and Resource Assignments pages now organize
their feature-rich offering of commands within a series of standard menus titled Actions,
Edit, and View. Throughout the entire suite, nearly 100 icons representing various
commands have been redesigned and optimized for recognition and ease-of-use.
Redesigned Detail Windows
When a table of entries includes specific related information that supplements the data
already shown on the page, P6 presents the detailed information in one or more detail
windows. For added convenience, tabbed detail windows are minimized and restored
collectively as a group. Users no longer need to open and close each detail window
separately, although this level of control is still supported on the EPS and Activities pages.
Overall, for improved efficiency, the application makes greater use of the consistent
detail window design. For example, detail windows also appear when administering
resources, user accounts, and security profiles. The new EPS page includes eight detail
windows with specific supporting information related to EPS elements and projects. And
finally, the Activities page adds three new detail windows for issues, risks, and general
data. The detail windows on the Activities and EPS pages, two of the most widely used
pages in the application, can individually be shown or hidden from view.

P6 EPPM User's Guide
38
Learning Assistance
Completely Redesigned Online Help
A new context-sensitive Online Help system is both re-authored and re-architected to
provide instant support to users in a time-saving structured interface. Topics include
descriptions for all screen elements, icons, and fields. Key concepts, related links,
step-by-step tasks, and valuable reference information are provided. Also includes new
hierarchical table of contents and search features.
UPK Multimedia Tutorials
Take advantage of the built-in integration with Oracle's User Productivity Kit (UPK)
allowing you to launch context-sensitive tutorials. In addition to opening the P6 Online
Help, the expanded Help menus and buttons in P6 also present options for viewing UPK
multimedia simulations from within the P6 interface.
As your organization grows, expand your UPK investment to include custom tutorials
developed exclusively for your particular environment, training needs, or business
requirements. Oracle UPK must be purchased separately to create new simulations or
modify existing ones.
P6 Professional
An overview of the new features available only in P6 Professional, the client edition of P6
for Microsoft Windows PCs designed for planners and schedulers, follows.
To learn more about the features included in or removed from this release of P6
Professional, see the P6 Professional online help topic What's New in P6 Professional?
Timescaled Logic Diagrams
A much-anticipated new feature, Timescaled Logic Diagrams allows users to condense
the project schedule into smaller snapshots. A convenient timescale logic viewer,
seamlessly launched from within the P6 Professional application, facilitates the creation,
customizing, saving, and printing of timescaled logic diagrams and Gantt charts.
Tabbed Views
By popular demand, users can now switch between open layouts, screens, or views by
clicking their identifying tab. Tabs can also be grouped, splitting the window, and then
merged back into a single group of tabs within a window. This means that all main
windows in the entire application, including Projects, Activities, and Resources, can be
displayed simultaneously as tabs and can be tiled horizontally, vertically, or some
combination of both.

Preface
39
Customizable Menus
Users can now change the display order of menus, rearrange menu commands, delete
menus and commands, and create custom menus.
Customizable Toolbars
An improved default arrangement of toolbars and command buttons reduces visual
clutter. In addition, users can fully create and customize any toolbars in the client
interface with the commands of most importance to their goals and assignments.
Page Breaks by Group Band
P6 Professional now supports page breaks within layouts. Similar to reports, layouts can be
printed and page breaks determine if output will split your charts or other data onto
separate pages. Page breaks can be set manually, on customary Page Setup dialog
boxes, or automatically based on group band values.
Apply Actuals and Summarize Project Now Run as Services
Apply Actuals and Summarize Project jobs now run as java services. These jobs are no
longer processed locally within P6 Professional. You can view the status of these services
in the Job Status dialog box accessible from the Tools menu in P6 Professional and will be
notified when a service completes or fails.
Auto-Refresh Grouped Data by Window
Enable and disable automatic refresh of grouped data per window. This setting applies
to the active window only, and can be different for each open window.
Client-Web Delineation and Integration
his release offers greater web support and ease of use without sacrificing the raw power
our P6 Professional users have found indispensable. The P6 Professional client
application's legacy administrative functionality has been shifted to a redesigned web
interface to allow the client interface to focus entirely on planner/scheduler
functionality. P6 Professional users can decide to continue to rely on the optional client
application, with its strong core scheduling features, while most enterprise users will
migrate to and benefit from the greatly-expanded capabilities and convenience now
found in the P6 web application.

P6 EPPM User's Guide
40
Streamlined Installer
P6 Professional now installs all of its files into a single directory with fewer required registry
settings. (Note: Only certain secondary applications using the API and the optional SDK
use registry settings.) The two main benefits of the new installer are that its footprint is
simple and that it is generally easier for IT administrators to deploy (e.g., installations can
be pushed over the network down to users' desktops).
Of interest to customers of P6 Professional version 7.0, the previous version, is the new
supported capability of installing P6 Professional Release 8.0 side-by-side with a version
7.0 installation. Users requiring an upgrade to the P6 SDK would first have to uninstall the
7.0 version of the P6 SDK.
Improved HTML Editor
A new HTML editor provides an expanded set of formatting options for use with notebook
and description fields.
Command Line Support
This release supports running batch report jobs and exporting projects from a command
line.
Note: To view P6 Professional reports in P6, select the Store report in
Work Products and Documents option when creating report
batches or printing reports. See the P6 Professional Help for more
information.
P6 EPPM Documentation
You can access reference manuals and administrator’s guides from the P6 EPPM
Documentation Center, located in the \Documentation\<language> folder of the P6
EPPM physical media or download. Most documentation assumes a standard setup of
the product, with full access rights to all features and functions.
Media packs include all files necessary to install P6 EPPM applications, all manuals and
technical documents related to the installation, administration, and use of P6 EPPM
components, and the Quick Install Guide. For information on the contents of the P6 EPPM
Media Pack, see the P6 EPPM Quick Install Guide.
The following table describes documentation publications and lists the recommended
readers by role. P6 EPPM roles are described in Installation Process Overview in the P6
EPPM Administrator's Guide.

Preface
41
Title Description
P6 EPPM
Administrator’s Guide
Explains how to set up the P6 EPPM database, servers,
and components; it also provides an overview of all the
components in the P6 EPPM solution. The guide
describes the procedures required to administer P6
EPPM, including setting up security and configuring
global preferences. The P6 EPPM network
administrator/database administrator and P6
administrator should read this guide.
P6 EPPM User's Guide This guide explains how to plan, set up, and manage
projects in a multiuser environment. If you are new to P6
EPPM, start with this guide to learn how to use the
software effectively to plan and manage projects.
When you need more detail, refer to the P6 Help. The
program manager, project manager, resource/cost
manager, and team leader should read this guide.
P6 Professional Help Explains how to use P6 Professional to plan, set up, and
manage projects in a multiuser environment. If you are
new to P6 Professional, use this Help to learn how to use
the software effectively to plan and manage projects.
The P6 Professional administrator, program manager,
project manager, resource/cost manager, and team
leader should read this Help.
P6 Help Describes how to create, manage, plan, and schedule
projects, group projects into portfolios, administer all
enterprise data, application settings, user accounts,
and security profiles, maintain both the organizational
breakdown structure (OBS) and enterprise project
structure (EPS), manage resources and roles, track risks,
issues, and notebooks, create and reuse templates,
evaluate budgets, analyze performance and ROI for
project portfolios, participate in workflows and
document reviews, approve timesheets, and generate
reports. The operations executive, P6 EPPM and P6
administrator, program manager, project manager,
resource/cost manager, and team leader should read
this Help.
P6 Progress Reporter
Administrator Help
Describes how to enter database connection
information for the P6 Progress Reporter server and
modify P6 Progress Reporter server and application
settings. The P6 EPPM network administrator/database
administrator should read this Help.

P6 EPPM User's Guide
42
P6 Progress Reporter
Help
Describes how to use P6 Progress Reporter to enter and
update time spent on assignments. Team members
should read this Help.
Primavera Timescaled
Logic Diagram Help
Describes how to create, modify, and manage
Timescaled Logic Diagrams. Timescaled Logic Diagrams
condense the project schedule displayed in the Gantt
Chart into a more readable, easier to understand
format that provides a snapshot of the entire project
plan and the chains of activities that drive the project
schedule.
P6 Integration API
Administrator’s Guide
Explains how to install and configure the P6 Integration
API, which allows direct access to P6 EPPM via Java.
Those creating client code in Java and needing direct
access to the P6 EPPM database should read this guide.
P6 Web Services
Administrator’s Guide,
P6 Web Services
Programmer’s Guide,
and P6 Web Services
Reference Manual
Explains how to install and configure P6 Web Services,
which enables organizations to seamlessly integrate P6
EPPM functionality into other applications using web
services standards. The P6 Web Services Programmer’s
Guide, available as an HTML help system, describes
how to invoke, use, and troubleshoot the available
services/operations within supported environments. The
P6 Web Services Reference Manual, also available as
an HTML help system, describes all services and
operations available in P6 Web Services in a
comprehensive manner.
P6 SDK Web-based
documentation
Describes how to use the P6 SDK to connect to the P6
EPPM database. The tables, fields, and stored
procedures that you can access through the P6 SDK are
described. Examples are also provided to show how
you can use the P6 SDK to perform several basic tasks,
such as creating a new project or assigning a resource
to a project activity. The P6 EPPM network
administrator/database administrator and P6
administrator should read this documentation, which is
available in local drive\Program
Files\Oracle\Primavera P6 Professional\PMSDK\Doc\
by default. Double-click the INDEX.HTML file to open the
Table of Contents.
P3 to P6 EPPM
Migration Guide
This guide provides best practices for migrating your P3
data to P6 EPPM, and details how P3 functionality maps
to P6 EPPM functionality.

Preface
43
P6 Reporting Database
Administrator’s Guide
This document explains how to install and configure the
P6 Reporting Database application, and generate the
ODS database. It describes how to install and configure
the Oracle Gateway if the P6 Reporting Database is
installed on a Microsoft SQL Server. It also provides
information about how to run the Configuration Utility
P6 Reporting Database
User’s Guide
Provides information about using ODS and Star (if you
purchased P6 Analytics) with the P6 EPPM database to
extract data that you can use to create reports.
Distributing Information to the Team
You can copy the online documentation to a network drive for access by project
participants. Each team member can then view or print those portions that specifically
relate to his or her role in the organization.
Where to Get Support
If you have a question about using Oracle Primavera products that you or your network
administrator cannot resolve with information in the documentation or help, go to:
http://www.oracle.com/us/support/index.html
This page provides the latest information on contacting Oracle Global Customer Support
and the support renewals process.
Go to http://download.oracle.com/docs/cd/E17266_01/index.htm for the latest updates
to the P6 EPPM 8.0 Documentation library.


45
In This Chapter
Roles and Responsibilities ......................................................................................... 45
Set Your Goals and Business Objectives ................................................................ 47
Develop an Implementation Strategy ................................................................... 47
Assess Needs .............................................................................................................. 49
Communicate the Plan ........................................................................................... 51
Roles and Responsibilities
The following section describes the organizational roles as they typically apply to the
modules in P6 EPPM. Roles can vary or overlap, depending on the organization and
industry.
Network administrators
Network administrators configure an organization’s network environment (local and wide
area networks) for optimal performance with P6 EPPM. They install and maintain the
server and client components in P6 EPPM. They manage user access to project data and
develop and maintain a comprehensive security policy to ensure that project data is
protected from unauthorized access, theft, or damage.
Network administrators ensure that the hardware and software supporting P6 EPPM
function reliably by
Setting up and maintaining the network to ensure reliable connections and the
fastest possible data transfer;
Creating and maintaining accurate lists of network resources and users so that each
has a unique network identity.
Database administrators
Database administrators (DBAs) are responsible for setting up, managing, and assigning
access rights for the P6 EPPM databases. They set and oversee rules governing the use of
corporate databases, maintain data integrity, and set interoperability standards.
Database administrators ensure reliable access to the databases by
Installing, configuring, and upgrading database server software and related products
as required;
Creating and implementing the databases;
Monitoring database performance and tuning as needed;
Implementation Strategy
P6 EPPM User's Guide
46
Planning for growth and changes and establishing and maintaining backup and
recovery policies and procedures.
Program managers
Program managers are responsible for strategic planning and ongoing performance
analysis. They use P6 to identify and monitor problem areas in current projects and
analyze past projects to apply lessons learned when planning future projects.
Program managers might be responsible for
Initiating, prioritizing, and budgeting projects;
The profit/loss for a specific business unit;
Funding and go/no-go decisions about projects.
Project managers and schedulers
Project managers and/or project schedulers are responsible for managing multiple small,
repetitive projects or a single, complex project. They use P6 Professional and/or P6 to
Add projects to the database;
Determine resource requirements for a project;
Perform cross-project analysis;
Perform baseline analysis;
Manage projects to on-time and on-budget completion;
Plan projects before they are funded.
They might also perform detailed financial analysis of projects, handle project billing, and
integrate financial information within the company.
Crew foreman
Crew foremen manage the work for a project that might be a portion of a larger project.
They are managers who produce work and manage a team, and they often use P6 and
P6 Progress Reporter to prioritize short-term tasks or objectives, typically when the
duration is less than the planning period of the project.
Crew members
Crews are trained in a specific skill required on a project. They work with their manager to
develop activities and durations for incorporation into the schedule. Once activities are
added to the schedule, crew members update them using P6 or P6 Progress Reporter to
indicate the work they performed during designated accounting periods.

Implementation Strategy
47
Set Your Goals and Business Objectives
In most companies, though their scope and duration can vary, projects tend to have
similar goals: improve quality, reduce costs, increase productivity and revenue, reduce
delivery time, and streamline operations. Often, the ultimate goal is to gain a
competitive advantage. Controlling these projects is becoming increasingly difficult,
especially if they are planned and run by project teams that are distributed across
multiple locations. Organizations need to ensure that each team stays on track with its
projects without losing sight of company objectives.
Company-wide project management using P6 EPPM enables project teams to plan and
control their work while providing a continuous, centralized understanding of progress
and performance. To begin the process of implementing P6 EPPM, you might want to
broaden your project management goals to focus on the multi-user, role-based
environment.
Specific objectives could include:
Providing the project office with access to dynamic status information that they can
use to make timely decisions.
Improving efficiency of resource use by properly allocating skilled labor,
communicating methodologies, and forecasting resource needs more accurately.
Improving productivity across the project team as a result of continuous
collaboration.
Improving communication with all project participants through the use of integrated,
organizational-wide products that put project information on individual's desktops.
Increasing accountability by making consistent, summarized project status
information available to top management.
Increasing quality and client satisfaction through the use and reuse of best practices.
Enabling maintenance of performance data on completed projects to confirm
estimating metrics, generate new or revise existing templates, and collect job cost
data.
Integrating with other business systems to provide a total information system.
These goals are specific to project management. You can include additional goals that
are particular to your company or industry. For example, one specific objective for a
construction company might be to complete the inspection process in a more timely
manner. Use best practices from your industry as a guide to setting your goals.
Develop an Implementation Strategy
Implementing P6 EPPM successfully requires that an appropriate "culture" be established
within your organization. Instead of having many independent projects with no ability to
aggregate and control them, you can now have a consolidated, organized project
information system.

P6 EPPM User's Guide
48
Creating the culture requires an understanding of the data and how it flows, and the
roles and responsibilities of individuals as project participants and managers. Your
challenge will be to create an open environment in which all these participants share
data and performance information.
You wouldn’t think of allowing construction workers to work on a job site without
designating a field manager to oversee the work, nor would you implement a new
project without assigning a general contractor. The project management environment is
best created by your own expert staff, who would perform an equivalent function—if you
don’t have such a person, you need one. Designate one person or a team of people to
plan and coordinate the implementation. The responsibility of this team will be to
develop an implementation strategy that includes helping participants understand the
organizational project management approach. You might decide you need help with
your implementation from Oracle Primavera Consulting or one of our business partners.
Contact Oracle Primavera for more information.
While the implementation strategy will be specific to your organization, it will most likely
include a needs assessment as one of the first steps. Even though you are already using
project management software, take the opportunity to analyze and determine your
company’s business requirements, along with system requirements and the processes
necessary to fulfill those requirements. You will also need to determine how to structure
data to facilitate those processes. It is important to document the processes and
procedures that you define. Assessing needs is discussed in more detail in Assess Needs.
To ensure that data is flowing as planned, create a prototype. Use real project data to
set up structures in a test database and run your processes through a typical work cycle.
The prototype should include all components of P6 EPPM you’ll be using, along with any
interfaces to external applications. Develop a plan that identifies all the possible
scenarios to test. Include a method for collecting test data and a way to resolve issues.
Use this step to make sure your system requirements are sufficient to meet the needs of all
users.
A prototype can be followed by a pilot program, where you establish a small group of
users to work with P6 in their environment. They can be introduced to the software using
familiar project data while performing their daily work tasks. More than likely, the pilot
users will identify flaws in the processes and have suggestions and questions. Make
refinements and changes based on their feedback. You can also want to begin internal
training programs at this time, using your pilot group of users. Ongoing performance
monitoring should continue during this stage and adjustments made as necessary.
When the pilot program is satisfactory, a rollout of P6 EPPM to your entire company can
begin. This step involves installing the client software on all necessary desktops and
populating the database with project data. You should develop a rollout schedule and
get the appropriate approvals. Be sure to include the lessons learned from the pilot
testing. Communicate the rollout schedule to ensure its success.
Implementation Strategy
49
Assess Needs
A needs assessment is a crucial step to a successful P6 EPPM implementation. It will
provide the basis for the entire system design, how it will operate, and who will use it.
Assessing needs can range from an evaluation of the corporate culture to analyzing
hardware/software requirements to reviewing existing processes and developing new
ones. Most of your information will come from interviewing key personnel. Meet with
representatives from all areas of the company who participate in the project
management process, from the owners to the individuals doing the actual work. Ask
questions about the tasks they need to perform and the project information they need to
know to do their jobs effectively.
Determine corporate culture
As mentioned, understanding the corporate culture plays an important role in any major
implementation. You need to know ahead of time whether your company is ready,
willing and capable for the change. Evaluate your company’s state of readiness for
company-wide project management. For example,
Does your organization have a clear understanding of project management?
Are they familiar with computers and software?
Are standard processes in place for managing projects?
If the answer to these questions is No, include a training program in your implementation
plan. Depending on the degree of readiness, you might also need to address issues that
involve preparing employees mentally for dealing with change.
Define hardware/software requirements
Review the system requirements necessary to run P6 EPPM. Then, conduct interviews with
your Information Technology (IT) personnel, or those responsible for maintaining network
integrity and new hardware/software installations to inquire about the current technical
environment. Include questions, such as
Do you have servers or hardware in place? If so, what kind?
How are remote locations managed?
Do you have separate servers for development and production?
Are you running Oracle or SQL server on one or more servers? If so, which version?
Are you running any other database software?
Do you have a LAN and/or WAN in place?
Do you have mobile user requirements?

P6 EPPM User's Guide
50
Answers to these types of questions will help you determine your hardware specifications.
Be sure to identify items such as database server requirements, application server
requirements, LAN requirements, and PC requirements. This step should be performed
early in the process, since you might need to order new equipment or upgrade existing
software before installing P6 EPPM.
Define integration requirements
While examining hardware requirements, review any integration requirements.
Will you be interfacing with other software systems, such as ERP?
Will custom integration to an existing financial system or asset management system
be required?
Do you have resources who are skilled to develop necessary interfaces or are
consultants required?
If you are integrating P6 EPPM with third-party applications or legacy systems, you should
identify interface points that provide continuous flow of data while minimizing data loss.
Define how data is structured
To manage projects successfully in P6 EPPM, you first need to set up data structures for
your organization, projects, resources, and costs. You might also want to define special
codes to help you organize and report on data more effectively. To structure data
properly, review how you handle data currently along with how you want to handle it.
For example,
How do you group projects? How many levels of projects do you have?
Are projects cross-departmental? Do they have multiple locations?
What is your typical project scope, size, and cost?
How many projects are you managing at one time?
What is your organizational structure?
How do you group resources? Are resources assigned to projects as groups or
individuals? Are resources shared across projects?
Do you track skills for each resource?
Do you have a work breakdown structure already in place?
Do you have a need for multiple calendars? Do resources need calendars?
What types of reports do you use? How often are they produced?
When you answer these types of questions, you can define the necessary data
structures, such as the project hierarchy, organizational breakdown structure, and the
work breakdown structure.
Implementation Strategy
51
Determine current procedures/processes
To define how data will flow in P6 EPPM, you need to understand how your business
operates. Look at your current processes and procedures and modify them to suit your
project management objectives. Making decisions early about process changes saves
time and money. Answer the following types of questions when you analyze business
processes.
Do you have a project methodology in place? If so, is it working?
What is the life cycle of a project?
What are the determining factors in deciding if a project is go or no-go?
How are decisions made regarding project selection and budgeting?
Is your budgeting/planning process top-down or bottom-up oriented?
How do you estimate and track costs?
Do you have a Project Management Office or something similar?
What time reporting mechanism do you use?
How do you track and measure progress?
How do project participants get work assignments?
What is your process for communicating project information to others?
What information do you require or expect from the project management process?
Who controls security? What security is required for project information? Do you need
to restrict data access on a group or individual basis?
Communicate the Plan
In successful P6 EPPM implementations, people accept the changes and use the
new system. Any new system or business process means a change to the way people are
currently doing their jobs. Employees who are affected by the change need to know
what to expect. Top management also needs to know what is going on if they are to
provide support and commitment.
Communicate the implementation plan early and repeat it often. Set expectations and
manage them continuously, being careful to avoid disappointing, frustrating, or
surprising people.
There are many ways to communicate the implementation plan. You could introduce
the plan at a company meeting along with a demonstration of P6 EPPM to show how it
will benefit the entire organization. Explain any changes to business processes that might
occur and what it means to individuals. Define a timeframe so everyone knows when the
changes will happen. Encourage people use the software and experiment hands-on to
increase their comfort level when it comes time for them to make the change. Publicize
commitment by ensuring that the implementation team has support and by providing
training programs and seminars. Provide a method for all levels of the organization to
address concerns, questions, and suggestions.
Read the topics under, The Implementation Process (on page 53), to learn about the
data structures and how they fit together in P6 EPPM.

P6 EPPM User's Guide
52
If you foster a challenging workplace that can develop individual careers along with
open communication, those individuals will want to make the process successful.

53
In This Chapter
Understanding Data Structures in P6 EPPM ........................................................... 53
Connecting Data Structures ................................................................................... 55
Understanding Data Structures in P6 EPPM
P6 EPPM contains many data structures to support your project management needs and
business processes. Well-defined structures make entering data faster and easier; they
enable you to organize and summarize data more effectively. Review the following
definitions to help you better understand the data structures in P6 EPPM.
Enterprise project structure (EPS)
The EPS is a hierarchy that represents the breakdown of projects in a company. Nodes at
the highest, or root, level might represent divisions within your company, phases of
projects, or other major groupings that meet the needs of your organization, while
projects always represent the lowest level of the hierarchy. Every project in the
organization must be included in the EPS.
Resource hierarchy
The resource hierarchy represents the people, materials, and/or equipment used to
perform work on activities. The resource hierarchy includes the resources across all
projects in the organization. Resources are assigned to activities in P6 EPPM and can be
set up to use P6 Progress Reporter to report actual workhours.
Role hierarchy
The role hierarchy represents the roles, or job titles, that exist in your organization and
have some responsibility to complete project requirements. You can associate resources
with roles. In the planning stages of a project, you can assign roles to activities to
establish an initial project plan without committing individual resources to activities; then,
before work on an activity begins, you can assign a resource that meets the defined role
requirements. You are not required to define a role hierarchy.
Work breakdown structure (WBS)
The WBS is a hierarchical arrangement of the products and services produced during
and by a project. In P6 EPPM, the project is the highest level of the WBS, while an
individual activity required to create a product or service is the lowest level. Each project
in the EPS has its own WBS.
The Implementation Process

P6 EPPM User's Guide
54
Organizational breakdown structure (OBS)
The OBS is an outline of managers responsible for the projects in your company. There is
one OBS for the entire organization. It is used to control access to projects and data.
Project, activity, and resource codes
In addition to the EPS, WBS, and resource hierarchy, you can also create coding
structures. Codes allow you to categorize projects, activities, and resources that have
similar attributes; you can group, sort, filter, and summarize based on these codes.
Calendars
Calendars define standard workdays and the available number of hours in each day,
along with holidays, vacations, and other nonworktime. You can create global,
project-specific, and resource-specific calendars. Calendars are assigned to activities
and/or resources; they determine start and end dates during scheduling and resource
leveling.
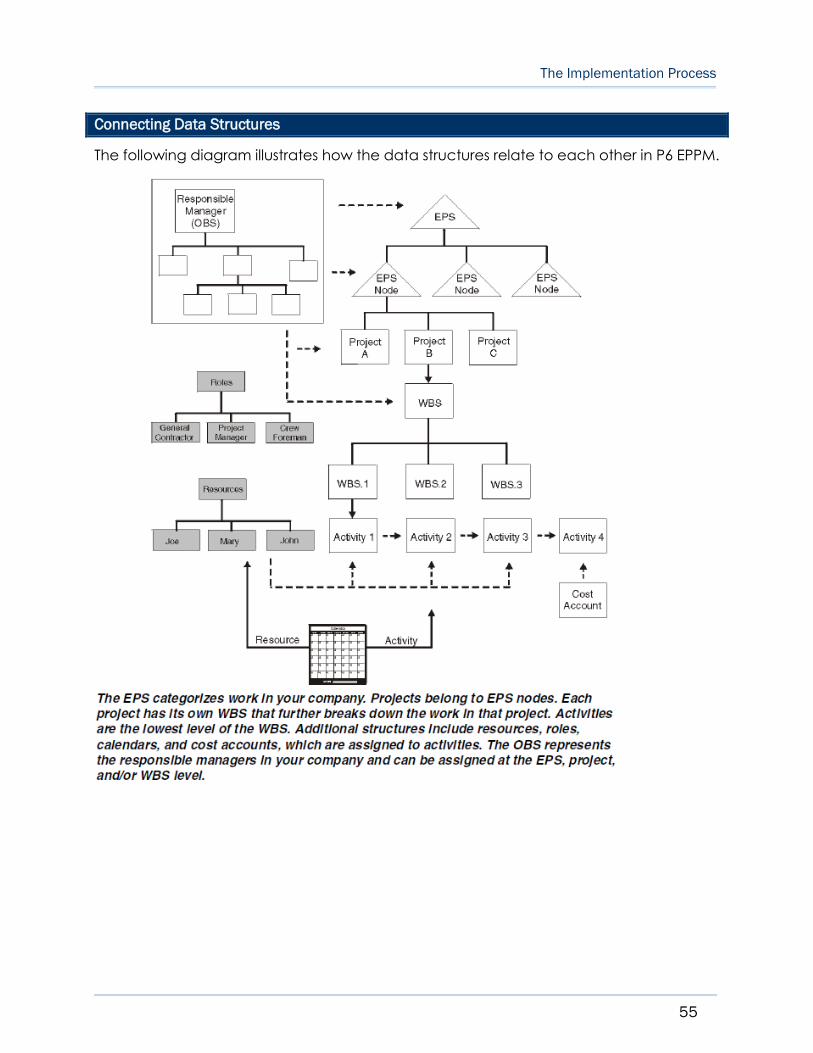
The Implementation Process
55
Connecting Data Structures
The following diagram illustrates how the data structures relate to each other in P6 EPPM.


57
In This Chapter
Process Overview: Structuring Data in P6 EPPM ................................................... 57
Setting Up the Enterprise Project Structure ............................................................ 58
Setting Up the Organizational Breakdown Structure ........................................... 71
Defining Resources and Roles ................................................................................. 73
Setting Up The Work Breakdown Structure ............................................................ 88
Establishing Project Codes....................................................................................... 91
Working With User Defined fields ............................................................................ 95
About Calendars .................................................................................................... 103
Process Overview: Structuring Data in P6 EPPM
The hierarchical structuring of data serves as the foundation before the addition of
actual project data. The following sequence is suggested for setting up the main
structures:
Administrators, working with program managers and project managers, structure the EPS
and OBS hierarchies. An EPS can consist of multiple root nodes, which enable particular
types of projects to be grouped together, such as project templates or high-risk projects.
Within each root node, you can further break down an EPS into multiple EPS nodes to
categorize the types of projects.
Structuring Projects

P6 EPPM User's Guide
58
The WBS acts as a continuation of the EPS for the individual projects in the enterprise. A
WBS provides organization and control of project and activity information through a
hierarchy of WBS elements. When you create projects, P6 EPPM automatically creates a
WBS element at the same hierarchy level and with the same name as the project. The P6
EPPM enables you to set anticipated project dates, budgets, and spending plans for a
WBS at a high level to indicate when the work should occur and how much its planned
budget and monthly spending should be. You can use the pre-established budget
amounts and funding information you set for WBS elements for their project and activity
counterparts.
Setting Up the Enterprise Project Structure
About the Enterprise Project Structure (EPS)
The enterprise project structure (EPS) represents the hierarchical structure of all projects in
the database. The EPS can be subdivided into as many levels or nodes as needed to
represent work at your organization. Nodes at the highest, or root, level might represent
divisions within your company, project phases, site locations, or other major groupings
that meet the needs of your organization; projects always represent the lowest level of
the hierarchy. Every project must be included in an EPS node.
The number of EPS levels and their structure depend on the scope of your projects and
how you want to summarize data. For example, you might want to define increasingly
lower levels of EPS nodes, similar to an outline, to represent broad areas of work that
expand into more detailed projects. Specify as many projects as needed to fulfill the
requirements of your operations executives and program managers.
Multiple levels enable you to manage projects separately while retaining the ability to roll
up and summarize data to higher levels. For example, you can summarize information for
each node in the EPS. Conversely, you can use top-down budgeting from higher-level
EPS nodes down through their lower-level projects for cost control.
User access and privileges to nodes within the EPS hierarchy are implemented through a
global organizational breakdown structure (OBS) that represents the management
responsible for the projects in the EPS. Each manager in the OBS is associated with an
area of the EPS, either by node or by project, and the WBS of the particular level of the
hierarchy.
Once you have added users and associated them with OBS elements and project
profiles, you can define the EPS and assign a responsible manager (OBS element) to
each level. You must specify a responsible manager for each node of the EPS.

Structuring Projects
59
Working with the EPS
Your database of projects is arranged in a hierarchy called the enterprise project
structure (EPS). The EPS can be subdivided into as many levels or nodes as needed to
parallel work at your organization. Nodes at the highest, or root, level might represent
divisions within your company, project phases, site locations, or other major groupings
that meet the needs of your organization. Projects always represent the lowest level of
the hierarchy. Every project must be included in an EPS node.
Ideally, one person or group controls the EPS across the organization. The project control
coordinator creates the hierarchical structure that identifies the company-wide projects.
The coordinator works with the project manager in each area of the organization to
define basic project information for each group and to develop standards before any
projects are added.
Organizational breakdown structure (OBS)
User access and privileges to nodes within the EPS hierarchy are implemented through a
global OBS that represents the management responsible for each project. Each
manager in the OBS is associated with an area of the EPS, either by node or by project,
and the WBS of the particular level of the hierarchy.
Build the hierarchy
After you set up an EPS, you can define additional data about each EPS node, such as
anticipated dates, budgets, and spending plans. Use the detail windows on the EPS
page to specify this information. Or, you can begin adding projects under the applicable
nodes in the structure if you have access rights to these functions. Access rights are set by
your application administrator.

P6 EPPM User's Guide
60
Throughout the application, when selecting projects to work with, you can open all
projects that belong to an EPS node or sort them by EPS. When you create a project, you
must specify a single parent EPS node.
The EPS Page
Item Description
Actions, Edit, and View menus: Use these menus to customize the EPS
page.
EPS toolbars: Customize the toolbars to include toolbuttons that you use
often.
Project View toolbar: Determines how you see data on the EPS page.
Project table: Displays each project within the EPS. In this example, the
data is grouped to three (3) levels by EPS, grouped at a fourth level by
Original Budget, and sorted by Risk Level.
EPS Gantt chart: Displays project and EPS data in a Gantt chart format.

Structuring Projects
61
Creating EPS Elements
Create enterprise project structure (EPS) elements to represent the hierarchical positions
of all the projects in your database. You can create sibling EPSs to represent those that
are hierarchically equal, or child EPSs to represent those that are subordinate.
To create EPS elements:
1) Click Projects.
2) On the Projects navigation bar, click EPS.
3) On the EPS page:
a. Select an EPS. The EPS can act as a sibling or a parent.
b. Click the Actions menu:
To add a sibling, select Add Add Sibling EPS (Shift+Insert).
To add a child, select Add Add Child EPS (Ctrl+Insert).
c. Enter a name in the EPS/Project Name field of the new EPS.
d. Click the Actions menu and select Save (Ctrl+S).
Tips
You might find it helpful to apply the EPS Only standard filter when creating an EPS
element. This will remove all projects and templates from the view so you can easily
see where your new EPS fits into the EPS hierarchy as a whole. See Applying Filters (on
page 139).
To create an EPS, the entire EPS hierarchy must be visible, so you might have to
configure your grouping or filter settings. Grouping should be configured to have the
Field list set to EPS and the To Level list set to All. Also, the Hide if empty option cannot
be selected. Filtering cannot be configured to display projects that belong to an EPS
as this will select the Hide if empty option.
The application automatically names the new EPS New EPS, New EPS-1, New EPS-2, et
cetera.
You can also right-click an EPS on the table and select Add Child EPS or Add Sibling
EPS to create an EPS.
Configuring the EPS
Configure the EPS for your organization to develop a hierarchy that establishes the way
your organization operates. Divide the EPS into multiple levels or nodes to represent the
work that needs to be done in your organization. You can then assign projects to these
nodes and levels to reflect work that needs to be done in each area.
The number of EPS levels and their structure depend on the scope of your projects and
how you want to summarize data. For example, you might want to define increasingly
lower levels of EPS nodes, similar to an outline, to represent broad areas of work that
branch into more detailed projects.
To configure the EPS:

P6 EPPM User's Guide
62
1) Click Projects.
2) On the Projects navigation bar, click EPS.
3) On the EPS page:
a. Create the EPSs you need to represent the divisions in your company, site
locations, or other major groupings of projects. See Creating EPS Elements (on
page 61).
b. Use the Move Up (Ctrl+Alt+Up), Move Down (Ctrl+Alt+Down), Move Left
(Ctrl+Alt+Left), and Move Right (Ctrl+Alt+Right) arrows on the Edit menu to
arrange the EPS nodes in a hierarchy that establishes the highest level and lowest
level EPSs.
c. Add projects to the EPS nodes. See Creating Projects (on page 62) or Creating
Projects from Existing Projects or Templates (on page 63).
4) On the EPS page, click the Actions menu and select Save (Ctrl+S).
Tips
The farther to the left an EPS is, the higher-level EPS it is.
About Projects
A project is any temporary series of activities performed in some coordinated
arrangement in order to create a product, service, or measurable business result.
Projects have a definite beginning and end. A project is concluded when its objectives
have been reached or when the project is terminated.
Creating Projects
Create projects to define a set of activities and WBSs that work toward a common goal.
To create a project:
1) Click Projects.
2) On the Projects navigation bar, click EPS.
3) On the EPS page:
a. Select the EPS element to which you want to add the new project.
b. Click the Actions menu and select Add Add Project.
4) In the Add Project dialog box:
a. Click the General tab and select an option or enter a value in each required field.
Note: You can add a description or a Must Finish By date. You can
also copy the project from an existing project or template.
b. Click Create.

Structuring Projects
63
Tips
To configure advanced options, you must select a project to copy. This will enable
the Advanced tab. If you select to copy a template, the Advanced tab will not be
enabled.
You can also right-click the table and select Add Project to create a project.
You can copy existing projects to create new projects.
Creating Projects from Existing Projects or Templates
In place of making a project from scratch, you can use a template or a copy of an
existing project as a starting point.
To create a project from an existing project or template:
1) Click Projects.
2) On the Projects navigation bar, click EPS.
3) On the EPS page:
a. Select the EPS element to which you want to add the new project.
b. Click the Actions menu and select Add Add Project.
4) In the Add Project dialog box, click the General tab.
5) On the General tab:
a. Select an option or enter a value in each required field.
b. In the Copy from existing project or template field, click Select Project or
Template to Copy and select an option from the dialog box.
Note: Click Select Project Type and select Projects or
Templates to open the list of projects or templates.
c. Click Create.
Tips
To configure advanced options, you must select a project to copy. This will enable
the Advanced tab. If you select to copy a template, the Advanced tab will not be
enabled.
You can also right-click the table, select Add Project, and follow steps 4 and 5 to
create a project from an existing project or template.
You cannot copy from a project unless you have the privilege to view costs for a
project.

P6 EPPM User's Guide
64
Deleting Projects or EPSs
Delete projects or EPSs when they are no longer necessary.
To delete projects or EPSs:
1) Click Projects.
2) On the Projects navigation bar, click EPS.
3) On the EPS page:
a. Select the project or EPS to delete.
b. Click the Actions menu and select Delete (Delete).
c. In the Primavera P6 dialog box, click Yes.
d. Click the Actions menu and select Save (Ctrl+S).
Caution:
You cannot retrieve deleted projects.
When you delete a project or EPS, you are also deleting all of
the WBSs, activities, and projects (if you are deleting an EPS)
contained therein.
Opening Projects or Templates in the EPS
You can open projects or templates from the EPS page. When you then move to other
areas of the application, such as the Workspace page, these projects or templates will
be open.
To open EPS node projects or templates:
1) Click Projects.
2) On the Projects navigation bar, click EPS.
3) On the EPS page:
a. Select a project, project template, or EPS to open.
Note: If you select an EPS, all the projects contained in that EPS will
also open.
b. Click the Actions menu and select Open Project or Open Project
Template.
Tips
You can open more than one project or EPS at a time. Use Shift+click or Ctrl+click to
select all the items you want to open.
You can also right-click a project and select Open Project or Open Project Template
from the menu to open a project or project template.

Structuring Projects
65
You cannot open a template in combination with any other item.
To close a project, right-click the project you want to close and select Close Project.
To close all of the open projects on the EPS page, click the Actions menu on the EPS
page and select Close All.
When a project is open, it will display an open folder icon . When a project is
closed, its corresponding folder icon will also be closed .
The Team Usage, Workspace, Documents, and Issues pages are not available if you
are working with a project template.
Customizing Detail Windows
You can customize which detail windows appear on the EPS or Activities pages.
To customize detail windows:
1) Open one or more projects in the Projects section using one of the following methods:
Click Projects to open the last project or group of projects you were working
with.
Click the Projects menu and choose one of the most-recently used projects
or group of projects.
Click the Projects menu and choose Open Projects to select a project or
group of projects by portfolio type, EPS node, or project code.
2) On the Project navigation bar, click Activities or EPS.
3) On the Activities or EPS page:
a. Select a view from the Activity or EPS View list.
b. Click the View menu and select Customize Detail Windows.
4) In the Customize Detail Windows dialog box:
a. In the Area section, select one of the options to determine which listing of detail
windows is available for you to customize.
b. In the Detail Window section, select or clear the options beside detail windows to
add or remove them from the page.
c. Click Save.
Tips
Select or clear the option beside the Detail Window title to add all or remove all the
detail windows.
Right-click a detail window tab to customize detail windows. Click Customize on the
menu to open the Customize Detail Windows dialog box, or click a detail window
name to add or remove it from the page.
Click and drag detail windows to change their order. Otherwise, the detail windows
appear in the same order that they appear in the Customize Detail Windows dialog
box.

P6 EPPM User's Guide
66
Click Float on the detail window to convert it to a dialog box. You can then drag
this dialog box to change its position.
When you navigate to a new page, you can save or cancel the view changes you
made to the detail windows. These changes will only be saved for the view selected
in the Activity or EPS View list.
Configuring Project Preferences
Set project preferences to configure basic settings for the selected project.
To configure project preferences:
1) Click Projects.
2) On the Projects navigation bar, click EPS.
3) On the EPS page:
a. Select a project.
b. Click the Actions menu and select Set Project Preferences....
4) In the Project Preferences dialog box, configure the tabs as needed for the selected
project.
a. Configure the Calculations tab. See Configuring Project Calculations (on page
66).
b. Configure the Contract Management tab. See Linking Contract Management
Data (on page 346).
c. Configure the Defaults tab. See Configuring Project Defaults (on page 67).
d. Configure the General tab. See Configuring General Project Preferences (on page
68).
e. Configure the Progress Reporter tab. See Configuring P6 Progress Reporter (on
page 68).
f. Configure the Summarization tab. See Configuring Project Summarization (on
page 68).
g. When you are finished, click Save and Close.
Configuring Project Calculations
Configure project calculations to define how the application will compute values
concerning activities, earned value, and units and costs.
To configure project calculations:
1) Click Projects.
2) On the Projects navigation bar, click EPS.
3) On the EPS page:
a. Select a project.
b. Click the Actions menu and select Set Project Preferences....
Structuring Projects
67
4) In the Project Preferences dialog box, click the Calculations tab.
5) On the Calculations tab:
a. Configure the options in each section.
b. Click Save to continue working or click Save and Close if you are finished.
Linking P6 and Contract Management Projects
When the P6 and Contract Management applications are linked, you can then link a
specific project in P6 to a Contract Management project. This will enable you to view
up-to-date contractual information for the project within portlets.
To link a P6project to a Contract Management project:
1) Click Projects.
2) On the Projects navigation bar, click EPS.
3) On the EPS page:
a. Select a project.
b. Click the Actions menu and select Set Project Preferences....
4) In the Project Preferences dialog box, click the Contract Management tab.
5) On the Contract Management tab, click Group Name: Project Name .
6) In the Primavera P6 dialog box, log on to Contract Management.
7) In the Select Project and Group dialog box, expand a project, select a group, and
click OK.
8) In the Project Preferences dialog box, click Save to continue working or click Save
and Close if you are finished.
Tips
To link the project to a Contract Management project, you must have a valid user name
and password. If you have a Contract Management user name and password that is the
same as the user name and password with which you are currently logged in to P6, you
are not prompted to login again. If you do not have the same user name and password
for both applications, you must enter a valid Contract Management user name and
password in the Primavera P6 dialog box.
Configuring Project Defaults
Configure project defaults to define how new activities and assignments will display in a
project.
To configure project defaults:
1) Click Projects.
2) On the Projects navigation bar, click EPS.
3) On the EPS page:
a. Select a project.

P6 EPPM User's Guide
68
b. Click the Actions menu and select Set Project Preferences....
4) In the Project Preferences dialog box, click the Defaults tab.
5) On the Defaults tab:
a. Configure the defaults to represent how you want the application to handle new
activities and assignments.
b. Click Save to continue working or click Save and Close if you are finished.
Configuring General Project Preferences
Configure general project preferences to specify general information concerning the
project such as when the fiscal year begins.
To configure general project preferences:
1) Click Projects.
2) On the Projects navigation bar, click EPS.
3) On the EPS page:
a. Select a project.
b. Click the Actions menu and select Set Project Preferences....
4) In the Project Preferences dialog box, click the General tab.
5) On the General tab:
a. Configure the field and list.
b. Click Save to continue working or click Save and Close if you are finished.
Configuring P6 Progress Reporter
Configure statusing and managing activities options to specify how users interact with
activities.
To configure P6 Progress Reporter:
1) Click Projects.
2) On the Projects navigation bar, click EPS.
3) On the EPS page:
a. Select a project.
b. Click the Actions menu and select Set Project Preferences....
4) In the Project Preferences dialog box, click the Progress Reporter tab.
5) On the Progress Reporter tab:
a. Configure the options for each section.
b. Click Save to continue working or click Save and Close if you are finished.
Configuring Project Summarization
You can configure how projects are summarized.
To configure project summarization:

Structuring Projects
69
1) Click Projects.
2) On the Projects navigation bar, click EPS.
3) On the EPS page:
a. Select a project.
b. Click the Actions menu and select Set Project Preferences....
4) In the Project Preferences dialog box, click the Summarization tab.
5) On the Summarization tab:
a. Select or clear the Enable Summarization option.
b. If you select the option, configure the newly enabled options and list.
c. Click Save to continue working or click Save and Close if you are finished.
Tips
If you clear the Enable Summarization option on the table, you will be asked if you would
like to delete the summary information. If there is no summary information, then the
application will not prompt you.
About Project Templates
Project templates are reusable models of projects you can store and use later, in whole
or in part, to save time and standardize your operations.
A template includes all the details, best practices, and de facto standards your
organization associates with projects of a particular type. For example, use project
templates to create a library of predefined project structures that can later be used as
starting points for new projects. In addition, specific WBS branches and their activities
can be copied from projects or templates and inserted wherever you need them.
You can organize your template projects within the EPS, assign them project codes, and
provide them with descriptions to aid in reuse. You can create templates from projects or
to create projects from templates. You can also create projects based on other projects,
and templates based on other templates.
Working with Project Templates
Project templates act as a format that you can use when creating new projects or
templates.
Working with project templates
The Documents, Issues, Team Usage, and Workspace pages are not available for project
templates. If you navigate to one of these pages while working with a project template,
you will see the message: Project templates are not supported on this page. When
working with templates on the Activities or EPS pages, the Issues and Documents detail
windows are visible but their icons are disabled.

P6 EPPM User's Guide
70
Creating project templates
You can create a brand new project template, or you can copy and modify an existing
template or project to make a new template. If you select to copy a project or template,
you can copy the entire template, or you might insert only the WBS portion into a project.
Because issues and documents are not available for project templates, when you copy
an existing project to make a template, the issue and document information does not
carry over.
When you copy a project to create a template, some fields are automatically cleared of
any values and disabled to prevent the reuse of data out of context. For example,
actual dates and costs are not permitted in templates.
Opening project templates
Project templates cannot be opened in conjunction with other project templates or with
projects. If you open a project or a project template on the EPS page when you have a
project template open, the initial project template will close. Conversely, if you have a
project or group of projects open and you open a project template, the projects will
close.
This is also true when working in the Open Projects dialog box. For example, when you
have a project template open, the Open Projects dialog box will display the template in
the Selected Templates list. If you add a project to the Selected list, the application will
remove the project template from the list. If you already have a project template
selected, the application will not allow you to add another template to the list. On the
other hand, if you try to open a project template when projects are already open, the
projects are replaced by the project template.
Creating Project Templates
You can create project templates to act as a standard or format for future projects.
To create project templates:
1) Click Projects.
2) On the Projects navigation bar, click EPS.
3) On the EPS page:
a. Select the EPS element to which you want to add the new project template.
b. Click the Actions menu and select Add Add Project Template.
4) In the Add Project Template dialog box:
a. Click the General tab and configure each required field.
Note: You can add a description or copy from an existing project
or template.
b. Click Create.

Structuring Projects
71
Tips
To configure advanced options, you must select to copy from an existing project or
template. This will enable the Advanced tab.
If you choose to copy from an existing project, select either the Use Actual Costs and
Units or Use Planned Costs and Units option. If you select to copy from a template, the
application will disable the Use Actual Costs and Units option.
You can also right-click the table and select Add Project Template to create a
project template.
Setting Up the Organizational Breakdown Structure
About the OBS
The organizational breakdown structure (OBS) is a hierarchical way to represent the
managers responsible for the projects in your enterprise. You can associate the
responsible managers with their areas of the enterprise project structure (EPS) with either
an EPS node or a project. When you associate a responsible manager with an EPS node,
any projects you add to that branch of the EPS are assigned that manager element by
default. An OBS supports large projects that involve several project managers with
different areas of responsibility.
To access a project, a user must have access permissions for an OBS element within the
project. You can then assign users to OBS elements. When you assign users to OBS
elements, users get access privileges to projects and EPS nodes where they have OBS
access. The type of access granted to a user is determined by the project security profile
assigned to the user.
Creating an OBS
Create an organizational breakdown structure (OBS) to hierarchically represent the
managers responsible for your projects. You must have the appropriate privileges to
create an OBS.
To create a new OBS:
1) Click the Administer menu and select User Access.
2) On the User Access page, click OBS.
3) On the OBS page:
a. Click Add.
Note: The OBS is automatically added as a child of another OBS.
b. Move the OBS to the correct location in the list and hierarchical position by
clicking the Move Up, Move Down, Move Left, or Move Right arrows.
c. In the OBS Name field, double-click and type a unique name.
d. Click the Users detail window.
P6 EPPM User's Guide
72
4) In the Users detail window, remove or assign users to the OBS.
To remove a user from the OBS, select a user and click the Delete icon.
To assign a user to the OBS, click the Add icon.
5) In the Select Users dialog box, select a user and click OK.
6) On the OBS page, click Save.
Tips
When you set up enterprise project structure (EPS) nodes, a root OBS is automatically
assigned to the root EPS.
When you create a new project, the default responsible manager is automatically
assigned so that an OBS element is available for each work breakdown structure
(WBS) element added to the project.
Assigning Users to an OBS
Except for a project owner or a Team Member user, a user must have permission to
access an organizational breakdown structure (OBS) to access a project assigned to
that OBS. If you have appropriate privileges, you can assign users to OBS elements using
their login names.
Caution: Users assigned to an OBS that is assigned to the root EPS
have access to all nodes beneath the root.
To assign users to an OBS:
1) Click the Administer menu and select User Access.
2) On the User Access page, click OBS.
3) On the OBS page, select an OBS and click the Users detail window.
4) In the Users detail window, click Add.
5) In the Select Users dialog box:
a. Select a user and click Assign.
b. Select any additional users and click Assign.
c. Click Close when finished.
Note: The default project security profile will automatically be
assigned when the User is selected.
6) In the Users detail window, select a different project security profile for each user, if
needed.
7) On the OBS page, click Save.

Structuring Projects
73
Defining Resources and Roles
About Roles
Roles represent personnel job titles or skills needed to execute projects. Architect,
general laborer, quality assurance tester, and engineer are all examples of possible roles.
You can create a standard set of roles that you then assign to labor and non-labor
resources and activities for all projects in the organization. You can establish an unlimited
number of roles and organize them in a hierarchy for easier management and
assignment. The set of roles you assign to an activity defines the activity’s skill
requirements. You can also define multiple price per unit rates and unit per time limits for
each role to accurately plan future costs and allocation.
You can assign one or more roles to individual resources. When you assign roles to a
resource, you also indicate their proficiency in that role and identify which role is their
primary role. A primary role is the main role the resource is currently performing. The
proficiency level describes the resource's skill level in that role. For example, Joe is a
resource and fills the role of both software engineer and manager. He has been a
software engineer for 20 years and is 1 - Master in that role; however, his primary role is
manager, which he has been for 5 years and his proficiency level is 3- Skilled.
Assign roles to activities as you would resources during project schedule and cost
planning. When your plans are finalized, you can replace roles with resources, based on
each activity’s role and skill requirements.
Creating Roles
Create a standard set of roles that you can assign to labor and nonlabor resources and
activities.
To create roles:
1) Click Resources.
2) On the Resources navigation bar, click Administration.
3) On the Administration page, click the Roles tab.
4) On the Roles tab:
a. Click Add (Insert), or click an existing role and click Add Child to add a role
in a hierarchy. A new row is added to the Roles table.
b. In the ID field, click and type a unique identifier for the new role.
c. In the Name field, click and type a unique role name.
d. To create or modify a hierarchy of roles, use the arrows on the toolbar to
position the new row.
For example, if a Project Manager role exists in the system and you just created a
Design Manager role, which is a type of Project Manager, use the up/down arrows
to position the new Design Manager role under Project Manager, and then click
the right arrow to indent the new row.

P6 EPPM User's Guide
74
e. Click the Description detail window.
5) In the Description detail window, type a description of the role's responsibilities.
6) On the Roles tab, click the Prices detail window.
7) In the Prices detail window, click in a rate type field and enter the rate. Repeat for all
applicable rate fields.
8) On the Roles tab, click the Limits detail window.
9) In the Limits detail window:
a. Click Add (Insert) to define the units/time for the role over time.
b. In the Effective Date field, double-click and select the effective date on the
calendar.
c. In the Max Units/Time field, click and type the maximum work units per time for this
role.
10) On the Roles tab, click Save (Ctrl+S).
Tip
Click Select Columns to select any additional fields that you want in the table. Then,
enter data in the additional fields you added.
Assigning a Resource to a Role
The set of roles you assign to a resource describes the resource's skill capabilities. These
role assignments make it easy to assign resources to activities according to role. You can
also assign roles to activities directly when you are unsure of the actual resources
available to work on the activities. You can later replace the roles with the applicable
resources.
To assign a role to a resource from the Roles tab:
1) Click Resources.
2) On the Resources navigation bar, click Administration.
3) On the Administration page, click the Roles tab.
4) On the Roles tab:
a. Click the name of the role.
b. Click the Resources detail window.
5) In the Resources detail window, click Add (Insert).
6) In the Select Resource dialog box:
a. Choose a resource and click Assign.
b. Choose any additional resources for the role and click Assign.
c. Click Close.
7) In the Resources detail window:

Structuring Projects
75
a. To change the proficiency level for that resource, double-click the Proficiency
field and select a level.
b. If this is the primary role for the resource, select the Primary Role option for the
resource.
8) On the Roles tab, click Save (Ctrl+S).
Tips
You can also assign a role to a resource from the Resources tab. Use this method if you
want to view all roles assigned to a single resource. See Assigning a Role to a Resource
(on page 79).
Assigning a Role Team to a Role
Using role teams can simplify resource planning. You can do this from either the Roles tab
or the Role Teams tab in the Resource Administration area. Use this method if you want to
view all role teams assigned to a particular role.
To assign a role to a role team:
1) Click Resources.
2) On the Resources navigation bar, click Administration.
3) On the Administration page, click the Roles tab.
4) On the Roles tab:
a. Click the role you are assigning to a role team.
b. Click the Role Teams detail window.
5) In the Role Teams detail window, click Add (Insert).
6) In the Select Role Team dialog box:
a. Expand either the Global or User category, choose a role team, and click Assign.
b. Choose any additional role teams and click Assign.
c. Click Close.
7) On the Roles tab, click Save (Ctrl+S).
Tips
You can also assign a role to a role team from the Role Teams tab. Use this method if you
want to view all roles assigned to a particular role team. See Assigning a Role to a Role
Team (on page 77).
Assigning Rates to Roles
Use this procedure to assign rates to the roles you created. Assigning rates to roles
enables you to more accurately determine total resource (and activity) costs. You can
assign up to five rate types depending on number of rate types set up by your
administrator.

P6 EPPM User's Guide
76
To assign role rates:
1) Click Resources.
2) On the Resources navigation bar, click Administration.
3) On the Administration page, click the Roles tab.
4) On the Roles tab:
a. Click a role.
b. Click the Prices detail window.
5) In the Prices detail window, click in the appropriate price fields and enter an amount.
The default time period is price per hour unless you specify another time period.
6) On the Roles tab, click Save (Ctrl+S).
Assigning Work Limits to Roles
Assign role work limits to define the maximum amount of work units the selected role can
perform in a single work period.
To assign limits to a role:
1) Click Resources.
2) On the Resources navigation bar, click Administration.
3) On the Administration page, click the Roles tab.
4) On the Roles tab:
a. Click a role.
b. Click the Limits detail window.
5) In the Limits detail window:
a. Click Add (Insert).
b. In the Effective Date field, double-click to open the calendar and choose a date
to start the Max/Unit limit.
c. In the Max Units/Time field, click and type the maximum work units per time for this
role. Enter these values as units per duration or as a percentage, depending on
your choice in the Time Unit Format area on the Global tab of the My Preferences
page.
6) On the Roles tab, click Save (Ctrl+S).
Structuring Projects
77
About Role Teams
A role team is a collection of roles that are often needed on the same project or the
same activities. Role teams are useful when you want to categorize and view allocation
for related roles. Role teams allow you to categorize and group roles so you can readily
find data relating to a particular role. When working with tabs and pages that display
role data, you can choose to organize the hierarchy by role team. You can view team
data such as total team units or individual unit values. If you have the required security
privilege, you can create global role teams. All users that have access rights to view
resource data can create user role teams.
Creating Role Teams
Use this procedure to create role teams. Role teams let you categorize roles so you can
view and analyze data that relates to a specific group that interests you. When working
with tabs and pages that display role data, you can choose to organize the hierarchy by
role team, then choose to view team data, such as total units for the team, or individual
unit values for each team member.
1) Click Resources.
2) On the Resources navigation bar, click Administration.
3) On the Administration page, click the Role Teams tab.
4) On the Role Teams tab:
a. Click either Global Role Teams or User Role Teams.
b. Click Add (Insert). A new row is added to the Role Teams table.
c. In the Name field, double-click and type a role name.
d. Click Save (Ctrl+S).
5) To assign roles to the role team, see Assigning a Role to a Role Team (on page 77).
Assigning a Role to a Role Team
Use this task to assign a role to a role team. You can assign a role to a role team from the
Role Teams tab or the Roles tab. Use this method if you want to view all roles assigned to
a particular role team.
To assign a role to a role team:
1) Click Resources.
2) On the Resources navigation bar, click Administration.
3) On the Administration page, click the Role Teams tab.
4) On the Role Teams tab:
a. Expand either the Global Role Team or User Role Teams category, and click the
role team for which you are assigning a role.
b. Click the Roles detail window.

P6 EPPM User's Guide
78
5) In the Roles detail window, click Add (Insert).
6) In the Select Role dialog box:
a. Choose a role and click Assign.
b. Choose any additional roles to assign to the role team and click Assign.
c. Click Close.
7) On the Role Teams tab, click Save (Ctrl+S).
Tips
To view all role teams assigned to a particular role, assign a role to a role team from the
Roles tab. See Assigning a Role Team to a Role (on page 75).
About Resources
A resource is any quantifiable item in limited supply and of sufficient value to justify
tracking and assigning to specific activities for a project. Resources include general or
specialized labor, non-labor items such as equipment, and material items such as bricks.
Resources perform roles, if defined. Resources are indirectly assigned to activities by first
planning the role required. It is also possible to directly assign resources to activities. For
example, Chris, a level 2 contractor with the confirmed skills and status, is directly
assigned to activity 01. However, a technician level 4 role is assigned to activity 02. The
project will proceed while management determines the best available resource to fulfill
this role.
Adding Resources
Use this task to add resources to the resource pool. Resources include the personnel and
equipment that perform work on activities across all projects. Resources are generally
reused between activities and/or projects. Resources can be distinguished as either
labor, material, or nonlabor. Labor and nonlabor resources are always time-based, and
material resources, such as consumable items, use a unit of measure you can specify.
To add a resource:
1) Click Resources.
2) On the Resources navigation bar, click Administration.
3) On the Administration page, click the Resources tab.
4) On the Resources tab:
a. Click Add (Insert), or click an existing resource and click Add Child to add a
resource in a hierarchy. A new row is added to the table.
b. Click the General detail window.
5) In the General detail window, enter information in the appropriate fields.
6) On the Resources tab:

Structuring Projects
79
a. Click Select Columns and select any additional column headings that you
need in your view.
b. Double-click in any additional fields to enter data.
c. Click the Notes detail window.
7) In the Notes detail window, type any notes you want to capture for the resource.
8) On the Resources tab, click Save (Ctrl+S).
Tips
See Creating Import Templates and Importing Resource Data in P6 Help to learn more
about adding resources to the resource pool by importing resource data from a
Microsoft® Excel (.xls) spreadsheet.
Assigning a Role to a Resource
The set of roles you assign to a resource describes the resource's skill capabilities. These
role assignments make it easy to assign resources to activities according to role. You can
also assign roles to activities directly when you are unsure of the actual resources
available to work on those activities. You can later replace the roles with the applicable
resources.
To assign a role to a resource:
1) Click Resources.
2) On the Resources navigation bar, click Administration.
3) On the Administration page, click the Resources tab.
4) On the Resources tab:
a. Click the resource.
b. Click the Roles detail window.
5) In the Roles detail window, click Add (Insert).
6) In the Select Role dialog box:
a. Choose a role and click Assign.
b. Choose any additional roles for the resource and click Assign.
c. Click Close.
7) In the Roles detail window:
a. To change the proficiency level for that role, double-click the Proficiency field and
select a level.
b. A resource can have many roles. The first role added is marked as the primary role.
To change this, select the Primary Role field for the appropriate role.
8) On the Resources tab, click Save (Ctrl+S).

P6 EPPM User's Guide
80
Tips
To view all resources assigned to a particular role, assign a role to a resource from the
Roles tab. See Assigning a Resource to a Role (on page 74).
Assigning a Resource Team to a Resource
Use this task to assign a resource team to a resource. You can do this from either the
Resources tab or the Resource Teams tab. Use this method if you want to view all the
resource teams assigned to a single resource.
To assign a resource to a resource team:
1) Click Resources.
2) On the Resources navigation bar, click Administration.
3) On the Administration page, click the Resources tab.
4) On the Resources tab:
a. Click the name of the resource you are assigning to a resource team.
b. Click the Resource Teams detail window.
5) In the Resource Teams detail window, click Add (Insert).
6) In the Select Resource Team dialog box:
a. Expand either the Global or User category, choose a resource team, and click
Assign.
Note: If you need to create a new resource team click on the
Global or User category, and then click Add Team.
b. Select additional teams, if necessary, and click Assign.
c. Click Close.
7) On the Resources tab, click Save (Ctrl+S).
Tips
To view all resources assigned to a particular resource team, assign a resource to a
resource team from the Resource Team tab. See Assigning a Resource to a Resource
Team (on page 87).

Structuring Projects
81
Configuring Resource Settings
Use the Settings detail window available from the Administration Resources tab to define
settings for the resource, such as the resource calendar and default units/time, as well as
P6 Progress Reporter settings.
To configure resource settings:
1) Click Resources.
2) On the Resources navigation bar, click Administration.
3) On the Administration page, click the Resources tab.
4) On the Resources tab, select the resource for which you want to define general
settings.
5) Click the Settings detail window, review the following options and make selections
based on your project needs.
Calendar: See Assigning Calendars to Resources (on page 82).
Default Units/Time: Use the default value or change the default units/time value. Enter
these values as units per duration or as a percentage, depending on your choice in
the Units/Time Format area of the My Preferences page.
Overtime Allowed: Select to enable the labor resource to record overtime hours for
activities.
Overtime Factor: Type the number by which the resource's standard price should be
multiplied to determine the resource's overtime price.
Auto Compute Actuals: Select to automatically calculate the selected resource's
actual quantity of work according to the project plan rather than reported hours in P6
Progress Reporter. Clear this option if you plan to select Uses Timesheets.
Currency: Click to select a currency that is different from the default currency,
and click OK.
Calculate Costs from Units: Select this option to indicate that any new assignment for
this resource will have its cost recalculated whenever any quantity changes occur,
such as changing an activity's remaining duration.
Progress Reporting Settings: See Configuring Timesheet Reporting for Resources (on
page 82).
6) On the Resources tab, click Save (Ctrl+S).

P6 EPPM User's Guide
82
Assigning Calendars to Resources
Assign a global or resource calendar to a resource to determine when the resource is
available to work.
To assign a calendar to a resource:
1) Click Resources.
2) On the Resources navigation bar, click Administration.
3) On the Administration page, click the Resources tab.
4) On the Resources tab:
a. Click a resource.
b. Click the Settings detail window.
5) In the Settings detail window, click in the Calendar field.
6) In the Select Calendar Name dialog box:
a. Choose the Global or Resource option.
b. Choose a calendar.
Note: If you want a personal calendar for the resource, click Create
Personal Calendar. See About My Calendar in P6 Help. You can
also create a personal calendar from the Enterprise Data page.
See Creating Resource Calendars (on page 109).
c. Click OK.
7) On the Resource tab, click Save (Ctrl+S).
Tips
You can perform the same procedure from the Calendars field on the Resources tab.
A resource can edit exceptions to their personal calendar. See Configuring My
Calendar in P6 Help. To view a personal calendar, the resource must be a user in the
system.
Configuring Timesheet Reporting for Resources
Configure timesheet reporting if you are using P6 Progress Reporter.
To configure timesheet reporting for a resource:
1) If the resource is not already defined as a user in the system:
a. Add the user. See Creating Users in P6 Help.
b. Assign the resource to the new user. See Assigning Associated Resources in P6
Help.
2) Enable access to P6 Progress Reporter. See Assigning Module Access in P6 Help and
mark the Team Member or Progress Reporter option.

Structuring Projects
83
3) Set the timesheet configuration options for the resource if you are implementing
non-automatic approval. See Configuring Resource Settings for Timesheet Reporting
(on page 83).
Tips
For faster setup of timesheet reporting, you can set Application Setting options to
automatically require timesheet use and designate a default approval manager
whenever you create a new resource. See Configuring Timesheets Settings in P6 Help.
Configuring Resource Settings for Timesheet Reporting
Configure timesheet reporting settings if you are using P6 Progress Reporter and are
implementing non-automatic approval.
To configure resource settings for timesheet reporting:
Note: You must perform these steps in order when configuring
these settings for the first time for each new resource.
1) Click Resources.
2) On the Resources navigation bar, click Administration.
3) On the Administration page, click the Resources tab.
4) On the Resources tab, click the Settings detail window.
5) In the Settings detail window, next to the Timesheet User Login field, click .
6) In the Select User dialog box, select the resources name from the list and click OK.
7) In the Settings detail window:
a. Select the Uses Timesheets option to enable timesheet reporting for the resource.
Note: If Auto Compute Actuals is selected, clear the option before
selecting Uses Timesheets.
b. In the Timesheet Approval Manager field, click .
8) In the Select User dialog box, choose a manager to assign to the resource and click
OK.

P6 EPPM User's Guide
84
9) On the Resources tab, click Save (Ctrl+S).
Notes:
If you selected the New Resources Use Timesheets by Default
option on the Timesheets page of the Application Settings
pane, when you create a new resource, the Uses Timesheets
option is selected automatically after you select a user for the
Timesheet User Login field. You must still must grant that user
module access to log into P6 Progress Reporter.
Users designated as timesheet approval managers are not
automatically granted access to P6 Progress Reporter, even if
they are assigned the required module access. To enable
timesheet approval managers to access P6 Progress Reporter,
you must configure them as timesheet resources, as you would
any other resource that requires access to P6 Progress Reporter.
Configuring timesheet approval managers as timesheet
resources enables approval managers to log in to P6 Progress
Reporter to edit the timesheets of their reporting resources.
Assigning Resource Codes
With potentially hundreds of resources in use across the enterprise, resource codes
provide an efficient means for tracking and sorting resources for reporting or analysis.
Use this procedure to assign resource codes to resources. Once assigned, you can
categorize resources using codes.
To assign resource codes:
1) Click Resources.
2) On the Resources navigation bar, click Administration.
3) On the Administration page, click the Resources tab.
4) On the Resources tab:
a. Click a resource.
b. Click the Codes detail window.
5) On the Codes detail window, click Add (Insert).
6) On the Select Resource Code dialog:
a. Choose a resource code and click Assign.
b. Select additional resource codes, if necessary, and click Assign.
Note: You can only select one value from each code name
category. If you try to assign a second value from the same
category, the first value will be replaced with the new value.

Structuring Projects
85
c. Click Close.
7) On the Resources tab, click Save (Ctrl+S).
Assigning Resource Rates
Use this procedure to assign rates to resources. You can assign multiple rates to resources
to reflect price changes over time. For example, suppose the price per unit for a group of
resources was $20.00 per hour for the months January through June, but the price rate
increases to $30.00 starting in July through December. You can assign time-varying rates
for resources to more accurately determine total resource (and activity) costs.
To assign resource rates:
1) Click Resources.
2) On the Resources navigation bar, click Administration.
3) On the Administration page, click the Resources tab.
4) On the Resources tab:
a. Click a resource.
b. Click the Units and Prices detail window.
5) In the Units and Prices detail window:
a. Click Add (Insert).
b. In the Effective Date field, double-click to open the calendar and choose a date
to start the new rate.
c. In the Max Units/Time field, double-click and type the maximum work units per
time for this resource.
d. In the appropriate price fields, double-click and type an amount. The default time
period is price per hour unless you specify another time period.
6) On the Resources tab, click Save (Ctrl+S).
Assigning Resource Curves to Resource or Role Assignments from the Resources Assignments Page
You can assign a resource distribution curve to any resource or role assignment on
activities with a duration type of Fixed Duration and Units/Time or Fixed Duration & Units.
Resource usage and costs are distributed evenly during an activity unless you specify
nonlinear distribution using custom curves.
To assign a resource curve:
1) Click Resources.
2) On the Resources navigation bar, click Assignments.
3) On the Assignments page, display the Curves column if it is not visible on the table. To
display the Curves column:
a. Click Customize Columns.
4) In the Customize Columns dialog box:

P6 EPPM User's Guide
86
a. Expand General and double-click Curve to move it to the Selected Columns list.
b. Click OK.
5) On the Assignments page:
a. Click the row with the resource or role.
b. Double-click the Curve field, and click .
6) In the Select Curves dialog box, choose a curve and click OK.
7) On the Assignments page, click Save (Ctrl+S).
Note: You can also assign resource curves to resource or role
assignment from the Projects Activities page. See Assigning
Resource Curves to Resource or Role Assignments from the
Activities Page (on page 150).
About Resource Teams
Resource teams provide a convenient way for you to associate personnel into smaller,
more meaningful groups within an organization. Using resource teams increases
efficiency in staffing activities, tracking allocation, and communicating project progress
and performance. When working with pages and tabs that display resource data, such
as the Resources Planning, Assignments, or Analysis pages, you can choose to organize
by resource team. You can then choose to view team data, such as total units for the
team, or view individual unit values for each team member. For example, the Resource
Usage tab available from the Analysis page provides total allocation data for the team,
as well as for each team resource when the tab is grouped by Resource Team.
Global resource teams are available to all users. User resource teams are only accessible
to the user currently logged in. You can create and modify user resource teams for your
personal use. If you have the required security privilege, you can also create and modify
global resource teams.
In addition to viewing Resource Teams from the Resources section, you can view the
resources that belong to a team, including each resource's primary role and number of
active projects, by viewing the Resource Team Summary portlet on the Dashboards
page.
Creating Resource Teams
Create resource teams to reduce potentially large resource pools into smaller, more
meaningful and manageable groups.
To create a resource team:
1) Click Resources.
2) On the Resources navigation bar, click Administration.
3) On the Administration page, click the Resource Teams tab.

Structuring Projects
87
4) On the Resource Teams tab:
a. If you are creating a global resource team, click the Global Resource Teams row
and click Add (Insert).
If you are creating a team only for your use, click the User Resource Teams row
and click Add (Insert).
b. In the Name field, double-click and type a resource team name.
5) In the Resources detail window, click Add (Insert).
6) In the Select Resource dialog box:
a. Choose a resource and click Assign.
b. Choose any additional resources to add to the resource team and click Assign.
c. Click Close.
7) On the Resource Teams tab, click Save (Ctrl+S).
Assigning a Resource to a Resource Team
Use this task to assign a resource to a resource team. You can assign a resource to a
resource team from the Resource tab or the Resource Teams tab. Use this method if you
want to view all resources assigned to a particular resource team.
To assign a resource to a resource team:
1) Click Resources.
2) On the Resources navigation bar, click Administration.
3) On the Administration page, click the Resource Teams tab.
4) On the Resource Teams tab, expand either the Global Resource Teams or the User
Resource Teams category and click a resource team name.
5) In the Resources detail window, click Add (Insert).
6) In the Select Resource dialog box:
a. Choose a resource and click Assign.
b. Select additional resources, if necessary, and click Assign.
c. Click Close.
7) On the Resource Teams tab, click Save (Ctrl+S).
Tips
To view all resource teams assigned to a particular resource, assign a resource to a
resource team from the Resources tab. See Assigning a Resource Team to a Resource
(on page 80).

P6 EPPM User's Guide
88
Setting Up The Work Breakdown Structure
About Work Breakdown Structures (WBS)
A WBS, or work breakdown structure, is a hierarchical arrangement of work activities that
divides a project into discrete levels, phases, or layers. The WBS is structured in levels of
work detail, beginning with the deliverable and separated into identifiable work
elements.
When creating a project, the project manager typically develops the WBS first. The
manager assigns documents to each WBS element, and then defines activities to
complete that element. In addition to document and activity assignments, each WBS
element can also have specific earned value calculation settings, issue assignments,
and notebook topics.
Each project has its own WBS hierarchy with the top-level WBS element equal to that of
each enterprise project structure (EPS) node or project. Each WBS element can contain
more detailed WBS levels, activities, or both.
Working with WBS Elements
If you have the required privilege, you can add, modify, or delete WBS elements.
Before you begin
To add, edit, or delete WBS elements, whether you are working with a single project or a
group of projects, you must be working in an EPS view that is organized based on all
levels of the WBS hierarchy. Either select this type of view from the EPS View list or, if
necessary, create one.
Add WBS elements
Except for the top level element of the WBS hierarchy, which represents the project, you
can add a WBS element at the same level as an existing element (sibling) or at a
subordinate level (child). At the top level of the WBS, you can add only child elements.
Modify WBS elements
Horizontal arrows change the level of an element in the hierarchy. Vertical arrows
change the position of an element within its current level.
Delete WBS elements
If you attempt to delete a WBS that has activities associated with it, you must specify
what you want to do with the activities:
To delete the WBS, but reassign its activities to the parent WBS, select Merge.
To delete both the WBS and its associated activities, select Delete.

Structuring Projects
89
Note: These two options also appear if the WBS has both activities
and planned resource allocations. However, resource allocations
cannot be merged. Regardless of the option you choose, the
planned resource allocations are deleted. For this reason, when a
WBS has planned resource allocations but no activities, these
options do not appear.
Creating a WBS
Create a work breakdown structure to divide a project into levels. You can create sibling
WBSs to represent WBSs that are hierarchically equal, or child WBSs to represent WBSs that
are subordinate to projects or other WBSs.
To create a WBS:
1) Open one or more projects in the Projects section using one of the following methods:
Click Projects to open the last project or group of projects you were working
with.
Click the Projects menu and choose one of the most-recently used projects
or group of projects.
Click the Projects menu and choose Open Projects to select a project or
group of projects by portfolio type, EPS node, or project code.
2) On the Projects navigation bar, click Activities.
3) On the Activities page:
a. Select a WBS or project. The WBS can act as a sibling or a parent. The project will
act as a parent.
b. Click the Actions menu:
To add a sibling, select Add Add Sibling WBS (Shift+Insert).
To add a child, select Add Add Child WBS (Ctrl+Insert).
c. Enter a name in the WBS/Activity field of the new WBS.
d. Click the Actions menu and select Save (Ctrl+S).
Tips
To add, edit, or delete WBS elements, whether you are working with a single project or
a group of projects, you must be working in an activity view that is organized based
on all levels of the WBS hierarchy. This type of view is identified by the (WBS) icon.
Click the Activity View list on the Activities toolbar, and select this type of view or, if
necessary, create one. See Creating Activity Views (on page 135).
The WBS will automatically be assigned a name based upon the project or WBS you
select. For example, if the project or WBS is named WBS: Business Project 1.5, the
application will automatically name the new WBS: Business Project 1.6.
You can also right-click a WBS or project and select Add Sibling WBS or Add Child WBS
to create a WBS.

P6 EPPM User's Guide
90
Adding a WBS from Template
You can add a predefined WBS element from a template to a project.
To add a WBS from template:
1) Open one or more projects in the Projects section using one of the following methods:
Click Projects to open the last project or group of projects you were working
with.
Click the Projects menu and choose one of the most-recently used projects
or group of projects.
Click the Projects menu and choose Open Projects to select a project or
group of projects by portfolio type, EPS node, or project code.
2) On the Projects navigation bar, click Activities.
3) On the Activities page:
a. Click the View menu and select Table.
b. Click the View menu and select Group....
c. On the Customize Groupings dialog box, set the Level 1 field to WBS and the Sort
Order to Hierarchy. Click OK.
d. In the Activity Table, right-click a project or WBS element and select Add WBS
from Template.
4) In the Select WBS dialog box, select a WBS from the list of templates and click OK.
5) On the Activities page:
a. Update the name in the WBS/Activity field.
b. Click the Actions menu and select Save (Ctrl+S).
Tips
The application automatically assigns the WBS element a name based upon the
selected WBS.
Configuring General WBS Information
Configure WBS information to account for any updates or changes made to the WBS.
To configure general WBS information:
1) Open one or more projects in the Projects section using one of the following methods:
Click Projects to open the last project or group of projects you were working
with.
Click the Projects menu and choose one of the most-recently used projects
or group of projects.
Click the Projects menu and choose Open Projects to select a project or
group of projects by portfolio type, EPS node, or project code.

Structuring Projects
91
2) On the Projects navigation bar, click Activities.
3) On the Activities page, select a WBS and click the General detail window.
4) In the General detail window:
a. Add the columns you need to configure to the detail window. See Showing and
Hiding Columns in a Table (on page 239).
b. Select an option or enter a value for each field.
5) On the Activities page, click the Actions menu and select Save (Ctrl+S).
Establishing Project Codes
About Project Codes
Project codes help you track different projects based on characteristics they share. You
can use project codes to arrange projects hierarchically when your EPS contains many
projects within many levels. If you have many projects in the hierarchy, project codes
help you group and filter potentially vast amounts of information spanning different areas
of the organization. The application supports an almost unlimited number of hierarchical
project codes and values; you can establish as many as you need to meet the filtering,
sorting, and reporting requirements of your organization.
Working with Project Codes
Create and configure project codes in the Administer section of the application. For
each project code, create as many code values as needed to assign to projects to track
them over time. Periodically, revisit your enterprise data settings to add, modify, or delete
project codes and values.

P6 EPPM User's Guide
92
Table 1 of 3: Administering Project Codes
Item Description
Administer menu: Define project codes in Enterprise Data.
Project Codes page: The Project Codes page available under the
expanded Projects entry.
Project Codes toolbar: Create codes and values, add columns, and
move entries using the tools in the toolbar.
Name field: Displays both the code's name and the code value's short
identifier. For example, the SUB code value appears under the Contract
Type project code.
Description field: Displays the full name for the code value.
Weighted Code fields: Weighted project codes enable you to rank or
prioritize projects using a weight value and then view projects by a score
determined by the application. For example, assume you rank projects in
terms of risk. Project codes with the highest score have the most risk; those
with the lowest score have the least risk. To add weight to a project code,
enter a value in the Weight column. To view the score of each weighted
project code, display the Project Score field in the Project Statistics
portlet, in any scorecard portfolio view, or on the EPS page.

Structuring Projects
93
Table 2 of 3: Using Project Codes with the EPS
Item Description
Grouped by Contract Type: The projects in this EPS view are grouped at
their outermost level (Level 1) by Contract Type.
Grouped by Division/Office: The projects are also grouped by
Division/Office at their second level (Level 2).
Customize Groupings dialog box: Use this dialog box to set the groupings,
colors, and sort order.
Table 3 of 3: Using Project Codes with Portfolios and Projects
Item Description
Portfolios Grouped by Project Code: The Open Portfolio dialog box
grouped by project code.
A Portfolio Based on a Project Code Value: In this example, the user has
selected the CHI - Chicago, IL Office project code. All projects assigned
to this code value will be opened as a portfolio.
Projects Grouped by Project Code: The Open Projects dialog box
grouped by project code. Behind the list, notice the search field. You can
use this field to search for a project by project code.
Projects Based on a Project Code Value: In this example, the user has
selected the third of four projects under the SUB - Subcontractor code
value, which is itself part of the Contract Type project code.

P6 EPPM User's Guide
94
Creating Project Codes
Create project codes to represent project evaluation criteria. These steps represent the
minimum required to create a project code.
To create a project code:
1) Click the Projects menu and select Enterprise Project Data, or click the
Administer menu and select Enterprise Data.
2) In the Enterprise Data pane, expand Projects and click Project Codes.
3) On the Project Codes page:
a. Click Add Code (Insert).
b. Move the project code to the correct location in the list by clicking the Move
Down (Ctrl+Alt+Down) and Move Up (Ctrl+Alt+Up) arrows.
c. In the Name field, double-click and type a unique code.
d. In the Maximum Length field, double-click and click the up or down arrow to
specify project code value length.
e. Click Save (Ctrl+S) .
Tips
Project codes at the same level are siblings. Subordinate project codes are children.
Creating Project Code Values
Create project code values to group, sort, and filter project data.
To create project code values:
1) Click the Projects menu and select Enterprise Project Data, or click the
Administer menu and select Enterprise Data.
2) In the Enterprise Data pane, expand Projects and click Project Codes.
3) On the Project Codes page:
a. Select a code.
b. Click Add Code Value.
Note: The code value will be added to the selected project code.
c. Move the project code value to the correct location in the list and hierarchical
position by clicking the Move Up (Ctrl+Alt+Up), Move Down
(Ctrl+Alt+Down), Move Left (Ctrl+Alt+Left), and Move Right (Ctrl+Alt+Right)
arrows.
d. In the Name field, double-click and type a code value.
Note: The code value cannot exceed the Maximum Length
specified by the project code.

Structuring Projects
95
e. In the Description field, double-click and type a brief narrative about the code
value.
f. In the Weight field, double-click and type a value. Weight defaults to 0.0 if you do
not type a value.
Note: The weight reflects the ranking of this value against other
values in the project code.
4) Click Save (Ctrl+S).
Tips
Project code values at the same level are siblings. Subordinate project code values are
children.
Assigning Project Codes
Assign project codes to categorize projects.
To assign a project code:
1) Open one or more projects in the Projects section using one of the following methods:
Click Projects to open the last project or group of projects you were working
with.
Click the Projects menu and choose one of the most-recently used projects
or group of projects.
Click the Projects menu and choose Open Projects to select a project or
group of projects by portfolio type, EPS node, or project code.
2) On the Projects navigation bar, click EPS.
3) On the EPS page, select a project and click the Codes detail window.
4) In the Codes detail window, click Assigning Project Codes (Insert).
5) In the Select Project Codes dialog box, assign codes and click Close.
6) On the EPS page, click the Actions menu and click Save (Ctrl+S).
Working With User Defined fields
About User Defined Fields
User defined fields allow you to create and maintain data specific to your organization.
For example, you can track additional activity data, such as delivery dates and
purchase order numbers. You can also track additional resource data or project
cost-related data, such as profit, variances, and revised budgets. User defined fields are
global, so they can be used across all projects in your organization.

P6 EPPM User's Guide
96
You can also create project user defined fields. Project user defined fields track
information specific to projects. For example, your organization might require a custom
field to track project profit. Project user defined fields are unique in that you can define a
formula or statement to automatically calculate field values, and identify graphical
indicators to display for a field, based on its value.
Creating Activity UDFs
Create activity user defined fields (UDFs) if the predefined fields do not meet your needs.
To create an activity UDF:
1) Click the Projects menu and select Enterprise Project Data, or click the
Administer menu and select Enterprise Data.
2) In the Enterprise Data pane, expand Activities and click Activity UDFs.
3) On the Activity UDFs page:
a. Click Add (Insert).
b. In the User Defined Field, double-click and type a name.
c. In the Data Type field, double-click and choose a type from the list.
d. Click Save (Ctrl+S).
Creating Assignment UDFs
Create assignment user defined fields (UDFs) if the predefined fields do not meet your
needs.
To create an assignment UDF:
1) Click the Resources menu and select Enterprise Resource Data, or click the
Administer menu and select Enterprise Data.
2) In the Enterprise Data pane, expand Resources and click Assignment UDFs.
3) On the Assignment UDFs page:
a. Click Add (Insert).
b. In the User Defined Field, double-click and type a name.
c. In the Data Type field, double-click and choose a type from the list.
d. Click Save (Ctrl+S).
Creating Document UDFs
Create document user defined fields (UDFs) if the predefined fields do not meet your
needs.
To create a document UDF:
1) Click the Projects menu and select Enterprise Project Data, or click the
Administer menu and select Enterprise Data.
2) In the Enterprise Data pane, expand Documents and click Document UDFs.

Structuring Projects
97
3) On the Document UDFs page:
a. Click Add (Insert).
b. In the User Defined Field, double-click and type a name.
c. In the Data Type field, double-click and choose a type from the list.
d. Click Save (Ctrl+S).
Creating Expense UDFs
Create expense user defined fields (UDFs) if the predefined fields do not meet your
needs.
To create an expense UDF:
1) Click the Projects menu and select Enterprise Project Data, or click the
Administer menu and select Enterprise Data.
2) In the Enterprise Data pane, expand Activities and click Expense UDFs.
3) On the Expense UDFs page:
a. Click Add (Insert).
b. In the User Defined Field, double-click and type a name.
c. In the Data Type field, double-click and choose a type from the list.
4) Click Save (Ctrl+S).
Creating Issue UDFs
Create issue user defined fields (UDFs) if the predefined fields do not meet your needs.
To create an issue UDF:
1) Click the Projects menu and select Enterprise Project Data, or click the
Administer menu and select Enterprise Data.
2) In the Enterprise Data pane, expand Issues and click Issue UDFs.
3) On the Issue UDFs page:
a. Click Add (Insert).
b. In the User Defined Field, double-click and type a name.
c. In the Data Type field, double-click and choose a type from the list.
4) Click Save (Ctrl+S).
Creating Project UDFs
Create project user defined fields (UDFs) if the predefined fields do not meet your needs.
Project UDFs have formulas that automatically calculate values for the field.
To create a project UDF:
1) Click the Projects menu and select Enterprise Project Data, or click the
Administer menu and select Enterprise Data.
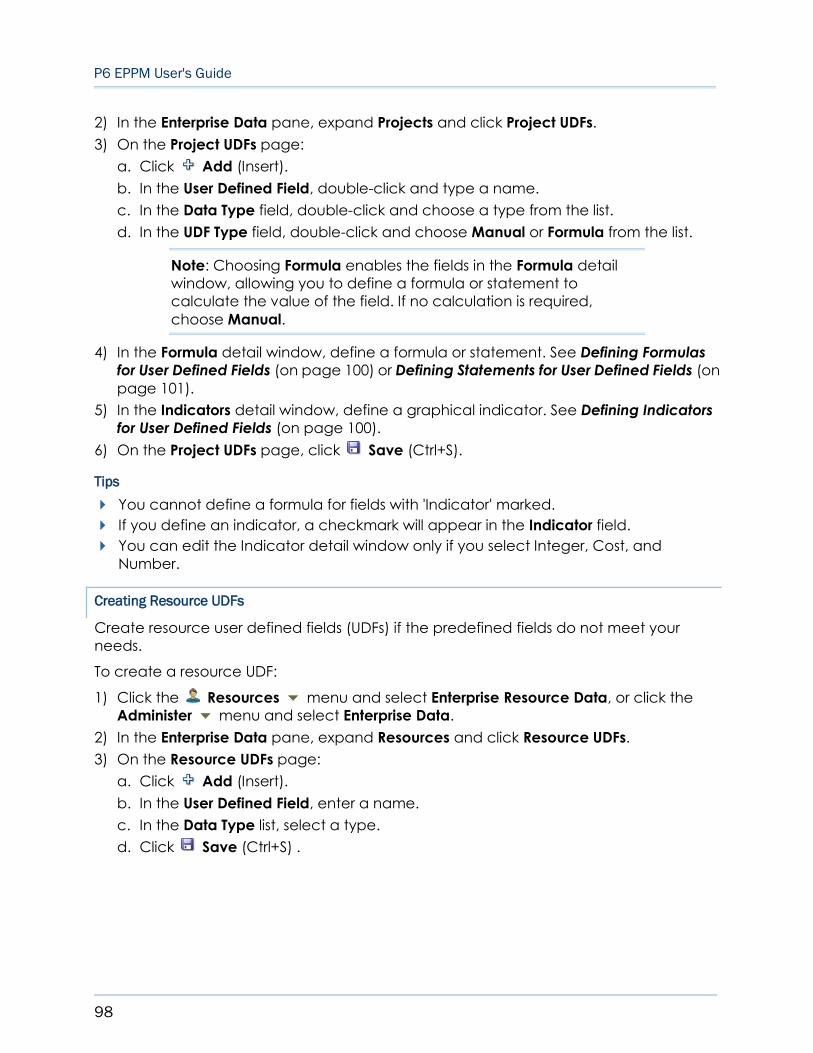
P6 EPPM User's Guide
98
2) In the Enterprise Data pane, expand Projects and click Project UDFs.
3) On the Project UDFs page:
a. Click Add (Insert).
b. In the User Defined Field, double-click and type a name.
c. In the Data Type field, double-click and choose a type from the list.
d. In the UDF Type field, double-click and choose Manual or Formula from the list.
Note: Choosing Formula enables the fields in the Formula detail
window, allowing you to define a formula or statement to
calculate the value of the field. If no calculation is required,
choose Manual.
4) In the Formula detail window, define a formula or statement. See Defining Formulas
for User Defined Fields (on page 100) or Defining Statements for User Defined Fields (on
page 101).
5) In the Indicators detail window, define a graphical indicator. See Defining Indicators
for User Defined Fields (on page 100).
6) On the Project UDFs page, click Save (Ctrl+S).
Tips
You cannot define a formula for fields with 'Indicator' marked.
If you define an indicator, a checkmark will appear in the Indicator field.
You can edit the Indicator detail window only if you select Integer, Cost, and
Number.
Creating Resource UDFs
Create resource user defined fields (UDFs) if the predefined fields do not meet your
needs.
To create a resource UDF:
1) Click the Resources menu and select Enterprise Resource Data, or click the
Administer menu and select Enterprise Data.
2) In the Enterprise Data pane, expand Resources and click Resource UDFs.
3) On the Resource UDFs page:
a. Click Add (Insert).
b. In the User Defined Field, enter a name.
c. In the Data Type list, select a type.
d. Click Save (Ctrl+S) .

Structuring Projects
99
Creating Risk UDFs
Create risk user-defined fields (UDFs) to store additional project risk data on the Projects
Risks page that is pertinent to your project or business and is not available from the
default fields. For example, you might need to include a location field to identify where
the risk might occur, or a ranking field to determine the order in which the risks will be
handled.
User-defined fields can be of many types: text, start date, finish date, cost, number,
integer, or indicator. Data from UDFs is not used in scoring calculations.
To create a risk UDF:
1) Click the Projects menu and select Enterprise Project Data, or click the
Administer menu and select Enterprise Data.
2) In the Enterprise Data pane, expand Risks and click Risk UDFs.
3) On the Risk UDFs page:
a. Click Add (Insert).
b. In the User Defined Field, double-click and type a name.
c. In the Data Type field, double-click and choose a data type from the list.
d. Click Save (Ctrl+S).
Creating Step UDFs
Create step user defined fields (UDFs) if the predefined fields do not meet your needs.
To create a step UDF:
1) Click the Projects menu and select Enterprise Project Data, or click the
Administer menu and select Enterprise Data.
2) In the Enterprise Data pane, expand Activities and click Step UDFs.
3) On the Step UDFs page:
a. Click Add (Insert).
b. In the User Defined Field, double-click and type a name.
c. In the Data Type field, double-click and choose a type from the list.
d. Click Save (Ctrl+S).
Creating WBS UDFs
Create WBS user defined fields (UDFs) if the predefined fields do not meet your needs.
To create a WBS UDF:
1) Click the Projects menu and select Enterprise Project Data, or click the
Administer menu and select Enterprise Data.
2) In the Enterprise Data pane, expand Projects and click WBS UDFs.
3) On the WBS UDFs page:

P6 EPPM User's Guide
100
a. Click Add (Insert).
b. In the User Defined Field, double-click and type a name.
c. In the Data Type field, double-click and choose a type from the list.
d. Click Save (Ctrl+S).
Defining Formulas for User Defined Fields
Define formulas to calculate values for the user defined field.
Before defining a formula, you need to first create a project user defined field. To create
a project user defined field see Creating Project UDFs (on page 97).
To define formulas for user defined fields:
1) Click the Projects menu and select Enterprise Project Data, or click the
Administer menu and select Enterprise Data.
2) In the Enterprise Data pane, expand Projects and click Project UDFs.
3) On the Project UDFs page, select a UDF and click the Formula detail window.
Note: The UDF Type must be set to Formula to access the Formula
detail window.
4) In the Formula detail window:
a. Click the Fields list and choose a field.
Note: You can select any existing project-related field defined in
the project management database, including project codes, or
any other user defined field that exists for your organization.
b. Click Insert Field.
c. Continue to build your formula by inserting fields and using the operator buttons.
5) Click Save (Ctrl+S).
Tips
Operator buttons include: +, -, *, /, (, and ).
Defining Indicators for User Defined Fields
Define indicators for user defined fields (UDFs) that will display based on criteria set for
field values. For example, you can choose a graphical indicator to display when the
value of the field equals a certain number, or when the value of the field falls between a
certain range of dates.
Before defining an indicator, you need to first create a project user defined field. To
create a project user defined field see Creating Project UDFs (on page 97).

Structuring Projects
101
Note: You can identify graphical indicators only for fields with a
'Cost', 'Integer', or 'Number' Data Type.
To define indicators for UDFs:
1) Click the Projects menu and select Enterprise Project Data, or click the
Administer menu and select Enterprise Data.
2) In the Enterprise Data pane, expand Projects and click Project UDFs.
3) On the Project UDFs page, select a UDF and click the Indicators detail window.
Note: You can also follow these steps for the Summary Indicators
detail window
4) In the Indicators detail window repeat the following for each parameter statement:
a. Click the Select Parameter list and choose a parameter.
b. Mark the Value or Field option.
1. If you mark the Value option, double-click the field and type a value.
2. If you mark the Field option, click the list and select a field.
Note: If you select a "is within the range of" or "is not in the range of"
condition, use the Value field to specify the lower range value and
the High Value field to specify the upper range value.
c. Click each Indicator list and choose an indicator.
5) On the Project UDFs page, click Save (Ctrl+S).
Tips
Click to add another indicator statement or to remove a statement.
Defining Statements for User Defined Fields
Define statements to calculate values for the user defined field.
Before defining a statement, you need to first create a project user defined field. To
create a project user defined field see Creating Project UDFs (on page 97).
To define statements for user defined fields:
1) Click the Projects menu and select Enterprise Project Data, or click the
Administer menu and select Enterprise Data.
2) In the Enterprise Data pane, expand Projects and click Project UDFs.
3) On the Project UDFs page, select a UDF and click the Formula detail window.
Note: The UDF Type must be set to Formula to access the Formula
detail window.

P6 EPPM User's Guide
102
4) In the Formula detail window:
a. Click Advanced .
b. Click IF/THEN/ELSE.
Note: The default statement 'IF (condition) THEN (expression) ELSE
(expression)' is displayed in the detail window.
c. Highlight a (condition) or (expression) entry and its parentheses.
d. Click the Fields list and choose a field.
Note: You can select any existing project-related field defined in
the project management database, including project codes, or
any other user defined field that exists for your organization.
e. Click Insert Field.
Note: The selected field will replace the highlighted (condition) or
(expression) entry.
f. Continue to replace fields and use the operator, relational operator, and
expression buttons to build your statement.
Note: Relational operators (<, >, =, <>) are only valid for the 'IF'
condition statement.
5) On the Project UDFs page, click Save (Ctrl+S).
Tips
Text values must be enclosed in quotes. For example: IF [Division]="Marketing."
Numeric values do not require quotes. For example: IF [Proposed Budget]>500000.
Only the = (equal) and <> (not equal) relational operators are valid for text values.
Date values must be enclosed in quotes and follow the dd-mm-yyyy format. For
example, IF [Start Date]>"01-APR-2007".
Operator buttons include: +, -, *, /, (, and ). Expression buttons include: AND, OR, and
IF/THEN/ELSE.
You can also replace (condition) and (expression) entries by deleting the entries and
their parentheses, placing the cursor in the appropriate location in the statement,
and following steps 4.d. through 4.f.
Structuring Projects
103
About Calendars
Calendars enable you to define available workdays and workhours in a day. You can
also specify national holidays, recognized holidays, project-specific work/nonworkdays,
and resource vacation days. You can establish an unlimited number of calendars to
accommodate different work patterns. There are three calendar pools: global, project,
and resource. The global calendar pool contains calendars that apply to all projects in
the database. The project calendar pool is a separate pool of calendars for each
project in the organization. The resource calendar pool is a separate pool of calendars
for each resource. You can assign multiple users a resource calendar that they can
share, but cannot edit. You can also assign a personal calendar to a resource that will
show up in My Calendars and that the resource can customize. You can assign resource
or global calendars to resources, and global or project calendars to activities.
Assign calendars to each resource and activity to determine time constraints in a uniform
way. For example, based on its calendar, a resource might not be available; or, if the
resource is available, the activity might not fit the calendar requirements.
The application uses your calendar assignments for leveling resources, scheduling, and
tracking activities.
Working with Calendars
The P6 application supports three types of calendars:
Global: Global calendars can be defined and applied to all projects and
resources in the database.
Project: Separate project calendars can be defined and applied to projects
through activity assignments.
Resource: Resource calendars can be defined and applied to each individual
resource.
Begin by defining one or more global calendars and then link any project or resource
calendars to them. Changes to a global calendar apply to all project and resource
calendars linked to it.
Assign global or resource calendars to resources, and global or project calendars to
activities. You can establish an unlimited number of calendars to accommodate
different work patterns. For example, if some activities require a five day workweek, while
others are performed part-time (such as Monday, Wednesday, and Friday), you can
create different calendars and assign them to the activities and resources in your
projects.
An activity’s Activity Type field value determines whether the activity uses the calendar
of an assigned resource or its project calendar.

P6 EPPM User's Guide
104
Creating Global Calendars
Create global calendars to identify global work or nonwork days. You can use global
calendars as base calendars when creating a resource or project calendar. The
exception days in a global calendar appear in the resource or project calendar and are
identified by a (globe).
To create a global calendar:
1) Click the Administer menu and select Enterprise Data.
2) In the Enterprise Data pane, expand Global and click Global Calendars.
3) On the Global Calendars page, click Add (Insert).
4) In the Select Calendar to Copy dialog box:
a. Select the Global or Resource option.
Note: This determines which list of calendars you can select.
b. Select a calendar and click OK.
5) On the Global Calendars page, click the Calendar tab.
6) On the Calendar tab, triple-click the Name field and enter a name.
Note: The application automatically assigns the name New
Calendar.
7) On the Global Calendars page, click Save (Ctrl+S).
8) To configure the global calendar, see Configuring Global Calendars (on page 104).
Configuring Global Calendars
Perform the following tasks when creating or updating a global calendar:
Setting Work Hours Per Time Period for Global Calendars
Configure the work hours per time period settings to specify the default number of hours
in a work period for a calendar.
To set the number of work hours for each time period:
1) Click the Administer menu and select Enterprise Data.
2) In the Enterprise Data pane, expand Global and click Global Calendars.
3) On the Global Calendars page:
a. Click on the calendar you want to modify.
b. Click Edit Hours Per Period.
4) In the Set Time Periods dialog box, click and type an hour value in each field, and
then click OK.
5) Click Save (Ctrl+S).

Structuring Projects
105
Configuring the Standard Work Week for Global Calendars
Configure the standard work week for the calendar to set the work and nonwork days
and hours for a standard work week.
To modify the standard work week:
1) Click the Administer menu and select Enterprise Data.
2) In the Enterprise Data pane, expand Global and click Global Calendars.
3) On the Global Calendars page:
a. Click on the calendar you want to modify.
b. Click the Standard Work Week tab.
4) On the Standard Work Week tab, right-click on a working or nonworking timeslot and
use the menu options to adjust the workday. You can also resize the working time to
increase or decrease the work hours.
5) Click Save (Ctrl+S).
Modifying Calendar Days on Global Calendars
Modify calendar days to account for work or nonwork days or hours that are different
than the standard hours defined on the Standard Work Week tab.
To modify work or nonwork calendar days:
1) Click the Administer menu and select Enterprise Data.
2) In the Enterprise Data pane, expand Global and click Global Calendars.
3) On the Global Calendars page:
a. Click on the calendar you want to modify.
b. Click the Calendar tab.
4) On the Calendar tab, right-click on a working or nonworking day and use the menu
options to adjust the workday.
5) Click Save (Ctrl+S).
Setting the Default Global Calendar
Choose a calendar to use as the default when new calendars are created.
To set the default global calendar:
1) Click the Administer menu and select Enterprise Data.
2) In the Enterprise Data pane, expand Global and click Global Calendar.
3) On the Global Calendar page:
a. Click on the calendar you want to designate as the default calendar.
b. Click Set As Default Calendar.
c. Click Save (Ctrl+S).

P6 EPPM User's Guide
106
Creating Project Calendars
Create project calendars to determine work or nonwork time for a project.
To create a project calendar:
1) Click the Projects menu and select Enterprise Project Data, or click the
Administer menu and select Enterprise Data.
2) In the Enterprise Data pane, expand Projects and click Project Calendars.
3) On the Project Calendars page:
a. Click on a project.
Note: If the project you need is not open, click Select Projects.
Choose one or more projects and click OK.
b. Click Add (Insert).
4) In the Select Calendar to Copy dialog box:
a. Select the Global, Resource, or Project option.
Note: This determines which list of calendars you can select.
b. Select a calendar and click OK.
5) On the Project Calendars page, click the Calendar tab.
6) On the Calendar tab, click in the Name field and enter a name for the project
calendar.
7) On the Project Calendars page, click Save (Ctrl+S).
Tips
To configure the project calendar, see Configuring Project Calendars (on page 106).
Configuring Project Calendars
Perform the following tasks when creating or updating a project calendar:
Assigning a Base Calendar to a Project Calendar
Assign a base calendar to determine holidays and exceptions for the selected project
calendar.
To assign a base calendar:
1) Click the Projects menu and select Enterprise Project Data, or click the
Administer menu and select Enterprise Data.
2) In the Enterprise Data pane, expand Projects and click Project Calendars.
3) On the Project Calendars page:
a. Expand a project.

Structuring Projects
107
Note: If the project you need is not open, click Select Projects.
Choose one or more projects and click OK.
b. Select a calendar to assign a base calendar.
c. Click Select a Base Calendar.
4) In the Select Base Calendar dialog box, select a calendar and click OK.
5) Click Save (Ctrl+S).
Tips
The (globe) on calendar days indicates exception days marked in the base
calendar. You can modify these exceptions days and the globe will disappear. If you set
the calendar day back to standard, the exception day will reset and the globe will
reappear.
Setting Work Hours Per Period for a Project Calendar
Configure the work hours per time period settings to specify the default number of hours
in a work period for a calendar.
To set the number of work hours for each time period:
1) Click the Projects menu and select Enterprise Project Data, or click the
Administer menu and select Enterprise Data.
2) In the Enterprise Data pane, expand Projects and click Project Calendars.
3) On the Project Calendars page:
a. Expand a project.
Note: If the project you need is not open, click Select Projects.
Choose one or more projects and click OK.
b. Click on the calendar you want to modify.
c. Click Edit Hours Per Period.
4) In the Set Time Periods dialog box, click and type an hour value in each field, and
then click OK.
5) Click Save (Ctrl+S).
Configuring the Standard Work Week for Project Calendars
Configure the standard work week for the calendar to set the work and nonwork days
and hours for a standard work week.
To configure the standard work week:
1) Click the Projects menu and select Enterprise Project Data, or click the
Administer menu and select Enterprise Data.
2) In the Enterprise Data pane, expand Projects and click Project Calendars.

P6 EPPM User's Guide
108
3) On the Project Calendars page:
a. Expand a project.
Note: If the project you need is not open, click Select Projects.
Choose one or more projects and click OK.
b. Click on the calendar you want to modify.
c. Click the Standard Work Week tab.
4) On the Standard Work Week tab, right-click on a working or nonworking timeslot and
use the menu options to adjust the workday. You can also resize the working time to
increase or decrease the work hours.
5) Click Save (Ctrl+S).
Modifying Calendar Days on Project Calendars
Modify calendar days to account for work or nonwork days or hours that are different
than the standard hours defined on the Standard Work Week tab.
1) Click the Projects menu and select Enterprise Project Data, or click the
Administer menu and select Enterprise Data.
2) In the Enterprise Data pane, expand Projects and click Project Calendars.
3) On the Project Calendars page:
a. Expand a project.
Note: If the project you need is not open, click Select Projects.
Choose one or more projects and click OK.
b. Click on the calendar you want to modify.
c. Click the Calendar tab.
4) On the Calendar tab, right-click on a working or nonworking day and use the menu
options to adjust the workday.
5) Click Save (Ctrl+S).
Tips
The (globe) on calendar days indicates exception days in the base calendar. You
can modify these exceptions days and the globe will disappear. If you set the calendar
day back to standard, the Global exception day will reset and the globe will reappear.
Changing a Project Calendar to a Global Calendar
You can turn an existing project calendar into a global calendar.
To make a project calendar a global calendar:
1) Click the Projects menu and select Enterprise Project Data, or click the
Administer menu and select Enterprise Data.

Structuring Projects
109
2) In the Enterprise Data pane, expand Projects and click Project Calendars.
3) On the Project Calendars page:
a. Expand a project.
Note: If the project you need is not open, click Select Projects.
Choose one or more projects and click OK.
b. Click on the calendar you want to change to global.
4) On the toolbar, click Promote to Global Calendar.
5) Click Save (Ctrl+S).
Creating Resource Calendars
Create a resource calendar to determine when a resource can work.
To create a resource calendar:
1) Click the Resources menu and select Enterprise Resource Data, or click the
Administer menu and select Enterprise Data.
2) In the Enterprise Data pane, expand Resources and click Resource Calendars.
3) On the Resource Calendars page:
a. Click on Personal Calendars to create a private calendar for the resource, or click
on Shared Calendars to create a calendar for multiple resources to share that the
resources cannot edit.
b. Click Add (Insert).
4) If you are creating a Personal Calendar, in the Select Resource dialog box, select a
resource and click OK.
If you are creating a Shared Calendar, in the Select Calendar To Copy dialog box:
a. Choose Global or Resource calendar to use as the base for the new calendar.
b. Click on a global or resource calendar.
c. Click OK.
5) On the Resource Calendars page, click the Calendar tab.
6) On the Calendar tab, click in the Name field and enter a name for the personal or
resource calendar.
7) On the Resource Calendars page, click Save (Ctrl+S).
8) To configure the resource calendar, see Configuring Resource Calendars (on page
109).

P6 EPPM User's Guide
110
Configuring Resource Calendars
Perform the following tasks when creating or updating a resource calendar:
Assigning a Base Calendar to a Resource Calendar
Assign a base calendar to apply all the exception days (i.e. holidays and other work or
nonwork days) from the base calendar for the selected resource calendar.
To assign a base calendar:
1) Click the Resources menu and select Enterprise Resource Data, or click the
Administer menu and select Enterprise Data.
2) In the Enterprise Data pane, expand Resources and click Resource Calendars.
3) On the Resource Calendars page, expand Shared Calendars or Personal Calendars.
a. Select a calendar to assign a base calendar.
b. Click Select a Base Calendar.
4) In the Select Base Calendar dialog box, select a calendar and click OK.
5) Click Save (Ctrl+S).
Tips
The (globe) on calendar days indicates exception days marked in the base
calendar. You can modify these exceptions days and the globe will disappear. If you
set the calendar day back to standard, the exception day will reset and the globe
will reappear.
If you are editing your personal calendar, you cannot change the base calendar.
Assigning a Resource to a Resource Calendar
Resources can be assigned a personal calendar or a shared calendar. A resource is
assigned to a personal calendar when creating a personal calendar. See Creating
Resource Calendars (on page 109).
To assign a resource to a shared calendar:
1) Click the Resources menu and select Enterprise Resource Data, or click the
Administer menu and select Enterprise Data.
2) In the Enterprise Data pane, expand Resources and click Resource Calendars.
3) On the Resource Calendars page:
a. Click on a shared calendar.
Note: Click the Used By tab to view resources currently assigned to
the shared calendar.
b. Click Assign Resource.
4) In the Select Resource dialog box:

Structuring Projects
111
a. Choose a resource and click Assign.
b. Assign any additional resources to the shared calendar, and then click Close.
5) On the Resource Calendars page, click Save (Ctrl+S).
Tips
If you need to remove a resource from a shared calendar, navigate to the correct
resource or global calendar you want to assign to the resource, and then assign the
resource.
You can also assign a calendar to a resource from the Resources tab on the Resources
Administration page. See Assigning Calendars to Resources (on page 82).
Setting Work Hours Per Time Period for a Resource Calendar
Configure the work hours per time period settings to specify the default number of hours
in a work period for a calendar.
To use this feature, the Use assigned calendar to specify the number of work hours for
each time period option must be selected in Application Settings. See Configuring Time
Periods Settings in P6 Help.
To set the number of work hours for each time period:
1) Click the Resources menu and select Enterprise Resource Data, or click the
Administer menu and select Enterprise Data.
2) In the Enterprise Data pane, expand Resources and click Resource Calendars.
3) On the Resource Calendars page:
a. Click on the calendar you want to modify.
b. Click Edit Hours Per Period.
4) In the Set Time Periods dialog box, click and type an hour value in each field, and
then click OK.
5) Click Save (Ctrl+S).
Configuring the Standard Work Week for Resource Calendars
Configure the standard work week for the calendar to set the work and nonwork days
and hours for a standard work week.
To configure the standard work week:
1) Click the Resources menu and select Enterprise Resource Data, or click the
Administer menu and select Enterprise Data.
2) In the Enterprise Data pane, expand Resources and click Resource Calendars.
3) On the Resource Calendars page:
a. Click on the calendar you want to modify.
b. Click the Standard Work Week tab.
P6 EPPM User's Guide
112
4) On the Standard Work Week tab, right-click on a working or nonworking timeslot and
use the menu options to adjust the workday. You can also resize the working time to
increase or decrease the work hours.
5) Click Save (Ctrl+S).
Modifying Calendar Days
Modify calendar days to account for work or nonwork days or hours that are different
than the standard hours defined on the Standard Work Week tab. For example, if you are
using a personal calendar, you might choose to specify vacation days by setting the
standard working days to nonworking days.
To modify work or nonwork calendar days:
1) Click the Resources menu and select Enterprise Resource Data, or click the
Administer menu and select Enterprise Data.
2) In the Enterprise Data pane, expand Resources and click Resource Calendars.
3) On the Resource Calendars page:
a. Click on the calendar you want to modify.
b. Click the Calendar tab.
4) On the Calendar tab, right-click on a working or nonworking day and use the menu
options to adjust the workday.
5) Click Save (Ctrl+S).
Tips
The (globe) on calendar days indicates exception days in the base calendar. You
can modify these exceptions days and the globe will disappear. If you set the calendar
day back to standard, the Global exception day will reset and the globe will reappear.
Changing the Calendar Type
You can change the type of calendar you created from a resource calendar to a global
calendar, a personal calendar to a shared calendar, or a shared calendar to a personal
calendar.
1) Click the Resources menu and select Enterprise Resource Data, or click the
Administer menu and select Enterprise Data.
2) In the Enterprise Data pane, expand Resources and click Resource Calendars.
3) On the Resource Calendars page, click on a personal or shared calendar.
To change a calendar from a resource calendar to a global calendar:
On the Resource Calendars toolbar, click Promote to Global Calendar.
To change a personal calendar to a shared calendar, or to change a shared
calendar to a personal calendar:

Structuring Projects
113
Note: If you are converting a shared calendar to a personal
calendar, you must remove all but one resource before
proceeding with this step. To remove a resource from a calendar,
navigate to the correct calendar for the resource and assign the
resource to that calendar.
4) Click Convert to Personal Calendar or Convert to Shared Calendar.


115
In This Chapter
Establishing Activity Codes .................................................................................... 116
About Activities ....................................................................................................... 121
About Activity Types ............................................................................................... 126
About WBS Summary Activities ............................................................................. 127
About Gantt Charts ................................................................................................ 127
About the Activity Table ........................................................................................ 129
About Activity Networks ......................................................................................... 129
About Calendar View ............................................................................................ 131
About Progress Spotlight ........................................................................................ 133
About Relationship Lines ........................................................................................ 133
About Progress Lines ............................................................................................... 133
About Activity Views ............................................................................................... 134
About Grouping and Sorting ................................................................................. 145
About Resource Assignments................................................................................ 145
Assigning Activity Roles .......................................................................................... 148
Configuring Activity Roles ...................................................................................... 149
Assigning Resource Curves to Resource or Role Assignments from the Activities
Page ......................................................................................................................... 150
About Activity Codes ............................................................................................. 151
About Expenses ....................................................................................................... 153
About Feedback..................................................................................................... 154
About Status ............................................................................................................ 156
About Duration Types ............................................................................................. 158
About Constraints ................................................................................................... 160
About Issues ............................................................................................................. 161
About Notebooks ................................................................................................... 163
About Notebook Topics ......................................................................................... 164
About Relationships ................................................................................................ 164
About Risks ............................................................................................................... 170
About Steps ............................................................................................................. 172
About Step Templates ............................................................................................ 174
About Trace Logic .................................................................................................. 175
About Budget Change Logs ................................................................................. 176
About Earned Value ............................................................................................... 178
About Milestones .................................................................................................... 179
About Cost Accounts ............................................................................................. 180
About Expenses ....................................................................................................... 181
Implementing the Schedule

P6 EPPM User's Guide
116
Establishing Activity Codes
About Activity Codes
Activity codes enable you to categorize activities into logical groups based on your
organization's criteria. An activity code can be one of three types: Global, EPS, or
Project. Global activity codes organize activities across all projects in an organization.
EPS activity codes organize activities within a specific branch or node of the enterprise
project structure (EPS). Project activity codes categorize activities based on specific
features within a project.
Activity codes represent broad categories of information, a department or project
manager for instance. You can create multiple activity codes according to specific
categories, then assign different values for each code. For example, assume your
organization has many departments and you want to review activities within each
department. You can first create an activity code "department," then assign different
values such as quality assurance, finance, and sales. You can then associate activities
with specific departments.
A key characteristic of an activity code as opposed to an activity user defined field is
that activity codes will only allow entries from a predefined list of values. After you create
activity codes, users can assign activity code values to activities to group, sort, and filter
project data based on these values.
Working with Activity Codes
There are three types of activity codes: Global, EPS, and Project. Global activity codes
can be used in all projects within the enterprise. EPS activity codes can only be used in
projects that belong to a specific EPS, including its subordinate EPS nodes, if any. Project
activity codes can be used only in their designated project. The EPS or project that an
activity code is associated with is specified when the code is created.

Implementing the Schedule
117
Table of Key Activity Code Administration Elements
Item Description
Navigation Controls: After expanding Activities and clicking Activity
Codes in the Enterprise Project Data pane, select the Global, EPS, or
Project tab to configure activity codes.
Global tab: In this example, Phase is a global activity code. Like all
activity codes, each of its values contains a short code Name,
Description, and Color. For example, INSTL is the Installation Phase activity
code value for the Phase activity code.
EPS tab: In this example, Contractor is an EPS activity code. DESIGN is The
Design Group activity code value.
Project tab: This tab displays a third set of activity codes arranged by
project for use only within that project.
Table of Key Activity Code Assignment Elements
Item Description
Phase activity code field: In this example, the user has added the Phase
activity code field to the columns in the table and has assigned the INSTL
code value to the selected activity.
Codes detail window: Use this detail window to assign global, EPS, or
project activity codes to the currently selected activity.
Activity Gantt chart: The color of the bars can be configured to display
the corresponding colors of the assigned activity code.
Bars tab of the Customize Activity View dialog box: In this example, the
Phase activity code will determine the color of the bar in the Gantt chart.

P6 EPPM User's Guide
118
Creating Activity Codes
Create activity codes organizes activities into groups. Activity codes can be one of three
levels: global, EPS, or project.
To create activity codes:
1) Click the Projects menu and select Enterprise Project Data, or click the
Administer menu and select Enterprise Data.
2) In the Enterprise Data pane, expand Activities and click Activity Codes.
3) On the Activity Codes page, click the Global, EPS, or Project tab to determine the
level for the activity code.
4) On the Global, EPS, or Project tab, click the Add Activity Code icon.
a. Move the activity code to the correct location in the list by clicking the Move
Up (Ctrl+Alt+Up) and Move Down (Ctrl+Alt+Down) arrows.
b. In the Name field, double-click and type a unique code.
Note: Project-level activity codes must be unique across all
projects. Enterprise-level activity codes must be unique across all
EPSs. Global activity codes must be unique across the organization.
c. In the Maximum Length field, double-click and click the up or down arrow to
specify project code value length.
d. In the Secure field, mark the option to make the code read-only for users without
the necessary security privileges to make changes.
Note: You can designate an activity code as secure only if you
have the appropriate security privilege; otherwise, this option does
not display.
e. Click Save (Ctrl+S).
Tips
Activity codes at the same level are siblings. Subordinate activity codes are children.
Click Move to Global to move an EPS-level or project-level activity code to a
global-level activity code. Click Move to EPS to move a project-level activity code to
an EPS-level activity code.
If you are working on the Project tab and the project you need is not visible, click
Select Projects. In the Select Projects dialog box, select a project and click OK. For
help adding projects to the Selected Projects list, see Customize Columns or Values
(on page 239).

Implementing the Schedule
119
Creating Activity Code Values
Create activity code values to represent variations within the larger scope of the activity
code. It is these values, not the activity codes, that you will assign to projects. You can
add code values for project-level, EPS-level, and global activity codes. These steps
represent the minimum required to create an activity code value. To configure an
activity code value, see Configuring Activity Code Values in P6 Help.
To create activity code values:
1) Click the Projects menu and select Enterprise Project Data, or click the
Administer menu and select Enterprise Data.
2) In the Enterprise Data pane, expand Activities and click Activity Codes.
3) On the Activity Codes page, click the Global, EPS, or Project tab to determine the
level for the activity code value.
4) On the Global, EPS, or Project tab:
a. Select a code.
b. Click Add Activity Code Value.
Note: The code value will be assigned to the selected code.
c. Move the activity code value to the correct location in the list and hierarchical
position by clicking the Move Up (Ctrl+Alt+Up), Move Down
(Ctrl+Alt+Down), Move Left (Ctrl+Alt+Left), and Move Right (Ctrl+Alt+Right)
arrows.
d. In the Name field, double-click and type a code value unique to that tree level.
Note: The code value cannot exceed the Maximum Length
specified by the activity code.
e. Click Save (Ctrl+S).
Tips
Activity code values at the same level are siblings. Subordinate activity code values
are children.
You can also assign project-level activity code values to an open project. On the
Projects navigation bar, click Activities and click the Codes detail window. In the
Codes detail window, click Assign Activity Code Value. In the Select Code Value
dialog box, you can assign a preexisting code value or add a new code value. To
assign an existing code value, mark Global, EPS, or Project and select an activity
code value from that level. To add a new code value, select an activity code and
click Add Code Value. Type a name and description and click Create.
To select multiple projects in the Select Projects dialog box, press the Ctrl key and
click the projects to be selected.
Each time you update the list of projects on the Project tab, the application saves the
list of displayed projects.

P6 EPPM User's Guide
120
If you are working on the Project tab and the project you need is not visible, click
Select Projects. In the Select Projects dialog box, select a project and click OK. The
dialog box only displays the projects you have access to view. For help adding
projects to the Selected Projects list, see Customize Columns or Values (on page 239).
Creating Activity Code Values for Activities
You can quickly create activity code values in the Activity Codes detail window of the
Activities page.
To create activity code values in the Activity Codes detail window:
1) Open one or more projects in the Projects section using one of the following methods:
Click Projects to open the last project or group of projects you were working
with.
Click the Projects menu and choose one of the most-recently used projects
or group of projects.
Click the Projects menu and choose Open Projects to select a project or
group of projects by portfolio type, EPS node, or project code.
2) On the Projects navigation bar, click Activities.
3) On the Activities page, select an activity and click the Codes detail window.
4) In the Codes detail window, click Assign (Insert).
5) In the Select Code Value dialog box:
a. Select the Global, EPS, or Project option for a list of activity codes.
b. Select an activity code to which you will add the value.
c. Click Add Code Value.
6) In the Add Activity Code Value dialog box, enter a value in each field and click
Create.
7) In the Select Code Value dialog box:
Assign the value to the selected activity and click Close.
Or
Click Close.
8) On the Activities page, click the Actions menu and select Save (Ctrl+S).
Tips
In the Code Value field, you must enter a value that is unique across the project.
You can also create activity code values from the Enterprise Project Data dialog box
or the Administer menu, see Creating Activity Code Values (on page 119).

Implementing the Schedule
121
About Activities
Also known as tasks, events, or work packages, activities are the lowest level
manageable work elements in a project or WBS. Activities typically have expected
durations, costs, and resource or role requirements. Milestone activities, however, have
no duration or cost. Collectively, all activities form the foundation of the entire project,
driving resource assignments, relationships, constraints, expenses, and durations.
Activities are sometimes further divided into any number of discrete steps.
Working with Activities
Although you might view activities any number of ways in P6, including on dashboards,
workspaces, reports, and the Resource Assignments page, the most common way to
work with project activities is on the Activities page and, specifically, in the Activity Table.
The Activity Table
Item Description
Open Projects: Open the projects you want to work with using the Open
Projects menu item. Then click the navigation bar icon for the Activities
page. The page shows which projects are currently open.
Activity View: Next, select an activity view that already includes the
Activity Table or click Table. The view should be sorted hierarchically
by WBS in order to optimize your ability to manage WBS elements and
activities within them. When working with activities, always make sure you
have set the grouping, sorting, and filtering view options that help you
focus on only the data that matches your needs.

P6 EPPM User's Guide
122
Item Description
Menus and Toolbars: The menus and customizable toolbars on the
Activities page provide you with convenient access to the commands of
most importance to your work.
Activity Table: You can select activities and update them within the table
itself or on the detail windows. In the table, you can modify, Cut, Copy,
Paste, and Fill Down values. When multiple projects are open, you can
copy and paste activities between projects just as you would within a
single project. When you cut or copy an activity, all attributes are copied
along with it.
Activity Gantt: Refer to the optional Gantt chart to supplement your work
in the table with a visual representation of the schedule.
Assignments detail window: Update resource and role assignments in this
detail window. The first resource also appears in the Primary Resource
column in the table. In this example, the Assignments detail window is
floatable, meaning it can freely be moved within the screen.
Steps detail window: Break the activity down into smaller units called
steps. The progress of steps can also be measured. In this example, some
progress has been recorded in the Step % Complete field for each of
three steps for the activity. The user in this example, has also elected to
dock the Steps detail window above the other windows but below the
Activity Table.
General detail window: Record basic details about the activity in this
detail window. You can show or hide the series of detail windows that
appears for each activity and WBS.
Note: Using P6 Administrator application, your administrator can set
a default value for the maximum number of activities that appear
within an activity view.
Creating Activities
Create activities to define a more detailed breakdown of projects or WBSs.
To create activities:
1) Open one or more projects in the Projects section using one of the following methods:
Click Projects to open the last project or group of projects you were working
with.
Click the Projects menu and choose one of the most-recently used projects
or group of projects.

Implementing the Schedule
123
Click the Projects menu and choose Open Projects to select a project or
group of projects by portfolio type, EPS node, or project code.
2) On the Projects navigation bar, click Activities.
3) On the Activities page:
a. Select a project, WBS, or activity; the new activity will be added beneath your
selection.
b. Click the Actions menu and select Add Add Activity.
c. Enter a name in the WBS/Activity field.
d. Click the Actions menu and select Save (Ctrl+S).
Tips
Right-click a project, WBS, or activity and select Add Activity to quickly add an
activity.
The application automatically names new activities New Activity.
You can create up to 15000 activities per activity view.
Configuring General Activity Information
You can configure some of the general information for activities, including Activity Type,
Duration Type, and activity constraints.
To configure general activity information:
1) Open one or more projects in the Projects section using one of the following methods:
Click Projects to open the last project or group of projects you were working
with.
Click the Projects menu and choose one of the most-recently used projects
or group of projects.
Click the Projects menu and choose Open Projects to select a project or
group of projects by portfolio type, EPS node, or project code.
2) On the Projects navigation bar, click Activities.
3) On the Activities page, select an activity and click the General detail window.
4) In the General detail window, configure the Details, Durations, Units and Costs, Status,
and Constraints sections to represent the information you want to display for that
activity.
5) On the Activities page, click the Actions menu and select Save (Ctrl+S).

P6 EPPM User's Guide
124
Recalculating Assignment Costs
Recalculate assignment costs to update price per time values on activities. This ensures
that project costs reflect any updates.
To recalculate assignment costs:
1) Open one or more projects in the Projects section using one of the following methods:
Click Projects to open the last project or group of projects you were working
with.
Click the Projects menu and choose one of the most-recently used projects
or group of projects.
Click the Projects menu and choose Open Projects to select a project or
group of projects by portfolio type, EPS node, or project code.
2) On the Projects navigation bar, click Activities.
3) On the Activities page:
a. Select an activity.
b. Click the Actions menu and select Run Recalculate Assignment Costs.
4) In the Recalculate Assignment Costs dialog box:
a. (Optional) Select the Synchronize Overtime Factor option to synchronize the
overtime factor defined for each resource when recalculating costs.
b. Click Recalculate.
Tips
When activity dates change, run Recalculate Assignment Costs to update resource
costs based on the new dates.
These services are removed from the database based on the ASAP Cleanup Rate
your P6 administrator specifies on the Configurations tab in P6 Administrator
application. Once the time is met all ASAP jobs that have a status other than running
or delegated will be removed from the table automatically. Running and delegated
jobs will be removed if they are older than the cleanup rate or if they are older than
one day, whichever is greater.

Implementing the Schedule
125
Sending Project Data to ERP
If P6 is configured to function with an Oracle Enterprise Resource Planning (ERP)
application, such as JD Edwards EnterpriseOne, and your administrator has granted you
appropriate security privileges, you can send project cost data for an approved and
baselined project to the configured ERP application for integration. The data from your
projects then becomes available within your ERP applications for assignment and
tracking.
To send project data to ERP:
1) Open one or more projects in the Projects section using one of the following methods:
Click Projects to open the last project or group of projects you were working
with.
Click the Projects menu and choose one of the most-recently used projects
or group of projects.
Click the Projects menu and choose Open Projects to select a project or
group of projects by portfolio type, EPS node, or project code.
2) On the Projects navigation bar, click Activities.
3) On the Activities page, click the Actions menu and select Import/Export
Send to ERP.
Note: Any pending changes are automatically saved.
4) In the Send Projects to ERP dialog box:
a. Select the projects you want to send to ERP.
b. Select or clear the options.
c. Click Send.
Customizing Detail Windows
You can customize which detail windows appear on the EPS or Activities pages.
To customize detail windows:
1) Open one or more projects in the Projects section using one of the following methods:
Click Projects to open the last project or group of projects you were working
with.
Click the Projects menu and choose one of the most-recently used projects
or group of projects.
Click the Projects menu and choose Open Projects to select a project or
group of projects by portfolio type, EPS node, or project code.
2) On the Project navigation bar, click Activities or EPS.
3) On the Activities or EPS page:

P6 EPPM User's Guide
126
a. Select a view from the Activity or EPS View list.
b. Click the View menu and select Customize Detail Windows.
4) In the Customize Detail Windows dialog box:
a. In the Area section, select one of the options to determine which listing of detail
windows is available for you to customize.
b. In the Detail Window section, select or clear the options beside detail windows to
add or remove them from the page.
c. Click Save.
Tips
Select or clear the option beside the Detail Window title to add all or remove all the
detail windows.
Right-click a detail window tab to customize detail windows. Click Customize on the
menu to open the Customize Detail Windows dialog box, or click a detail window
name to add or remove it from the page.
Click and drag detail windows to change their order. Otherwise, the detail windows
appear in the same order that they appear in the Customize Detail Windows dialog
box.
Click Float on the detail window to convert it to a dialog box. You can then drag
this dialog box to change its position.
When you navigate to a new page, you can save or cancel the view changes you
made to the detail windows. These changes will only be saved for the view selected
in the Activity or EPS View list.
About Activity Types
One of many attributes for an activity, the Activity Type determines how the activity is
scheduled according to various scheduling scenarios:
Task Dependent: This type of activity indicates that assigned resources should be
scheduled based on the activity's calendar, rather than the calendars of the
resources.
Resource Dependent: This type of activity indicates that resources should be
scheduled based on their assigned calendars. Use this type when the activity
duration may be affected by resource availability.
Level of Effort: This type of activity indicates that it is ongoing with a duration
determined by its dependent activities. The duration is calculated based on the
schedule dates of its predecessors and successors. Administrative activities are
typically designated as Level of Effort.
Start Milestone: This type of activity indicates the beginning of a major project phase.
Activities of this type have a duration of zero (0) with no resource assignments.
Finish Milestone: This type of activity indicates the end of a major project phase.
Activities of this type have a duration of zero (0) with no resource assignments.

Implementing the Schedule
127
About WBS Summary Activities
A WBS summary activity type represents a group of activities that share a common work
breakdown structure (WBS) level. The summary-level WBS activity enables the rollup of
dates for the activity group. Rollup values for a WBS summary activity are calculated
when the project is scheduled. The duration of a WBS summary activity extends from the
start of the earliest activity in a group to the finish of the latest activity.
The WBS summary activity type combines the summary capabilities of the WBS structure
with task-level attributes such as relationships, resource assignments, and notebooks. Use
this activity type to roll up dates, duration, and percent complete values for a group of
activities that share a common WBS code.
The WBS code of a WBS summary activity determines which activities comprise the
group. For example, a WBS summary activity assigned to WBS code A, would roll up
values for all activities under any subordinate WBS that relates to code A: A.1, A.1.1, A.2,
A.2.1, and so on. If the WBS summary activity in this case were assigned to WBS code A.1,
it would roll up values for activities under WBS A.1 and A.1.1, but not for those activities
under A.2 or A.2.1.
About Gantt Charts
A Gantt chart is a graphical representation of the duration and sequence of activities or
projects. It is useful for planning, scheduling, and monitoring progress against a timeline.
Working with the Activity Gantt Chart
Use the Activity Gantt chart to view the progression and relationships of activities or
projects on a timeline.
Gantt chart bars and activity dates or durations
You can easily update dates and durations by resizing or moving Gantt chart bars. When
you change bar positions in a Gantt chart, the start and finish date columns update
automatically to reflect the new bar position. After moving a Gantt bar, when you save
your changes, the remaining duration is recalculated based on the new dates and the
activity or project calendar. Because this calendar is applied when you save, if you
move but do not resize a Gantt bar, the duration might shorten or lengthen based on the
calendar's nonworktime.
Note: If you click the center of a bar and drag it along the
timescale, you will be prompted to add a Start On or After
constraint. In the Gantt chart, you can impose only a Start On or
After constraint.

P6 EPPM User's Guide
128
Customizing the Gantt chart
You can change the progress line options or the timescale for the Gantt chart in the
Customize Activity View dialog box.
Viewing the Gantt chart
In the Gantt chart, a vertical blue line represents the current data date for the project.
Vertical sightlines appear at each minor increment (bottom) of the timescale. Horizontal
sightlines appear at the bottom of every fifth table row. The timescale background is
shaded to indicate nonworktime based on the global default calendar.
Activity highlight
To quickly locate the activities you need to update, you can use the Progress Spotlight
feature, which highlights all activities that should have progressed during a specific time
period. This time period is defined by the smallest increment of the current timescale
since the last data date. For example, if the current timescale is set to Month/Week,
Progress Spotlight highlights all activities that should have progressed during the week
since the data date.
Configuring Gantt Charts
Configure the Gantt chart to adjust activity beginning and finishing dates as well as
constraints.
To configure the Gantt chart:
1) Open one or more projects in the Projects section using one of the following methods:
Click Projects to open the last project or group of projects you were working
with.
Click the Projects menu and choose one of the most-recently used projects
or group of projects.
Click the Projects menu and choose Open Projects to select a project or
group of projects by portfolio type, EPS node, or project code.
2) On the Project navigation bar, click Activities or EPS.
3) On the Activities or EPS page, click the View menu and select Gantt Chart.
4) On the Gantt chart:
a. To resize bars, select a bar and click and drag the beginning or end of it to a new
date. (Only applicable on the Activities page.)
b. To focus the Gantt chart on a specific time interval, double-click a year, quarter,
month, week, or day on the timescale. The Gantt chart timescale will expand or
shrink to show the entire time interval.
c. To expand a specific area of the Gantt chart, click the timescale at the top of the
Gantt chart once (the pointer will become a double-headed arrow), move the
pointer to select the portion of the timescale you want to expand, and click again.
You can perform this step several times.

Implementing the Schedule
129
d. To apply a Start On or After Activity Constraint, click the middle of a bar and drag it
along the timescale. (Only applicable on the Activities page.)
5) On the Activities or EPS page, click the View menu and select Save (Ctrl+S).
Tips
To back out of a zoom, double-click the top bar of the timescale.
For more information on configuring Gantt charts, see Configuring Activity View Gantt
Chart (on page 142) or Configuring Project View Gantt Chart in P6 Help.
After resizing or moving a Gantt bar, when you save your changes, the activity
remaining duration is recalculated based on the new dates and the activity's
calendar. Because the calendar for the activity is applied when you save, a date you
specified for an activity might change slightly if it occurs during calendar
nonworktime. Also, if you move, but do not resize, a Gantt bar, the duration might
shorten or lengthen based on the activity calendar's nonworktime.
If you select the option Do not show this again in the Activity Constraint dialog box, it
will not reappear until the next time you log in.
To create or configure activity relationships in the Gantt chart, see Creating Activity
Relationships (on page 165) or Configuring Activity Relationships (on page 166).
About the Activity Table
The Activity Table presents all WBS and activity information for the currently open projects
in a familiar table format. You can customize Activity Table columns, filters, grouping,
sorting, fonts, and colors.
For example, you might change the information displayed in columns to show
scheduling data, resource and cost data, user-defined fields, or any data items you
select, including calculated data. You can also format specific information to call
attention to it by using the filter, group and sort, and other table display features.
Use the Activity Table to:
Create a list of activities and activity information quickly when you don't need to see
the information graphically over time as in a Gantt chart.
Group activities that share a common attribute into hierarchies. For example, focus
on activities by resource, responsibility, or date. Once you organize activities into
groups, you can summarize or "roll up" project data to simplify their presentation.
Sort activities to arrange them in an order you specify. For example, to view activities
chronologically, you might sort them by a date field.
About Activity Networks
An Activity Network is a graphical display of activities and their logical relationships
according to the WBS. You can use an Activity Network to view activity relationship paths
and the flow of work through a project. Activity Networks also allow you to examine and
edit an activity and its predecessors and successors.

P6 EPPM User's Guide
130
Working with Activities in the Activity Network
In addition to the Activity Table format, you can also view activities in an Activity
Network. You can also include your choice of WBS and activity detail windows in this
alternate viewing format.
The Activity Network maps the WBS elements and activities in your project into a series of
interconnected boxes. Arrows between boxes represent the relationships between
activities. The standard color-coded activity status icons also appear in this viewing
format: black diamonds represent milestones, and other status icons reveal when an
activity is not yet started, in progress, completed, or critical. Activity boxes
outlined in red represent critical activities while activity boxes outlined in blue are not.
Activity Network
Item Description
Activity View: Select an activity view that already includes the Activity
Network or click Activity Network.

Implementing the Schedule
131
Item Description
Activity Network: The arrow from a predecessor activity points to its
successor. Solid red lines between boxes represent critical relationships,
while blue lines represent non-critical relationships. Solid lines represent
driving relationships, which indicate when a predecessor activity
influences the start date of its successor. The predecessor drives the start
date of the successor activity by causing it to start earlier or later than the
scheduled date depending on the finish date of the predecessor.
Dashed lines represent non-driving relationships, which include all
predecessor and successor activity relationships: Start-to-Start,
Finish-to-Start, Start-to-Finish, and Finish-to-Finish. You can show only
driving relationships or show all relationships.
Customize Activity Network: You can customize the content and
arrangement of the boxes that represent your activities in the network. If
you select the Show progress option on the Customize Activity Network
dialog box or on the Activity Network tab of the Customize Activity View
dialog box, you can view activity progress in the Activity Network.
Completed activities are marked with an X across the activity box.
Activities in progress are marked with a slash (\) across the activity box.
Detail Windows: The same WBS and Activity detail windows are available
with any activity viewing format. In this example, the user has elected to
show the Risks detail window. When you select an Activity Network box,
the selected box displays a light blue background while the boxes that
are not selected display a gray background.
Note: P6 identifies relationships as driving when all of the following
are true: 1) the successor activity has Free Float less than or equal
to zero; 2) the activity does not have a Start On or Finish On
constraint; and, 3) the activity does not have an Actual Finish date.
About Calendar View
The Calendar View displays activities in a monthly calendar format. Bars on the calendar
represent each activity and its duration.

P6 EPPM User's Guide
132
Working with Activities in Calendar View
In addition to the Activity Table format, you can also view activities in a calendar format,
including a special Day View detail window. You can also include your choice of WBS
and activity detail windows in this alternate viewing format.
The Activity Calendar Viewing Format
Item Description
Activity View: Select an activity view that already includes the Calendar
or click Calendar View.
Calendar Work Area: View project activities in the calendar by month.
Use the controls at the top to view the next or previous month. In
Calendar View, activity bars display in the color specified within the First
Bar section of the Bars tab in the Customize Activity Views dialog box, or
as the color assigned to an activity code value. Critical activities display
as red bars. Milestones display as black diamonds.
Day View Detail Window: Double-click an activity in the Calendar View to
see the activities assigned to an individual day. When more activities are
scheduled on a day than can be displayed in a day of Calendar View,
an ellipsis is displayed within the day.

Implementing the Schedule
133
Item Description
Detail Windows: The same WBS and activity detail windows are available
with any activity viewing format. In this example, the user has elected to
show the Trace Logic detail window below the Calendar View.
About Progress Spotlight
Progress Spotlight highlights the activities that should have progressed during a specific
time period. A yellow curtain is dropped behind the activities to enable quick navigation
to the activities in this timeperiod. Use the Progress Spotlight feature (View, Progress
Spotlight) to highlight activities in the layout that have started, progressed, or finished
between the previous data date and the new data date.
About Relationship Lines
Relationship lines graphically illustrate the links between activities in Gantt charts and
Activity Networks. Whether the relationship line is connected to the beginning or end of
an activity bar determines the type of relationship. For more information on relationships,
see About Relationships (on page 164).
About Progress Lines
A progress line is a way to graphically trace progress on activities and see how a project
is performing with regard to its scheduled deadlines. When a progress line is drawn to the
left of the data date, the activity is behind schedule. When a progress line is drawn to the
data date, the activity is on schedule. When a progress line is drawn to the right of the
data date, the activity is ahead of schedule.
Progress lines can be either progress point lines or variance lines. As a progress point line,
the progress line shows either the remaining duration of an activity or the percent of the
activity that has been completed. Progress points are determined by calculating the
difference between current and baseline dates for each activity, or based on actual
progress determined by each activity's remaining duration or percent complete. As a
variance line, the progress line can represent an inconsistency between the planned
and actual start dates or finish dates of a task.

P6 EPPM User's Guide
134
About Activity Views
An activity view is the visual layout of project information. For each view, you can
customize data and content-specific choices such as grouping, column selection, and
visual display options. Selecting the best view for your needs can facilitate the process of
recording project data. For example, to quickly record a range of details for new
activities, you might select a table view which maximizes the number of data columns
available. Or, to automatically apply a particular attribute, such as WBS or activity code,
to newly added activities, you could select a view which groups activities based on that
attribute.
Working with Activity Views
Using activity views
Configure the Activities page and the Customize Activity View dialog box to customize
the views that display the project and activity data you require in a format that meets
your needs. You can save these settings with the view. Save the changes if you want
them to appear the next time you work with the view. Do not save the changes if you
only want your alterations to last for the session.
The view list on the Activities toolbar provides quick and easy access to all activity views
that are available to you. While working with activities, choosing the best view for your
needs can facilitate the process of recording project data.
Choose and organize the data content of a view
You can configure the content and organization of any activity view you create. For
activity views you can access but did not create, you can review activity view settings,
but you cannot make changes.
Note: On the Activities page, to quickly rearrange the columns
currently displayed in a view, drag and drop them.
Your ability to perform certain actions in a view depends on the view's access class, your
role as either creator or user of the view, and your security profile. For example, if a
multi-user or global view includes cost data elements and the current user does not have
rights to view costs, the data is dashed out so it is not visible to the user.
Grouping and sorting activities
You can group all activities that contain the same value for a specific data field. For
example, if you choose to group by Project then by Primary Resource, the Activities
page groups activities in project groupings. Then, within each project group, activities
are further categorized according to primary resource. Finally, within each primary
resource group, activities are sorted based upon the sort field and sort order you specify,
for example Start Date.

Implementing the Schedule
135
In the Gantt chart, when you group activities, a summary bar appears for each group.
You can expand and collapse the group as needed to focus only on the project
Summary Schedule or on the Detailed Schedule. In the table, when you group activities,
each grouping level is identified and separated by a colored band or background.
You can elect to show rollups, or summary totals, for each group.
Creating Views
Create views to determine how information is visually displayed. These steps represent
the minimum required to create an activity or project view.
To create an activity or project view:
1) Open one or more projects in the Projects section using one of the following methods:
Click Projects to open the last project or group of projects you were working
with.
Click the Projects menu and choose one of the most-recently used projects
or group of projects.
Click the Projects menu and choose Open Projects to select a project or
group of projects by portfolio type, EPS node, or project code.
2) On the Projects navigation bar, click Activities or EPS.
3) On the Activities or EPS page:
a. Select a view similar to the view you want to create from the Activity or EPS View
list.
b. Click View and select Save View As.
4) In the Save View As dialog box, type a name in the Please specify the view name
field and click OK.
5) On the Activities or EPS page:
a. Configure the new view to have the properties you want. See Configuring Activity
Views (on page 135) or Configuring Project Views.
b. Click the Actions menu and select Save (Ctrl+S) when you are finished.
Tips
The application will add your new view to the Users section of the Activity or EPS View list.

P6 EPPM User's Guide
136
Configuring Activity Views
Configure activity views to define how you see activity data. Activity views affect the
filters, grouping, and columns that are applied to the Activities page. Detail window
visibility is also affected by the selected activity view.
To configure activity views:
1) Open one or more projects in the Projects section using one of the following methods:
Click Projects to open the last project or group of projects you were working
with.
Click the Projects menu and choose one of the most-recently used projects
or group of projects.
Click the Projects menu and choose Open Projects to select a project or
group of projects by portfolio type, EPS node, or project code.
2) On the Projects navigation bar, click Activities.
3) On the Activities page:
1. Click the Activity View list and select an activity view.
2. Click the View menu and select Customize View....
4) In the Customize Activity View dialog box:
a. Configure the Columns tab. See Configuring Activity View Columns (on page 137).
b. Configure the Grouping tab. See Configuring Activity View Grouping (on page
137).
c. Configure the Filters tab. See Configuring Activity View Filters (on page 138).
d. Configure the Bars tab. See Configuring Activity View Bars (on page 141).
e. Configure the Gantt Chart tab. See Configuring Activity View Gantt Chart (on
page 142).
f. Configure the Activity Network tab. See Configuring Activity View Activity Network
(on page 143).
g. Configure the Access tab. See Configuring Activity View Access (on page 143).
h. Click OK.
Tips
You can modify any view you create. You can only modify multi-user and global
activity views if you have the appropriate security privileges.
Many of these configurations, configuring columns and filters for example, do not
require you to open the Customize Activity View dialog box. If the necessary
toolbuttons are available on your toolbar, you can use them to configure the activity
view.

Implementing the Schedule
137
Configuring Activity View Columns
Configure activity view columns to specify which columns are visible in the Gantt chart or
table.
To configure columns:
1) Open one or more projects in the Projects section using one of the following methods:
Click Projects to open the last project or group of projects you were working
with.
Click the Projects menu and choose one of the most-recently used projects
or group of projects.
Click the Projects menu and choose Open Projects to select a project or
group of projects by portfolio type, EPS node, or project code.
2) On the Projects navigation bar, click Activities.
3) On the Activities page:
a. Click the Activity View list and select an activity view to configure.
b. Click the View menu and select Customize View....
4) In the Customize Activity View dialog box, click the Columns tab.
5) On the Columns tab:
a. In the Select the columns to display section, customize the Selected Columns list.
See Customizing Selected Lists (on page 239).
b. In the Column Options section, select an option from each list.
c. Click OK.
Tips
You can display a maximum of 30 columns.
Click Font Picker and select a font and size from the dialog box to change the font for
a column.
You can customize activity view columns from the View menu. Click the View menu
and select Columns.
Configuring Activity View Grouping
Configure grouping to define how fields are grouped on the Activities page.
To configure activity view grouping:
1) Open one or more projects in the Projects section using one of the following methods:
Click Projects to open the last project or group of projects you were working
with.
Click the Projects menu and choose one of the most-recently used projects
or group of projects.

P6 EPPM User's Guide
138
Click the Projects menu and choose Open Projects to select a project or
group of projects by portfolio type, EPS node, or project code.
2) On the Projects navigation bar, click Activities.
3) On the Activities page:
a. Click the Activity View list and select an activity view to configure.
b. Click the View menu and select Customize View....
4) In the Customize Activity View dialog box:
a. Click the Grouping tab and configure the grouping options in each section.
b. Click OK.
Tips
When activities are grouped, the Gantt chart on the Activities page displays a
summary bar for each group. The summary bar represents the time period from the
earliest Early Start to the latest Early Finish for the group.
Use the To Level list to select the number of hierarchy levels when grouping by a
hierarchical field. When grouping by dates, use the To Level list to select a time
interval.
The band color you select will display in the table and the Activity Network.
You can also access activity view grouping from the View menu. Click the View menu
and select Group.
Grouping bands are displayed by default when you group by a project code or EPS
even if the bands are empty. Select the Hide if empty option in the Customize View or
Customize Groupings dialog boxes to remove these bands from view.
Configuring Activity View Filters
You can modify or create filters. These filters can then be applied to several different
activity views.
To configure activity view filters:
1) Open one or more projects in the Projects section using one of the following methods:
Click Projects to open the last project or group of projects you were working
with.
Click the Projects menu and choose one of the most-recently used projects
or group of projects.
Click the Projects menu and choose Open Projects to select a project or
group of projects by portfolio type, EPS node, or project code.
2) On the Projects navigation bar, click Activities.
3) On the Activities page:
a. Click the Activity View list and select an activity view to configure.
b. Click the View menu and select Customize View....

Implementing the Schedule
139
4) In the Customize Activity View dialog box, click the Filters tab.
5) On the Filters tab:
a. You can modify a filter. See Configuring Filters (on page 140).
b. You can create a filter. See Creating Filters (on page 140).
c. You can apply filters. See Applying Filters (on page 139).
d. Click OK when finished.
Tips
The My Activities filter displays all project activities you are either assigned to as a
resource or designated as the activity owner.
For the Activities occurring within (blank) days or Activities finishing within (blank)
days filters, specify a number of days.
You can also customize activity view filters from the View menu. Click the View menu
and select Filters from the Filters submenu.
Applying Filters
Apply filters to a project to specify the data you want to display. You can add
user-created filters or select from the list of standard filters.
To apply filters:
1) Open one or more projects in the Projects section using one of the following methods:
Click Projects to open the last project or group of projects you were working
with.
Click the Projects menu and choose one of the most-recently used projects
or group of projects.
Click the Projects menu and choose Open Projects to select a project or
group of projects by portfolio type, EPS node, or project code.
2) On the Project navigation bar, click Activities or EPS.
3) On the Activities or EPS page:
a. Click the Activity View or EPS View list and select a view to which you will add the
filters.
b. Click the View menu and select Customize View....
4) In the Customize Activity View or Customize Project View dialog box, click the Filters
tab.
5) On the Filters tab:
a. Select an option from the Show matches for list.
b. In the Apply to View column, select the option for each filter you want to apply.
c. Click OK.

P6 EPPM User's Guide
140
Tips
If you have Team Member module access, either assigned as a resource or activity
owner, applying the My Activities filter will have no affect on the activity list display
because your access is already restricted to your assigned and owner activities.
You can also click the View menu and select Filters from the Filters submenu to open
the Customize Filters dialog box. You can apply filters from this dialog box.
If you want to save the application of these filters to the view, click Yes in the
Primavera P6 dialog box which opens when you navigate away from the page.
Creating Filters
Create filters to to narrow activity or project information to a specific data group.
To create filters:
1) Open one or more projects in the Projects section using one of the following methods:
Click Projects to open the last project or group of projects you were working
with.
Click the Projects menu and choose one of the most-recently used projects
or group of projects.
Click the Projects menu and choose Open Projects to select a project or
group of projects by portfolio type, EPS node, or project code.
2) On the Project navigation bar, click Activities or EPS.
3) On the Activities or EPS page:
a. Click the Activity or EPS View list and select a view to which you will add the filters.
b. Click the View menu and select Customize View....
4) In the Customize Activity View or Customize Project View dialog box, click the Filters
tab.
5) On the Filters tab, click Add Filter.
6) In the Create Filter dialog box:
a. Click the Definition tab and configure the fields and lists for one or more filter
statements.
b. Click the Access tab and define user access.
c. Click OK.
Tips
To add more criteria statements, click . To remove a criteria statements, click . To
nest a criteria statement inside another, click . You can add up to ten levels of
nesting.
You can also click the View menu and select Filters from the Filters submenu to open
the Customize Filters dialog box. From this dialog box, you can create filters.

Implementing the Schedule
141
Configuring Filters
You can configure the detailed statements of a filter and who can use it.
To configure filters:
1) Open one or more projects in the Projects section using one of the following methods:
Click Projects to open the last project or group of projects you were working
with.
Click the Projects menu and choose one of the most-recently used projects
or group of projects.
Click the Projects menu and choose Open Projects to select a project or
group of projects by portfolio type, EPS node, or project code.
2) On the Project navigation bar, click Activities or EPS.
3) On the Activities or EPS page:
a. Click the Activity or EPS View list and select a view to which you will add the filters.
b. Click the View menu and select Customize View....
4) In the Customize Activity View or Customize Project View dialog box, select a filter
and click Modify Filter.
5) In the Modify Filter dialog box:
a. Click the Definition tab and configure the fields and lists to edit the filter
statements.
b. Click the Access tab, and select an access option.
c. Click OK.
Tips
You can not edit Standard Filters.
To add more filter statements to the Definition tab, click . To remove a filter, click .
To nest a criteria statement inside another, click . You can add up to ten levels of
nesting.
You can also click the View menu and select Filters from the Filters submenu to open
the Customize Filters dialog box. You can configure filters from this dialog box.
Configuring Activity View Bars
Configure bars to represent different items on the timeline in the Gantt chart and the
Calendar View.
To configure activity view bars:
1) Open one or more projects in the Projects section using one of the following methods:
Click Projects to open the last project or group of projects you were working
with.
Click the Projects menu and choose one of the most-recently used projects
or group of projects.
P6 EPPM User's Guide
142
Click the Projects menu and choose Open Projects to select a project or
group of projects by portfolio type, EPS node, or project code.
2) On the Projects navigation bar, click Activities.
3) On the Activities page:
a. Click the Activity View list and select an activity view to configure.
b. Click the View menu and select Customize View....
4) In the Customize Activity View dialog box, click the Bars tab.
5) On the Bars tab, configure the bar options in each section and click OK.
Tips
The Color option you select determines how the bar will be represented, whether by
color or code.
You can configure options for up to three bars.
A Late bar does not display if the project has not been scheduled.
The Progress bar is blue.
Select the Show Critical option to represent critical activities with a red bar instead of
the color you selected for the Current bar.
You might find it helpful to vary the position of the label on the Current bar.
Click Font Picker and select a font and size from the dialog box to change the font for
a bar.
You can also customize activity view bars from the View menu. Click Gantt Chart
Options on the View menu and click the Bars tab.
Configuring Activity View Gantt Chart
Configure Gantt chart options to determine how the chart will display.
To configure Gantt chart options:
1) Open one or more projects in the Projects section using one of the following methods:
Click Projects to open the last project or group of projects you were working
with.
Click the Projects menu and choose one of the most-recently used projects
or group of projects.
Click the Projects menu and choose Open Projects to select a project or
group of projects by portfolio type, EPS node, or project code.
2) On the Projects navigation bar, click Activities.
3) On the Activities page:
a. Click the Activity View list and select an activity view to configure
b. Click the View menu and select Customize View....
4) In the Customize Activity View dialog box:

Implementing the Schedule
143
a. Click the Gantt Chart tab and configure the Gantt chart options in each section.
b. Click OK.
Tips
Bar necking extends down to the day.
You can also select Gantt Chart Options on the View menu and click the Gantt Chart
tab in the Customize Gantt Chart Options dialog box to configure Gantt charts.
Configuring Activity Network
Configure an Activity Network to determine how the network displays in the activity view.
To configure an Activity Network:
1) Open one or more projects in the Projects section using one of the following methods:
Click Projects to open the last project or group of projects you were working
with.
Click the Projects menu and choose one of the most-recently used projects
or group of projects.
Click the Projects menu and choose Open Projects to select a project or
group of projects by portfolio type, EPS node, or project code.
2) On the Projects navigation bar, click Activities.
3) On the Activities page:
a. Click the Activity View list and select an activity view to configure.
b. Click the View menu and select Customize View....
4) In the Customize Activity View dialog box, click the Activity Network tab.
5) On the Activity Network tab, configure the options, fields, and level and click OK.
Tips
Select the Split Row option in the Activity Box section to divide a row into two fields.
The Second Field list for that row is disabled until the Split Row option is selected.
You can also customize Activity Network options from the View menu. In the Activity
Network view, select Activity Network Options on the View menu.
Configuring Activity View Access
Configure activity view access to define which users will have access to a particular
view.
To configure access:
1) Open one or more projects in the Projects section using one of the following methods:
Click Projects to open the last project or group of projects you were working
with.

P6 EPPM User's Guide
144
Click the Projects menu and choose one of the most-recently used projects
or group of projects.
Click the Projects menu and choose Open Projects to select a project or
group of projects by portfolio type, EPS node, or project code.
2) On the Projects navigation bar, click Activities.
3) On the Activities page:
a. Click the Activity View list and select an activity view to configure.
b. Click the View menu and select Customize View....
4) In the Customize Activity View dialog box, click the Access tab.
5) On the Access tab, select one of the access options and click OK.
Tips
Unless you specify otherwise, Current User is the default access.
If you select List of Users, search for the user, or select users from the Available Users
list.
Sending E-Mail of an Activity View
You can send e-mail of an activity view to distribute details about activities or projects.
To send e-mail of an activity view:
1) Open one or more projects in the Projects section using one of the following methods:
Click Projects to open the last project or group of projects you were working
with.
Click the Projects menu and choose one of the most-recently used projects
or group of projects.
Click the Projects menu and choose Open Projects to select a project or
group of projects by portfolio type, EPS node, or project code.
2) On the Projects navigation bar, click Activities.
3) On the Activities page, click the View menu and select E-mail View.
4) In the E-mail View dialog box:
a. Edit the recipient list, message, and subject as needed.
b. Click Send E-mail.
Tips
You must have an e-mail address listed in you user profile to send an e-mail.

Implementing the Schedule
145
About Grouping and Sorting
To simplify the display of complex tables of data, you can group rows of similar data and
sort the grouped bands as well as the data under them. Grouping helps you block
distracting data and focus only on the information you need. It also permits you to
collapse and expand hierarchical arrangements of your data rather than navigate large
flat lists.
About Resource Assignments
The Resources Assignments area enables you to view a customized list of resource or role
assignments based on the filters you assign to the view. Using this view, you can analyze
assignment unit and cost values and make any necessary modifications to the
assignment data. You can also view unit and cost values in a spreadsheet based on a
specified timescale using the Usage spreadsheet. In addition, you can extend your
customized view by displaying the Gantt chart, which is a graphical display of the start
and end dates for the resource assignments.
Assigning Activity Resources
Assign resources to work on an activity.
To assign a resource to an activity:
1) Open one or more projects in the Projects section using one of the following methods:
Click Projects to open the last project or group of projects you were working
with.
Click the Projects menu and choose one of the most-recently used projects
or group of projects.
Click the Projects menu and choose Open Projects to select a project or
group of projects by portfolio type, EPS node, or project code.
2) On the Projects navigation bar, click Activities.
3) On the Activities page, select the activity to which you want to assign resources and
click the Assignments detail window.
4) In the Assignments detail window, click Assign Resource and Save (Ctrl+Alt+R).
5) In the Select Resource dialog box, assign resources and click Close.
Tips:
When assigning resources to activities, the list of available resources includes only the
resources that belong to your access node, based on resource access, and
resources who are currently assigned to the project.
Activity resource assignments are displayed in the Resource Names column of the
table.

P6 EPPM User's Guide
146
When you assign a resource to an activity that does not have any resource
assignments, the resource is identified as the primary resource. If you subsequently
assign more resources to the same activity, you can change the primary resource
assignment for the activity. To change the primary resource, click Customize Columns
in the Assignments detail window, and select Primary Resource if not already
selected. Select the Primary Resource option for one of the resources.
You can also assign resources to an activity from the Resources dialog box on the
Team Usage page, the Resources dialog box on the Role Usage tab of the Analysis
page, the Open Requests for Resources portlet of the Dashboards page, or the
Activities page Actions menu. To assign resources from the Actions menu on the
Activities page, select an activity and click Assign Resource on the Actions menu.
Configuring Activity Resources
You can configure resource information for activities, including the Planned Units/Time,
Proficiency, or Rate Type for a resource.
To configure activity resources:
1) Open one or more projects in the Projects section using one of the following methods:
Click Projects to open the last project or group of projects you were working
with.
Click the Projects menu and choose one of the most-recently used projects
or group of projects.
Click the Projects menu and choose Open Projects to select a project or
group of projects by portfolio type, EPS node, or project code.
2) On the Projects navigation bar, click Activities.
3) On the Activities page, select an activity and click the Assignments detail window.
4) In the Assignments detail window:
a. Select a resource.
b. Add the columns you need to configure to the detail window. See Showing and
Hiding Columns in a Table (on page 239).
c. Select an option or enter a value for each field.
d. Click Apply Changes (Ctrl+S).
Tips
You can also configure activity resources from the Open Requests for Resources portlet
of the Dashboards page.

Implementing the Schedule
147
Requesting Resources for Activities
When planning for an activity you can assign a role to the activity and replace that role
with the appropriate resource at a later time. To assign a role with specific search criteria,
including role proficiency, resource name, and resource code, use the Request
Resources feature.
To request resources:
1) Open one or more projects in the Projects section using one of the following methods:
Click Projects to open the last project or group of projects you were working
with.
Click the Projects menu and choose one of the most-recently used projects
or group of projects.
Click the Projects menu and choose Open Projects to select a project or
group of projects by portfolio type, EPS node, or project code.
2) On the Projects navigation bar, click Activities.
3) On the Activities page, select an activity and click the Assignments detail window.
4) In the Assignments detail window, click Request Resources (Ctrl+Alt+Q).
5) In the Open a request for a resource dialog box, enter criteria for the resource and
click Save.
Tips
The list of available resources includes only the resources you have access to, based
on resource security, and current project resources.
You must specify a Primary Role.
The resource request criteria is stored and available when assigning resources to roles
using the Open Request for Resource portlet from Dashboards or the Role Usage tab
from the Resources Analysis page.
Specifying Resource Assignment Rates
You can set rate information for resources or roles.
To specify resource assignment rates:
1) Open one or more projects in the Projects section using one of the following methods:
Click Projects to open the last project or group of projects you were working
with.
Click the Projects menu and choose one of the most-recently used projects
or group of projects.
Click the Projects menu and choose Open Projects to select a project or
group of projects by portfolio type, EPS node, or project code.
2) On the Projects navigation bar, click Activities.

P6 EPPM User's Guide
148
3) On the Activities page, select an activity in the table and click the Assignments detail
window.
4) In the Assignments detail window:
a. Add the Rate Type and Rate Source columns. See Showing and Hiding Columns in
a Table (on page 239).
b. Select an option for the type and source.
c. Click Apply Changes (Ctrl+S).
Tips
When you save your changes, costs for the assignment are recalculated based on the
new rate: Cost equals Units times Price/Unit. You can add the Price/Unit column to the
detail window to view the price used. To manually specify a price/unit, select Override in
the Rate Source field and type a value in the Price/Unit field.
Adding Activity Resource Estimates
You can plan resource usage by adding resource estimates to activities.
To add resource estimates:
1) Open one or more projects in the Projects section using one of the following methods:
Click Projects to open the last project or group of projects you were working
with.
Click the Projects menu and choose one of the most-recently used projects
or group of projects.
Click the Projects menu and choose Open Projects to select a project or
group of projects by portfolio type, EPS node, or project code.
2) On the Projects navigation bar, click Activities.
3) On the Activities page, select an activity and click the Assignments detail window.
4) In the Assignments detail window:
a. Assign a resource or role to the selected activity. See Assigning Activity Resources
(on page 145) or Assigning Activity Roles (on page 148).
b. Add the Planned Units/Time, Planned Units, Planned Cost, and Planned Duration
columns to the detail window. See Showing and Hiding Columns in a Table (on
page 239).
c. Select an option or enter a value for each field.
d. Click Apply Changes (Ctrl+S).
Assigning Activity Roles
Assign roles to an activity to show which roles can perform the work required by that
activity.

Implementing the Schedule
149
To assign a role to an activity:
1) Open one or more projects in the Projects section using one of the following methods:
Click Projects to open the last project or group of projects you were working
with.
Click the Projects menu and choose one of the most-recently used projects
or group of projects.
Click the Projects menu and choose Open Projects to select a project or
group of projects by portfolio type, EPS node, or project code.
2) On the Projects navigation bar, click Activities.
3) On the Activities page, select an activity and click the Assignments detail window.
4) In the Assignments detail window, click Assign Role and Save (Ctrl+Alt+O).
5) In the Select Role dialog box, assign roles and click Close.
Tips
You can also assign roles from the Resources section, the Open Requests for Resources
portlet of the Dashboards page, or the Activities page Actions menu. To assign roles from
the Actions menu of the Activities page, select an activity and click Assign Role on the
Actions menu.
Configuring Activity Roles
You can configure role information for activities.
To configure activity roles:
1) Open one or more projects in the Projects section using one of the following methods:
Click Projects to open the last project or group of projects you were working
with.
Click the Projects menu and choose one of the most-recently used projects
or group of projects.
Click the Projects menu and choose Open Projects to select a project or
group of projects by portfolio type, EPS node, or project code.
2) On the Projects navigation bar, click Activities.
3) On the Activities page, select an activity and click the Assignments detail window.
4) In the Assignments detail window:
a. Select a role.
b. Add the columns you need to configure to the detail window. See Showing and
Hiding Columns in a Table (on page 239).
c. Select an option or enter a value for each field.
5) In the Assignments detail window, click Apply Changes (Ctrl+S).

P6 EPPM User's Guide
150
Tips
You can also configure activity roles from the Open Requests for Resources portlet of the
Dashboards page.
Assigning Resource Curves to Resource or Role Assignments from the Activities Page
You can assign a resource distribution curve to any resource or role assignment on
activities with a duration type of Fixed Duration and Units/Time or Fixed Duration & Units.
Resource usage and costs are distributed evenly during an activity unless you specify
nonlinear distribution using curves.
To assign a resource curve:
1) Open one or more projects in the Projects section using one of the following methods:
Click Projects to open the last project or group of projects you were working
with.
Click the Projects menu and choose one of the most-recently used projects
or group of projects.
Click the Projects menu and choose Open Projects to select a project or
group of projects by portfolio type, EPS node, or project code.
2) On the Projects navigation bar, click Activities.
3) On the Activities page, to set the Duration Type to Fixed Duration and Units/Time or
Fixed Duration & Units, click the View menu and select Columns. (If the Duration
Type is already set, select an activity and go to step 5.b.)
4) In the Customize Columns dialog box:
a. Expand General in the Available Columns section.
b. Double-click Duration Type.
c. Click OK.
5) On the Activities page:
a. Select Fixed Duration and Units/Time or Fixed Duration & Units from the Duration
Type list for the activity whose curve you want to configure.
b. Click the Assignments detail window.
Note: The activity must have a resource or role assigned to it. See
Assigning Activity Resources (on page 145) or Assigning Activity
Roles (on page 148).
6) In the Assignments detail window, double-click the Curve field, and click .
7) In the Select Curves dialog box, select a curve and click OK.
8) On the Activities page, click the Actions menu and select Save (Ctrl+S).

Implementing the Schedule
151
Tips
If you assign a resource curve to an assignment with a manual curve, the
manually-entered future period values will be overwritten.
Resource curves do not support expenses. The Accrual Type will continue to spread
the expenses.
If the Curve column is not available, add it to the detail window. See Showing and
Hiding Columns in a Table (on page 239).
You can also assign resource curves to resource or role assignments from the
Resources Assignments page. See Assigning Resource Curves to Resource or Role
Assignments from the Resources Assignments Page (on page 85).
About Activity Codes
Activity codes enable you to categorize activities into logical groups based on your
organization's criteria. An activity code can be one of three types: Global, EPS, or
Project. Global activity codes organize activities across all projects in an organization.
EPS activity codes organize activities within a specific branch or node of the enterprise
project structure (EPS). Project activity codes categorize activities based on specific
features within a project.
Activity codes represent broad categories of information, a department or project
manager for instance. You can create multiple activity codes according to specific
categories, then assign different values for each code. For example, assume your
organization has many departments and you want to review activities within each
department. You can first create an activity code "department," then assign different
values such as quality assurance, finance, and sales. You can then associate activities
with specific departments.
A key characteristic of an activity code as opposed to an activity user defined field is
that activity codes will only allow entries from a predefined list of values. After you create
activity codes, users can assign activity code values to activities to group, sort, and filter
project data based on these values.
Creating Activity Code Values for Activities
You can quickly create activity code values in the Activity Codes detail window of the
Activities page.
To create activity code values in the Activity Codes detail window:
1) Open one or more projects in the Projects section using one of the following methods:
Click Projects to open the last project or group of projects you were working
with.
Click the Projects menu and choose one of the most-recently used projects
or group of projects.

P6 EPPM User's Guide
152
Click the Projects menu and choose Open Projects to select a project or
group of projects by portfolio type, EPS node, or project code.
2) On the Projects navigation bar, click Activities.
3) On the Activities page, select an activity and click the Codes detail window.
4) In the Codes detail window, click Assign (Insert).
5) In the Select Code Value dialog box:
a. Select the Global, EPS, or Project option for a list of activity codes.
b. Select an activity code to which you will add the value.
c. Click Add Code Value.
6) In the Add Activity Code Value dialog box, enter a value in each field and click
Create.
7) In the Select Code Value dialog box:
Assign the value to the selected activity and click Close.
Or
Click Close.
8) On the Activities page, click the Actions menu and select Save (Ctrl+S).
Tips
In the Code Value field, you must enter a value that is unique across the project.
You can also create activity code values from the Enterprise Project Data dialog box
or the Administer menu, see Creating Activity Code Values (on page 119).
Assigning Activity Code Values to Activities
Assign activity code values to selected activities to group and filter data.
To assign activity code values:
1) Open one or more projects in the Projects section using one of the following methods:
Click Projects to open the last project or group of projects you were working
with.
Click the Projects menu and choose one of the most-recently used projects
or group of projects.
Click the Projects menu and choose Open Projects to select a project or
group of projects by portfolio type, EPS node, or project code.
2) On the Projects navigation bar, click Activities.
3) On the Activities page, select an activity and click the Codes detail window.
4) In the Codes detail window, click Assign (Insert).
5) In the Select Code Value dialog box, assign code values and click Close.
6) On the Activities page, click the Actions menu and select Save (Ctrl+S).
Implementing the Schedule
153
About Expenses
Expenses are non-resource costs associated with a project and assigned to a project’s
activities. An expense is typically a one-time expenditure for non-reusable items.
Expenses are project-specific and not time-based. Some examples include facilities,
travel, consulting, and training. Each expense has an actual, remaining, and at
completion value for both cost and units that is either budgeted or planned.
Expense categories classify and standardize expenses, and organize and maintain your
expense information.
Creating Expenses
Create expenses to show costs that you expect each activity to accrue.
To create expenses:
1) Open one or more projects in the Projects section using one of the following methods:
Click Projects to open the last project or group of projects you were working
with.
Click the Projects menu and choose one of the most-recently used projects
or group of projects.
Click the Projects menu and choose Open Projects to select a project or
group of projects by portfolio type, EPS node, or project code.
2) On the Projects navigation bar, click Activities.
3) On the Activities page, select an activity and click the Expenses detail window.
4) In the Expenses detail window:
a. Click Add Expense Item (Insert).
b. Enter a name in the Expense Item field.
5) On the Activities page, click the Actions menu and select Save (Ctrl+S).
Configuring Expenses
Configure expenses to update costs associated with an activity.
To configure expenses:
1) Open one or more projects in the Projects section using one of the following methods:
Click Projects to open the last project or group of projects you were working
with.
Click the Projects menu and choose one of the most-recently used projects
or group of projects.
Click the Projects menu and choose Open Projects to select a project or
group of projects by portfolio type, EPS node, or project code.

P6 EPPM User's Guide
154
2) On the Projects navigation bar, click Activities.
3) On the Activities page, select an activity and click the Expenses detail window.
4) In the Expenses detail window:
a. Select an expense.
b. Add the columns you need to configure to the detail window. See Showing and
Hiding Columns in a Table (on page 239).
c. Select an option or enter a value for each field.
5) On the Activities page, click the Actions menu and select Save (Ctrl+S).
Configuring Auto Compute Actuals for Expenses
You can configure auto compute actuals for activity expenses.
To configure auto compute actuals:
1) Open one or more projects in the Projects section using one of the following methods:
Click Projects to open the last project or group of projects you were working
with.
Click the Projects menu and choose one of the most-recently used projects
or group of projects.
Click the Projects menu and choose Open Projects to select a project or
group of projects by portfolio type, EPS node, or project code.
2) On the Projects navigation bar, click Activities.
3) On the Activities page, select an activity and click the Expenses detail window.
4) In the Expenses detail window:
a. Select an expense item.
b. Select the Auto Compute Actuals option in the Auto Compute Actuals column.
5) On the Activities page, click the Actions menu and select Save (Ctrl+S).
Tips
If the Auto Compute Actuals column is not displayed, add it to the detail window. See
Showing and Hiding Columns in a Table (on page 239).
About Feedback
Feedback is the exchange of activity-specific notes between team members. Notes are
added to activities either to or from the resource.
Adding Feedback
Add feedback to or from an activity resource for selected activities.

Implementing the Schedule
155
To add feedback:
1) Open one or more projects in the Projects section using one of the following methods:
Click Projects to open the last project or group of projects you were working
with.
Click the Projects menu and choose one of the most-recently used projects
or group of projects.
Click the Projects menu and choose Open Projects to select a project or
group of projects by portfolio type, EPS node, or project code.
2) On the Projects navigation bar, click Activities.
3) On the Activities page, select the activity about which you want to add feedback
and click the Feedback detail window.
4) In the Feedback detail window:
If you are the resource, click the field under Feedback from Resources, enter
feedback, and click Add.
If you are not the resource, click the field under Notes to Resources, enter
feedback, and click Add.
5) On the Activities page, click the Actions menu and select Save (Ctrl+S).
Tips
Once added, feedback cannot be modified.
Anyone with rights to view the activity can read the feedback.
Adding the New Feedback Column
Add the New Feedback column to act as a visual cue when there are new notes in the
Feedback detail window.
To add the feature feature:
1) Open one or more projects in the Projects section using one of the following methods:
Click Projects to open the last project or group of projects you were working
with.
Click the Projects menu and choose one of the most-recently used projects
or group of projects.
Click the Projects menu and choose Open Projects to select a project or
group of projects by portfolio type, EPS node, or project code.
2) On the Projects navigation bar, click Activities.
3) On the Activities page, click the View menu and select Columns.
4) In the Customize Columns dialog box:
a. Expand Timesheet Feedback in the Available Columns list and double-click New
Feedback to add it to the Selected Columns list.

P6 EPPM User's Guide
156
b. Click OK.
Acknowledging Feedback
Acknowledge feedback you receive to show that you have seen comments about an
activity. This task assumes that you have added the feedback feature to your table or
Gantt chart. See Adding the New Feedback Column (on page 155).
To acknowledge feedback:
1) Open one or more projects in the Projects section using one of the following methods:
Click Projects to open the last project or group of projects you were working
with.
Click the Projects menu and choose one of the most-recently used projects
or group of projects.
Click the Projects menu and choose Open Projects to select a project or
group of projects by portfolio type, EPS node, or project code.
2) On the Projects navigation bar, click Activities.
3) On the Activities page:
a. Select the activity with new feedback. (The new New Feedback column option
will be selected.)
b. Click the Feedback detail window to read and respond to the feedback. See
Adding Feedback (on page 154).
c. Clear the option to acknowledge you have read the feedback.
d. Click the Actions menu and select Save (Ctrl+S).
Tips
The message is displayed with the timestamp when the note was sent and the name of
the sender.

Implementing the Schedule
157
About Status
Status is a brief representation of an activity's condition at any given time. Status tracks
the duration, beginning and ending dates, percent complete, units and costs, and
constraints associated with an activity.
Configuring Status
Configure status to define percent complete and start and finish dates.
To configure status:
1) Open one or more projects in the Projects section using one of the following methods:
Click Projects to open the last project or group of projects you were working
with.
Click the Projects menu and choose one of the most-recently used projects
or group of projects.
Click the Projects menu and choose Open Projects to select a project or
group of projects by portfolio type, EPS node, or project code.
2) On the Projects navigation bar, click Activities.
3) On the Activities page, select an activity and click the Status detail window.
4) In the Status detail window, in the Status section:
a. Select or clear the Started and Finished options.
b. If you select an option, click and select a date from the calendar.
c. In the Status section, enter a percentage in the Activity % Complete field.
5) On the Activities page, click the Actions menu and select Save (Ctrl+S).
Configuring Status Units and Costs
Configure status units and costs to define the units and cost for a selected activity.
To configure status units and costs:
1) Open one or more projects in the Projects section using one of the following methods:
Click Projects to open the last project or group of projects you were working
with.
Click the Projects menu and choose one of the most-recently used projects
or group of projects.
Click the Projects menu and choose Open Projects to select a project or
group of projects by portfolio type, EPS node, or project code.
2) On the Projects navigation bar, click Activities.
3) , select an activity and click the Status detail window.
4) In the Status detail window, in the Units and Costs section:

P6 EPPM User's Guide
158
a. Select an option from the list.
b. Enter a value with a time unit abbreviation in each field.
5) On the Activities page, click the Actions menu and select Save (Ctrl+S).
Tips
You can only enter At Completion Cost/Units for activities that are not started or in
progress.
The application will calculate the values for Remaining Cost/Units and Actual
Cost/Units.
About Duration Types
Duration type is the basis for estimating the selected activity's completion time. It
determines whether the schedule, resource availability, or costs are most important
when updating activities. The duration type applies only when you have resources
assigned to the activity. Select one of the following duration types based on which factor
is most important (least flexible) in planning your project: Fixed Duration & Units/Time,
Fixed Duration & Units, Fixed Units/Time, or Fixed Units.
Fixed Duration & Units/Time or Fixed Duration & Units: Indicate that the schedule is a
limiting factor in your project. The activity's duration does not change regardless of the
number of resources assigned when you modify or update activities. You usually select
one of these duration types when you are using task-dependent activities. When you
update the remaining duration for the activity, you can select to calculate either the
remaining units or the units per timeperiod. The duration type enables you to control
which variables of an equation are calculated when you change a value.
If you want to recalculate the remaining units and keep the units/time for the resource
constant, select Fixed Duration & Units/Time. The application uses the equation:
Remaining Units = Units/Time x Remaining Duration. For example, if a resource is assigned
to an activity for 8 hours/day for 5 days, the remaining units or work is calculated as 40
hours.
If instead you want to keep the remaining units constant and recalculate the units/time,
select Fixed Duration & Units. The application uses the equation: Units/Time = Remaining
Units/Remaining Duration. For example, if a resource is assigned to work 40 hours in 5
days, the units/time is calculated as 8 hours/day.
Fixed Units/Time: Indicates that resource availability is the most critical aspect of your
project. In this case, the units/time or rate of the resource remains constant, even if the
activity's duration or work effort changes. You most often use this duration type when you
are planning resource-dependent activities.
Fixed Units: Indicates that the budget (units or cost) is a limiting factor; that is, the total
amount of work is fixed. When you update activities, the work effort required to complete
the activity does not change, even if the activity's duration or the resource rate changes.
Typically, you would use this type in conjunction with resource-dependent activities.
Increasing resources can decrease the activity duration.

Implementing the Schedule
159
Working with Duration Types
Duration type options
Duration type determines whether the schedule, resource availability, or cost is most
inflexible when calculations are performed to reflect activity progress. Duration type
affects update calculations only when resources are assigned to an activity.
Choose a duration type based on which factor is the most important, or least flexible, in
planning your project.
If schedule is most important, choose Fixed Duration and Units/Time or Fixed
Duration and Units.
If resource availability is most important, choose Fixed Units/Time.
If total work effort or fixed costs are most important, choose Fixed Units.
Configuring Status Durations
Configure status durations to define time assignments for activities.
To configure status durations:
1) Open one or more projects in the Projects section using one of the following methods:
Click Projects to open the last project or group of projects you were working
with.
Click the Projects menu and choose one of the most-recently used projects
or group of projects.
Click the Projects menu and choose Open Projects to select a project or
group of projects by portfolio type, EPS node, or project code.
2) On the Projects navigation bar, click Activities.
3) , select an activity and click the Status detail window.
4) In the Status detail window, in the Durations section, enter a value with a time unit
abbreviation in each field.
5) On the Activities page, click the Actions menu and select Save (Ctrl+S).
Tips
You can only enter At Completion Duration for activities that are not started or in
progress.
The application will calculate the values for Remaining Duration and Actual Duration.
Durations are rounded to the nearest half hour.
You can quickly and easily change durations in the Gantt chart by dragging and
resizing activity bars. The application will automatically update the activity durations
for you.

P6 EPPM User's Guide
160
About Constraints
Constraints are recognized real-world restrictions that affect project performance. Any
factor that potentially delays when an activity can be scheduled is a constraint. The
most typical constraints are date restrictions. Constraints can apply to the entire project
or only to individual activities and can even reflect external project requirements that
cannot be built into the network logic. Some examples of constraints are: must finish by
(project-level constraint) and start on or after (activity-level constraint).
Working with Activity Constraints
P6 supports the following types of activity constraints:
Start On: Imposes the specific start date you select. The Start On constraint can delay an
activity's early start or move forward an activity's late start to satisfy the constraint date.
Start On or Before: Defines the latest date an activity can start. This constraint only affects
late dates and can decrease total float. When calculating a schedule, P6 imposes the
start on or before constraint in the backward pass only if the calculated late start date
will be later than the imposed date.
Start On or After: Defines the earliest date an activity can begin. This constraint affects
only early dates. When calculating a schedule, P6 imposes the start on or after constraint
in the forward pass only if the calculated early start date will be earlier than the imposed
date.
Finish On: Imposes the specific finish date you select. The Finish On constraint can delay
an activity's early finish or move forward an activity's late finish to satisfy the constraint
date.
Finish On or Before: Defines the latest time an activity can finish. The finish on or before
constraint affects only late dates.
Finish On or After: Defines the earliest date an activity can finish. The finish on or after
constraint reduces float to coordinate parallel activities, ensuring that the finish of an
activity is not scheduled before the specified date. It is usually applied to activities with
few predecessors that must finish before the next phase of a project.
As Late As Possible: Imposes a restriction on an activity with positive float to allow it to
start as late as possible without delaying its successors. When calculating a schedule, P6
sets the activity's early dates as late as possible without affecting successor activities. This
option disables the calendar icon.
Mandatory Start: Imposes the early and late start dates you select. P6 uses the
mandatory early start date regardless of its effect on network logic. A mandatory early
start date could affect the late dates for all activities that lead to the constrained activity
and all early dates for the activities that lead from the constrained activity.

Implementing the Schedule
161
Mandatory Finish: Imposes the early and late finish dates you select. P6 uses the
mandatory finish date regardless of its effect on network logic. This constraint affects the
late dates for all activities that lead to the constrained activity and all early dates for the
activities that lead from the constrained activity.
Configuring Status Constraints
Configure status constraints to show restrictions on project performance.
To configure status constraints:
1) Open one or more projects in the Projects section using one of the following methods:
Click Projects to open the last project or group of projects you were working
with.
Click the Projects menu and choose one of the most-recently used projects
or group of projects.
Click the Projects menu and choose Open Projects to select a project or
group of projects by portfolio type, EPS node, or project code.
2) On the Projects navigation bar, click Activities.
3) , select an activity and click the Status detail window.
4) In the Status detail window, in the Constraints section:
a. Select a constraint from the Primary Constraint list.
b. Click the Primary Constraint and select a date from the calendar.
Note: You may add a Secondary Constraint.
5) On the Activities page, click the Actions menu and select Save (Ctrl+S).
Tips
When mandatory constraints are placed on calendar nonworktime, the early date is
moved forward to the next valid worktime and the late date is moved back (earlier) to
the first valid worktime. This can cause negative float in the schedule.
About Issues
Issues are perceived problems within a schedule that require attention or corrective
action. When you create them in the Activities section, you can associate them with a
single project or workgroup and assign them to a responsible manager in the OBS for
follow-up based on priority. You can also associate issues with a single activity. When
adding new issues to a project or workgroup, you can control the information you
capture for each new issue. You can choose to receive e-mail notifications when new
issues of a certain priority are added, when existing issues are modified, or when issues
are assigned a specific issue code.

P6 EPPM User's Guide
162
You can also think of issues as impediments, action items, open items, punch lists, logs, or
concerns. Over time, if you do not resolve or close open issues or issues placed on hold,
they can become risks.
Issue codes enable you to organize and categorize issues in a way that is meaningful to
you. For example, you can create an issue code titled Severity, and subsequently create
issue code values: High, Medium, and Low. You can assign each of these code values to
issues across multiple projects, enabling you to categorize each issue according to how
severe it is. Similarly, you can create codes to categorize issues by responsibility,
subproject, or any other classification you require to organize issues. Assigning issue
codes enables you to quickly search for and view issues according to specific criteria.
Creating Activity Issues
Create activity issues to identify problems that must be addressed before a project can
be completed.
To create activity issues:
1) Open one or more projects in the Projects section using one of the following methods:
Click Projects to open the last project or group of projects you were working
with.
Click the Projects menu and choose one of the most-recently used projects
or group of projects.
Click the Projects menu and choose Open Projects to select a project or
group of projects by portfolio type, EPS node, or project code.
2) On the Projects navigation bar, click Activities.
3) On the Activities page, select an activity and click the Issues detail window.
Note: To create a project or WBS issue, select a project or WBS in
place of an activity.
4) In the Issues detail window:
a. Click Add Issue (Insert).
b. Enter or select a value for the Issue Name, Priority, Status, and Responsible
Manager fields.
5) On the Activities page, click the Actions menu and select Save (Ctrl+S).
Tips:
You cannot add an issue to a project that is checked out or locked.
The application automatically names the issue New Issue. Update the issue so it has a
unique name.

Implementing the Schedule
163
Configuring Activity Issues
Configure activity issues to account for changes since the last update on the issue.
To configure activity issues:
1) Open one or more projects in the Projects section using one of the following methods:
Click Projects to open the last project or group of projects you were working
with.
Click the Projects menu and choose one of the most-recently used projects
or group of projects.
Click the Projects menu and choose Open Projects to select a project or
group of projects by portfolio type, EPS node, or project code.
2) On the Projects navigation bar, click Activities.
3) On the Activities page, select an activity and click the Issues detail window.
Note: To configure a project or WBS issue, select a project or WBS in
place of an activity.
4) In the Issues detail window:
a. Select an issue.
b. Add the columns you need to configure to the detail window. See Showing and
Hiding Columns in a Table (on page 239).
c. Select an option or enter a value for each field.
5) On the Activities page, click the Actions menu and select Save (Ctrl+S).
About Notebooks
A notebook is another name for a log or binder of electronic details about an activity,
WBS, project, or EPS element. All the notes users enter or paste into the notebook,
including e-mail messages, web links, tables, and other entries, share a single common
theme called a notebook topic. See About Notebook Topics (on page 164).
Working with Notebooks
Notebook topics are created by the administrator on the Enterprise Data page of the
Administer menu. These topics are then assigned to activity, WBS, project, or EPS node
notebooks.

P6 EPPM User's Guide
164
About Notebook Topics
Notebook topics help multiple users apply a common theme or label to shared
information about an activity, WBS, project, or EPS element such as its purpose,
completion instructions, or other helpful notes. For example, you might place an e-mail
message, a web link, a table of observations, and a series of text notes into a notebook
topic called Budget Recommendations to capture the ongoing cost impacts of a
recurring project.
Assigning Notebook Topics
Depending on the page you are working on, you can assign notebook topics to a
selected project or activity.
To assign a notebook topic to a project:
1) Click Projects.
2) On the Projects navigation bar, click EPS.
3) On the EPS page, select a project or EPS node and click the Notebooks detail
window.
4) In the Notebooks detail window, click Assign (Insert).
5) In the Select Notebook Topic dialog box, select a notebook topic, click Assign, then
Close.
6) On the EPS page, click the Actions menu and select Save (Ctrl+S).
Tips
You can also create notebook topic descriptions. In the Notebooks detail window,
double-click the Description field and click (browse). Enter a description in the
dialog box.
You can also assign notebook topics to activities from the Notebooks detail window
of the Activities page or the Activity Details page of the Open Requests for Resources
portlet of the Dashboards page.
About Relationships
A relationship defines how an activity relates to the start or finish of another activity or
assignment. An activity can have as many relationships as necessary to model the work
that must be done. These relationships are used together with activity durations to
determine schedule dates. Relationships can also exist between activities in different
projects; this type of relationship is referred to as an external relationship.
Activities that are dependent on one another are known as predecessors and
successors, where the first activity is the predecessor and the second is the successor.
Between these two types of activities, there are four possible relationship types:
Finish to Start - The successor activity cannot start until its predecessor finishes.

Implementing the Schedule
165
Finish to Finish - The successor activity cannot finish until its predecessor finishes.
Start to Start - The successor activity cannot start until its predecessor starts.
Start to Finish - The successor activity cannot finish until its predecessor starts.
A permitted modification to these logical relationships is called lag. Lag values can be
positive numbers (a delay, slower, deceleration of progress) or negative numbers (lead
time, faster, acceleration of progress). For example, in a Finish to Start relationship, if you
specify a ten-day lag (+10), the successor activity cannot start until ten days after the
predecessor has finished. Likewise, if you specify a negative ten-day lag (–10), the
successor activity could start ten days before the related predecessor activity finishes.
Creating Activity Relationships
Create activity relationships to show interdependencies between activities.
To create an activity relationship:
1) Open one or more projects in the Projects section using one of the following methods:
Click Projects to open the last project or group of projects you were working
with.
Click the Projects menu and choose one of the most-recently used projects
or group of projects.
Click the Projects menu and choose Open Projects to select a project or
group of projects by portfolio type, EPS node, or project code.
2) On the Projects navigation bar, click Activities.
3) On the Activities page:
a. Click the View menu and select Gantt Chart.
b. Click the View menu and select Show Relationship Lines.
Note: If Hide Relationship Lines is displayed in the View menu,
the lines are already set to show. Exit the menu and return to the
Gantt chart.
c. Right-click the bar to which you want to assign a relationship and click Create
Relationship.
Note: Your cursor will become a cross.
d. With the cross, click the beginning or end of the bar and then click the beginning
or end of the bar you want to relate.
Note: Where you click each bar determines the type of
relationship. See About Relationships (on page 164).
e. Click the Actions menu and select Save (Ctrl+S).

P6 EPPM User's Guide
166
Tips
You can scroll through the Gantt chart while your cursor is a cross to find a related bar.
To delete a relationship, right-click the relationship line and select Delete Relationship.
If multiple projects are open, you can create external relationships.
You can also view or configure existing predecessor or successor relationships, from
the Predecessors or Successors detail windows.
Configuring Activity Relationships
Configure activity relationships to adjust interdependencies between different activities.
To configure activity relationships:
1) Open one or more projects in the Projects section using one of the following methods:
Click Projects to open the last project or group of projects you were working
with.
Click the Projects menu and choose one of the most-recently used projects
or group of projects.
Click the Projects menu and choose Open Projects to select a project or
group of projects by portfolio type, EPS node, or project code.
2) On the Projects navigation bar, click Activities.
3) On the Activities page:
a. Click the View and select Gantt Chart.
b. Click the View menu and select Show Relationship Lines.
Note: If Hide Relationship Lines is displayed in the View menu,
the lines are already set to show. Exit the menu and return to the
Gantt chart.
c. Right-click the relationship line of the relationship you want to configure and click
Edit Relationship.
4) In the Edit Relationship dialog box, configure the relationship type and lag and click
OK.
5) On the Activities page, click the Actions menu and select Save (Ctrl+S).
Tips
You can also configure relationships from the Predecessor and Successor detail
windows. See Configuring Predecessor Relationships (on page 167) or Configuring
Successor Relationships (on page 169).
Implementing the Schedule
167
Assigning Predecessor Relationships
You can assign predecessor relationships to the activities in a project.
To assign a predecessor relationship:
1) Open one or more projects in the Projects section using one of the following methods:
Click Projects to open the last project or group of projects you were working
with.
Click the Projects menu and choose one of the most-recently used projects
or group of projects.
Click the Projects menu and choose Open Projects to select a project or
group of projects by portfolio type, EPS node, or project code.
2) On the Projects navigation bar, click Activities.
3) On the Activities page, select an activity to which you want to assign a predecessor
and click the Predecessors detail window.
4) In the Predecessors detail window, click Assign (Insert).
5) In the Select Predecessor Activity dialog box, assign activities and click Close.
6) On the Activities page, click the Actions menu and select Save (Ctrl+S).
Tips
You can assign relationships to multiple activities at one time. Select multiple activities
using Ctrl+click or Shift+click. Right-click the selected activities and select Link
Selected Activities. Based on their sequence in the view, the application creates
Finish to Start relationships between selected activities. That is, a Finish to Start
relationship is applied between the first and second activity, between the second
and third activity, and so on. If an activity pair already has an Finish to Start
relationship, the application tries, in turn, to apply each of the other relationship
types, if possible. Otherwise, no relationship is applied to the pair.
When selecting a predecessor or successor activity, you can choose from activities in
the open projects only.
Configuring Predecessor Relationships
Configure predecessor relationships to define lag or relationship type.
To configure predecessor relationships:
1) Open one or more projects in the Projects section using one of the following methods:
Click Projects to open the last project or group of projects you were working
with.
Click the Projects menu and choose one of the most-recently used projects
or group of projects.
Click the Projects menu and choose Open Projects to select a project or
group of projects by portfolio type, EPS node, or project code.

P6 EPPM User's Guide
168
2) On the Projects navigation bar, click Activities.
3) On the Activities page, select an activity whose predecessor relationships you want
to configure and click the Predecessors detail window.
4) In the Predecessors detail window:
a. Select a relationship.
b. Add the columns you need to configure to the detail window if they are not
already available. See Showing and Hiding Columns in a Table (on page 239).
c. Select an option or enter a value for each field.
5) On the Activities page, click the Actions menu and select Save (Ctrl+S).
Tips
You can also configure activity relationships from the Gantt chart. See Configuring
Activity Relationships (on page 166).
Assigning Successor Relationships
You can assign successor relationships to the activities in your project.
To assign a successor relationship:
1) Open one or more projects in the Projects section using one of the following methods:
Click Projects to open the last project or group of projects you were working
with.
Click the Projects menu and choose one of the most-recently used projects
or group of projects.
Click the Projects menu and choose Open Projects to select a project or
group of projects by portfolio type, EPS node, or project code.
2) On the Projects navigation bar, click Activities.
3) On the Activities page, select an activity to which you want to assign successors and
click the Successors detail window.
4) In the Successors detail window, click Assign (Insert).
5) In the Select Successor Activity dialog box, assign activities and click Close.
6) On the Activities page, click the Actions menu and select Save (Ctrl+S).

Implementing the Schedule
169
Tips
You can assign relationships to multiple activities at one time. Select multiple activities
using Ctrl+click or Shift+click. Right-click the selected activities and select Link
Selected Activities. Based on their sequence in the view, the application creates
Finish to Start relationships between selected activities. That is, a Finish to Start
relationship is applied between the first and second activity, between the second
and third activity, and so on. If an activity pair already has an Finish to Start
relationship, the application tries, in turn, to apply each of the other relationship
types, if possible. Otherwise, no relationship is applied to the pair.
When selecting a predecessor or successor activity, you can choose from activities in
the open projects only.
Configuring Successor Relationships
Configure successor relationships to define lag or relationship type.
To configure successor relationships:
1) Open one or more projects in the Projects section using one of the following methods:
Click Projects to open the last project or group of projects you were working
with.
Click the Projects menu and choose one of the most-recently used projects
or group of projects.
Click the Projects menu and choose Open Projects to select a project or
group of projects by portfolio type, EPS node, or project code.
2) On the Projects navigation bar, click Activities.
3) On the Activities page, select an activity whose successor relationships you want to
configure and click the Successors detail window.
4) In the Successors detail window:
a. Select a relationship.
b. Add the columns you need to configure to the detail window if they are not
already available. See Showing and Hiding Columns in a Table (on page 239).
c. Select an option or enter a value for each field.
5) On the Activities page, click the Actions menu and select Save (Ctrl+S).
Tips
You can also configure activity relationships from the Gantt chart. See Configuring
Activity Relationships (on page 166).

P6 EPPM User's Guide
170
About Risks
Risks are any uncertain events or conditions that, if they occur, have a positive or
negative effect on project objectives. Risks are also known as threats, warnings,
imperatives, escalation notices, or jeopardies. Positive risks are often classified as
opportunities which, if they occur, are realized as rewards. Thorough documentation and
analysis of risks over multiple projects offer lessons, and potentially cost and time savings,
for all future projects.
Working with Project Risks
The risk register on the Risks page is the main area of the application where you identify
and manage risks for a project. Additionally, you can add risks to a project from the
Projects EPS page, and add risks to a project and assign the risks to activities from the
Activities page.
Once you add a risk to the risk register, you can perform further analysis on the risk and
create one or more risk response plans which include activities to reduce the negative
impact of the risk. See About Risk Response Plans (on page 221).

Implementing the Schedule
171
Table of Project Risks Elements
Item Description
Risks toolbar.
Risks work area: Risks for all the projects you have open display in the risk
register. You can group by field name, such as project name to view all
risks organized by project, or create a filter to view only the risks that
interest you.
When adding a risk to the risk register, you supply a name for the risk,
identify the risk as a threat or an opportunity, identify the current status of
the risk, identify the owner of the risk, and then assign the values for
probability, schedule, cost, and any other applicable user-defined
impacts. The values for probability, schedule, cost, and additional
user-defined impacts are used to calculate the risk score.
Note: If the Probability, Cost, and Schedule fields
are disabled, a risk scorning matrix has not been
assigned to the project. You can still use the risk
register to track your risks; however, you cannot use
the qualitative risk analysis features in the
application until you create a risk scoring matrix
and assign it to the project.
Risks detail windows:
Response Plans: The area where you add response plans and response
plan action items. See Working with Risk Response Plans (on page 222).
Activities: The area where you associate scheduled activities in your
project to an identified risk. Refer to the example above to see a list of
the project activities impacted by risk R001: Concrete supply
constrained.
Description: The area used to provide a detailed explanation of the risk.
Cause: The area used to explain why this risk is occurring.
Effect: The area used to describe the impact this risk has on this project.
Notes: The area used to capture any additional information regarding
the risk.
Probability and Impact Diagram: The Probability and Impact Diagram
(PID) is a graphical representation of the probability and impact
thresholds assigned to the risk scoring matrix associated with the project.
P6 EPPM User's Guide
172
Assigning a Risk to an Activity
Assign a risk to an activity to explicitly identify the activity impacted by the risk.
You can assign a risk to an activity while you are adding project risks on the Risks page or
while managing your activities on the Activities page.
To assign a risk to an activity from the Risks page:
1) Click Projects.
2) On the Projects navigation bar, click Risks.
3) , click on a risk.
4) Click on the Activities detail window and click Assign Activities .
5) On the Select Activity dialog box:
a. Select an activity and click Assign.
b. Select any additional activities impacted by the risk and click Assign.
c. Click Close.
6) On the Risks page, click Save (Ctrl+S).
To assign a risk to an activity from the Activities page:
1) Click Projects.
2) On the Projects navigation bar, click Activities.
3) On the Activities page, select the activity you want to assign a risk.
4) On the Risks detail window, click Assign Risk.
5) On the Select Risk dialog box, select a risk and click OK.
6) On the Activities page, click Save (Ctrl+S).
About Steps
Steps make it possible to describe and report progress for activity work at a granular level
by breaking an activity into its component parts.
Steps can have a step weight that quantifies the portion of an activity's total work that
each step represents. On a project per project basis, you can use step weights to
calculate Activity Percent Complete. For example, three steps are assigned to an
activity; the first step has a weight of 2, and the second and third steps each have a
weight of 1. When you mark the first step (weight of 2) as complete, the percent
complete is 50. When you mark the first and second steps complete, the percent
complete is 75. When all three steps are marked complete, the percent complete is 100.
Working with Activity Steps
How can I use activity steps?

Implementing the Schedule
173
Activity steps make it possible to describe and report progress for activity work at a more
granular level of detail. If you have privileges to edit activities, you can add individual
steps to activities, or you can add predefined groups of steps based on templates that
have been defined for your organization. You can specify a weight for each step to
show how much work for the activity is contained in a step.
Activity step templates
Step templates enable an organization to define groups of steps that can be shared by
many projects. By creating templates for groups of activity steps that are relevant in
many projects, an organization can streamline data entry and ensure that work is
identified consistently throughout the organization.
In P6, when adding steps to an activity, you can choose from a list of available
templates. You can use more than one template, but you can add steps from only one
template at a time.
If you use a template to add steps to an activity, you can edit the step details but not the
step name.
Weighted activity steps
To indicate the portion of activity work that a single step represents, you can assign it a
numerical value, or weight. Once work for a step is underway, Primavera can use the
step weight and the reported progress of step work (Step Percent Complete) to
calculate the percentage of total work that has been completed for the activity
(Activity Percent Complete).
Creating Activity Steps
Create steps to break activities down into their component parts.
To create steps:
1) Open one or more projects in the Projects section using one of the following methods:
Click Projects to open the last project or group of projects you were working
with.
Click the Projects menu and choose one of the most-recently used projects
or group of projects.
Click the Projects menu and choose Open Projects to select a project or
group of projects by portfolio type, EPS node, or project code.
2) On the Projects navigation bar, click Activities.
3) On the Activities page, select an activity you want to break down into smaller parts
and click the Steps detail window.
4) In the Steps detail window, repeat the following for each step you want to add to the
activity:
a. Click Add Activity Step (Insert).

P6 EPPM User's Guide
174
b. Enter a value in the Step Name, Step % Complete, and Step Weight fields.
5) On the Activities page, click the Actions menu and select Save (Ctrl+S).
Tips
You can also create steps on the Activity Details page of the Open Requests for
Resources portlet of the Dashboards page.
Configuring Activity Steps
Configure steps to show percent complete and to give a description of the step.
To configure steps:
1) Open one or more projects in the Projects section using one of the following methods:
Click Projects to open the last project or group of projects you were working
with.
Click the Projects menu and choose one of the most-recently used projects
or group of projects.
Click the Projects menu and choose Open Projects to select a project or
group of projects by portfolio type, EPS node, or project code.
2) On the Projects navigation bar, click Activities.
3) On the Activities page, select an activity and click the Steps detail window.
4) In the Steps detail window, repeat the following for each step you need to configure:
a. Select a step.
b. Add the columns you need to configure to the detail window if they are not
already available. See Showing and Hiding Columns in a Table (on page 239).
c. Select an option or enter a value for each field.
5) On the Activities page, click the Actions menu and select Save (Ctrl+S).
Tips
Select the Completed option if the step is finished.
You can also configure steps from the Activity Details page of the Open Requests for
Resources portlet of the Dashboards page.
About Step Templates
Step templates enable you to define a group of steps common to multiple activities, and
then assign the template to different activities. By creating templates for groups of
activity steps that are relevant in many projects, an organization can streamline data
entry and ensure that work is identified consistently throughout the organization.

Implementing the Schedule
175
Adding Activity Steps from a Step Template
Add steps from a step template to add a group of predefined steps to an activity.
To add steps from a step template to an activity:
1) Open one or more projects in the Projects section using one of the following methods:
Click Projects to open the last project or group of projects you were working
with.
Click the Projects menu and choose one of the most-recently used projects
or group of projects.
Click the Projects menu and choose Open Projects to select a project or
group of projects by portfolio type, EPS node, or project code.
2) On the Projects navigation bar, click Activities.
3) On the Activities page, select an activity and click the Steps detail window.
4) In the Steps detail window, click Add from Template (Ctrl+Alt+S).
5) In the Select Activity Step Template dialog box, assign templates and click Close.
6) On the Activities page, click the Actions menu and select Save (Ctrl+S).
Tips
Step templates are created on the Enterprise Data or Enterprise Project Data page.
About Trace Logic
Trace logic provides a graphical display of dependency relationships for an activity. You
can step forward or backward through a sequence of activities to focus on predecessor
and successor relationships.This alternative viewing format enables you to examine a
path of relationships while still viewing the entire project.
Trace logic provides visual cues to help you read the diagram. The selected activity is
highlighted in blue. Activity boxes with a red border represent critical activities. Activity
boxes to the left of the selected activity are predecessors. Activity boxes to the right are
successors. Solid lines represent driving relationships, while dashed lines represent
non-driving relationships.
You can manage activity relationships using the detail windows or Gantt chart on the
Activities page. When multiple projects are open, you can even add relationships
between activities in different projects. You can view activity relationships in the Trace
Logic detail window on the Activities page. You can use Trace Logic to determine why
an activity is scheduled at a particular time. It also helps answer questions such as:
Were any of an activity's predecessors delayed?
Do any predecessors or successors have an obsolete constraint?
Are two activities that should be linked start to start currently linked finish to start?
Why is there negative float?

P6 EPPM User's Guide
176
Viewing Relationships with Trace Logic
Use trace logic to follow activity relationships throughout a project.
To view relationships with trace logic:
1) Open one or more projects in the Projects section using one of the following methods:
Click Projects to open the last project or group of projects you were working
with.
Click the Projects menu and choose one of the most-recently used projects
or group of projects.
Click the Projects menu and choose Open Projects to select a project or
group of projects by portfolio type, EPS node, or project code.
2) On the Projects navigation bar, click Activities.
3) On the Activities page, select an activity and click the Trace Logic detail window.
4) In the Trace Logic detail window:
a. The selected activity is shown with its predecessor and successor activities.
b. Click another activity in the detail window to see its connections to predecessor
and successor activities.
c. Click Pan and click and drag the detail window contents.
d. Click Trace Logic Options (Ctrl+Y) to configure the number of predecessor and
successor levels shown.
Tips
Click the top edge of the Trace Logic detail window and drag upward to make the
window larger.
About Budget Change Logs
A Budget Change Log helps you keep track of budget alterations as they occur. The
Current Budget field (original budget plus approved budget changes) and Proposed
Budget field (original budget plus approved and pending budget amounts) incorporate
changes so you have up-to-date and accurate budget information for each EPS node
or project.
The Budget Change Log enables you to track modifications that affect the budget; this
log also provides a clear indication of the who, what, when, where, and how behind the
change.

Implementing the Schedule
177
Change amounts are not incorporated in the current budget until these amounts have
an Approved status. Only authorized project participants can issue budget changes and
mark them as approved. You can post a change amount as Pending; the program
manager of the affected EPS node, or the project manager of the affected project, must
then mark the amount as Approved or Not Approved. The module recalculates the new
budgeted amount and adjusts the current budget based on approved changes to the
log:
Proposed Budget equals Original Budget plus Approved Budget Changes plus
Pending Budget Changes
Current Budget equals Original Budget plus Approved Budget Changes
Creating Budget Change Requests
Create budget change requests when seeking approval to change an EPS or WBS
budget.
To create budget change requests:
1) Click Projects.
2) On the Projects navigation bar, click EPS.
3) On the EPS page, select an EPS or project and click the Budget Log detail window.
Note: You can also create budget change requests for WBSs or
projects from the Budget Log detail window of the Activities page.
4) In the Budget Log detail window:
a. Click Add (Insert) to add a budget log line item.
b. Enter a value in the Amount and Responsible fields.
c. Select Pending from the Status list.
5) On the EPS page, click the Actions menu and select Save (Ctrl+S).
Tips
The person listed in Responsible will move the request to Approved or Not Approved.
The program manager of the affected EPS node or the project manager or the
affected project will enter a reason for approval or denial in the Reason field.
Approving/Denying Budget Change Requests
If you have the authority, you can approve or deny a budget change request.
To approve or deny a budget change request:
1) Click Projects.
2) On the Projects navigation bar, click EPS.

P6 EPPM User's Guide
178
3) On the EPS page, select the EPS or project with a budget change request and click
the Budget Log detail window.
4) In the Budget Log detail window:
a. Select and review the budget change request.
b. Select Approved or Not Approved from the Status list.
c. Enter reasoning for the new status in the Reason field.
5) On the EPS page, click the Actions menu and select Save (Ctrl+S).
Tips
To update the original budget, enter the amount in the Original Budget field and
press enter. The Current Budget and Proposed Budget are updated with the new
value.
Only authorized project participants can issue budget changes and mark them as
Approved.
You can also approve or deny budget change requests for WBSs or projects from the
Budget Log detail window of the Activities page.
About Earned Value
Earned Value Project Management, or EVPM, is the best practice concerned with early
comparisons between baseline or planned project data and actual or earned project
data to arrive at an accurate assessment of true schedule and cost performance. The
basic concepts are rooted in early Twentieth Century industrial engineering and factory
productivity techniques.
You have probably already practiced at least a basic form of this technique. If you have
ever verified that the work performed was actually accomplished prior to paying a
contractor's invoice, you were utilizing a simple form of Earned Value. Whenever you
measure the physical work performed against a baseline project plan, you are
employing basic principles of EVPM. When you need a reliable way to predict the true
cost performance of a project including its final costs, scheduling, and resource
requirements, you will use Earned Value calculations.
Spanning industries and decades, Earned Value is also known by any of the following
titles:
Planned Value of Work Accomplished (PVWA)
Budgeted Cost of Work Performed (BCWP)
Cost/Schedule Control Systems Criteria (C/SCSC)
PERT/Costs
Earned Value Management (EVM)
Performance Measurement

Implementing the Schedule
179
Example: Executive management wants to assess a critical project early in its schedule.
The project has a planned value of 10 million dollars for 10 WBS units of equal value and is
expected to last 1 year. At the end of 3 months, its actual costs are 3 million dollars,
however, it has only completed 20% of the work, namely 2 units or 2 million dollars of
earned value. This project is behind its baseline schedule by 1 million dollars. It is
performing at 67%. The project will require a 50% increase in funding or 5 million dollars to
complete the work. This is calculated based on its 10 million dollar budget divided by .67
to yield 15 million. If the project is required to return to its original time schedule, it will
require additional resources and/or overtime.
Configuring WBS Earned Value
Configure earned value to define the techniques and settings used for earned value
computations.
To configure WBS earned value:
1) Open one or more projects in the Projects section using one of the following methods:
Click Projects to open the last project or group of projects you were working
with.
Click the Projects menu and choose one of the most-recently used projects
or group of projects.
Click the Projects menu and choose Open Projects to select a project or
group of projects by portfolio type, EPS node, or project code.
2) On the Projects navigation bar, click Activities.
3) On the Activities page, select a WBS and click the Earned Value detail window.
4) In the Earned Value detail window:
a. Select one option for each technique section.
b. If your selections enable fields, selectors, or options, select an option or enter a
value for each field.
5) On the Activities page, click the Actions menu and select Save (Ctrl+S).
About Milestones
A milestone represents any significant event, goal, or gate in a project. Although P6
considers them a type of activity, milestones have zero duration; at any given moment
they are either achieved or not. Some examples of milestones in an office building
addition project might include the following:
project definition complete
structure complete
end bidding process.
P6 EPPM User's Guide
180
Milestones can also be assigned at the WBS-level, and each one given a weight which
indicates its importance to the project schedule. When you mark a milestone as
complete, the weight is used to calculate the performance percent complete of all
activities included in the WBS level.
During project planning, you will want to identify the major milestones as they will help
you monitor the project's progress.
Creating WBS Milestones
Create WBS milestones to specify goals for a project.
To create WBS milestones:
1) Open one or more projects in the Projects section using one of the following methods:
Click Projects to open the last project or group of projects you were working
with.
Click the Projects menu and choose one of the most-recently used projects
or group of projects.
Click the Projects menu and choose Open Projects to select a project or
group of projects by portfolio type, EPS node, or project code.
2) On the Projects navigation bar, click Activities.
3) On the Activities page, select a project or WBS and click the WBS Milestones detail
window.
4) In the WBS Milestones detail window, repeat the following steps for each milestone
you want to add:
a. Click Add (Insert) to add a WBS milestone line item.
b. Enter a value in each field.
c. Select or clear the Completed option.
5) On the Activities page, click the Actions menu and select Save (Ctrl+S).
Tips
The Percent Complete field within the the WBS Milestones detail window indicates the
percentage of tasks completed toward achieving the milestone.
Use the Move Up and Move Down arrows to arrange the milestones.
The weight you apply to a milestone is used to calculate the earned value of the
percent of activities completed in achieving the milestone.
About Cost Accounts
Cost accounts enable you to monitor project expenses, activity costs, and earned value
throughout the project life cycle. Costs are attached to activities and resources so you
can track the amount of work accomplished against the amount of money spent. You
can assign default or created cost accounts to any project.

Implementing the Schedule
181
Cost accounts are established in a hierarchy. For example, if you created a cost
account for a project component such as hardware, you would create other cost
accounts beneath this component to show its parts such as coding and installation.
Creating Cost Accounts
Create cost accounts to track activity cost and earned value throughout the project life
cycle. You can associate predefined cost accounts with expenses to categorize them.
To create cost accounts:
1) Click the Projects menu and select Enterprise Project Data, or click the
Administer menu and select Enterprise Data.
2) In the Enterprise Data pane, expand Activities and click Cost Accounts.
3) On the Cost Accounts page:
a. Click Add (Insert).
b. Move the cost account to the correct location in the list and hierarchical position
by clicking the Move Up (Ctrl+Alt+Up), Move Down (Ctrl+Alt+Down),
Move Left (Ctrl+Alt+Left), and Move Right (Ctrl+Alt+Right) arrows.
c. In the ID field, double-click and type a unique ID.
d. In the Name field, double-click and type a name.
e. In the Description field, double-click and click .
4) In the Description detail window, type a brief narrative about the cost account.
5) On the Cost Accounts page, click Save (Ctrl+S) .
About Expenses
Expenses are non-resource costs associated with a project and assigned to a project’s
activities. An expense is typically a one-time expenditure for non-reusable items.
Expenses are project-specific and not time-based. Some examples include facilities,
travel, consulting, and training. Each expense has an actual, remaining, and at
completion value for both cost and units that is either budgeted or planned.
Expense categories classify and standardize expenses, and organize and maintain your
expense information.
Creating Expense Categories
Create an expense category to organize and track various expense types within an
organization.
To create expense categories:
1) Click the Projects menu and select Enterprise Project Data, or click the
Administer menu and select Enterprise Data.
2) In the Enterprise Data pane, expand Activities and click Expense Categories.

P6 EPPM User's Guide
182
3) On the Expense Categories page:
a. Click Add (Insert).
b. In the Category field, double-click and type a name.
c. Click Save (Ctrl+S).
Tips
To change an expense category, double-click it, then type a new name. The change
applies to all projects to which the expense item is assigned.

183
In This Chapter
About Baselines ....................................................................................................... 183
About Critical Path Activities ................................................................................. 186
About Schedule Preview ....................................................................................... 188
About Resource Leveling ....................................................................................... 189
About The Apply Actuals Feature ........................................................................ 192
About Updating Progress ....................................................................................... 195
About the Auto Compute Actuals Feature ........................................................ 196
About Store Period Performance ......................................................................... 198
About the Summarizer Service .............................................................................. 199
Issues ......................................................................................................................... 201
Risks ........................................................................................................................... 208
About Documents .................................................................................................. 225
About Workflows ..................................................................................................... 226
About Baselines
A baseline is a copy, or snapshot, of project data at a given time. Because a baseline is a
static representation of a project plan, it can be used as a benchmark against which to
measure performance as a project progresses.
You can create multiple baselines to establish metrics throughout the project life cycle.
Typically, you would want to create an initial baseline once the project plan is approved,
then you would create additional baselines according to your organization's
requirements. For example, you could create new baselines at specific reporting
intervals.
Although many baselines can be created for a project, only two baselines can be used
at any given time to display and compare data. These are known as the Project Baseline
and User's Primary Baseline. The current project can also be used as the baseline, for
example, in situations where no other baseline yet exists.
The Project Baseline is a single metric for comparison that enables all members of a team
to have a shared and consistent set of data against which to evaluate project progress.
There is only one Project Baseline at any time. All pages that display summarized data
compare and display data against the Project Baseline.
The User's Primary Baseline is an optional personal baseline that is used to evaluate
project progress.
Managing the Schedule

P6 EPPM User's Guide
184
Working with Baselines
Before you update a schedule for the first time, you should create a baseline plan. The
simplest baseline plan is a complete copy, or snapshot, of the original schedule. This
snapshot provides a target against which you can track a project's cost, schedule, and
performance. You can save a copy of the current project to use as the baseline or you
can convert another project in the EPS hierarchy to a baseline for the current project.
To help categorize, or track, multiple baselines for a single project, you can assign each
baseline a type that reflects its purpose, for example, initial planning baseline, What-if
project baseline, customer sign-off, or midproject baseline.
Regardless of the number of baselines you store for a project, at any given time you can
only select at most two baselines for use in making comparisons in P6. The project-level
baseline is used for project/activity usage spreadsheets and profiles, as well as for
earned value calculations.
You can convert another project in the EPS hierarchy to a baseline for use in comparisons
with the current project. Before converting a project to a baseline, if you still want to
have access to the original project, you should make a copy of it. Once you convert a
project to a baseline, it is no longer available in the project hierarchy. You can restore a
baseline, making it available again as a separate project in the project hierarchy, in
order to modify it or update it.
Note: You must have the Edit Project Details Except
Costs/Financials and Assign Project Baseline project privileges to
set the project baseline.

Managing the Schedule
185
Table of Working with Baseline Elements
Item Description
Define Baselines: Use Define Baselines to add, modify, convert, and
restore projects and baselines.
Add Baselines: When you add a baseline, give it a name, assign it a type,
and decide if you want to make it the Project Baseline or User's Primary
Baseline for the currently selected project. Baseline designations are
made in the projects rows of the table highlighted in blue.
Convert a Project to Baseline: Save a copy of the baseline before you
convert it. Convert a project to use it as a baseline for a current project.
Restore a Baseline: Use restore a baseline to modify a baseline project.
You must first unlink a baseline from its current project by restoring it as a
separate project. You can then work with this restored baseline project as
you would any other project in the EPS.
Baseline Type: Assign baseline types to baselines to help categorize
multiple baselines for a single project. Configure the available baseline
types along with your other Enterprise Data settings.
Project Baseline: Lists the available baselines for the selected project.
Select the baseline to use as the project baseline. If a baseline does not
exist, the current project is the default value.
User's Primary Baseline: Select the user's primary baseline from the list of
available baselines. If a baseline does not exist, the current project is the
default value.
Note: You can define up to three baselines for a project in P6
Professional.
Creating Baselines
Create baselines to measure project performance.
To create a baseline:
1) Open the project or projects for which you want to create a baseline using one of the
following methods:
Click Projects to open the last project or group of projects you were working
with.
Click the Projects menu and select one of the most-recently used projects
or group of projects.
P6 EPPM User's Guide
186
Click the Projects menu and select Open Projects to select a project or
group of projects by portfolio type, EPS node, or project code.
2) On the Project Navigation bar, click Activities or EPS.
3) On the Activities or EPS page, click the Actions menu and select Define
Baselines....
4) In the Baselines dialog box:
a. Select the project to which you will add the baseline.
b. Click Add Baseline.
c. Enter a name in the Baseline Name field.
d. Select a type from the Baseline Type list.
e. Click Save (Ctrl+S).
Tips
The application automatically assigns the baseline a name based on the selected
project. For example, if you select Project A, the application will name the newly
created baseline A - B1.
Specify the default Project Baseline and User's Primary Baseline by selecting from the
list of available baselines for each project in the table on the Baselines dialog box.
Click Convert a Project to Baseline and select a project to convert a project into a
baseline.
Select a baseline and click Restore a Baseline to remove the baseline and make it a
project.
About Critical Path Activities
Critical path activities are project tasks that must start and finish on time to ensure that a
project ends on schedule. A delay in any critical path activity will delay completion of
the project, unless the project plan can be adjusted so that successor tasks finish more
quickly than planned. Critical activities can be one of two types: float and longest path.
Float is a measure of schedule flexibility. The application uses the Critical Path Method
(CPM) to generate a project schedule. This method calculates four dates for each
activity in the project plan: Early Start, Late Start, Early Finish, and Late Finish. If the Early
Start date and Late Start date for an activity are the same, the activity is said to have
zero float. Activities that have zero float must start on time to prevent the schedule from
slipping. When an imposed finish date creates a schedule that is shorter than the
duration calculated to complete the activities on the critical path, a project has
negative float. A project with negative float is behind schedule.
To meet the specific requirements of your project, you can specify the float tolerance
used to identify activities as critical. For example, in some situations you might want
critical activities to be those with zero or negative float. In other situations, activities with
float of three days or less might be identified as critical.

Managing the Schedule
187
Longest path defines the sequence of driving activities that determine the project end
date. Longest path calculation includes interproject relationships. Therefore, activities
designated as on the longest path might change depending on whether you schedule a
project alone or with its related projects. If a project has interproject relationships and
you schedule it alone, the interproject relationships are treated as scheduling constraints.
The longest path is broken when activities are no longer driven by relationships; that is,
when activity dates are driven by constraints or resource leveling.
Working with Critical Path Activities
Analyze the schedule using multiple critical float paths
When you schedule a project, you can choose to calculate multiple critical float paths
(sequences of activities) that affect the project schedule. By calculating multiple critical
float paths, you can determine the most critical path in the project schedule, along with
sub-critical paths that affect the completion of the most critical path.
While you can determine the critical path of activities based on total float or longest
path, these methods do not offer insight into sub-critical paths that might also affect the
project schedule. For example, if you choose to identify critical activities based on a
maximum total float threshold, P6 will identify all activities beyond the threshold as critical
even if the activities have no relationships or do not affect the project end date.
Likewise, if you choose to identify critical activities based on longest path, P6 will identify
the critical path of activities but will not identify sub-critical paths that affect the critical
path.
On the Advanced tab of the Scheduling Options dialog box, you can choose to
calculate a specific number of critical float paths based on total float or free float. You
can also choose the activity you want the float paths to end on. By choosing an activity,
you can calculate multiple float paths that affect the entire project schedule, a specific
part of the schedule, or a milestone in the schedule.
When you schedule the project, P6 identifies the most critical float path in the schedule
and assigns those activities a Float Path value of 1. Then, depending on the number of
paths you choose to calculate, P6 identifies other float paths (sub-critical float paths)
that affect the most critical float path and numbers the paths in ascending order
(beginning with 2) based on the criticality of the path.
After you schedule a project, you can display the Float Path and Float Path Order
columns in the table on the Activities page. Group by Float Path to view the activities in
each critical float path, then sort by Float Path Order to view the order in which the
activities were processed.

P6 EPPM User's Guide
188
Note: Calculating multiple critical float paths does not affect how
you define critical activities. When you schedule a project, you
must choose to define critical activities by a maximum float time or
by longest path on the General tab of the Scheduling Options
dialog box. When you run the scheduler, activities are flagged as
critical based on this setting. If you also choose to calculate
multiple critical float paths, the float paths are calculated after the
project has been scheduled. Critical activities that are not part of a
critical float path remain tagged as critical.
About Schedule Preview
After modifying activity, relationship, and assignment data, but before deciding to
formally schedule a project, use the optional Schedule Preview feature to estimate
schedule changes without actually committing them to the project. Schedule Preview
automatically recalculates the schedule for activities that have changed or were
affected by a change to a relationship, resource assignment, or another activity. You
can then decide to commit these changes to the schedule or, if the preview produces
unwanted results, discard them. If Schedule Preview is disabled, changes to activities are
not reflected in the schedule until you manually calculate the schedule again.
Enabling Schedule Preview
Enable Schedule Preview to have the application automatically calculate the schedule
for a project each time you add or delete an activity relationship, change an activity
duration or relationship type, or change anything that affects schedule dates. This
feature is available on the Activities page when you open a single project; it is disabled if
more than one project is open.
To enable Schedule Preview for a project:
1) Open the project you need to schedule using one of the following methods:
Click Projects to open the last project you were working with.
Click the Projects menu and select one of the most-recently used projects.
Click the Projects menu and select Open Projects to select a project by
portfolio type, EPS node, or project code.
2) On the Projects navigation bar, click Activities.
3) On the Activities page:
a. Click the Actions menu and select Run Schedule Preview to turn on
Schedule Preview mode.
b. Update one or more activities; the activities will automatically be rescheduled.
c. Click the Actions menu and select Save (Ctrl+S).
4) In the Schedule Project dialog box:

Managing the Schedule
189
a. To keep the changes and schedule the project, click Yes.
b. If you do not want to keep these changes or do not want to schedule the project,
click No.
Tips
The Schedule Preview icon is disabled if more than one project is open, or if you do
not have the Schedule Project privilege for the open project.
To turn Schedule Preview mode off, click the Actions menu and select Run
Schedule Preview again so it is not highlighted on the Run menu.
If filters are applied to your current view, the application will prompt you to remove
the filters before the project is scheduled. You might find it helpful to create an
unfiltered activity view that you can use when you want to enable the Schedule
Preview. See Creating Views (on page 135) for help. If the removal of filters from the
current view causes you to exceed your activity limit, you will receive a message and
the feature will not be turned on. You will then need to ask your administrator to
increase the activity limit to run this feature.
About Resource Leveling
Resource leveling is an automated process that can change the start date of activities.
Level resources in your project schedule to ensure that resource demand does not
exceed resource availability. Typically, you level during the forward pass through a
project. This determines the earliest dates to schedule an activity when sufficient
resources will be available to perform the task. If forward leveling delays the project's
early finish date, a backward pass might be necessary to recalculate late dates.
During resource leveling, the resource requirements of all scheduled activities are
compared to the maximum quantity available at the time of leveling, and an activity is
only scheduled to occur when its resource demands can be met. To accomplish this,
tasks can be delayed to resolve resource availability conflicts.
Leveling Resources
Level one or more projects whenever the required shared or critical resources have
limited supply or availability or to generally keep resource usage at a constant level. For
example, when a resource has been assigned to more than one activity during the same
time period, level the projects to eliminate potential resource over-allocation. In short,
resource leveling re-distributes work among other available resources.
To level resources:
1) Open one or more projects in the Projects section using one of the following methods:
Click Projects to open the last project or group of projects you were working
with.
Click the Projects menu and choose one of the most-recently used projects
or group of projects.

P6 EPPM User's Guide
190
Click the Projects menu and choose Open Projects to select a project or
group of projects by portfolio type, EPS node, or project code.
2) On the Projects navigation bar, click Activities.
3) On the Activities page, click the Actions menu and select Run Leveler...
(Shift+F9).
4) In the Level Resources dialog box:
a. Select the Options tab to configure resource leveling options and set optional
leveling priorities to specify which assignments are leveled first when a conflict
exists.
b. Select the Resources tab to specify which resources should be leveled.
c. (Optional) Click Save to save your settings and close the dialog box.
d. Click Level.
Tips
You can have the application level resources automatically. See Creating Schedule
Services in P6 Help.
These services are removed from the database based on the ASAP Cleanup Rate
your P6 administrator specifies on the Configurations tab in P6 Administrator
application. Once the time is met all ASAP jobs that have a status other than running
or delegated will be removed from the table automatically. Running and delegated
jobs will be removed if they are older than the cleanup rate or if they are older than
one day, whichever is greater.
Configuring Resource Leveling Options and Priorities
Level resources in your project schedules to ensure that resource demand does not
exceed resource availability. To handle scheduling conflicts that might occur during
leveling, you can add priorities that specify which project or activity is leveled first. Before
leveling, configure the options and priorities specified in the steps below.
To configure resource leveling options and priorities:
1) Click the Projects menu and select Open Projects.
2) On the Open Projects dialog box, open the projects for which you need to configure
resource leveling options and priorities.
3) On the Projects navigation bar, click EPS.
4) On the EPS page, click the View menu and select Columns.
5) In the Customize Columns dialog box, expand the General section in the Available
Columns list and double-click Project Leveling Priority to add it to the Selected
Columns list and click OK.
6) On the EPS page:
a. Enter a value in the Project Leveling Priority field for each project.

Managing the Schedule
191
Note: Enter a value from 1, the highest priority, to 100, the lowest.
The default is 10.
b. Click the Actions menu and select Save (Ctrl+S).
7) On the Projects navigation bar, click Activities.
8) On the Activities page, click the View menu and select Columns.
9) In the Customize Columns dialog box, expand the General section in the Available
Columns list and double-click Activity Leveling Priority to add it to the Selected
Columns list and click OK.
10) On the Activities page:
a. Enter a value in the Activity Leveling Priority field only for those activities that
require a specific change to their leveling priority. For example, a Normal activity
might become a Top priority.
b. Click the Actions menu and select Run Leveler... (Shift+F9).
11) In the Level Resources dialog box, click the Options tab.
12) On the Options tab:
a. Select the Consider assignments in other projects with priority equal or higher than
option and select a value from the list to include in the leveling process projects
that are not currently open, but that do fit the required priority level.
b. Select or clear the Preserve scheduled early and late dates option to determine if
the leveling process can alter activity dates or not.
If you select this option, configure the options it enables.
c. Select or clear the Recalculate assignment costs when leveling option to
determine if the application should automatically recalculate assignment costs if
they are affected by the leveling.
d. Select the Display leveling log upon completion option if you would like to see a
summary of activities delayed by leveling and exceptions made for critical
activities.
e. In the Leveling Priorities section, specify priorities that will be used to level the
activities. Add priorities in the order in which you want the application to consider
them. For each priority you add, repeat the following steps:
1. Click Add.
2. In the Field Name list, select Project Leveling Priority, Activity Leveling Priority, or
another field.
3. In the Sort Order list, select Ascending, Descending, or, for some fields,
Hierarchy.
13) In the Level Resources dialog box, click the Resources tab.
14) On the Resources tab, select an option and click Save.

P6 EPPM User's Guide
192
Note: If you select Selected Resources, add resources to the
Selected Resources list. See Customizing Selected Lists (on page
239).
Tips
You cannot edit the Project Leveling Priority of a project if you do not have the
appropriate security privileges or if the project is checked out or opened exclusively by
another user.
About The Apply Actuals Feature
After progress is recorded by approving timesheets, entering actual data, or setting the
Auto Compute Actuals option, you can run the Apply Actuals feature to update the
schedule. The Apply Actuals feature runs as a service and schedules activities with
progress and/or activities that have the Auto Compute Actuals option set.
When you run Apply Actuals, you can move the data date. P6 schedules activities only
within the specified time period (between the current data date and new data date)
and calculates progress for those activities that are set to automatically calculate
actuals.
Working with the Apply Actuals Feature
Before you run the Apply Actuals command, decide which method you will use to
update progress, Auto Compute Actuals or P6 Progress Reporter (timesheets). If using the
Auto Compute Actuals method, ensure project managers have marked the Auto
Compute Actuals option for select activities, resources, and expenses. If using timesheets,
make sure all project resources have recorded their timesheets in P6 Progress Reporter
and those timesheets have been approved.
When you run the Apply Actuals command, both methods are invoked to determine the
actuals that are applied to a given project:
1. Auto Compute Actuals method: Actual values and dates are progressed for the
activities (and their resources and expenses) that are scheduled to occur
between the last data date and the new one. This method acts on activities,
resources, and expenses that have their Auto Compute Actuals option selected.
2. Timesheets method: Actual timesheet hours from P6 Progress Reporter are applied.
This method acts on resource assignments for resources with the Uses timesheets
option set. In P6 Progress Reporter you also have the option of updating the
following, depending on what fields are being updated:
a. Actual units
b. Actual and Remaining Units

Managing the Schedule
193
c. Actual and Percent Complete
Table of Key Elements When Applying Actuals
Item Description
Uses Timesheets option: Select this option to indicate you want to allow
this resource to enter hours using timesheets provided by P6 Progress
Reporter. When applying actuals to the schedule, actual duration units
(e.g., hours) for all the selected resource's assignments will be updated
based on timesheet data.
Auto Compute Actuals option: Select this option to indicate you want
actual hours to be updated for resources (shown in this example),
activities, and/or expenses when project actuals are applied.
Auto Compute Actuals option: Select this option to indicate you want
actual hours to be updated for activities (shown in this example),
resources, and/or expenses when project actuals are applied.
Apply Actuals icon: Click this toolbar icon or select it from the Actions
menu to open the Apply Actuals dialog box.

P6 EPPM User's Guide
194
Item Description
Apply Actuals dialog box: From the list of open projects, select the ones
you want actuals to be applied to. You can also apply a new data date.
Right-click and select Fill Down to apply the new date to multiple
projects. Select a method for calculating the remaining durations in the
Remaining Duration Calculation field.
Example (Labor Resource): Sarah enters her hours for the most recent timesheet period in
P6 Progress Reporter. She then submits her timesheet for review and approval. Once
approved, the timesheet hours are ready to be applied to the project. Paul, the project
manager, runs the Apply Actuals command. P6 looks for all approved timesheets that fall
within the timesheet period and that are less than or equal to the New Data Date value
Paul entered on the Apply Actuals dialog box. Only Sarah's approved actuals that fall
within the timesheet period will get posted. If she enters actuals in timesheets for 5 weeks
but the timesheet period is set for every 2 weeks, the entries that were entered for the 5th
week will not get posted until the next timesheet period. Her approved actual hours will
be applied to the Actual Units field for the appropriate Labor or Non-Labor assignment
which will then trigger the Remaining Units, Actual Duration and Percent Complete fields
to be recalculated.
Example (Non-Labor Resource): A special pump is listed as a non-labor resource for a
project. Since non-labor resources cannot enter actual hours per day in a timesheet, a
designated user defined as a resource enters a lump sum amount of hours used for the
non-labor resource per timesheet period in the Prior Actuals field. When the Apply
Actuals command runs against the project, P6 determines if a value appears in this field,
and if it does, it applies this value (with a special calculation for AIA ERP integrations) to
the Actual Units field.
Applying Actuals to a Project
Apply actuals to update progress on the currently selected projects as of the specified
data date.
To apply actuals:
1) Open one or more projects in the Projects section using one of the following methods:
Click Projects to open the last project or group of projects you were working
with.
Click the Projects menu and choose one of the most-recently used projects
or group of projects.
Click the Projects menu and choose Open Projects to select a project or
group of projects by portfolio type, EPS node, or project code.
2) On the Projects navigation bar, click Activities.
3) On the Activities page, click the Actions menu and select Run Apply Actuals.
Managing the Schedule
195
4) In the Apply Actuals dialog box:
a. Select the projects to which you want to apply actuals.
b. Select a date from the New Data Date calendar.
c. Select an option from the Remaining Duration Calculation list.
d. Click Apply.
Tips
You can have the application apply actuals automatically. See Creating Schedule
Services in P6 Help.
These services are removed from the database based on the ASAP Cleanup Rate
your P6 administrator specifies on the Configurations tab in P6 Administrator
application. Once the time is met all ASAP jobs that have a status other than running
or delegated will be removed from the table automatically. Running and delegated
jobs will be removed if they are older than the cleanup rate or if they are older than
one day, whichever is greater.
About Updating Progress
To determine how a project is performing and what remains to be done, update its
progress weekly, daily, or as frequently as required. Updating your projects is a two-step
process. First, you record the work progress. Then, you update the project data to reflect
the reported progress; also known as applying actuals.
You can record work progress in a number of ways: you can record progress for
individual activities or resources by entering status data you have collected; you can use
P6 Progress Reporter and collect actual data from resources using timesheets; or you can
automatically calculate progress based on the schedule plan.
Working with Updating Progress
To determine how a project is performing and what remains to be done, update its
progress. Updating a project to reflect the actual work performed to date can be
achieved using any of the following methods:
Manually record progress: Record progress for individual activities or resources by
entering status data from each contributor. Then, run the Apply Actuals feature.
Automatically calculate progress: For individual activities, resources, and expenses,
use the convenient Auto-Compute Actuals feature to estimate work progress based
on the schedule plan. Then, run the Apply Actuals feature. Using these features, the
application calculates and applies the expected progress from the previous data
date to the new data date you specify.
After you update work progress, run the Apply Actuals feature to update actual and
remaining values as of a specified data date. To regularly update a project so that it
reflects current actual and remaining values, run the Apply Actuals process using the
Scheduled Services page.

P6 EPPM User's Guide
196
About Suspending and Resuming Activities
When updating progress for a project, you might need to record that the work on a
particular activity has been suspended or resumed after a period of inactivity. For
example, an activity might be suspended or resumed due to a plant shutdown. To
record this, you must enter suspend and resume dates. The suspend date is the date on
which an activity's progress has, or is planned to be, stopped. The resume date is the
date progress on an activity begins again. When you indicate a suspend or resume date,
work for the activity is considered to be suspended or resumed at the beginning of the
specified day.
About the Auto Compute Actuals Feature
Instead of manually recording actual progress or collecting data from P6 Progress
Reporter users, you can automatically calculate expected progress based on the
schedule plan. This technique, which uses an option called auto-compute actuals, is a
quick and convenient way to update your project.
Working with the Auto-Compute Actuals Feature
You can use the auto compute actuals option to automatically calculate expected
progress based on the schedule plan. The auto compute actuals feature is available for
individual activities, resources, or expenses. Because the auto-compute actuals option is
available for these individual elements, you can choose to selectively perform automatic
progress calculations as needed for your project.
Activities
If you select to compute actuals automatically for an activity, the application calculates
the actual dates, percent complete, remaining duration, and actual and remaining units
for all assigned resources and for the activity expenses.
Caution: If you are collecting timesheet data for an activity, you
should not choose the auto-compute actuals option. If you
auto-compute actuals for an activity, when you update the
project, actual and remaining units/costs are automatically
updated for all of the activity's assigned resources. If assigned
resources have existing actuals that they reported for the activity
through P6 Progress Reporter, their reported data is overwritten by
the auto-compute calculations.
If you want to automatically update progress for some, but not all, of an activity's
resource assignments, clear the Auto Compute Actuals option for the activity and select
the option for the specific resources you want to update automatically.

Managing the Schedule
197
Resources
If you select to compute actuals automatically for a resource, the application calculates
the actual and remaining units for all of the resource's assignments.
Note: To turn on the Auto Compute Actuals option for individual
resources, you must have access to the features available through
the Resources section of P6 and have access to the specific
resources through Resource Security privileges.
Expenses
If you select to compute actuals automatically for an expense, the application will
automatically calculate the estimated expenditure for an expense, based on the
schedule plan.
Applying Auto Compute Actuals to Activities
Apply auto compute actuals to activities and P6 will calculate the actual dates, percent
complete, remaining duration, and actual and remaining units for assigned resources
and activity expenses.
To apply auto compute actuals:
1) Open one or more projects in the Projects section using one of the following methods:
Click Projects to open the last project or group of projects you were working
with.
Click the Projects menu and choose one of the most-recently used projects
or group of projects.
Click the Projects menu and choose Open Projects to select a project or
group of projects by portfolio type, EPS node, or project code.
2) On the Projects navigation bar, click Activities.
3) On the Activities page:
1. Click the Activity View list and select an activity view.
2. Click the View menu and select Customize View....
4) In the Customize Activity View dialog box, click the Columns tab.
5) On the Columns tab, expand General in the Available Columns list and double-click
Auto Compute Actuals to add it to the Selected Columns list.
6) In the Customize Activity View dialog box, click OK.
7) On the Activities page:
a. Select the Auto Compute Actuals option for one or more activities.

P6 EPPM User's Guide
198
Caution: If you are collecting timesheet data for an activity, you
should not select the auto compute actuals option. If you auto
compute actuals for an activity, when you update the project,
actual and remaining units/costs are automatically updated for all
of the activity's assigned resources. If assigned resources have
existing actuals that they reported for the activity through P6
Progress Reporter, their reported data is overwritten by the auto
compute calculations.
b. Click the Actions menu and select Save (Ctrl+S).
About Store Period Performance
Using the Store Period Performance feature, you can track actual to date units and
costs. Storing period performance records actuals for the selected financial period along
with earned value and planned value, so you can track previous periods and compare
current and future trends. Users can store period performance for any predefined period
in the Financial Period dictionary.
Storing Period Performance
Use the Store Period Performance feature, to track actual units and costs to date. This
feature allows you to track previous periods and compare current and future trends.
To store period performance:
1) Open one or more projects in the Projects section using one of the following methods:
Click Projects to open the last project or group of projects you were working
with.
Click the Projects menu and choose one of the most-recently used projects
or group of projects.
Click the Projects menu and choose Open Projects to select a project or
group of projects by portfolio type, EPS node, or project code.
2) On the Projects navigation bar, click Activities.
3) On the Activities page, click the Actions menu and select Run Store Period
Performance.
4) In the Store Period Performance dialog box, select projects for which you want to
store performance and click Store.
Tips
To select or clear all projects, select or clear the option at the top of the options
column.

Managing the Schedule
199
These services are removed from the database based on the ASAP Cleanup Rate
your P6 administrator specifies on the Configurations tab in P6 Administrator
application. Once the time is met all ASAP jobs that have a status other than running
or delegated will be removed from the table automatically. Running and delegated
jobs will be removed if they are older than the cleanup rate or if they are older than
one day, whichever is greater.
About the Summarizer Service
Many features in P6 and P6 Professional use summary enterprise or project data
calculations spanning multiple records and therefore rely on the creation of
up-to-the-minute summarized data. When you think of summary data, think of math
sums: totals and subtotals. You already have all the project data, you just want it added
up and presented to you so you can easily evaluate it.
To ensure that enterprise records are current, you need to summarize projects.
Summarization performs the series of calculations that update records with any new
information that has been entered since the last update. Summary data tables
temporarily store and share the data.
The summarizer is responsible for generating the following data:
Project and WBS-level summary data including subtotals for each month, week, and
financial period
Resource and role summary data including subtotals for each WBS, month, week,
and financial period
Enterprise-level summary data including project and resource subtotals for each EPS
element
Summarizer services update project records for the selected projects.
Example: You want to see resource assignments spanning multiple resources and break
out the subtotals by project and WBS. By summarizing the selected projects, the
database performs the calculations necessary to display subtotals for all cost and unit
fields by resource, by project, by WBS, and by time period.
Working with the Summarizer Service
You can summarize data at any time or you can use the Scheduled Services page to
schedule a time when data are regularly summarized. For example, set the application
to summarize every Monday at 8:00 a.m. In each case, project data are summarized
according to the settings you specify and the new summary values are saved to the
project database, overwriting any previously calculated summary data. If you run the
summarizer from the Scheduled Services page, you can select to summarize an EPS
rather than individual projects. Otherwise, an EPS node uses the sum of all the project
records beneath it.

P6 EPPM User's Guide
200
Resources
Resource-related features in P6 that use summary data rely on the creation of enterprise
(EPS) resource records. Each record is the sum of all assignments for a resource. When
you summarize a project, the application creates resource records for that project. Each
time the service runs, the records are updated.
Summarizing Projects
Summarize projects to maintain up-to-date project data.
To summarize projects:
1) Open one or more projects in the Projects section using one of the following methods:
Click Projects to open the last project or group of projects you were working
with.
Click the Projects menu and choose one of the most-recently used projects
or group of projects.
Click the Projects menu and choose Open Projects to select a project or
group of projects by portfolio type, EPS node, or project code.
2) On the Projects navigation bar, click EPS.
3) On the EPS page:
a. Select a project or EPS node.
b. Click the Actions menu and select Summarize Projects.
Tips
When you summarize projects from the Activities page, the application will
summarize any of the currently open projects. When you summarize from the EPS
page, only the selected projects will be summarized.
You can have the application summarize projects automatically. See Creating
Schedule Services in P6 Help.
These services are removed from the database based on the ASAP Cleanup Rate
your P6 administrator specifies on the Configurations tab in P6 Administrator
application. Once the time is met all ASAP jobs that have a status other than running
or delegated will be removed from the table automatically. Running and delegated
jobs will be removed if they are older than the cleanup rate or if they are older than
one day, whichever is greater.
You can also summarize projects from the Actions menu of the Activities page.

Managing the Schedule
201
Issues
About Issues
Issues are perceived problems within a schedule that require attention or corrective
action. When you create them in the Activities section, you can associate them with a
single project or workgroup and assign them to a responsible manager in the OBS for
follow-up based on priority. You can also associate issues with a single activity. When
adding new issues to a project or workgroup, you can control the information you
capture for each new issue. You can choose to receive e-mail notifications when new
issues of a certain priority are added, when existing issues are modified, or when issues
are assigned a specific issue code.
You can also think of issues as impediments, action items, open items, punch lists, logs, or
concerns. Over time, if you do not resolve or close open issues or issues placed on hold,
they can become risks.
Issue codes enable you to organize and categorize issues in a way that is meaningful to
you. For example, you can create an issue code titled Severity, and subsequently create
issue code values: High, Medium, and Low. You can assign each of these code values to
issues across multiple projects, enabling you to categorize each issue according to how
severe it is. Similarly, you can create codes to categorize issues by responsibility,
subproject, or any other classification you require to organize issues. Assigning issue
codes enables you to quickly search for and view issues according to specific criteria.
Working with Issues
Issues are known problems within an activity, project, or workgroup that require attention
or corrective action.
Viewing issues
You can view issues from several areas within the application:
From a dashboard, you can access the My Issues portlet to view issues you are
associated with in the context of the filter criteria selected for the dashboard.
From the Workspace page, you can access the Project Issues portlet to view issues
associated with the project selected in the Select Project list.
From the Workgroup Workspace page, you can access the Issues portlet to view
issues associated with the workgroups to which you belong.
From the Issues page, you can access issues for any open project. On the Issues
page, you can view all of the issues for all open projects at one time.
From the Activities or EPS page, you can access the Issues detail window to view
issues associated with an activity, WBS, or project.

P6 EPPM User's Guide
202
In each of these areas, depending on your security privileges, you can customize the
issue display. For example, you can choose to view issues in either a list or chart format.
You can also configure group, sort, and filter options to focus on issues that are most
important to you. Additionally, you can add, revise, or delete issues from each of these
areas. When adding new issues to a project or workgroup, the issue forms feature
enables you to control the information you capture for each new issue. If you add issues
from a detail window, the issue is added as a line item and does not require the selection
of an issue form.
Note: Issues cannot be used with template projects.
Organizing and managing issues
To help organize and manage issues for your project or workgroup, additional issue
management features are available, depending on your security privileges.
To organize issues, you can assign enterprise-level issue codes, which enable you to
categorize issues in a way that is meaningful to you.
The features for organizing and managing issues are accessible via the Enterprise Data
option on the Administer menu. Use the issues options in the Enterprise Data pane to add,
edit, and delete issue codes and issue user-defined fields. These options appear only if
you have the required privileges.
Creating Project Issues
Create project issues to identify problems within a schedule that must be addressed
before the project can be completed.
To create issues:
1) Open one or more projects in the Projects section using one of the following methods:
Click Projects to open the last project or group of projects you were working
with.
Click the Projects menu and choose one of the most-recently used projects
or group of projects.
Click the Projects menu and choose Open Projects to select a project or
group of projects by portfolio type, EPS node, or project code.
2) On the Projects navigation bar, click Issues.
3) On the Issues page, expand a project and click Add an Issue.
4) In the Select an Issue Form dialog box, select a form to act as the foundation of the
issue and click OK.
5) On the Add Issue page, configure the issue fields and lists and click Save.
Tips
You cannot add an issue to a project that is checked out or locked. You also cannot
create issues for template projects.

Managing the Schedule
203
If no issue forms are assigned to the project, the Default Form is the only form you can
choose. The Default Form displays all issue fields.
You can also create project issues from the Project Issues portlet of the Workspace
page, the Issues detail window of the Activities or EPS page, or the My Issues portlet
of the Dashboards page.
If you are adding an issue from the My Issues portlet, you can choose any issue form
assigned to any project that falls within the filter criteria specified for a dashboard.
Issue forms are organized by project.
Configuring Project Issues
Configure project issues to update issues that have been identified for a project.
To configure project issues:
1) Open one or more projects in the Projects section using one of the following methods:
Click Projects to open the last project or group of projects you were working
with.
Click the Projects menu and choose one of the most-recently used projects
or group of projects.
Click the Projects menu and choose Open Projects to select a project or
group of projects by portfolio type, EPS node, or project code.
2) On the Projects navigation bar, click Issues.
3) On the Issues page, expand a project and click an issue.
4) On the Details of page configure the following sections as necessary:
a. In the General section, configure the fields and lists.
b. Expand the Description section, and enter a description in the text field.
c. Expand the Issue Codes section and assign issue codes. See Assigning Issue
Codes (on page 206).
d. Expand the Related Items section and assign related documents or issues. See
Assigning Related Items to Issues (on page 204).
Tips
You can also configure workgroup issues from the Issues portlet of the Workgroup
Workspace page.
You can also configure issues from the Project Issues portlet of the Workspace page
or the My Issues portlet of the Dashboards page.
Customizing Project Issues
Customize project issues to define how columns, filters, groups, and charts are displayed
in the user interface.
To customize project issues:
1) Open one or more projects in the Projects section using one of the following methods:

P6 EPPM User's Guide
204
Click Projects to open the last project or group of projects you were working
with.
Click the Projects menu and choose one of the most-recently used projects
or group of projects.
Click the Projects menu and choose Open Projects to select a project or
group of projects by portfolio type, EPS node, or project code.
2) On the Projects navigation bar, click Issues.
3) On the Issues page, click Customize.
4) In the Customize Project Issues dialog box:
a. Click the Columns tab and configure the Selected Columns and Sort lists. See
Configuring Columns or Values (on page 239).
b. Click the Filter tab and select to show all available issues or define a filter.
c. Click the Group tab and configure the grouping lists and options.
d. Click the Chart tab and configure the chart format.
e. Click Save.
Tips
Select the All Issues option on the Filter tab if you do not want to apply a filter. To
construct a filter, select Custom Filter and configure the fields and lists to create one
or more filter statements.
You can also customize project issues from the Project Issues portlet of the Workspace
page, the Issues portlet of the Workgroup Workspace page, or the My Issues portlet
of the Dashboards page.
Assigning Related Items to Issues
You can assign related documents and issues to an issue.
To assign related items to an issue:
1) Open one or more projects in the Projects section using one of the following methods:
Click Projects to open the last project or group of projects you were working
with.
Click the Projects menu and choose one of the most-recently used projects
or group of projects.
Click the Projects menu and choose Open Projects to select a project or
group of projects by portfolio type, EPS node, or project code.
2) On the Projects navigation bar, click Issues.
3) On the Issues page, expand a project and select an issue.
4) On the Details of page, expand the Related Items section.
5) In the Related Items section:

Managing the Schedule
205
To relate documents, click Relate Documents and select documents from the
dialog box.
To related issues, click Relate Issues and select issues from the dialog box.
Tips
To remove a document or issue, select the option next to the name of the item and
click Remove.
The instructions in this topic assume that the content repository is configured.
The Related Documents dialog box will only display documents of the selected
project.
You can also assign items to issues from the Project Issues portlet of the Workspace
page. You can assign items to workgroup issues from the Issues portlet of the
Workgroup Workspace page.
Sending E-Mail about Issues
You can send e-mails about project and workgroup issues that include basic information,
such as project, issue name, priority and due date.
To send issue e-mails:
1) Open one or more projects in the Projects section using one of the following methods:
Click Projects to open the last project or group of projects you were working
with.
Click the Projects menu and choose one of the most-recently used projects
or group of projects.
Click the Projects menu and choose Open Projects to select a project or
group of projects by portfolio type, EPS node, or project code.
2) On the Projects navigation bar, click Issues.
3) On the Issues page, expand a project and click E-Mail for one of the issues.
4) In the E-mail dialog box:
a. Edit the recipient list, message, and subject as needed.
b. Click Send E-mail.
Tips
You must have an e-mail address listed in you user profile to send an e-mail.
The e-mail message is pre-filled with the addresses of the project manager and
responsible manager. The subject area is pre-filled with basic information, such as
project, issue name, priority and due date.
You can also send issue e-mails from the Issues portlet of the Workgroup Workspace
page, the Project Issues portlet of the Workspace page, or the My Issues portlet on
the Dashboards page.

P6 EPPM User's Guide
206
About Issue Codes
Issue codes enable you to organize and categorize issues in a way that is meaningful to
you. For example, you can create an issue code titled Severity, and subsequently create
issue code values: High, Medium, and Low. You can assign each of these code values to
issues across multiple projects, enabling you to categorize each issue according to how
severe it is. Similarly, you can create codes to categorize issues by responsibility,
subproject, or any other classification you require to organize issues. Assigning issue
codes enables you to quickly search for and view issues according to specific criteria.
Assigning Issue Codes
You can assign issue codes to organize and categorize issues in a way that is meaningful
to you.
To assign an issue code:
1) Open one or more projects in the Projects section using one of the following methods:
Click Projects to open the last project or group of projects you were working
with.
Click the Projects menu and choose one of the most-recently used projects
or group of projects.
Click the Projects menu and choose Open Projects to select a project or
group of projects by portfolio type, EPS node, or project code.
2) On the Projects navigation bar, click Issues.
3) On the Issues page, expand a project and select an issue.
4) On the Details of page, expand the Issue Codes section and click Assign Issue Codes.
5) In the Select Issue Codes detail window, select a code and click Assign.
Tips
You can only assign one issue code at a time. Click Assign Issue Codes again to
assign another code.
You can also assign issue codes from the Project Issues portlet on the Workspace
page or the My Issues portlet on the Dashboards page.
About Issue Forms
An issue form is a template, or framework, that you can use to create new issues. Issue
forms specify the information required for adding a new issue to the project. You can
create issue forms to capture issue information specific to a department in your
organization, or for any other specific purpose.

Managing the Schedule
207
Creating Issue Forms
Create an issue form to capture all the attributes your organization wants to track when
users add issues to a project. Each form helps maintain consistency when future issues
are identified. Project members must select an issue form to serve as a template when
they want to create a new issue.
To create an issue form:
1) Click Projects.
2) On the Projects navigation bar, click Issues.
3) On the Issues page, click Issue Forms.
4) In the Issue Forms pane, click Modify and then click Add Form.
5) In the Select a Form to Copy dialog box, select an existing form or the default form to
copy as the basis for your new form. Click OK.
6) On the Issue Forms page:
a. Enter a name in the Form Name field.
b. Select or clear the Display options to determine which attributes appear when
users add new issues based on this form.
c. To associate issues with codes, expand the Issue Codes section, click Assign Issue
Codes, and select issue codes from the dialog box.
d. To associate issues with UDFs, expand the User Defined Fields section, click Assign
User Defined Fields, and select user-defined fields from the dialog box.
7) For all the attributes you assigned or marked with the Display check box:
a. Set their Default Value fields, if available. Select a value from the list, enter a value
in the field, or click and select a value from the dialog box.
b. Select the Required check box for each attribute you want to designate as
mandatory. Users must provide data for these fields when adding new issues
based on this form.
8) On the Issue Forms page, click the Access tab.
9) On the Access tab, click Assign Projects.
10) In the Select a Project dialog box, select a project in which you want to make this
form available for users adding new issues. Click Assign. Repeat this step for all
projects in which this issue form should be available. Click Close.
11) Click Save.
Tips
To modify a form, navigate to the Issue Form Details page and select a form in the
Issue Forms pane.
To delete an issue code, user-defined field, or project assignment, click Delete in
the item's row. To delete an entire issue form, select the form first in the Issue Forms
pane. Then, in that same pane, click Modify, and then click Delete.

P6 EPPM User's Guide
208
Assigning Projects to Issue Forms
You can specify the issue forms you want to make available for use in a project. When
you assign a project to an issue form, it becomes available for project members to use
when they add a new issue to a project or workgroup within the project.
To assign projects to issue forms:
1) Open one or more projects in the Projects section using one of the following methods:
Click Projects to open the last project or group of projects you were working
with.
Click the Projects menu and choose one of the most-recently used projects
or group of projects.
Click the Projects menu and choose Open Projects to select a project or
group of projects by portfolio type, EPS node, or project code.
2) On the Projects navigation bar, click Issues.
3) On the Issues page, click Issue Forms.
4) On the Issue Forms page, click the Access tab.
5) On the Access tab, expand the Projects section and click Assign Projects.
6) In the Select a Project dialog box, assign projects to the issue form and click Close.
7) On the Access tab, click Save.
Tips
You can assign multiple projects to issue forms.
Your access to pages, tabs, and menu items is controlled by the settings defined in
your assigned user interface view. Depending on your view settings, you might be
able to change your view preferences to show or hide items according to your
needs.
Risks
About Risks
Risks are any uncertain events or conditions that, if they occur, have a positive or
negative effect on project objectives. Risks are also known as threats, warnings,
imperatives, escalation notices, or jeopardies. Positive risks are often classified as
opportunities which, if they occur, are realized as rewards. Thorough documentation and
analysis of risks over multiple projects offer lessons, and potentially cost and time savings,
for all future projects.
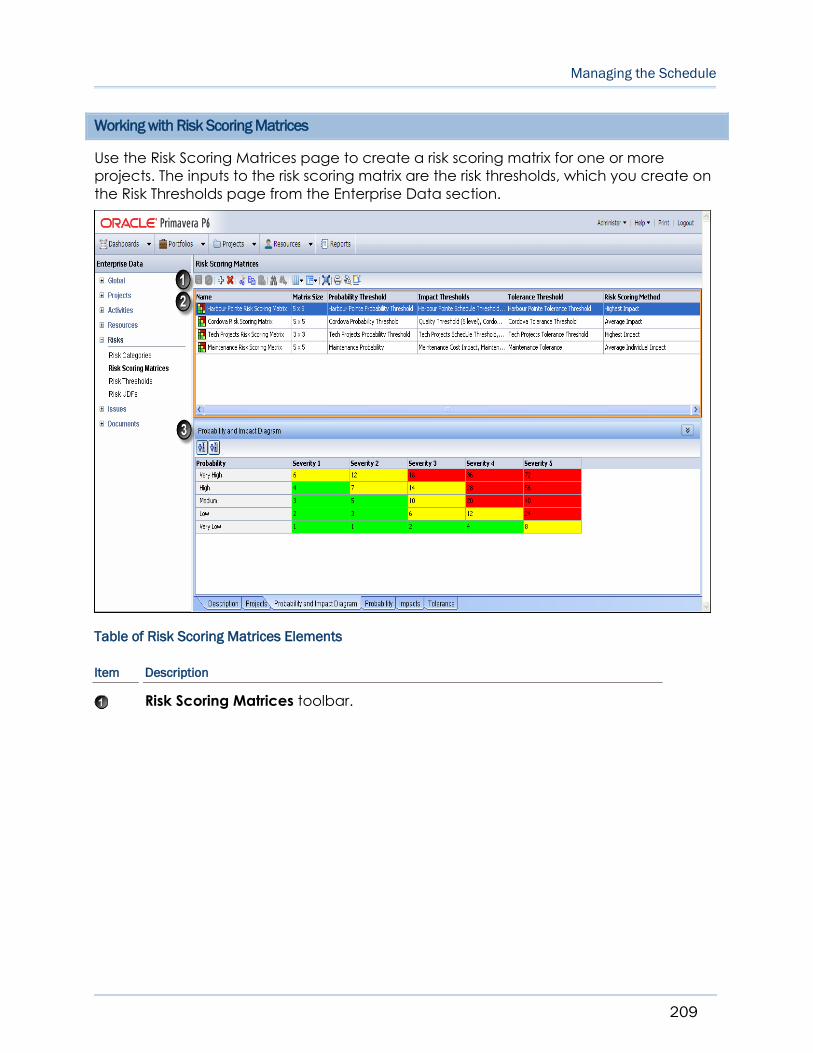
Managing the Schedule
209
Working with Risk Scoring Matrices
Use the Risk Scoring Matrices page to create a risk scoring matrix for one or more
projects. The inputs to the risk scoring matrix are the risk thresholds, which you create on
the Risk Thresholds page from the Enterprise Data section.
Table of Risk Scoring Matrices Elements
Item Description
Risk Scoring Matrices toolbar.

P6 EPPM User's Guide
210
Item Description
Risk Scoring Matrices work area: This work area contains all the risk
scoring matrices defined for your company. The number of risk scoring
matrices you create is determined by risk analysis practices incorporated
in your business. You might have one corporate-wide risk scoring matrix
that is used for all projects, or you might have a need for separate
matrices which are used depending on different factors, such as project
size. For example, a project that is a new development might require
different cost impact and schedule impact threshold values than a
project for a new feature development on an existing product.
There might also be situations where a project is a joint-venture or is
performed by a contractor and the prime owner's matrix must be used.
However, for any project, only one matrix is assigned.
In the work area above, you can see this company has a need for
multiple risk scoring matrices, including a separate risk scoring matrix for
the Harbour Pointe Assisted Living construction project.
When creating a risk scoring matrix, you choose a matrix size based on
the number of levels assigned to your probability and impact thresholds
defined on the Risk Thresholds page. Using the Harbour Pointe Risk
Scoring Matrix as an example, the risk scoring matrix is 5 x 5. The first 5
represents the number of levels assigned to the probability threshold and
the second 5 represents the number of levels assigned to the cost and
schedule impact thresholds.
Next you choose the risk scoring method to use for risk score calculations.

Managing the Schedule
211
Item Description
Risk Scoring Matrices detail windows:
Description: The area used to describe the risk scoring matrix.
Projects: The area where you assign the matrix to one or more projects.
Note that only one matrix can be assigned to a single project. If a matrix
is not assigned to a project, risks can still be entered in the risk register on
the Projects Risks page; however, the probability, cost impact, and
schedule impact threshold fields are disabled, and you cannot use the
qualitative analysis features of the application. At any time you can
create a matrix and assign it to an existing project.
Probability and Impact Diagram (PID): The PID is a graphical
representation of the selections made in the Risk Scoring Matrices work
area. The number of rows and columns is determined by the matrix size.
The rows are the probability levels and the columns are the impact levels.
The code and name fields for the impact threshold levels are
customizable when creating a threshold; therefore, the column labels for
the impacts are "Severity n." The number of severity columns reflects the
number of levels assigned to the impact thresholds.
The color coding indicates the tolerance threshold assigned to the risk
scoring matrix. These same tolerance colors are also visible in the Score
and Score (Text) fields on the risk register on the Projects Risks page when
risk values are entered.
Probability: The details of the probability threshold assigned to the matrix
needed to perform a qualitative assessment on project risks. This detail
window is read-only. To change anything related to the threshold,
navigate to the Risk Thresholds page.
Impacts: The details for the impact thresholds assigned to the matrix. A
cost and schedule impact must be defined for the matrix to perform a
qualitative assessment on project risks. An unlimited number of
user-defined impact thresholds can be assigned to the matrix. From this
detail window you can add or delete impacts to the matrix; however,
you cannot modify the threshold values. To change anything related to
the threshold, navigate to the Risk Thresholds page.
Tolerance: The details for the tolerance threshold assigned to the matrix.
This detail window is read-only. To change anything related to the
threshold, navigate to the Risk Thresholds page.

P6 EPPM User's Guide
212
Configuring Risk Enterprise Data
You can configure enterprise data to include risk categories and risk UDFs, and to define
the criteria for performing qualitative risk analysis using a risk scoring matrix.
To define the criteria for performing qualitative risk analysis, perform the following tasks:
1) Creating Risk Thresholds (on page 212)
2) Creating Risk Scoring Matrices (on page 213)
3) Assigning a Risk Scoring Matrix to a Project (on page 214)
To configure risk categories or risk UDFs, see:
Creating Risk Categories (on page 215)
Creating Risk UDFs (on page 99)
Creating Risk Thresholds
You create risk thresholds, which you then use as inputs when creating a risk scoring
matrix. When creating risk thresholds, you must define the probability threshold, cost
impact threshold, schedule impact threshold, and tolerance threshold. You can also
define as many user-defined impacts as necessary.
To create risk thresholds:
1) Click the Projects menu and select Enterprise Project Data, or click the
Administer menu and select Enterprise Data.
2) Risks and click Risk Thresholds.
3) Repeat the following for each threshold you want to create:
a. On the Risk Thresholds page:
1. Click Add (Insert).
2. In the Name field, double-click and type a threshold name.
3. In the Type field, double-click and select a type of risk from the list.
4. In the Levels field, double-click and select a level number from the list.
b. In the Levels detail window, a default value is assigned for the Code, Name, and
Range values. You can use the default values provided, or double-click any field
to customize that field.
You can define a color for each threshold level to visually represent the values
when working the risk register on the Project Risks page. However, you should
define colors for the tolerance threshold. The colors for the tolerance threshold are
used to color the Score field on the risk register on the Projects Risks page. This
enables you to easily identify where in the risk scoring matrix this risk falls in terms of
severity.
4) On the Risk Thresholds page, click Save (Ctrl+S).

Managing the Schedule
213
Modifying Risk Thresholds
If you are going to change the type or level of a threshold that is currently assigned to a
scoring matrix, you must first remove the threshold from the risk scoring matrix and assign
a new threshold.
To delete a threshold from a risk scoring matrix:
1) Click the Projects menu and select Enterprise Project Data, or click the
Administer menu and select Enterprise Data.
2) In the Enterprise Data pane, expand Risks and click Risk Scoring Matrices.
3) Repeat the following for each risk scoring matrix that includes the threshold you are
modifying.
a. On the Risk Scoring Matrices page:
1. Locate the risk scoring matrix that includes the threshold you are modifying.
2. Double-click in the appropriate threshold field.
b. In the Select Threshold dialog box, choose a different threshold and click Assign,
and then click Close.
4) On the Risk Scoring Matrices page, click Save (Ctrl+S).
To modify a risk threshold:
1) Click the Administer menu and select Enterprise Data.
2) In the Enterprise Data pane, expand Risks and click Risk Thresholds.
3) On the Risk Thresholds page:
a. Locate the threshold you are modifying.
b. Double-click in the field you are modifying and update the value.
Note: If you are modifying the number of levels assigned to a
threshold, all data for existing levels are overwritten and replaced
with the default values for that level.
c. Click Save (Ctrl+S).
Creating Risk Scoring Matrices
Create a risk scoring matrix to perform qualitative analysis on project risks. Project risk is
assessed based on the thresholds defined in the risk scoring matrix.
Before creating a risk scoring matrix, you need to first define risk thresholds.
To create a risk scoring matrix:
1) Click the Projects menu and select Enterprise Project Data, or click the
Administer menu and select Enterprise Data.
2) In the Enterprise Data pane, expand Risks and choose Risk Scoring Matrices.
3) On the Risk Scoring Matrices page:
a. Click Add (Insert).

P6 EPPM User's Guide
214
b. In the Name field, click and type a unique name.
c. In the Matrix Size field, double-click and click .
4) In the Select Matrix Size dialog box:
a. Choose a threshold level for the Probability and Impact fields.
Note: You must have already defined thresholds with the number
of levels you are assigning to the matrix (see Creating Risk
Thresholds (on page 212)). If you do not have a threshold with the
same number of levels, you will be able to select the matrix size, but
you will not be able to add a threshold.
b. Click OK.
5) On the Risk Scoring Matrices page, double-click in the Probability Threshold field and
click .
6) In the Select Probability Threshold dialog box, choose a probability and click OK.
7) On the Risk Scoring Matrices page, double-click in the Impact Thresholds field and
click .
8) In the Select Impact Thresholds dialog box:
a. Select a Cost Impact and click Assign.
b. Select a Schedule Impact and click Assign.
c. Select any additional impacts and click Assign.
d. Click Close.
9) On the Risk Scoring Matrices page, double-click in the Tolerance Threshold field and
click .
10) In the Select Tolerance Threshold dialog box, choose a tolerance and click OK.
11) On the Risk Scoring Matrices page, double-click in the Risk Scoring Method field and
select a risk scoring method from the list.
12) In the Description detail window, type a description of the risk scoring matrix.
13) On the Risk Scoring Matrices page, click Save (Ctrl+S).
Assigning a Risk Scoring Matrix to a Project
You need to assign a scoring matrix to a project before it can be used to prioritize risks.
Once you assign a scoring matrix to a project, it is available for use from the risk register
on the Projects Risks page.
You can assign a risk scoring matrix to a project from different areas in the application,
depending on the tasks you are working on at the time.
When setting up a project, see Assigning a Risk Scoring Matrix to a Project from the
EPS Page in P6 Help.
When defining a risk scoring matrix and applying the matrix to multiple projects, see
Assigning a Risk Scoring Matrix to a Project from the Enterprise Data Pane in P6 Help.

Managing the Schedule
215
When managing a portfolio, see Assigning a Risk Scoring Matrix to a Project from the
Portfolios Section in P6 Help.
Creating Risk Categories
Create a risk category to categorize and organize project risks.
To create a risk category:
1) Click the Projects menu and select Enterprise Project Data, or click the
Administer menu and select Enterprise Data.
2) In the Enterprise Data pane, expand Risks and click Risk Categories.
3) On the Risk Categories page:
a. Click Add (Insert).
b. In the Category field, double-click and type a unique name.
c. Click Save (Ctrl+S).
Tips
To display the Category field on the Projects Risks page, click Select Columns on the Risks
toolbar and select Category.
Creating Risk UDFs
Create risk user-defined fields (UDFs) to store additional project risk data on the Projects
Risks page that is pertinent to your project or business and is not available from the
default fields. For example, you might need to include a location field to identify where
the risk might occur, or a ranking field to determine the order in which the risks will be
handled.
User-defined fields can be of many types: text, start date, finish date, cost, number,
integer, or indicator. Data from UDFs is not used in scoring calculations.
To create a risk UDF:
1) Click the Projects menu and select Enterprise Project Data, or click the
Administer menu and select Enterprise Data.
2) In the Enterprise Data pane, expand Risks and click Risk UDFs.
3) On the Risk UDFs page:
a. Click Add (Insert).
b. In the User Defined Field, double-click and type a name.
c. In the Data Type field, double-click and choose a data type from the list.
d. Click Save (Ctrl+S).

P6 EPPM User's Guide
216
Working with Project Risks
The risk register on the Risks page is the main area of the application where you identify
and manage risks for a project. Additionally, you can add risks to a project from the
Projects EPS page, and add risks to a project and assign the risks to activities from the
Activities page.
Once you add a risk to the risk register, you can perform further analysis on the risk and
create one or more risk response plans which include activities to reduce the negative
impact of the risk. See About Risk Response Plans (on page 221).
Table of Project Risks Elements
Item Description
Risks toolbar.

Managing the Schedule
217
Item Description
Risks work area: Risks for all the projects you have open display in the risk
register. You can group by field name, such as project name to view all
risks organized by project, or create a filter to view only the risks that
interest you.
When adding a risk to the risk register, you supply a name for the risk,
identify the risk as a threat or an opportunity, identify the current status of
the risk, identify the owner of the risk, and then assign the values for
probability, schedule, cost, and any other applicable user-defined
impacts. The values for probability, schedule, cost, and additional
user-defined impacts are used to calculate the risk score.
Note: If the Probability, Cost, and Schedule fields
are disabled, a risk scorning matrix has not been
assigned to the project. You can still use the risk
register to track your risks; however, you cannot use
the qualitative risk analysis features in the
application until you create a risk scoring matrix
and assign it to the project.
Risks detail windows:
Response Plans: The area where you add response plans and response
plan action items. See Working with Risk Response Plans (on page 222).
Activities: The area where you associate scheduled activities in your
project to an identified risk. Refer to the example above to see a list of
the project activities impacted by risk R001: Concrete supply
constrained.
Description: The area used to provide a detailed explanation of the risk.
Cause: The area used to explain why this risk is occurring.
Effect: The area used to describe the impact this risk has on this project.
Notes: The area used to capture any additional information regarding
the risk.
Probability and Impact Diagram: The Probability and Impact Diagram
(PID) is a graphical representation of the probability and impact
thresholds assigned to the risk scoring matrix associated with the project.

P6 EPPM User's Guide
218
Managing Project Risks
You can perform qualitative analysis on your project risks. Using the tasks listed below, you
can identify a risk for your project and assign probability and impact values to this risk to
calculate a risk score. Additionally, you can assign activities to the risk and create a risk
response plan, which can include actions to mitigate the risk.
1) Creating Project Risks (on page 218)
2) Assigning an Activity to a Risk (on page 172)
3) Developing a Risk Response Plan (on page 223)
Creating Project Risks
Add project risks to capture potential threats or opportunities that might impact your
project.
For convenience, you can add risks to projects from different areas in the application,
depending on the tasks you are performing at the time.
You can capture risks in the Projects section from the Risks, Activities, or EPS page.
Adding Detailed Project-Level Risks - The Risks page is the risk register where all risk
data for the projects you are working on is stored. You can customize the page using
filters or grouping to view a specific list of project risks. From this page, you can assign
probability and impact values to obtain a risk score, and create risk response plans
that include response plan action items to reduce or eliminate the negative impact
of the risk. If you previously added risks to a project from the Activities page or the EPS
page, you can use this page to add more detailed information about the risk and
perform qualitative analysis.
Adding Risks to Activities - Use the Activities page when you are working in the
detailed activity level to quickly add a risk or assign an existing risk to activity. When
you plan to perform a more detailed analysis on your project risks, use the Risks page.
Adding High-Level Project Risks - Use the EPS page when you are working at the
project level to quickly add a risk to a project. You can enter basic risk information
from this page, including ID, Name, Owner, Category, Type, and Status. When you
plan to enter more detailed information about the risk and perform an analysis on
your project risks, use the Risks page.
Adding Detailed Project-Level Risks
Add project risks to capture potential threats or opportunities that might impact your
project, and to perform qualitative analysis to reduce or eliminate negative impact on
the project.
Note: If a risk scoring matrix is not assigned to the project, you can
add general risk information to the Risks page, but you will not be
able to enter values for probability, schedule and cost, which are
values used to generate the risk score. See Assigning a Risk Scoring
Matrix to a Project (on page 214).

Managing the Schedule
219
To add detailed project-level risks:
1) Click Projects.
2) On the Projects navigation bar, click Risks.
3) On the Risks page, click Add a Risk (Insert).
4) If multiple projects are open, select a project from the Select Project dialog box and
click OK.
5) On the Risks page:
a. In the ID field, click and type an ID for the risk.
b. In the Name field, click and type the risk name.
c. In the Type field, double-click and select the type of risk from the list.
d. In the Status field, double-click and select the current status for the risk.
e. In the Owner field, double-click then click .
6) In the Select Owner dialog box, select an owner for the risk and click Assign.
7) On the Risks page:
a. In the Probability field, double-click and select a probability from the list.
b. In the Schedule field, double-click and select a schedule impact from the list.
c. In the Cost field, double-click and select a cost impact from the list.
d. Complete any addition fields on the table that are relevant for this risk, including
any user-defined fields.
Note: To display additional columns, click Select Columns and
select the column to add to the table.
8) You can provide more information using the Cause, Description, Effect, and Notes
detail windows.
9) On the Risks page, click Save (Ctrl+S).
Tip
Click the Probability and Impact Diagram detail window to view the risk scoring matrix
assigned to the project.
Adding Project Risks to Activities
Add project risk to activities to capture potential threats or opportunities that might
impact your project. Use this method if you want to quickly associate a risk to an activity.
You can add a new project risk to an activity, or assign an existing project risk to an
activity.
To add a new or assign an exisitng project risk to an activity:
1) Open one or more projects in the Projects section using one of the following methods:
Click Projects to open the last project or group of projects you were working
with.

P6 EPPM User's Guide
220
Click the Projects menu and choose one of the most-recently used projects
or group of projects.
Click the Projects menu and choose Open Projects to select a project or
group of projects by portfolio type, EPS node, or project code.
2) On the Projects navigation bar, click Activities.
3) On the Activities page, select an activity and click the Risks detail window.
4) To add a new risk to an activity, in the Risks detail window:
a. Click Add a Risk (Insert).
b. Enter a value in the ID field.
c. Enter a value in the Name field.
d. Select a type from the Type list.
e. Select a status from the Status list.
5) To assign an existing risk to the activity, in the Risks detail window:
a. Click Assign Risk.
b. In the Select Risk dialog box:
1. Click on a risk.
2. Click Assign.
3. Assign any additional risks, and then click Close.
6) On the Activities page, click the Actions menu and select Save (Ctrl+S).
Adding High-Level Project Risks
Add project risks to capture potential threats or opportunities that might impact your
project.
Use this method to quickly add a risk to a project. You can enter basic risk information
from this page, including ID, Name, Owner, Category, Type, and Status.
To add a high-level project risk:
1) Click Projects.
2) On the Projects navigation bar, click EPS.
3) On the EPS page, click on a project, and then click the Risks detail window.
4) On the Risks detail window:
a. Click Add a Risk (Insert).
b. In the ID field, double-click and type an ID for the risk.
c. In the Name field, double-click and type the risk name.
d. In the Type field, double-click and select the type of risk from the list.
e. In the Status field, double-click and select the current status for the risk.
f. In the Category field, double-click and select a category from the list, if
applicable.

Managing the Schedule
221
g. In the Owner field, double-click then click .
5) In the Select Resource dialog box, select an owner for the risk and click OK.
6) On the EPS page, click Save (Ctrl+S).
Assigning a Risk to an Activity
Assign a risk to an activity to explicitly identify the activity impacted by the risk.
You can assign a risk to an activity while you are adding project risks on the Risks page or
while managing your activities on the Activities page.
To assign a risk to an activity from the Risks page:
1) Click Projects.
2) On the Projects navigation bar, click Risks.
3) , click on a risk.
4) Click on the Activities detail window and click Assign Activities .
5) On the Select Activity dialog box:
a. Select an activity and click Assign.
b. Select any additional activities impacted by the risk and click Assign.
c. Click Close.
6) On the Risks page, click Save (Ctrl+S).
To assign a risk to an activity from the Activities page:
1) Click Projects.
2) On the Projects navigation bar, click Activities.
3) On the Activities page, select the activity you want to assign a risk.
4) On the Risks detail window, click Assign Risk.
5) On the Select Risk dialog box, select a risk and click OK.
6) On the Activities page, click Save (Ctrl+S).
About Risk Response Plans
Response planning allows you to identify and document methods you might use to
manage project risks. When you identify an area with a risk, create a risk response plan to
determine what actions could be taken to promote the most favorable outcome.

P6 EPPM User's Guide
222
Working with Risk Response Plans
The Response Plans detail window is the area in the risk register where you create plans
for handling the identified risks. Once you have identified which project risks need further
action, create a response plan and assign response plan action items for each risk to
reduce the negative impact on the project.
Table of Risk Response Plan Elements
Item Description
Response Plans toolbar.
Response Plan row: Create one or more response plans while you are in
the planning phase and indicate the response type. When you have
analyzed your response options, choose one response plan by selecting
the Active option next to the appropriate response plan.
In the example above, two response plans have been created for the
Concrete supply constrained risk. The first plan is to accept the risk and
take no action; the second plan is to reduce the impact of the risk by
contracting with alternative suppliers. You can see this second plan was
selected as the plan of choice.

Managing the Schedule
223
Item Description
Response Action Item rows: Each risk response plan can have multiple
response plan action items. Response action items are additional
activities you perform to reduce the impact of the risk.
For each response action item, assign the probability, schedule impact,
cost impact, and any additional user-defined impacts, which is based on
the outcome of the action item, to obtain a post-mitigated score.
In the example above, three activities are assigned to the risk plan. The
risk score will not significantly decrease until all three response items are
complete. By taking action on this risk and creating a response plan, we
can see that the impact of this risk can be significantly reduced.
Developing a Risk Response Plan
Once you have identified a risk for your project, you can then create a risk response plan
to help manage the project risk. A risk response plan includes a name for the plan and
response plan action items. You can create multiple risk response plans for a risk each
with multiple response action items. When you determine which plan will best meet the
project needs, you select the Active option next to the appropriate response plan. One
response plan must always be active.
To develop a risk response plan complete the following tasks:
1) Adding Risk Response Plans (on page 223)
2) Adding Risk Response Plan Action Items (on page 224)
3) Assigning Activities to Risk Response Plan Action Items (on page 225)
Adding Risk Response Plans
Add one or more response plans to a risk to plan alternative activities that might reduce
the probability of a risk occurring, or to reduce the impact of the risk.
1) Click Projects.
2) On the Projects navigation bar, click Risks.
3) On the Risks page, click on a risk, and then click the Response Plans detail window.
4) On the Response Plans detail window:
a. Click Add (Insert).
b. In the ID field, double-click and type a response plan ID.
c. In the Name field, double-click and type a name for the new response plan.
d. In the Response Type field, double-click and select a response type from the list.
5) On the Risks page, click Save (Ctrl+S).
Note: After you decide which response plan you are implementing,
select the Active option next to the appropriate response plan.

P6 EPPM User's Guide
224
Adding Risk Response Plan Action Items
Each risk response plan can include multiple response plan action items.
To add a risk response plan action item:
1) Click Projects.
2) On the Projects navigation bar, click Risks.
3) On the Risks page, click on a risk, and then click the Response Plans detail window.
4) Repeat the following for each response action you want to add to a risk response
plan:
a. On the Response Plans detail window:
1. Click on the response plan for which you are adding a response action and
click Add a Response Action.
2. In the ID field, double-click and type an ID for the response action item.
3. In the Name field, double-click and type a name for the response action item.
4. In the Owner field, double-click and click .
b. On the Select Owner dialog box, select a name and click OK.
c. On the Response Plans detail window:
1. In the Status field, double-click and select a status from the list.
2. In the Start Date field, double-click and select a start date from the calendar.
This is an optional field. If you assign an activity to the response action, the
activity date and total cost for the activity will override the values you just
entered.
3. In the Probability field, double-click and select a probability based on the
response action.
Note: If a risk scoring matrix is not assigned to your project, the
Probability, Schedule, and Cost fields are disabled.
4. In the Schedule field, double-click and select a schedule impact based on the
response action.
5. In the Cost field, double-click and select a cost impact based on the response
action.
6. If there are any user-defined impact fields, double-click in the field and select
an impact based on the response action.
5) On the Risks page, click Save (Ctrl+S).
Note: After you decide which response plan you are implementing,
select the Active option next to the appropriate response plan.
Managing the Schedule
225
Assigning Activities to Risk Response Plan Action Items
Existing activities can be assigned to a response plan action item to identify the activities
necessary to respond to the risk. If you need a new activity for the response action, first
create that activity, then assign it to a response plan action item.
The cost values for the assigned activity are used in the cost calculations for the response
plan, and the activity start and finish dates are displayed in the response plan.
To assign an activity to a risk response plan action item:
1) Click Projects.
2) On the Projects navigation bar, click Risks.
3) On the Risks page, click on a risk and then click the Response Plans detail window.
4) Repeat the following for each response plan action item:
a. On the Response Plans detail window:
1. Expand the appropriate risk response plan and click on the response plan
action item for which you are adding an activity.
2. In the Activity field, double-click and click .
b. On the Select Activity dialog box, click the activity and click Assign.
Note: If the Activity field is not displayed, click Select Columns
and click Activity.
5) On the Risks page, click Save (Ctrl+S).
About Documents
A document is a file or work product that you create and add to your Primavera work
environment. The application provides document management capabilities that enable
you to store, organize, manage, and access documents in a secure environment. The
available document management functionality depends on your configuration. When
the content repository is configured, the complete set of advanced document
management capabilities is available, including check in, check out, and document
reviews. When the content repository is not configured, a limited set of document
management features is available, such as adding, deleting, and relating items to
documents.
When a configured content repository is installed, P6 supports up to three general classes
of documents: project, private, and workgroup. Project documents are documents that
you relate to a project via P6. Only users with the necessary securities can edit project
documents. Private documents are documents that you add to P6 for your own use.
Private documents are not associated with any project and are available only to you.
Workgroup documents are documents that are added to a specific project workgroup.
These documents are available only to members of the workgroup.

P6 EPPM User's Guide
226
When the content repository is not configured for use with P6, you can perform limited
actions on project documents only, and private and workgroup documents are not
available.
Assigning Documents to Activities
You can assign relevant documents to activities, projects, and WBSs.
To assign documents:
1) Open one or more projects in the Projects section using one of the following methods:
Click Projects to open the last project or group of projects you were working
with.
Click the Projects menu and choose one of the most-recently used projects
or group of projects.
Click the Projects menu and choose Open Projects to select a project or
group of projects by portfolio type, EPS node, or project code.
2) On the Projects navigation bar, click Activities.
3) On the Activities page, select an activity and click the Documents detail window.
Note: To assign a document to a project or WBS, select a project or
WBS in place of an activity.
4) In the Documents detail window, click Assign (Insert).
5) In the Select Document dialog box, assign documents and click Close.
6) On the Activities page, click the Actions menu and select Save (Ctrl+S).
About Workflows
A workflow is an automated business process that routes information and tasks between
participants according to a defined set of procedures or rules designed to coordinate a
specific business goal. Workflows are primarily characterized by their level of procedural
automation involving one or more dynamic related series of processes, and their
combination of human and machine-based tasks involving interaction with software and
systems.
The following industry segments, marked by relatively high office labor costs and
transaction volume, have demonstrated successful workflow implementations:
insurance
banking
legal
general & administrative
design
engineering

Managing the Schedule
227
manufacturing
Business process modeling and workflow automation allow transactions to be
conducted electronically without the need for manual intervention such as conducting
certain validations or re-keying data. When workflow IT systems are processing repetitive,
mundane, and often error-prone work, talented staff resources become available to
handle activities that add real value to the enterprise.
P6 includes a sample project initiation and review workflow used to evaluate proposed
work. It automates the process of reviewing and approving new project requests. You
can also create your own workflows implemented through the use of templates typically
created by your P6 administrator using BPM. Each workflow template defines the data,
business processes, review phases, and approval requirements for the varying types of
workflows specific to your organization. The necessary security privileges must be in place
for you to create, initiate, or participate in workflows.
Working with Workflows
Use workflows to route business processes such as project initiation requests through your
organization to gather information and visibility before a go/no go decision is made.
Template data, routing designators, and approval rules can be set for each stage of a
workflow. To illustrate these options, pretend we have a workflow involving five key
approval managers. You can define the workflow such that all five must approve and in
what sequence, if any. A much more relaxed approval rule would require only one out of
the five to approve.
Workflows begin in BPM where your administrator defines the human tasks involved and
assigns them to specific users, a role, or a group. An actual business need kicks off a
separate instance of the workflow and its human tasks are automatically routed to their
users, roles, or groups.

P6 EPPM User's Guide
228
When a specific user or any user assigned to a role or group logs into P6, the Workflow
portlet on their dashboard will display their relevant tasks at this stage of the workflow, as
authenticated by BPM. As a workflow participant, you can select a task in the workflow
instance and claim ownership for it. This means you will be responsible for performing the
task. The application refreshes itself to show only the actions permitted for this particular
stage of the workflow for you (the currently logged in user).
Table 1 of 2: Key Workflow Screen Elements
Item Description
Setup and Configuration: After your administrator sets up BPM, configure
a dashboard to display the Workflows portlet.
Action Required Tab: This tab shows the tasks important to you (the
currently logged in user).
My Workflows Tab: This tab enables you to view all workflows according
to role and status filters you can set.
Initiate a Workflow: Click Initiate a Workflow to start a new instance of
a workflow based on a predesigned template.

Managing the Schedule
229
Table 2 of 2: Key Workflow Screen Elements
Item Description
Workflow Form: Most workflows include forms which enable you to
update the progress of each task. In general, possible actions you can
perform on a human task during the routing of a workflow include:
Escalate, Suspend, Purge, Delete, Withdraw, Submit, Reassign, Claim,
Approve, and Reject.
Note: For tasks with no associated form, this icon is disabled. To perform
an action on a workflow task with no associated form, log into BPM and
use its Actions menu. It is also possible to design a solution using the P6
Integration API.

P6 EPPM User's Guide
230
Item Description
Workflow Status: The Workflow Status image is accessible from either tab
in the Workflows portlet. It shows the sequence of events in the workflow.
Items shown with a green border indicate the furthest level of progress
within the workflow. The current status of the workflow corresponds with
the last item to "go green".
Sample Workflow: A basic workflow image with tasks for an engineer, a
second task for an assigned role, and a third task for a manager to
complete the workflow. The current workflow task is Third User Task
because it is the last item in the sequence that has a green outline.
Workflow History: View a chronological sequence of all the previous
activities, users, and stages in the current workflow.
Participating in Workflows
All workflow tasks requiring your participation are listed in the Action Required tab of the
Workflows portlet on a dashboard. For example, you might be asked to evaluate new
project initiatives as part of a new project evaluation workflow.
The process form that accompanies each workflow task is based on the workflow type
and stage, so the information displayed might vary each time you perform this task.
Note: The Workflows portlet requires installation of BPM. See your
administrator.
To review a workflow task:
1) Click Dashboards.
2) On the Dashboards page, select a dashboard.
3) On the dashboard, expand the Workflows portlet.
4) In the Workflows portlet, click the Action Required tab.
5) On the Action Required tab, select a task and click View Form.
6) On the BPM Workflow Form dialog box, select an action to perform. The title and
available screen elements of this form vary depending on the selected workflow task
and stage.
7) Click Submit.

231
P6 includes sophisticated layers of security, view, and customization features designed to
control access and structure the collaborative experience of your entire team while also
allowing users to individually customize views and format their data. Periodically perform
the sequence of steps below for each user to optimize their experience.
When customizing your user experience, consider the following questions. These checks
may be performed in whole or in part, and in any sequence. The order shown here is not
mandatory. These items simply provide a basic checklist when examining your
interaction with the application.
Do I have the right module access settings? This determines which main components
of the solution you can access, such as Portfolios, Reports, P6 Professional, and P6
Web Services.
Do I have the right user interface view? This determines which main pages in the
application you can access. Your administrator may assign you to an optional
role-specific user interface view that corresponds to your assignments and work
processes. A group of users with similar roles will often be assigned the same user
interface view. You can edit your own personal view settings on the My Preferences
page.
Do I have the right security profiles? This determines what functions you can perform.
Your administrator will likely assign you to a role-specific global security profile and
project security profile that corresponds to your assignments and work processes. A
group of users with similar roles will often be assigned the same security profile.
Do I have the right OBS (project) access settings? This determines which projects are
available to you based on your assigned responsible manager.
Do I have the right global preferences? This determines the general formatting and
preferred settings of data across the application. For example, you can specify the
currency and date format you want to use. Even though you can customize these
preferences, it is recommended that teams make choices aligned with team goals.
Do I have the right application settings? This determines how P6 information is handled
and appears for all users. For example, the default hours per time period, ID string
lengths, integration links, and other default settings.
Do I have the current page customized to fit my needs? There are two main ways to
customize a page, detailed below.
Customizable Page-Specific Views: Certain pages of the application provide a
standard mechanism for configuring shared views and customizing individual
views. These include Activity, EPS, Resource Assignment, and portfolio views in
portlets or on the Portfolio Analysis page. They provide common ways to view and
work with data on their respective pages of application. Instead of manually
adjusting the current page, you can simply switch the applied view.
Customizing the P6 User Experience

P6 EPPM User's Guide
232
On-Screen Controls: Manually invoke the customization features provided on
each page. Throughout the application, these features are available through
Customize links or other context-specific toolbars and options displayed on the
page. Examples of screen customization follow:
Generally speaking, within all pages, you can hide, show, expand and
collapse elements as needed.
The Activities page and Portfolio Capacity Planning page, for example,
offer extensive options that enable you to retrieve, organize, and chart data
according to your specific requirements.
In the Issues portlet, you can filter, group, and chart issues as well as choose
the data details to display.
You can customize dashboards to display the portlets you want and to
specify how you want to organize them within the workspace. The
dashboard filtering feature lets you focus on information related to a single
project or all projects associated with a specific portfolio or project code. If
you have the required privileges, you can customize the workspace and
workgroups associated with a project.
About the User Interface
The application's user interface consists of familiar screen controls such as pages, tabs,
and dialog boxes, data entry controls, buttons, and links appearing in a standard web
browser.
Note: Your access to data and ability to interact with the user
interface are controlled by various security features. See About
Security in P6 Help.
Working with the P6 User Interface
The user interface presents familiar screen elements you manipulate in your web browser.
They include all of the following common types of user interface objects and several
more special objects not listed:
pages
tabs
dialog boxes
detail windows
portlets
fields
lists
buttons
links
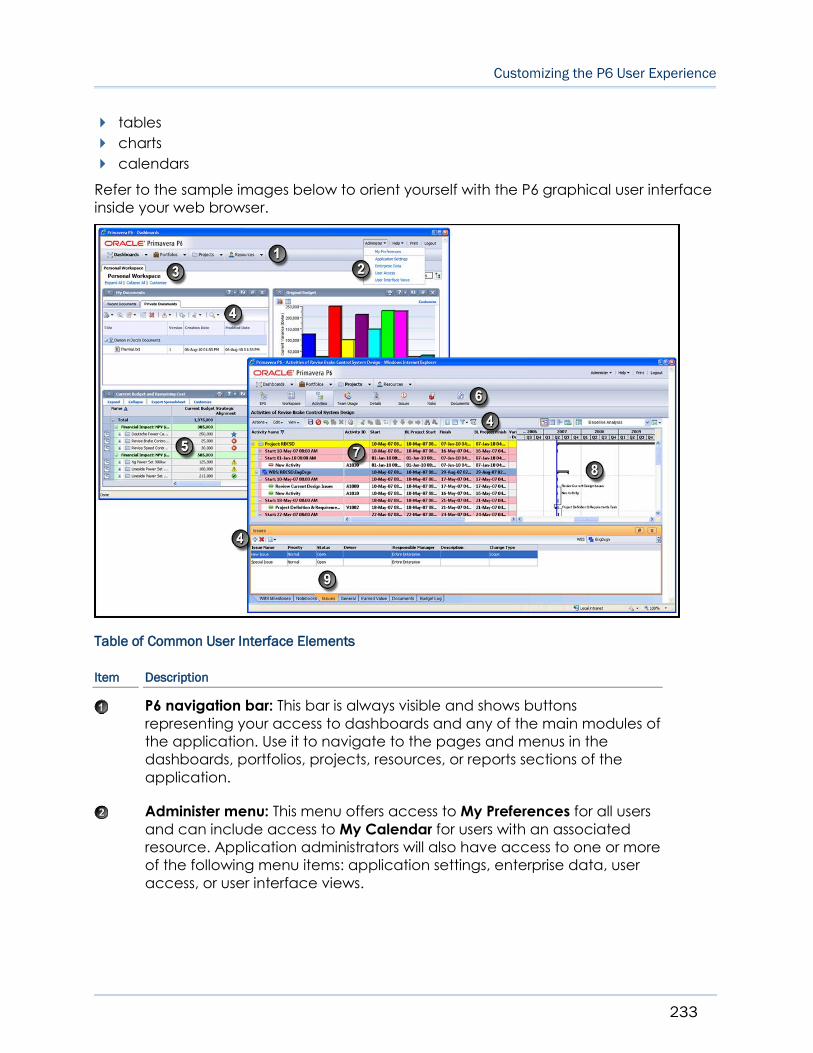
Customizing the P6 User Experience
233
tables
charts
calendars
Refer to the sample images below to orient yourself with the P6 graphical user interface
inside your web browser.
Table of Common User Interface Elements
Item Description
P6 navigation bar: This bar is always visible and shows buttons
representing your access to dashboards and any of the main modules of
the application. Use it to navigate to the pages and menus in the
dashboards, portfolios, projects, resources, or reports sections of the
application.
Administer menu: This menu offers access to My Preferences for all users
and can include access to My Calendar for users with an associated
resource. Application administrators will also have access to one or more
of the following menu items: application settings, enterprise data, user
access, or user interface views.

P6 EPPM User's Guide
234
Item Description
Personal Workspace dashboard: This default dashboard displays the
portlets you have selected that are important to your work goals. In this
example, notice the familiar hyperlinks including Customize which you
can click to configure the dashboard for use by you or multiple users.
Notice too that Personal Workspace is also the name for the tab you
would click to open this dashboard if more than one dashboard
appeared on this page.
Toolbars: From top to bottom, the Private Documents toolbar, the
Activities toolbar, and the Issues toolbar. There are hundreds of toolbars
throughout the application made up of over 400 icons. The Activities, EPS,
and Resource Assignments toolbars in the application also feature their
own Actions, Edit, and View menus.
Scorecard portfolio view portlet: In this example, the user has customized
this dashboard by adding a portfolio view of type scorecard within its
own portlet. The portlet also shows color-coded indicators in the Strategic
Alignment column of the scorecard and can be further customized to
suit work goals. The colors of a bar chart or histogram are also visible in
the Original Budget portfolio view portlet.
Projects navigation bar: This bar shows buttons representing pages
determined by your assigned user interface view and any custom
preferences you made. Similar bars can be found under the Portfolios,
Projects, and Resources sections.
Activity Table: One of the central work areas of the entire application,
this table allows you to customize its columns (fields), color-coded
grouping bands, and sort options, and of course apply filters.
Activity Gantt chart: Shown adjacent to the Activity Table, the Activity
Gantt chart represents your schedule and offers robust customizable
project management features including drag and drop editing,
timescale, progress lines, relationship lines, spotlights, bar necking, and
helpful mouseover tips.
Issues detail window: To gather the related details associated with a
particular item in certain tables, the application often provides one or
more detail windows in a series along the bottom. On pages supporting
applied views, you can determine which detail windows are shown or
hidden with your view.

Customizing the P6 User Experience
235
About Screen Controls
As is typical with enterprise software, the application's main pages present more detail
the further the user navigates within them. The following types of screen controls will
appear:
Pages
Tabbed Pages or simply, Tabs
Detail Windows
Dialog Boxes
Portlets
Working with the Main Menus
The seven main menus of P6 are located in the title bar and navigation bar. The menus
are:
Dashboards
Portfolios
Projects
Resources
Reports
Administer
Help
You can click each main menu directly on its icon or text to execute its default
command; however, you must click only on the triangle portion ( ) of the menu for the
additional Dashboard, Portfolio, Project, or Resource menu items to appear. If no triangle
appears next to the menu, this indicates your user interface view settings do not include
access to its menu items.
In all of the main menus except Help and Reports, your assigned user interface view and
your view settings on the My Preferences page determine which menu items appear, if
any. The portfolios and projects menus also display a list of your most recently used
portfolios and projects.
Each menu item will take you to another page or dialog box. If the first page for projects
or portfolios is already open, and you select one of the most recently used items in the
menu, it will open the selected projects or portfolios and refresh the page.
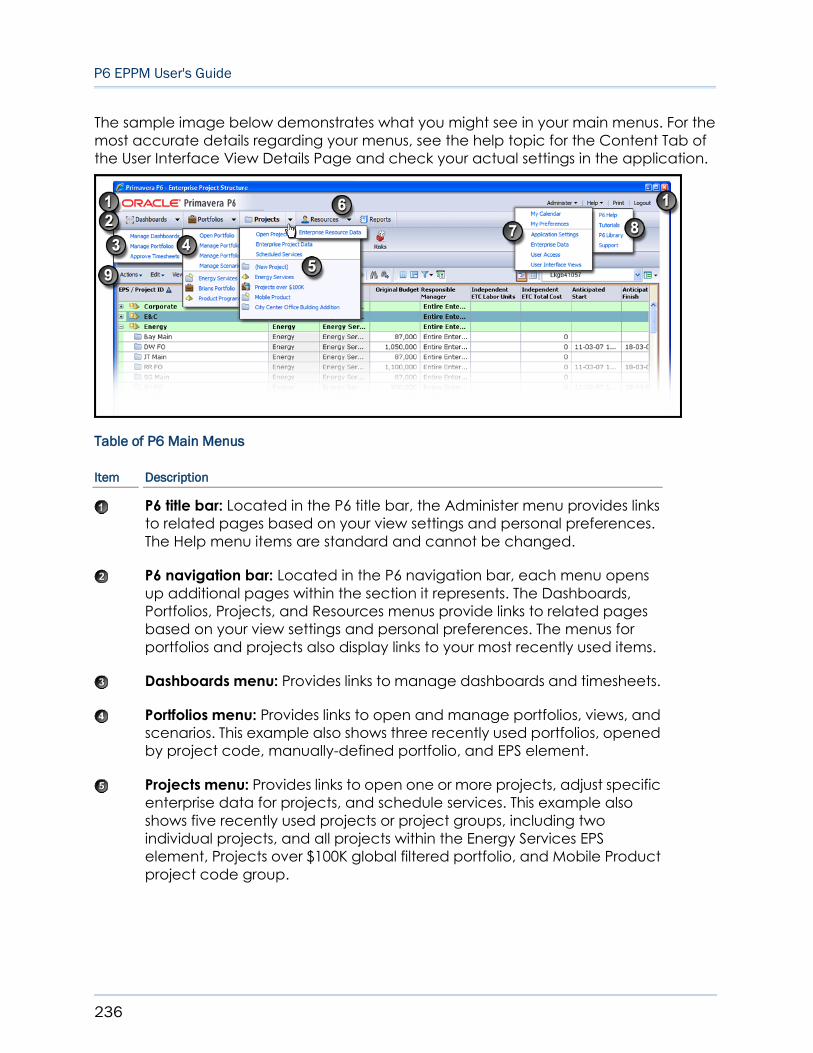
P6 EPPM User's Guide
236
The sample image below demonstrates what you might see in your main menus. For the
most accurate details regarding your menus, see the help topic for the Content Tab of
the User Interface View Details Page and check your actual settings in the application.
Table of P6 Main Menus
Item Description
P6 title bar: Located in the P6 title bar, the Administer menu provides links
to related pages based on your view settings and personal preferences.
The Help menu items are standard and cannot be changed.
P6 navigation bar: Located in the P6 navigation bar, each menu opens
up additional pages within the section it represents. The Dashboards,
Portfolios, Projects, and Resources menus provide links to related pages
based on your view settings and personal preferences. The menus for
portfolios and projects also display links to your most recently used items.
Dashboards menu: Provides links to manage dashboards and timesheets.
Portfolios menu: Provides links to open and manage portfolios, views, and
scenarios. This example also shows three recently used portfolios, opened
by project code, manually-defined portfolio, and EPS element.
Projects menu: Provides links to open one or more projects, adjust specific
enterprise data for projects, and schedule services. This example also
shows five recently used projects or project groups, including two
individual projects, and all projects within the Energy Services EPS
element, Projects over $100K global filtered portfolio, and Mobile Product
project code group.

Customizing the P6 User Experience
237
Item Description
Resources menu: Contains a single link to adjust resource-specific
enterprise data without navigating away from the current page.
Administer menu: Assuming all its menu items are configured, this menu
provides links to adjust your own calendar and personal preferences. In
addition, it can also display links to the Application Settings, Enterprise
Data, User Access, and User Interface Views pages.
Help menu: A fixed menu providing links to the Online Help, P6 Library of
documents available online, and the Oracle Primavera Customer
Support website. If so configured, the Help menu can also provide links to
multimedia tutorials powered by Oracle UPK technology.
About the Most Recently Used List
As you work, when you click the Portfolios or Projects menu, by default P6
displays the five most recently used items, with the item you most recently opened listed
first.
Note: Your administrator can increase the list of most recently used
items to a maximum of ten.
The most recently used projects include individual projects or project groups (EPS nodes,
portfolios, or project code values). The most recently used portfolios include project
groups.
Projects are not added to the most recently used projects list when you create a project,
initiate a project request, or open a random set of projects (for example, projects from
multiple portfolios, but not the full portfolio itself). Projects you access from portlets are
added to the list, unless you access only activity detail information (such as activity
notebooks or documents) directly from a portlet.

P6 EPPM User's Guide
238
Working with Tables
Tables appear throughout the application to not only display information, but also to
allow you to modify it, as permitted. The following general features are common to most
tables.
Table of Common Table Features
Item Description
Sort Order Indicators: Indicates the column you have selected to sort the
rows. Each time you click a column header, the sort order toggles from
ascending order, to descending order, and, for some tables, it cycles
back to unsorted order (the original order in which the entries were
created).
Grouping Levels: Many tables group related rows into hierarchical levels
you can click through to expand or collapse. Some tables use colored
bands to help you view these levels.
Selection Highlighting: The currently selected row is highlighted for you.
You can directly click and drag to select one or more entries. Hold down
the Ctrl key as you mouse click rows to select more than one. Hold down
Shift as you click two entries to select all contiguous rows.
Changed Data Icons: When rows change in a table, three color-coded
icons are used to signal the type of change that has occurred. A gold
icon indicates a pending change, a green icon indicates a new
entry, and a red icon indicates an error.
Data Entry Features: Tables allow you to directly edit data with
convenient controls to assist you in entering the right type of data. For
example, a date field will display a calendar.

Customizing the P6 User Experience
239
Column Resizing: You can directly drag to resize column widths.
Column Configuration: On most pages, a convenient Select Columns
icon allows you to select which columns are shown or hidden in the table.
Column Order: You can directly drag and drop column headings to
customize your tables.
About Columns (Fields)
Fields hold data. They generally either allow you to enter values or just display the field's
current value (called a read-only field).
Pages with tables often permit you to configure the fields that make up the columns of
the table. See Showing or Hiding Columns in a Table (on page 239).
Showing or Hiding Columns in a Table
When the list of available fields or columns for a table is relatively short, indicated by the
presence of the Select Columns icon and field list in the toolbar, use it to show and hide
the columns that appear.
To show and hide columns:
1) On the toolbar, click Select Columns.
2) From the resulting list of fields or columns:
a. Select an available column (not checked) to immediately display it in the table.
b. Select a currently visible column (checked) to immediately hide it in the table.
Note: You might have to scroll to the right end of a table to see all
the columns.
Configuring Columns or Values
When the list of available fields, columns, or values for a list, table, view, scorecard, or
other entity is relatively long, follow these common steps to configure the fields or values
you want. Essentially, you move the items you want from the available side to the
selected side.
For example, these steps apply when selecting projects or templates in the Open
Projects dialog box, when configuring the fields to display as columns in a table, and
when assigning individual users to a user interview view.
To configure fields, columns, or values:
1) In the Available Items list, select one or more items. If arranged in a hierarchy, click
to expand a group and view its items. Hold down the Ctrl key as you click to select
individual items or press the Shift key to extend your selection to an entire block of
items including the first and last items you clicked.

P6 EPPM User's Guide
240
2) Click or double-click each item to add them to the Selected Items list. This is the
list of selected fields or values you want to appear in your customized list, table, view,
scorecard, or other entity.
3) To remove items, select them in the Selected Items list and click or double-click
them. If you need them again, the items are available in the list of available items.
4) In the Selected Items list, if applicable, adjust the order of appearance of your items:
a. Click to advance the item up or to the left in a table.
b. Click to advance the item down or to the right in a table.
Note: You can also directly click and drag columns in tables to
configure their order of appearance.
Working with Toolbars
Throughout the application, pages, tabs, portlets, detail windows, and dialog boxes
provide access to essential commands in toolbars. Most toolbars are static, however, the
ones on the Activities, EPS, and Resource Assignment pages can be moved and
customized.

Customizing the P6 User Experience
241
Table of Toolbar Elements
Item Description
Toolbar shortcut menu: Right-click within blank space on this panel to
select the toolbars you want in your customized view. You can also select
Rearrangeable or Customize Toolbars, both described below.
Rearrangeable toolbar: Click and hold the mouse button down on the
toolbar's edge until you see the move cursor. Then, drag to position the
toolbar wherever it is needed.
Docked toolbar: In this example, the user has dragged the Edit toolbar
from its typical location on top to the page's left edge until it snaps into a
vertically-oriented position.
Customize Toolbar Items dialog box: In this example, the user has
selected Customize Toolbars from the Toolbars submenu of the View
menu. On this dialog box, the user has elected to hide the Fill Down
command icon from their Edit toolbar.
Activity View toolbar: This toolbar represents an example where a subset
of the commands found under the View menu are presented here in a
static or fixed toolbar for convenient access.
Toolbar in a detail window: The Steps detail window, like many other
detail windows, has its own fixed toolbar.
Customizing Toolbars
Toolbars are made up of icons that represent the commands you can invoke. You can
customize the appearance of icons on toolbars and move the toolbars on the following
pages only:
EPS page
Activities page
Resource Assignments page
P6 saves any custom settings you make with toolbars. When you return to one of these
pages with customizable toolbars, the settings you specified last will be reapplied to the
toolbars.
To customize a toolbar:
1) Navigate to one of the pages that support toolbar customization.
2) From the View menu, select Toolbars and then select Customize Toolbars...
3) On the Customize Toolbar Items dialog box:
a. In the Toolbar pane, select a toolbar.

P6 EPPM User's Guide
242
b. In the Toolbar Item check box list, select the check box for the icons you want to
include. Clear the check box for the items you want to hide.
c. Click Save.
4) To reposition a toolbar:
a. On the page you selected for step 1, right-click in the blank space between
toolbars and select Rearrangeable.
b. Click the grab handle for the toolbar you want to move and drag it to a new
position. Supported positions include the left, right, top, or bottom margins of the
main work area of the page.
Working with "Select a Value" Dialog Boxes
Throughout the application, certain types of fields require specific types of values. To
assist you in selecting from only a constrained list of available choices, the interface will
display Select a Value dialog boxes for you to search for and select a specific value
appropriate for the current field.
Note: Field lists of values are used when the available choices are
manageable (usually, less than 10 values). However, when the
number of available choices is large (for example, there might be
hundreds of projects), the application will offer Select a Value
dialog boxes.

Customizing the P6 User Experience
243
Table 1 of 2: Select a Value Dialog Boxes
Item Description
Select a Value Button: Throughout the application, click Select a
Value to open a selection dialog box.
Search Area: The top part of the dialog box contains search controls to
help you constrain the values based on your criteria.
Results area: The middle part of the dialog box displays the available
values based on your search criteria, if any. Make your selection here.
Command buttons: The bottom part of the dialog box contains
command buttons. Standard buttons include OK or Assign to accept the
value you selected, and Close to cancel the operation, close the dialog
box, and return to the previous screen.
Similar selection buttons: The Select a Date and Select a URL dialog boxes
function in a similar manner to the selection dialog boxes. Click these
buttons, when present in the interface, to select a constrained value for
the specific field.

P6 EPPM User's Guide
244
Table 2 of 2: Select a Value Dialog Boxes
Item Description
Selection Buttons: Similar to the button, in these examples, click or
to choose a particular item.
Search Area: The top part of the dialog box contains custom search
controls to help you constrain the values based on your criteria. In one
example, option buttons are used to constrain Global, EPS, or Project
code values.
Results Area: The middle part of the dialog box displays the available
values based on your search criteria, if any. Make your selection here.
Command Buttons: The bottom part of the dialog box contains
command buttons. Standard buttons include Assign or OK to accept the
value you selected, and Close to cancel the operation, close the dialog
box, and return to the previous screen. Other buttons can also appear in
this area.
Selecting Values from "Select a Value" Dialog Boxes
To assist you in selecting from a constrained list of available values, the application will
often display Select a Value dialog boxes. Use these special dialog boxes to search for
potential matching values and select one or more specific values appropriate for the
current field.
Note: Although commonly used throughout the application, each
dialog box can contain unique options.
To select a value from a Select a Value dialog box:
1) Enter any search criteria to reduce the number of values shown.
2) Select a value in the list. If grouped in a hierarchy, expand a group to view the values.
3) Click OK or Assign.
4) Repeat these steps to select additional values if necessary.
5) When finished, click Close.

Customizing the P6 User Experience
245
Working with Data in P6
The application's data entry controls are convenient and easy to use.
Table of Common Data Entry Controls
Item Description
Expandable sections: Often times a screen will reduce visual clutter by
hiding its fields and other controls. Expand these regions to show its fields.
In the sample image, we say that the Custom Portlets section is
expanded or opened, and the Performance Threshold section is
collapsed or closed. Also of note, you can directly modify the Title field
but the Last modified by field information is read-only.
Note: Data you enter can later become read-only for you or other users.
Auto-Complete: Also known as type-ahead. As you type in a field that
must be assigned a value from a pre-defined list of acceptable values,
the closest single matching value is automatically selected for you. If
multiple values match your typed input, they appear in a list. To select a
value, click one or press the up or down arrow keys on your keyboard
and then press Enter.

P6 EPPM User's Guide
246
Item Description
Select a Value from an Extended List: Click to select a field value from
a Select a Value dialog box listing only valid values. You cannot type in
your own entry in fields where the Select from Value List icon appears. This
convention is used whenever a field's value must be logically constrained
and validated against a pre-defined set of values. To illustrate this point,
consider the following example. You can type whatever you want in a
Name field for a new item you are creating; however, in a User field, you
must enter a valid user.
Select a Value from a Short List: In this example, the Activity Type field is
shown at rest. Below that, after the user has selected the field's list, its
values appear. For these kinds of fields, you will see references in the
documentation to selecting a value from the Activity Type list.
Options: For simplicity's sake, both radio buttons and check boxes are
referred to as options.
Dates: You can type a date in a valid format directly into a date field. Or,
you can select a date, including the time, from a small pop-up calendar.
Indicators: To help you readily identify the meaning of a given metric,
these color-coded graphics appear. You can also define your own
custom user-defined indicators.
Working with Detail Windows
When additional details about an item are necessary, rather than clutter the main work
area, the application will often use subordinate tabbed panels called detail windows.
Detail windows supplement their parent pages with related data and often include their
own toolbars. These special windows allow you to:
minimize them to a series of tabs
float, drag and drop, and freely resize them
tile them, or align them as overlapping tabs
dock or pin them (when docked, allowable placement includes bottom, left, and
right of the current work area)
When you customize the detail windows on the EPS, Activities, or Assignments pages, P6
prompts you to save the settings with the current view.

Customizing the P6 User Experience
247
Note: Visual clues guide you when docking floating panels. As you
click the titlebar and drag it within the work area, a gray
rectangular outline indicates the panel will "snap to" this available
location.
Table of Key Detail Window Elements
Item Description
A series of detail windows: In this example, the three detail windows for
Steps, Documents, and Issues appear in a series aligned at the bottom of
the page with their titles shown in tabs.
Floating detail window: The user has dragged and dropped the Expenses
detail window to a position where it appears to be floating above the
rest. Click the Restore button in the titlebar to make the window go back
with its siblings.
Docked detail windows:The Assignments and Trace Logic detail windows
have been docked or pinned by the user to the space immediately to
the right of the main work area.

P6 EPPM User's Guide
248
Item Description
Minimized detail window: The Codes detail window has been minimized.
In this particular example, it also happens to be minimized to a position
along the right edge of the page. Typically, detail windows are minimized
along the bottom.
Detail window titlebar icons: Click these icons to Float, Restore, and
Minimize detail windows individually or collectively as a series.
About Portlets
Portlets are small expandable windows representing a specific theme or particular
subject matter. They are only available on dashboards, project workspaces, or
workgroup pages. Portlets provide a concise way to organize, present, and assess
project data within a single page and also offer tools for adding, modifying, and
personalizing portfolio, project, and resource data. Portlets on shared dashboards or
workspaces provide a centralized place for collaborating with other users.
The same portlet might display information differently depending on the page on which
it appears. On a dashboard, portlets display data based on association, ownership, or
applied filters. On a project workspace, portlets reflect data for the open project. On a
workgroup workspace, portlets show information belonging to that workgroup.
About Data Entry Controls
Data Entry Controls: P6 provides easy-to-use controls for entering data. To assist you in
choosing the right types of values, fields will sometimes present dialog boxes or calendars
for selecting from a pre-defined list of values or dates. Familiar value lists help narrow
choices and enforce consistency. You'll also recognize standard options (a term used for
both check boxes and option buttons or radio buttons), tables, spreadsheets, Gantt
charts, calendars, and other on-screen controls.
Printing Pages Using P6 Printing Tools
Available on most pages within the application, the printing tools and options provided
with the user interface offer the best options and output. It is recommended that you use
the Print Preview feature before generating actual output.
To print application pages:
1) Navigate to the specific page or tab and customize the view to meet your data
requirements.
2) In the toolbar, if available, click Print Preview to preview the printed output.
3) (Optional) In the Print Preview toolbar, adjust the preview using the commands
provided. For example, click Portrait to orient output to a standard tall page, or
click Landscape to orient output to a wide page.

Customizing the P6 User Experience
249
4) In the toolbar, click Print to send the output to your default printer.
5) (Optional) In the Print dialog box, adjust the printer, page range, number of copies,
PDF settings, and other printing options. Click OK to print the output.
Tips
If the application printing tools are not available for the specific page or view you want
to print, you might be able to print the page using your web browser; however, this
method can never be guaranteed and might produce substandard results. See Printing
Pages Using Your Web Browser (on page 249).
Printing Pages Using Your Web Browser
Because P6 runs inside your web browser, you can print any data from any page at any
time using your browser's Print command. For example, in Microsoft Internet Explorer,
choose Print from the File menu. P6 application pages also feature a Print link you can
click. In addition, many pages also include separate Print toolbuttons in a toolbar.
Note: Whenever they are available, the printing commands
provided by the application offer the best options and output. It is
also recommended that you always use the Print Preview feature
before generating actual output.
To print data:
1) On any page that supports printing, click the Print link in the top right corner.
2) In the resulting Print dialog box for your operating system, choose a printer and click
OK to print.
Note: You have completed this task. Continue with the following
steps only if necessary to improve or customize the output.
3) In the Print dialog box, if available, click Print Preview. Refer to Print Preview
Toolbar to learn more about the Print Preview toolbar. If not available, use your
browser's Print Preview command. For example, in Internet Explorer choose Print
Preview from the File menu.
4) In the Print Preview dialog box, to customize the output, click Page Setup or click
your browser's Page Setup button.
5) In the Page Setup dialog box, apply the following optional settings on separate tabs if
available:
a. Click the Page or Page Layout tab to set the paper size and margins.
b. Click the Header/Footer tab, or separate tabs if available, to select pre-defined
headers or footers, or define your own.
c. Click the Sheet tab, if available, to set the range and tiled page order.
6) Click OK to close the Page Setup dialog box.

P6 EPPM User's Guide
250
7) In the Print Preview dialog box, click Print or Print (Alt+P) to make any final
adjustments in the Print dialog box. For example, click the Pages option and enter a 1
in both the from and to fields if you only want to print the first page of a lengthy report.
8) Click OK or Print.
Tips
When printing a spreadsheet or histogram on the Team Usage page, right-click in the
work area and choose Print.
The Print Preview dialog box for the Portfolio Analysis page includes special options.

251
In This Chapter
About Portfolios ....................................................................................................... 251
Working with Portfolios............................................................................................ 251
Portfolio Views ......................................................................................................... 256
About Portfolio Scenarios ...................................................................................... 266
About What-if Analysis ........................................................................................... 266
Working with Portfolio Scenarios ........................................................................... 267
Capacity Planning .................................................................................................. 268
About Portfolios
A portfolio is a collection of projects. Group projects into portfolios so you can easily view
data from more than one project at a time. For example, you might filter a dashboard by
a portfolio to view a wide range of information for multiple related projects at one time.
In a more strategic sense, you should group projects and programs together to facilitate
the effective new product development and management of those projects to optimize
your organization's success at meeting business objectives.
Using portfolios, you can review summary data and status information for the group as a
whole or for individual projects in a portfolio.
You can create portfolios for your own use or for sharing with other users. You can also
create global portfolios, which are available to all users.
Portfolio views, such as pie charts, enable you to visually compare portfolios. For
example, compare costs for all projects in region A (one portfolio) vs. region B (another
portfolio).
Historical snapshots of grouped project data, called scenarios, aid in your analysis of
project groups on the Portfolio Analysis and Capacity Planning pages.
Working with Portfolios
To begin using the analysis features in the portfolios section, you must already have
created and updated multiple projects. Begin your work in the portfolios section by
creating and configuring at least one portfolio. It's also possible for another user to create
one and share it with you. Over time, your team will create additional portfolios, views,
and scenarios in order to perform comparative analysis, obtain status and ROI, and
perform other operations.
Managing Project Portfolios

P6 EPPM User's Guide
252
When creating a portfolio, decide whether you want to hand pick the projects that it will
comprise, or if you want the application to create and periodically update the set of
projects in your portfolio based on your filter criteria. Either way, you can change these
settings at any time.
Note: An administrative option is available to increase or decrease
the refresh interval for filtered portfolios. Refer to Filter Portfolio Stale
Period in the P6 Administrator's Guide.
Creating Portfolios
Perform these steps to create a new group of projects called a portfolio. When creating
a portfolio, decide whether you want to hand pick the projects that it will comprise
(manual), or if you want the application to create the set of projects in your portfolio
based on your filter criteria (automatic). Either way, you can change these settings at
any time.
To create a portfolio:
1) From the Portfolios menu, select Manage Portfolios.
2) On the Manage Portfolios page, click Create Project Portfolio.
3) On the Create Portfolio page:
a. In the Project Portfolio Name field, enter a unique portfolio name.
b. In the Manage this portfolio area, decide if you want to add projects to the
portfolio manually or automatically using a filter. The fields on the Create Portfolio
page will adjust based on your selections.
If you selected Manually, add the projects you want to include from the
Available Projects list to the Selected Projects list.
If you selected By Filter, enter your filter criteria.
c. Configure access to the portfolio by making a selection from the This portfolio is
available to options.
To restrict access to the new portfolio to only you, select Current User.
To designate a global portfolio, select All Users.
To restrict access to only another user, select Another User, and make a
selection from the Select a User dialog box.
d. Click Save.
Tips
To edit a portfolio, including its projects or filter criteria, click Details.
There are two alternate ways to create a portfolio:
Click Portfolios, click Portfolio Analysis, and then select a scorecard in the View
field. From the toolbar, click Create Portfolio from Selected Projects.

Managing Project Portfolios
253
Click Portfolios, click Capacity Planning, and then click Create Portfolio from
Selected Projects.
Creating Projects While Working with Portfolios
Generally, you create projects while working in the Projects section of the application.
However, you can also create a project while viewing a portlet in the Dashboards
section or analyzing a portfolio in the Portfolios section. Refer to the tasks below:
Creating Projects in a Portfolio Portlet (on page 253)
Creating Projects on the Portfolio Analysis Page (on page 254)
Creating Projects in a Portfolio View Scorecard Portlet
Generally, you create projects while working on the EPS page in the Projects section of
the application. However, it is also possible to create what-if projects while viewing a
portfolio view scorecard portlet on a dashboard.
To create a project in a portfolio view scorecard portlet:
1) Click Dashboards.
2) On the Dashboards page, click a dashboard.
3) On the dashboard, locate your portfolio view scorecard portlet's titlebar and click
Click here to maximize or minimize this section to expand and maximize it.
4) In the expanded and maximized portfolio view scorecard portlet:
a. Select a project row.
b. Click Add.
5) For the first project you create, if defaults are not already set, the Add Project dialog
box appears:
a. Select a default Parent EPS element.
b. Select a default Responsible Manager.
c. Click Select.
6) In the portfolio view scorecard portlet:
a. Select your new project row by clicking on it in the Name column.
b. Enter a name for your new project to replace the default name.
c. Click Save.
Tips
When you create a project from a scorecard on a dashboard, the project is
automatically added to the filter currently associated with the dashboard. However,
if the dashboard is filtered by a global portfolio and you do not have the required
security privilege to edit global portfolios, the new project is removed from the
scorecard when you click Save.

P6 EPPM User's Guide
254
You can change the Project Status field on the General detail window of the EPS
page. For example, you may later want to change a project from What If to Planned
status.
Creating Projects on the Portfolio Analysis Page
Generally, you create projects while working on the EPS page in the Projects section of
the application. However, it is also possible to create what-if projects while analyzing
portfolios. During the process of evaluating a portfolio, you will often want to capture a
new project idea.
To create a project on the portfolio analysis page:
1) Click Portfolios.
2) On the Portfolios navigation bar, click Portfolio Analysis.
3) On the Portfolio Analysis page:
a. Make sure you are working with the primary portfolio (at top or left) and not the
comparison set for the next steps.
b. In the Scenario list, select a scenario for your analysis.
c. In the View list, select a portfolio view scorecard.
d. In the scorecard, select a row where you want to add a new project.
e. Click Add Project.
4) For the first project you create, if defaults are not already set, the Add Project dialog
box appears:
a. Select a default Parent EPS element.
b. Select a default Responsible Manager.
c. Click Select.
5) On the Portfolio Analysis page, click Save.
Tip
You can change the what-if project's Project Status field value on the General detail
window of the EPS page. For example, you may later want to change a project from
What If to Planned status.
Assigning Projects to a Portfolio
When comparing portfolios on the Portfolio Analysis page, you can assign a project to
the selected portfolio in either half of the page.
To assign a project to the selected portfolio:
1) Open a portfolio in the Portfolios section using one of the following methods:
Click Portfolios to open the last portfolio you were working with.

Managing Project Portfolios
255
Click the Portfolios menu and choose one of the most-recently used
portfolios.
Click the Portfolios menu and choose Open Portfolio to select a group of
projects by portfolio type, EPS node, or project code.
2) On the Portfolios navigation bar, click Portfolio Analysis.
3) On the Portfolio Analysis page:
a. In either work area, choose a scorecard view in from the View list.
b. In the same work area, select <Latest Data> from the Scenario field list.
c. In the same work area, click Assign a Project to this Portfolio
4) In the Select Project dialog select a project, then click Assign.
Tips
You cannot assign a project to a portfolio when displaying a scenario; you must
select <Latest Data>.
The selected portfolio must be manually-administered; you cannot assign a project to
a filtered portfolio.
Defining Performance Thresholds
To help you assess the relative performance, earned value, index calculations, and other
metrics for a WBS, project, or portfolio, you can set performance thresholds. These
thresholds capture the current calculations, variances, and metrics and re-route them
into one of four ranges or "buckets" as follows:
Exceptional: Indicates that a WBS, project, or portfolio is exceeding
expectations.
Acceptable: Indicates that a WBS, project, or portfolio is performing within an
expected range.
Warning: Indicates that a WBS, project, or portfolio needs attention and is
performing below expectations.
Critical: Indicates that a WBS, project, or portfolio requires significant corrective
action.
The threshold values you set for a project apply to all users viewing metrics for that
project from the Workspace page and Portfolios pages. You have the option of
overriding these thresholds for your own use on a personal dashboard. Both sets of steps
are detailed below.
To define performance thresholds for a project:
1) Click Projects and select Open Projects.
2) In the Open Projects dialog box, select one or more projects by name, code, EPS, or
portfolio. Click OK.

P6 EPPM User's Guide
256
3) On the Projects navigation bar, click Workspace.
4) On the Workspace page, click Customize.
5) On the Workspace Details page:
a. Click to collapse all the sections except Performance Threshold.
b. Click to expand the Performance Threshold section and then expand
Performance, Earned Value, and Index.
c. For each parameter, shown with its color-coded visual indicator, enter a threshold
value. For lists, select a value from the list.
d. Click Save and Close.
6) If you opened more than one project, select the next project in the Select Project list
and repeat these steps after clicking Customize.
To define your own performance thresholds:
1) Click the Administer menu and select My Preferences.
2) On the My Preferences page, click Global tab.
3) On the Global tab:
a. Click to collapse all the sections except Performance Threshold.
b. Click to expand the Performance Threshold section and then expand
Performance, Earned Value, and Index.
c. For each parameter, shown with its color-coded visual indicator, enter a threshold
value. For lists, select a value from the list.
d. Click Save and Close.
Tips
If any logical constraints are not satisfied by your selections, a message appears at the
top of the page. For example, if you set a warning to 25 days late, a critical threshold
cannot be set to 10 days late; logical constraints require that critical thresholds be
greater than warning thresholds. Correct the thresholds and try saving again.

Managing Project Portfolios
257
Portfolio Views
About Portfolio Views
A portfolio view is a scorecard or chart providing high-level information spanning an
entire group of projects. Portfolio views can appear in an individual user's personal
dashboard or shared among users in shared dashboards. They are also used when
comparing portfolios on the Portfolio Analysis page.
Working with Portfolio Views
Each user’s personal portfolio views and any global portfolio views appear on the
Portfolio Views page. From this page, you can manage the following types of portfolio
views:
Scorecard: Similar to tables or spreadsheets, you can display the columns you want in
scorecards on the Portfolio Analysis page, the Capacity Planning page, or the
Portfolio View portlet. To assist with more sophisticated analysis on a set of projects,
you can also use a scorecard to conduct a waterline analysis. A waterline is a visual
modeling tool that ranks projects into two separate groups by sorting and applying a
constraining limit. Scorecards also permit you to edit some of their fields.
Bubble Chart: A bubble chart displays four project data fields. The X-axis represents
the values from one data field, the Y-axis represents a second field, the size of the
bubble represents a third, and the field selected for grouping the data represents a
fourth field. A bubble chart is useful when you want to analyze three independent
project variables at one time, grouped by a fourth set of values.
Pie Chart: A pie chart is a circular chart divided into proportional slices, where each
slice represents its contribution to the whole. The size of the slice represents the value
of the selected data field. A pie chart is useful for analyzing relative parts of a whole.
Histogram: There are three types of bar charts, or histograms.
Basic Histogram: A basic histogram lets you analyze project data in a vertical bar
chart format. You can select a project data field to display on the X-axis and
another field to display on the Y-axis of the chart; typically, the X-axis represents
categorical data, and the Y-axis represents individual data values.
Side-by-Side Histogram: A histogram where categorized data can be grouped,
side-by-side, to assist with comparisons. A side-by-side histogram chart is useful
when analyzing relative parts of a whole. For example, use a side-by-side
histogram to analyze original budget based on project status.

P6 EPPM User's Guide
258
Stacked Histogram: A more sophisticated version of the histogram, where
categorized data is grouped, or stacked, to assist with comparisons. A stacked
histogram is useful when analyzing relative parts of a whole.
Creating Portfolio Views
When creating portfolio views, specify the scorecard or chart type, the project
information you want to appear, and the users who will have access to the view. Portfolio
view types include scorecard, bubble chart, pie chart, and three types of histograms
(basic, side-by-side, and stacked).
To create a portfolio view:
1) Click the Portfolios menu and choose Manage Portfolio Views.
2) On the Portfolio Views page, click Create View.
3) On the Create View dialog, decide if your new view should be entirely new or based
on an existing view.
To create an entirely new view, expand New Portfolio View, select a chart type,
and click OK.
To create a new view based on an existing view, expand Existing View, select one
from the expanded user and global views shown and click OK.
4) On the Create Portfolio View page, expand any collapsed groupings, complete the
required fields, and specify any additional details about the view. The fields on the
Create Portfolio View page automatically adjust based on the value you select for
the Type field.
5) Click Save.
Tips
You can save a portfolio view as a scenario and save a scenario as a portfolio view.
You can use any of these alternate methods to create a portfolio view:
Click Portfolios, click Portfolio Analysis, and then click Create Portfolio View.
Click Portfolios, click Portfolio Analysis, configure a particular view or scenario, and
then click Save As.
Click Dashboards, select a dashboard, and then click Customize. In the Portfolio
Views group, click Add. Using this method, your new view appears in the Portfolio
View portlet with the title you assigned to it.
Working with Portfolio View Scorecards
A scorecard is a type of portfolio view you can use to analyze project data in a table
with projects in rows and up to 30 data fields in columns. You can display scorecards on
the Portfolio Analysis page, the Capacity Planning page, and the Portfolio View portlet,
and choose the columns of information you want to display. A scorecard is beneficial
when you want to analyze data in a spreadsheet-type format.

Managing Project Portfolios
259
To assist with more sophisticated analysis of a set of projects, you can also use a
scorecard to conduct a waterline analysis. A waterline is a visual modeling tool that ranks
projects into two separate groups by sorting and applying a constraining limit.
It is also possible to edit some global and project data in a scorecard, such as project
codes, user-defined fields, and responsible manager. Additionally, you can add projects
with default data and delete projects directly from a scorecard.
Table of Key Scorecard Elements
Item Description
Portfolio Analysis toolbar.
Portfolio Analysis settings area.
More/Basic buttons: Click More to display more options in the Portfolio
Analysis settings area. Click Basic to hide the additional settings.
Scorecard work area: The first scorecard will appear in this upper work
area.

P6 EPPM User's Guide
260
Item Description
Scorecard work area: The second scorecard will appear in this lower
work area. In this example, the user has customized the view with a
waterline. Use a waterline to analyze a project group by sorting projects
into two separate groups based on a defined sorting and constraint limit.
Projects above the waterline, displayed with a white background, are
those that fall outside the constraint limit value; all other projects,
displayed with a light blue background, appear below the waterline.
Project Selection checkboxes: Check a box to add a project's data to
the cumulative Total line.
Note: To support comparative analysis, the Portfolio Analysis work
area is divided into two parts. The elements above generally
appear within both parts.
More About Scorecards
You can save the same scorecard view used on the Portfolio Analysis page and display it
in private or share it later in a portlet on a dashboard.
Note: The application also makes use of general tables of data also
referred to sometimes as scorecards; however, they are not the
same as your individually named portfolio view scorecards.

Managing Project Portfolios
261
Table of Related Scorecards
Item Description
Dashboard: The John's Projects dashboard. You can show portfolio views
on private, multi-user, or global dashboards.
Scorecard in a portlet: The Budget View scorecard in a portlet on a
dashboard. This example demonstrates a named portfolio view of type
scorecard.
Click here to maximize or minimize this section button: Click to
maximize and expand the scorecard. Additional command links will
appear at the top of this portlet when it is maximized.
Scorecard on the Capacity Planning page: This example demonstrates a
general table format also referred to as a scorecard; however, this is not
a named portfolio view of type scorecard.
Working with Portfolio View Bubble Charts
In addition to plotting data along the X axis and Y axis, bubble charts also adjust the
relative size of each entity's bubble or circle to depict a third value, and they group the
data by still a fourth value.
Example: A user wants to analyze original budget, cost variance, and at completion
total cost for each project in a portfolio. The user also wants to compare this data to
another portfolio grouping projects by division/office and showing risk level, actual total
cost, and at completion total cost. The user navigates to the Portfolio Analysis page and
customizes the portfolio views, filters, scenarios, and bubble chart options shown below.
The user sets Original Budget to display on the X-axis and Cost Variance on the Y-axis.
Next, the user selects At Completion Total Cost as the bubble size and sets the Group by
to Project. When the chart appears, each bubble represents a single project; the size of
the bubble represents the At Completion Total Cost value for the project; the bubble's
position on the X-axis represents the original budget value for the project; and the
bubble's position on the Y-axis represents the cost variance value for the project. The user
configures a second bubble chart to display Risk Level on the X-axis, Actual Total Cost on
the Y-axis, and At Completion Total Cost for the bubble size. This time, the projects in the
portfolio are grouped into bubbles by division/office.

P6 EPPM User's Guide
262
Note: To support comparative analysis, the Portfolio Analysis work
area is divided into two identical parts with the only difference
being the data that appears in each part. The elements below
appear within each part.
Table of Key Bubble Chart Elements
Item Description
Portfolio Analysis toolbar.
Filter: The currently applied filter appears. The top chart's filter is
determined by the currently selected portfolio. You can set the bottom
chart's filter by clicking .
More/Basic buttons: Click More to display more options in the Portfolio
Analysis Settings area. Click Basic to hide the additional settings.
Portfolio Analysis settings area.
Bubble Chart work area: Your chart will appear in this main work area.
Legend: Based on the Group By field, each item in the legend is given a
color based on the selected color theme.

Managing Project Portfolios
263
Working with Portfolio View Pie Charts
A pie chart is a circular chart divided into slices, where each slice represents a particular
group. The size of the slice represents the value of the selected data field, relative to the
group's total value. A pie chart is useful for analyzing relative parts of a whole.
Example 1: You can create a pie chart to analyze current budget for projects, based on
project status. To do this, customize the chart and select Current Budget as the data
field, then choose to group by Project Status. When the chart displays, each slice
represents a single project status (e.g., Planned, Active, Inactive, What If); the size of the
slice represents the current budget value for all projects assigned the project status.
Example 2: The pie chart below shows At Completion Total Costs in slices representing
Location.
Table of Common Pie Chart Elements
Item Description
Portfolio Analysis toolbar.
Portfolio Analysis settings area.
More and Basic buttons: Click More to display more options in the
Portfolio Analysis Settings area. Click Basic to hide the additional
settings.
Legend: Based on the Group By field, each item in the legend is given a
color based on the selected color theme.

P6 EPPM User's Guide
264
Item Description
Slice: Each data group's proportionate contribution to the total is
represented by a color-coded wedge or piece of the pie. In the
example, this slice represents Mainland Europe's cost of 163,385 which
equates to 13% of the At Completion Total Cost by Location.

Managing Project Portfolios
265
Working with Portfolio View Histograms
Histograms provide bars to help you compare data. Three similar types of histograms are
available: basic, side-by-side, and stacked.
Example: Todd wants to analyze original budget values for each responsible manager
(OBS) in the organization. He also wants to compare this data to another portfolio
showing original budget for each risk level. He navigates to the Portfolio Analysis page
and customizes the portfolio views, filters, scenarios, and histogram chart options shown
below. He sets Responsible Manager to appear on the X-axis and Original Budget on the
Y-axis. When the chart appears, each bar represents a responsible manager (OBS)
element; the size of the bar represents the Original Budget. He configures a second
histogram to display Risk Level on the X-axis and Original Budget on the Y-axis.
Table of Key Histogram Elements
Item Description
Tooltip: Mouse over a bar to view a summary.

P6 EPPM User's Guide
266
Item Description
Show all values on axis: Select this option to include all values on the
X-axis and not just values with data. The histogram includes Very Low and
Very High risk level values even though there is no data to display.
Side-by-Side Histogram: The Group By field is added. In this example,
Actual Labor Cost is tracked along the Y-axis for each Division/Office
grouped by low, medium, and high Risk Level along the X-axis.
Stacked Histogram: The Stack By field is added instead of the Group By
field. In this example, remaining labor costs expressed in units of time
(hours) are graphed for each phase. The data is stacked by location.
About Portfolio Scenarios
Scenarios are snapshots of historical project data at a given point in time. You can use
them to compare against the latest summarized data, or to compare to other scenarios.
About What-if Analysis
Rooted in business management principles of sound decision theory (which option
should we pursue?) is the what-if analysis technique aimed at assessing the results and
impacts of potential scenarios. Its name stems from the question, "What if the scenario
actually came to fruition?"
Use what-if scenarios and what-if projects to determine the impact different costs or
investments have on business goals. Unanticipated adversities can make a business or
project unstable and proactive handling of these uncertainties is required. With what-if
scenario analysis, your organization can evaluate the feasibility of completing the
project under unfavorable conditions, prepare contingency and response plans to avoid
or overcome the worst scenario, and mitigate the impact of uncertain or unexpected
situations.
P6 portfolio scenarios help you calculate multiple project costs or durations and
compare different sets of assumptions about project activities. Sample scenarios might
include the following:
What if we extend the duration of a particular project phase?
What if regulatory changes require us to invest more in certain areas?
What if the price of a critical component increases to unsustainable levels?
What if a crucial part is delayed?

Managing Project Portfolios
267
Working with Portfolio Scenarios
Use scenarios to compare against the latest summarized data, or to compare to other
scenarios. The list of available scenarios includes scenarios you have access rights to
view that are associated with the open project group. As you modify the data displayed
on the tab (for example, you change the type of Capacity Planning chart you want to
view or change the list of selected projects and roles), you can create new scenarios or
save changes to the view to further assist you in role planning.
Creating Portfolio Scenarios
Create portfolio scenarios to capture a specific state you can later use for what-if
analysis.
To create a portfolio scenario:
1) Open a portfolio in the Portfolios section using one of the following methods:
Click Portfolios to open the last portfolio you were working with.
Click the Portfolios menu and choose one of the most-recently used
portfolios.
Click the Portfolios menu and choose Open Portfolio to select a group of
projects by portfolio type, EPS node, or project code.
2) On the Portfolios navigation bar, click Portfolio Analysis.
3) On the Portfolio Analysis page:
a. In the View list, select a portfolio view. If you need to create a view, click
Create Portfolio View.
b. Configure the current view in the lower work area by performing any of the
following optional steps.
1. Click Filter by to filter the current view by EPS, portfolio, or project code.
2. In the Scenario list, select an existing scenario.
3. Click More and make your selections on the settings area.
4. Click Save As.
4) In the Save As dialog box, enter a Title, choose the New Scenario option, and click
Save.
Tips
Another way to create a scenario is to click Capacity Planning, configure the options on
that page, and then click Save As.

P6 EPPM User's Guide
268
Capacity Planning
About Capacity Planning
Executives, managers, and planners tasked with managing a portfolio of existing projects
and new opportunities in the pipeline need a way to evaluate both active and
proposed projects to answer one essential question: Do we have the resource capacity
to successfully complete all the work? The Capacity Planning process helps answer this
question. It reveals when your organization is over or under allocated. Decisions to
proceed, delay, freeze, or terminate projects can then be made.
Working with the Capacity Planning Page
Use the Capacity Planning page to perform What-if analysis, graphically change project
forecast dates, and apply waterline analysis techniques to assist with critical,
executive-level decision making. Before assessing capacity or demand on resources,
create resource and role estimates for each project. During your analysis, you can
create and update scenarios that provide varying snapshots of project and role
allocation data. After conducting your analysis, you can create new portfolios
containing only the projects that meet your planning criteria.
When you choose to display a stacked histogram, area chart, or spreadsheet, the
Capacity Planning chart displays the total at completion units or costs over time for the
combination of selected roles and projects. Each of these charts contains the same
information in different formats with a data stacking option for the projects and roles you
select.

Managing Project Portfolios
269
When you choose to display a net availability chart, the chart displays each selected
role's under- or over-allocated units over time for the currently selected projects. The limit
line is always placed at zero. If the total units for a role equals the limit, no bar is displayed
for that role. Bars placed above the limit line indicate net under-allocation for the
associated role during the displayed time period; bars placed below the limit line
indicate net over-allocation for the associated role during the displayed time period.
Table of Key Capacity Planning Page Elements
Item Description
Navigation: Before you begin, first open the portfolio you want to work
with. After clicking Capacity Planning, remember to click Show
Capacity Planning Chart in the toolbar. This displays the four (4) main
screen areas used in capacity planning.
Scorecard: Use this table to analyze, sort, and select projects. Only the
projects you mark in the check box column appear in the Capacity
Planning chart.
Note: The scorecard on this page is not related to the set of defined portfolio view scorecards.
Gantt chart: View current and forecast schedules. Drag the bars to adjust
the Capacity Planning chart data.

P6 EPPM User's Guide
270
Item Description
Role Selection Area: Mark the check boxes for the roles you want to
include in the Capacity Planning chart.
Capacity Planning Chart (Under-Allocated): View role allocation as a
stacked histogram, area chart, net availability chart, or spreadsheet.
Capacity Planning Chart (Over-Allocated): Customize the chart to show
a limit line representing the maximum capacity of all resources for the
currently selected roles by timescale period.
Customize Capacity Planning Chart: Customize the columns, grouping,
waterline, or chart options. You can customize the chart to display units
or costs, a limit line, and an allocation limit line. You can also choose to
show data for all projects in the database (except what-if projects),
rather than for the projects you select in the scorecard.
If you elect to view costs, but do not have the required security privileges
to view costs for any project in the selected project group, the Capacity
Planning chart does not display any data. This option is not available for
the net availability chart because the chart displays only units.
Note: The net availability charts are often the best place to begin a
resource capacity or demand analysis since they represent a
streamlined birds-eye view. These charts include all related projects
and roles in a single view allowing you to expand or drill down into
only the roles with perceived problems.
Analyzing Role Allocation (Capacity Planning)
You can analyze role allocation over time for one or more projects on the Capacity
Planning page. Using multiple chart formats and role groupings, you can identify areas of
under-allocation or over-allocation. Using scenarios, you can also perform what-if
analysis.
To analyze role allocation:
1) Open a portfolio in the Portfolios section using one of the following methods:
Click Portfolios to open the last portfolio you were working with.
Click the Portfolios menu and choose one of the most-recently used
portfolios.
Click the Portfolios menu and choose Open Portfolio to select a group of
projects by portfolio type, EPS node, or project code.
2) On the Portfolios navigation bar, click Capacity Planning.

Managing Project Portfolios
271
3) On the Capacity Planning page:
a. Click Show Capacity Planning Chart to display the scorecard (top left), Gantt
chart (top right), role selector (bottom left), and Capacity Planning chart (bottom
right).
b. (Optional) Choose to complete any number of the following optional sub-steps:
1. Click Customize to set column, grouping, sorting, waterline, and other chart
options.
2. Click the Scenario list to apply a scenario. Select <Latest Data> to display the
latest summarized data for the project group.
Note: If you customize the Capacity Planning page to display
allocation data for all projects in the database (rather than for
selected projects only), you cannot apply a scenario.
3. In the scorecard (top left), mark or clear the check box next to each project to
include or exclude the project's data in the Capacity Planning chart. Data in
the Capacity Planning chart is updated to reflect your changes.
4. In the role selector (bottom left), click Group Roles By or Search to
pinpoint the roles you want to analyze in the chart. Mark or clear the check
box next to each role to include or exclude the role's allocation data in the
Capacity Planning chart. Role data is immediately updated in the chart.
Note: When grouped by Current Portfolio Roles or Role Team, all
child roles are automatically selected when you select a parent
role.
5. In the Capacity Planning chart (bottom right) toolbar, select a chart or
spreadsheet format, and then choose how you want to stack the chart (by
project, role, project code, or staffed versus unstaffed units or costs).
6. Drag your mouse over a color-coded section of the chart to view the capacity
data for that section.


273
About Reports
Reports are collections of meaningful data saved in a common file format, designed
according to a particular template, and delivered to the right recipients. As permitted,
you can use the set of pre-defined BI Publisher reports or additional reports created by
your administrator. See Pre-defined BI Publisher Reports (on page 277).
Note: Data for reports is accurate up to the last time the reporting
database was updated.
You can elect to run a report in one of two basic ways:
1) On-demand: This type of report generation has many other names, including ASAP,
instant, ad-hoc, and "on the fly". As these names imply, the application accepts
various input criteria from you in real time and then instantly generates and delivers
the selected report to an e-mail address, or prompts you to save or open the file
depending on output type.
2) Scheduled: This type of report generation requires that you first configure the options
and other details necessary to generate the report, but doesn't actually generate the
report output until the scheduled day and time. You can also generate previously
scheduled reports on-demand.
Note: Your ability to run and schedule reports comes from security
settings managed in BI Publisher. Contact your administrator for
more information.
Using Reports

P6 EPPM User's Guide
274
Working with Reports
The reports section of the application hosts an array of reports integrated with BI
Publisher. The role assigned to you determines the extent of your permissions when using
reports in P6.
Reports Screen Elements
Item Description
View menu: Use the view menu to switch between the Reports view and
the Schedules view.
Reports view: The Reports view displays the list of reports you have access
to run. Run a report on-demand, or use the Schedule detail window to
schedule a report run. The remaining screen element descriptions in this
table provide more details on the Reports view.
Schedules view: The Schedules view displays the list of all reports you
have scheduled to run, organized by run frequency (Once, Daily,
Weekly, Monthly). You can suspend or activate the report run by
deseleting or selecting the Enabled option. Click on a report schedule
name and view an explanation of the report in the Description detail
window.

Using Reports
275
Item Description
Reports view work area: Reports are listed by name and grouped by
folder. The report list, group names, and hierarchical structure are
defined in BI Publisher. See Pre-defined BI Publisher Reports (on page 277)
for a list of all reports that accompany P6. Your P6 administrator can
remove pre-defined reports and create additional reports for your use.
From this page, you can view report details including the file formats
available for each report. You can also run a report on-demand or print a
list of reports in your view.
Reports view detail windows:
Schedules detail window: This detail window lists all the scheduled report
runs for the selected report. Use this detail window to add a new
scheduled report run, suspend or activate a report run by selecting or
clearing the Enabled option, and view the history of report runs. You can
also run a scheduled report on-demand from this window.
Description detail window: This detail window provides an explanation of
the report.
Scheduling Reports
Use this task to schedule reports and configure report delivery settings.
To schedule a report:
1) Click Reports.
2) On the Reports page:
a. Click View and select Reports.
3) Select a report, and then click the Schedule detail window., click Add (Insert).
Note: You can also schedule a new report using an existing report
schedule. To do this, click Replicate Schedule instead of
Add (Insert), and then continue to follow the steps below.
4) In the Report Settings dialog box, click the Options tab.
5) On the Options tab:
a. In the Schedule Name field, enter a name that identifies the report schedule.
b. In the Template list, choose a template to apply to the report.
c. In the Format list, choose a file format for the delivery of the report.
d. Next to the Delivery Type field, click and enter or select e-mail addresses for
the intended report recipients.
e. In the Notification section, choose to send yourself status notification of the report
run.

P6 EPPM User's Guide
276
f. In the Report Parameters section, enter or choose values for the parameters
specified in the Field Name column.
Caution: To avoid system performance issues, be as specific as
possible when entering values for reports. Narrow down your
choices to include only what is absolutely necessary.
6) In the Report Settings dialog box, click the Schedule tab.
7) On the Schedule tab:
a. Select a recurrence pattern from the Run list.
b. In the Schedule Options section, complete the fields shown. The screen elements
in this section are dynamically updated based on your selection in the Run list.
For example, for Daily scheduled jobs, enter the Start Date, Finish Date, Run Time,
and select one or more days for the report to run.
8) In the Report Settings dialog box, click Save.
Running Reports On-Demand
Use this task to configure report settings and immediately run a report.
To run a report on-demand:
1) Click Reports.
2) On the Report page:
a. Click View and select Reports.
b. Select a report.
c. Click Run Report.
3) In the Report Settings dialog box:
a. In the File Name field, enter a file name for the report.
b. In the Template list, choose a template to apply to the report.
c. In the Format list, choose a file format for the delivery of the report.
d. In the Delivery Type list, choose to have the report sent through e-mail or display
the file immediately.
If you chose E-mail, click and enter or select e-mail addresses for the
intended report recipients.
If you chose File, the report will display after you click Run.
e. If you chose E-mail, in the Notification section, choose to send yourself a status
notification of the report run.
f. In the Report Parameters section, enter or choose values for the parameters
specified in the Field Name column.

Using Reports
277
Caution: To avoid system performance issues, be as specific as
possible when entering values for reports. Narrow down your
choices to include only what is absolutely necessary.
g. Click Run.
Viewing the Report Run History
Use this task to view the list of all runs for the selected report schedule since the last history
deletion.
Note: The run history is only captured for scheduled reports, or
on-demand reports delivered by e-mail.
To view the report run history:
1) Click Reports.
2) On the Reports page:
a. Click View and select Reports.
3) Select a report, and then click the Schedule detail window., select a schedule name
and click History.
4) On the History dialog box, review the recent report runs.
To clear the history, click Delete All History.
Click Save or Cancel to close the History dialog box.
Pre-defined BI Publisher Reports
This section lists and describes the pre-defined BI Publisher reports that are supplied with
P6. You can use these reports to display various types of project and portfolio data you
need. Your administrator can modify the list of reports available for your use, including
removing pre-defined reports or adding additional reports to your view.
Report Name Description Parameters
Activity Reports
Activity Look Ahead Displays activities, along with
dates and status, occurring
within specified weeks for the
selected projects.
Project ID, Number of
Weeks
Schedule Report with
Notebooks
Provides a list of activities for
the selected projects along
with all associated notebook
topics.
Project ID

P6 EPPM User's Guide
278
Cross Project
Relationships
Lists the projects and
associated activities that are
predecessors or successors to
the selected project,
providing visibility into cross
project impacts.
Project ID
Duration Analysis Compares planned and
actual duration of the
activities for the selected
projects along with upper and
lower thresholds to analyze
duration estimates.
Project ID
Activity Relationships Lists the activities for the
selected projects along with
their predecessors and
successors. Report includes
relationship type and lag
along with dates and float of
the related activities.
Project ID
Project Reports
High Level Planning
Assignments
A 9 month look ahead of high
level resources and roles
assigned to the selected
projects through the resource
planning spreadsheet.
Information includes effort,
commitment status and
dates.
Project ID
Qualitative Risk
Report
Reports on all risks for the
select projects. Includes risk
information, risk impact
assessment, impacted
activities, and risk response
plans.
Project ID
Issues Lists all issues identified for the
selected projects, grouped by
status. The issue details include
priority, criticality, and issue
description, if provided.
Project ID

Using Reports
279
Document
Assignments
Provides a list of all documents
assigned to activities and
WBSs within the specified
project, grouped by
document category.
Project ID
Project Earned Value Displays monthly actual cost,
earned value, and planned
value in both a bar chart
along with a table for the
selected projects.
Project ID
Project Status Report Provides a project overview
that includes project code
values, project costs, issues,
risks, status of the milestones,
and a list of notebook topics.
Project ID, Project Status
Project Governance
Non-Compliance
Report
Lists all projects and their
critical project-level settings.
Settings that deviate from the
standard are highlighted in
the report.
Project ID
Weekly Schedule
Performance
Compares the activity actual
finish date to the baseline
finish date. Activities are
grouped by week and
project. The report will display
information starting 4 weeks
prior to the date set in the
report parameters.
Project ID, 4 Weeks Prior
To: <date>
Risk Scoring Report of the project risk
scoring matrix. Includes
threshold definitions grouped
by type (Probability,
Schedule, Cost, User-defined,
and Tolerance) and numeric
and alphanumeric probability
and impact diagrams (PIDs).
Project ID

P6 EPPM User's Guide
280
Project Plan
Hierarchy
Displays the project plan
which lists all WBSs and
activities for the selected
project. The activity details
include the status, start and
finish dates, and the
associated activity steps.
Project ID
Portfolio Reports
Investment
Alignment Chart
Displays a bubble chart that
plots selected projects against
their strategic and financial
rating with the bubble size
representing the At
Completion Cost.
Project ID
Code Assignments Provides a list of projects for
the specified portfolio along
with the code values assigned
for the selected project code.
Project Code, Portfolio
Name
Project Portfolio
Review
Identifies issues and risks within
the selected portfolio and
groups them by project.
Includes status and priority of
the issue or risk along with
project-level information.
Portfolio Name
Portfolio Counts Provides a count of all
projects and activities within
the selected portfolio. In
addition, two pie charts
display representing the
number of open and closed
issues and risks.
Portfolio Name
Administrative Reports
Timesheets
Timesheets Status
without Notes
Lists timesheets for resources
along with the status,
submitted and reviewed
dates, and name of the last
reviewer.
NA

Using Reports
281
Timesheets Status
with Notes
Lists timesheets for resources
along with the status,
submitted and reviewed
dates, name of the last
reviewer, and associated
timesheet notes.
Number of Weeks
Timesheets with
Detailed Hours
Lists timesheets for the
specified date range. For
each timesheet, the activities
and detailed hours per day
are provided.
Start Date, End Date
Timesheet
Compliance
Displays a bar chart of
timesheets status by resource
team for a given period.
Includes a tabular view with
total number of approved
hours as well as percentage
completed versus those either
not started, in progress, or
rejected.
Timesheet Period Start,
Timesheet Period Finish
Project Template
Management
Lists all project templates
along with status, division, and
added by person and date.
NA
Calendar Use Lists all Global, Project, and
Resource calendars, including
identification of the projects
and resources using each
calendar.
NA
Project Governance
Non-Compliance
Report
Lists core project-level settings
for each project, highlighting
setting values that are not
compliant.
Project ID
Users Lists all users and their personal
name along with their
associated resource and
global security profile.
NA
Profile Privileges Lists the privileges that are
enabled for each global and
project-level security profile.
NA

P6 EPPM User's Guide
282
Users Project
Assignments
Displays OBS elements along
with the corresponding
security profile, EPSs, and
Projects assigned to selected
users.
User Name
Users OBS
Assignments
Displays all OBS elements
along with the corresponding
security profile assigned to
selected users.
User Name
Resource Reports
Resource Allocation
by Project
Displays a stacked histogram
that shows effort (in hours) for
selected resources, stacking
bars by project within the start
and end date ranges.
Project ID, Start Date, End
Date, Resource ID
Resource Role Skill
Sets
Lists all resources along with
their assigned roles. The
primary role and proficiency
level is identified for each role.
NA
Activity Resource
Assignments
Lists resources assigned to
each activity in the selected
projects. Information includes
start and finish dates along
with duration.
Project ID
Resource Stacked
Histogram
Displays a stacked histogram
that shows effort (in hours) for
selected resources, stacking
bars by resource within the
start and end date ranges.
Project ID, Start Date, End
Date, Resource ID
FTE (headcount)
report
Displays a list of roles assigned
to the selected project(s)
along with the amount of
time-phased effort for each
role, in full time equivalents, for
the specified date range.
Project ID, Start Date, End
Date
Resource Code
Assignments
Displays a list all resource
codes and resource code
values along with the
resources assigned to each
code value.
NA

Using Reports
283
Resource Role
Associations
Displays a list of all roles in the
system and the resources
assigned to each role. The
primary role and proficiency
level is identified for each
resource.
NA

285
P6 Progress Reporter provides real-time communication capabilities between resources
who perform project tasks and project managers or team leaders who use P6 EPPM to
plan and manage projects.
Team members working at diverse locations can connect directly to the project
database via local or wide area networks to report time on their activities and send
related information. Project managers can incorporate this data from resources into the
project update cycle, relying on reported actuals and activity status information to
update the project and make informed decisions. Activity feedback features and
timesheet notes facilitate communication.
Tips
To refresh data at any time, choose File, Refresh Data, or press F5.
In This Chapter
What Can I Do with P6 Progress Reporter? ......................................................... 285
Working in Timesheet View .................................................................................... 285
Working with Activities ............................................................................................ 292
What Can I Do with P6 Progress Reporter?
Project team members can use P6 Progress Reporter to
report work time for assigned activities
view and update activity assignments and activity details
view activity notebooks and work products and documents
send and receive notes about activities and timesheets
Working in Timesheet View
Overview of Timesheet View
You can open and view a timesheet and report actual work time if an administrator or
project manager has designated you as a timesheet user.
If you have not been designated as a timesheet user, the Timesheet view is not available
to you. Depending on the way your organization tracks actual work, you might be
required to report actual work time on the Activity Details Resources tab.
To display the Timesheet view, choose View, Timesheets (F12) or in the toolbar, click .
Introducing P6 Progress Reporter

P6 EPPM User's Guide
286
The administrator or project manager can set preferences that determine
Whether you record time on a daily basis or by reporting period, for example, report
actual total hours for a two-week period
The number of future timesheets you can access
If you have permission to record hours in unusual circumstances, for example, on a
timesheet with a future date, or for Not Started or Completed activities
If you are required to submit timesheets for approval
Whether you have view-only access to activities that are inactive
If an activity belongs to an inactive project or WBS, its status icon is slightly shaded. For
example, if you are the primary resource for an inactive Not Started activity, the icon
appears as . If you do have the capability to view inactive activities, you will be
able to view only those inactive activities that were added to a timesheet when they
were active. All timesheet total values (column, row, and grand total) include
inactive activities.
To customize the Timesheet view, you can
Choose the activity data columns you want to see.
Resize and sort the columns.
Adjust the width of the activity data and time reporting sections.
Choose the timesheet cell colors.
Choose to display tool tips for time reporting cells, these tips are useful for identifying
cell labels when using a screen magnifier.
For details about customizing the Timesheet view, see Customizing Timesheets and
Activities Views in Progress Reporter Help.
Opening a Timesheet
1) In Timesheet view, choose File, Open Timesheet (Alt+F+O) or in the toolbar, click .
2) Select the timesheet you want to open. By default, the timesheet for the current
period is selected.
Note: If no timesheets are listed, none have been generated for
you. Contact your P6 administrator or project manager for
assistance.
3) If you are opening a timesheet for the first time, select one of the following options:
Automatically add current activities to timesheet
This option adds all activities you are scheduled to work on during the timesheet date
range.
If you want to add activities scheduled during the timesheet period, but for which you
have completed your work (an Actual Finish exists for your assignment), choose the
Add completed resource assignments option.

Introducing P6 Progress Reporter
287
Manually add activities to timesheet
Use this option to select from a list of your activity assignments.
Copy activities from previous timesheet
This option automatically copies all activities included in the previous timesheet listed.
This option is not available if the previous timesheet is Not Started.
If you want to copy activities scheduled during the timesheet period, but for which
you have completed your work (an Actual Finish exists for your assignment), choose
the Copy completed resource assignments option. An administrative setting
determines whether you are allowed to report actual hours for completed
assignments or activities.
To add your currently scheduled activities to the new timesheet, mark the Add
current activities checkbox.
Note: If a project's status has changed from active since the last
timesheet, activities for that project will not be copied from the
previous timesheet.
4) If you chose the Manually add activities option, the Add Activity window opens.
Select one or more activities, choose Add (Alt+A), then Close (Alt+C).
Navigating in a Timesheet
To move across table cells, press Tab or the Arrow keys.
To move up or down in a table, press the up or down arrow keys.
To clear data in a cell, press the spacebar.
To navigate out of a table to other elements in the window, press Ctrl+Tab.
To sort a table, based on a specific column, Tab or Arrow to the column, then press
Ctrl+Alt+A for ascending order or Ctrl+Alt+D fro descending order.
To move focus to the first activity data cell of the first row, press Ctrl+1.
To move focus to the activity detail tabs, if displayed, press Ctrl+2.
To select the next activity in the timesheet, press Ctrl+J. To select the previous activity,
press Ctrl+K. These shortcuts are particularly useful when the current focus is in the Activity
Details, since it enables you to scroll through activities in the timesheet as you review
detail information across various tabs.
To move focus to the title bar, or timesheet header, press Ctrl+H. This shortcut is
particularly useful when your current focus is on details for a specific activity and you
want to navigate to the time reporting cells to record actuals for that activity. Using
Ctrl+1 would change your activity selection to the first activity, while using Ctrl+H
maintains your selection and you can then use Ctrl+Tab to place focus in the time
reporting cells..

P6 EPPM User's Guide
288
Accessibility Tip: To display tool tips for timesheet reporting cells, choose File, User
Preferences (Alt+F+U). On the Accessibility tab, mark the Display tool tips checkbox and
choose OK. When using a screen magnifier, these tool tips aid table cell identification.
To change the size of the activity data or time reporting sections of the spreadsheet,
press F8, then press arrow keys to resize. Press F6 to exit sizing.
Adding Activities to a Timesheet
1) To add a work activity, choose Action, Add Activity (Alt+A+A) or in the toolbar, click
.
Note: You can also press the Insert key to add an activity. However,
if you are using a screen reader, Insert is not supported for this
action.
To add an overhead activity, choose Action, Add Overhead Activity (Alt+A+O) or in
the toolbar, click .
2) Select one or more activities, then choose Add (Alt+A).
Note: Before selecting activities, choose View, Refresh Data (F5) to
be certain the activity list you choose from is up to date
3) When finished, Close (Alt+C) the window.
The Add Activity window lists all of your In Progress activities. For Not Started and
Completed activities, the list includes activities that fall within the time range specified
in your user preferences. For additional information about the Timeframe user
preference, see Timeframe Tab in Progress Reporter Help.
Assigning Yourself to an Activity
1) On the toolbar choose (Alt+A+N).
2) Select the project you want to assign yourself to.
To quickly find a project, you can search for it based on any of the listed fields: ID,
name, or responsible manager. See Searching for Data (on page 291).
Note: A project-level setting determines whether a project is listed
so you can assign yourself to its activities. If you need to assign
yourself to a project that is not listed, contact your project
manager or P6 administrator.
3) In the Search for Activities section, choose one of the following options, then specify
your search criteria and choose Search (Alt+S).

Introducing P6 Progress Reporter
289
Activities Assigned to Parent Resource - for the project you selected, lists all activities
of the resource hierarchy element to which you are assigned in the project
management database. The parent resource is generally the larger department or
organization for which you work. For example, a salesperson might be assigned to an
element of the resource hierarchy called Region 1 Sales. In this case, search would
return all activities assigned to Region 1 Sales.
Activity ID - returns the list of activities that meet the criteria you enter in the Search
entry field.
Note: You can use the asterisk (*) and percent symbol (%) wildcard
characters in the search criteria. For example, to find all activities
that begin with AB, type AB* or AB%. If you type only a wildcard
character, the search finds all activities in the project.
4) From the search results, select the activities you want to assign, using Ctrl+Click or
Shift+Click to select multiple activities.
To quickly find an activity, you can search for it based on any of the listed fields: ID,
name, or primary resource.
5) Choose Assign (Alt+A). Or, if you currently have a timesheet open, you can assign
yourself to the activity and automatically add it to the open timesheet by choosing
Assign and Add.
6) Click Close (Alt+C).
Removing Activities from a Timesheet
1) To remove an activity, select it in the timesheet, then choose Action, Remove Activity
(Alt+A+R) or in the toolbar, click .
Note: You can also press the Delete key to remove the currently
selected activity.
2) To confirm, choose Yes.
Recording Actual Work Time on a Timesheet
Accessibility Tip: To display tool tips for timesheet reporting cells, choose File, User
Preferences (Alt+F+U). On the Accessibility tab, mark the Display tool tips checkbox and
choose OK. When using a screen magnifier, these tool tips aid table cell identification.
1) If your timesheet uses daily reporting format, select the cell that corresponds to the
activity and date for which you want to enter time.
If your timesheet uses period reporting format, select the Actual Hours cell that
corresponds to the activity for which you want to enter time.
2) Type the number of regular hours you worked on the activity. The maximum allowable
value is 100,000 hours.

P6 EPPM User's Guide
290
To record overtime for an activity, type a slash after the number of regular hours, then
type the number of overtime hours. For example, to enter eight regular and three
overtime hours, type 8/3.
Note: An administrative setting determines whether you have the
capability to log overtime hours.
To clear a cell value, press the spacebar or Delete.
If you finish an assignment, you can report your work as completed on the Activity Details
Resources tab. For more information, see Reporting a Completed Assignment (on page
297).
Adding or Viewing Timesheet Notes
1) Choose View, Timesheet Notes (Alt+V+N) or in the toolbar, click .
Note: When there are existing Notes for a timesheet, the icon is
yellow; it is white when there are no notes associated with the
timesheet.
2) Type in the New Notes section, then choose Add (Alt+A). The most recently added
notes display at the top of the Notes History section.
3) When finished, choose Close (Alt+C).
Submitting a Timesheet
A P6 administrator or project manager specifies settings that determine whether you are
required to submit timesheets for approval. If your timesheets are set for auto-submission,
the Submit current timesheet feature will be unavailable.
Once you submit a timesheet, you will not be able to change it unless it is rejected by
your time approval manager. If a timesheet is rejected, you will receive a notification in
P6 Progress Reporter to correct and resubmit the timesheet.
To submit a timesheet, choose File, Submit Timesheet (Alt+F+S) or on the toolbar, click
. Choose Yes to confirm.
Saving or Printing a Timesheet
You can export the contents of an open timesheet to an HTML file that you can save or
print using the features of your browser.
To save or print a timesheet, choose Action, Generate Report (Alt+A+G).
If a timesheet includes a large number of activity data columns, before the report file
displays, you are prompted to include only the first three columns in the report to ensure
that it fits within the margins of a printed page. All time reporting columns are always
included in a timesheet report.

Introducing P6 Progress Reporter
291
Closing a Timesheet
Choose File, Close Timesheet (Alt+F+C).
Viewing Your Project List and Project Web Sites
In the Activities and the Timesheet views, you can display a list of the projects you are
currently assigned to work on.
1) On the toolbar, click (Alt+V+P).
To quickly find a specific project, you can search (Ctrl+F) based on the field, or
column, that currently has focus in the Projects window. See Searching for Data (on
page 291).
2) To launch a project's Web site, if available, select the project, then choose Launch
(Alt+L).
To sort the projects list
mouse - Click the title of the column you want to sort by. Click again to change the sort
order.
keyboard - Tab or arrow to a cell in the sort column. To sort in ascending order, Press
Ctrl+Alt+A, or for descending sort, press Ctrl+Alt+D.
Searching for Data
Within any P6 Progress Reporter pages or windows that present data in a row and
column format, you can search for specific items, based on a data field you select. For
example, in the Open Timesheet window, you can search for a timesheet based on Start
Date or Status.
1) In any row, place focus in the column that corresponds to the field you want to
search on.
2) Press Ctrl+F.
3) Specify the search criteria, then choose Find Next (Alt+N).
The first result is highlighted in the list. Pressing Find Next (Alt+N) cycles through the results,
returning to the beginning after you have reached the last result.
P6 EPPM User's Guide
292
Working with Activities
Displaying a List of Your Activities
In the Activities view, you can list the activities you are assigned to work on, along with
basic details in a table format. You can filter and sort the list and customize the data
columns that appear. You can also search for activities based on any of the detail fields
currently displayed in the columns. For additional information, see Searching for Data (on
page 291).
To display the Activities view, choose View, Activities (F11) or in the toolbar, click .
Note: If you are not designated as a timesheet user, the Activities
view is the only view available to you, so it is displayed when you
log in. In this case, the option is not available in the View menu or
on the toolbar
In the Activities view, you can also assign yourself to activities and display additional
details for any activity you select. If you are the primary resource on an activity, you can
edit certain details.
Filtering and Sorting the Activity List
Unless you apply a filter, the Activities view lists all activities assigned to you. You can filter
the view based on activity status.
To filter the activity list, select an activity. Right-click and choose Filter By (Alt+V+F) and
one of the following options.
All Activities (Alt+V+F+A)
Completed Activities (Alt+V+F+C)
In Progress/Not Started Activities (Alt+V+F+P)
Display of these activities is also filtered based on a timeframe you specify in User
Preferences.
Milestones (Alt+V+F+M)
In Review/Rejected Activities (Alt+V+F+R)
There are two circumstances in which an activity's status can be In Review.
An activity's status is In Review when the primary resource applies an Actual Finish to
the activity, but the Finish has not yet been confirmed by the person responsible for
approving status. An activity's status is also In Review if the project is set up to allow
resources to change the status of their assignments to Completed, but status review is
required before an Actual Finish is applied to the activity. In this case, once all
resources assigned to the activity have changed their assignment status to
Completed and Apply Actuals is run, the activity is placed In Review.
A Rejected activity is one that had been In Review, but the Finish status has been
rejected by the person responsible for approving it.

Introducing P6 Progress Reporter
293
Note: A project-level preference determines whether you have
view-only access to inactive activities. If an activity belongs to an
inactive project or WBS, its status icon is slightly shaded. For
example, if you are the primary resource for an inactive Not
Started activity, the icon appears as .
Beneath the toolbar, a title bar identifies the current filter. This title bar also displays the
timeframe used to filter the display of Not Started and Completed activities, which you
can specify as a user preference.
To filter Not Started and Completed activities
1) Choose File, User Preferences (Alt+F+U).
2) Choose the Timeframe tab.
3) For each activity status type, specify a number that defines the boundaries of the
timeframe relative to the current date. For example, 90 defines a timeframe 90 days
before and 90 days after today.
Not Started activities with a planned start or planned finish within the timeframe and
Completed activities with an actual finish in the timeframe will be displayed.
To sort the activity list
Mouse - Click the title of the column you want to sort by. Click again to change the sort
order.
Keyboard - Tab or arrow to a cell in the sort column. To sort in ascending order, Press
Ctrl+Alt+ Up Arrow, or for descending sort, press Ctrl+Alt+Down Arrow.
Selecting Activity Data Columns
To select activity data columns:
1) With focus in an activity data cell, in the toolbar, click (Shift+F10+L).
2) To add one or more columns, choose them in the Available Columns list, then choose
(F6). To add all available columns, choose .
To remove one or more columns, choose them in the Selected Columns list, then
choose (F6). To remove all selected columns, choose .
Keyboard Tip: To add all columns, place focus in the Available Columns list or, to
remove all columns, place focus in the Selected Columns list. Then, press Alt+F6.
3) To specify the position in which a column appears, choose it in the Selected Columns
list, then choose (F7) or (Alt+F7) to change its position.
4) To preview your column selections without closing the Columns window, choose
Apply (Alt+A).
5) To return to the standard column selections, choose Default (Alt+D).
P6 EPPM User's Guide
294
6) When finished, choose OK (Alt+O).
Saving or Printing Your Activity List
You can export the contents of your activity list to an HTML file that you can save or print
using the features of your browser.
To save or print an activity list, choose Action, Generate Report (Alt+A+G).
Assigning Yourself to an Activity
1) On the toolbar choose (Alt+A+N).
2) Select the project you want to assign yourself to.
To quickly find a project, you can search for it based on any of the listed fields: ID,
name, or responsible manager. See Searching for Data (on page 291).
Note: A project-level setting determines whether a project is listed
so you can assign yourself to its activities. If you need to assign
yourself to a project that is not listed, contact your project
manager or P6 administrator.
3) In the Search for Activities section, choose one of the following options, then specify
your search criteria and choose Search (Alt+S).
Activities Assigned to Parent Resource - for the project you selected, lists all activities
of the resource hierarchy element to which you are assigned in the project
management database. The parent resource is generally the larger department or
organization for which you work. For example, a salesperson might be assigned to an
element of the resource hierarchy called Region 1 Sales. In this case, search would
return all activities assigned to Region 1 Sales.
Activity ID - returns the list of activities that meet the criteria you enter in the Search
entry field.
Note: You can use the asterisk (*) and percent symbol (%) wildcard
characters in the search criteria. For example, to find all activities
that begin with AB, type AB* or AB%. If you type only a wildcard
character, the search finds all activities in the project.
4) From the search results, select the activities you want to assign, using Ctrl+Click or
Shift+Click to select multiple activities.
To quickly find an activity, you can search for it based on any of the listed fields: ID,
name, or primary resource.
5) Choose Assign (Alt+A). Or, if you currently have a timesheet open, you can assign
yourself to the activity and automatically add it to the open timesheet by choosing
Assign and Add.
6) Click Close (Alt+C).

Introducing P6 Progress Reporter
295
Viewing Activity Details
You can display details for any activity you select in the Activities view.
To show or hide Activity Details, on the toolbar choose (Shift+F10+Down Arrow+ Enter
or space).
Activity Details are displayed on six tabs that include information such as start and finish
dates, feedback from the project manager, resource information, notebooks, step
details, predecessor/successor information, and work product and document details.
Keyboard Tips: To navigate among the Activity Detail tabs, place focus on the tab
name, then press the right or left arrow. To navigate among elements within a tab, press
Tab. To activate an element, such as a button, or choose a radio button or checkbox
option, press the spacebar. OK = Alt+O. Cancel = Alt+C.
With focus in the detail tabs, you can press Ctrl+J and Ctrl+K to scroll through the
activities in your activity list so you can more easily review details for a number of
activities. Ctrl+J selects the previous activity; Ctrl+K selects the next activity.
For more information about each detail tab, see Activity Details Tabs in Progress Reporter
Help.
Reporting Actual Work Time without a Timesheet
If you are not required to use timesheets to report actual work time for your activities, you
can report work time on the Activity Details Resources tab. Whether you are or are not
required to use a timesheet to report actual work time, you can use the Activity Details
Resources tab to indicate that you have completed an activity assignment.
If you are the primary resource for an activity, you can also report actuals for nonlabor
and material resources on this tab.
Note: You can also report estimates of remaining work on the Activity Details Resources
tab. For additional information, see Reporting Remaining Work Estimates (on page 296).
1) Select the activity in the Activities view or open timesheet.
2) On the toolbar choose (Shift+F10+Down Arrow+ Enter or space) to display Activity
Details.
3) Choose the Resource tab.
4) In the Assigned Resources list, choose your name, or the nonlabor/material resource
name.
5) In the Prior Actual Units field, type the hours worked on the activity. To enter hourly
overtime, for example, eight regular and three overtime hours, type 8/3.
The actual units you record are pending for the activity and can be modified by the
project manager. Depending on your organization's processes, the progress you
report on this tab can be used to update the project when actuals are applied.

P6 EPPM User's Guide
296
6) To report that you have completed an assignment, mark the Completed checkbox.
A project-level option determines if you can record your assignments as completed. If
this feature is not turned on, the completed checkbox is disabled.
Tips
A P6 Progress Reporter user preference lets you choose to hide your completed
assignments on the Resources details tab and in your timesheets. If this preference is
set to not display completed assignments, "Filtering Completed Assignments" appears
above the column headings on the Resources tab and, when you mark the
Completed checkbox, the assignment is immediately removed from the list on the
Resources tab.
To quickly locate a specific activity or resource, use the search capability, which
enables you to find items based on a displayed data field you select. See Searching
for Data (on page 291).
Reporting Dates for an Activity
The Activity Details General tab displays the start and finish dates calculated for the
activity. If you are the primary resource, you can use this tab to report actual start and
finish dates for an activity and to report the date you expect work for the activity to be
completed.
Note: You can report your estimate of remaining work on the
Activity Details Resources tab.
To report dates
1) Select the activity in the Activities view or open timesheet.
2) On the toolbar choose (Shift+F10+Down Arrow+ Enter or space) to display Activity
Details.
3) Select the General tab.
4) For start and finish dates
Mark the Started or Finished checkbox, as appropriate. Then either type in the
corresponding date field, or choose the calendar button to select a date.
For expected finish date
In the Expected Finish Date field, type the date you expect work for the activity to be
completed, or choose the calendar button to select a date.
Reporting Remaining Work Estimates
The Activity Details Resources tab displays the number of remaining units calculated for
an activity. For your in progress activities, you can use this tab to report your estimate of
remaining work. If you are the primary resource for an activity, you can also report
remaining work estimates for nonlabor and material resources.

Introducing P6 Progress Reporter
297
The estimates you enter are pending and can be modified by the project manager
before actuals are applied to the project.
A project-level administrative setting determines whether you estimate progress on
started activities in terms of New Remaining Units or Percent Complete.
To report estimates
1) Select the activity in the Activities view or open timesheet.
2) On the toolbar choose (Shift+F10+Down Arrow+ Enter or space) to display Activity
Details.
3) Choose the Resources tab.
4) In the Assigned Resources list, choose your name, or the nonlabor/material resource
name.
5) Record estimates in the format required by the project, either New Remaining Units or
Percent Complete. The field that displays reflects this setting.
In the New Remaining Units field, type the number of work periods you will need to
complete the activity.
In the Percent Complete field, type the percentage of work you have already
completed for the activity.
The estimated values you record are pending for the activity and can be modified by
the project manager before actuals are applied to update the project.
Tip
To quickly locate a specific activity or resource, use the search capability, which enables
you to find items based on a displayed data field you select. See Searching for Data (on
page 291).
Reporting a Completed Assignment
The Activity Details Resources tab lists all resource assignments for an activity, along with
details such as remaining units. When you finish a work assignment, if your project allows,
you can mark the assignment as completed on the Resources tab.
To report a completed activity assignment
1) Select the activity in the Activities view or open timesheet.
2) On the toolbar choose (Shift+F10+Down Arrow+ Enter or space) to display Activity
Details.
3) Choose the Resources tab.
4) In the Assigned Resources list, choose your name, then mark the Completed
checkbox.
A project-level option determines if you are permitted to record your assignments as
completed. If this option is not turned on, the completed checkbox is disabled.

P6 EPPM User's Guide
298
Note: A P6 Progress Reporter user preference lets you choose to
hide your completed assignments on the Resources details tab
and in your timesheets. If this preference is set to not display
completed assignments, "Filtering Completed Assignments"
appears above the column headings on the Resources tab and,
when you mark the Completed checkbox, the assignment is
immediately removed from the list on the Resources tab.
Tip
To quickly locate a specific activity, use the search capability, which enables you to find
items based on a displayed data field you select. See Search for data (on page 291).
Viewing and Reporting Progress for Activity Steps
The Activity Details Steps tab lists existing activity steps and their status.
1) Select the activity in the Activities view or open timesheet.
2) To display Activity Details, on the toolbar choose (Shift+F10+Down Arrow+ Enter or
space).
3) Choose the Steps tab.
If you are the primary resource, you can identify steps that are completed by marking
the checkbox on this tab.
You can customize the data columns on the Steps tab to display percent complete and
user defined fields. If you are a primary resource with the appropriate administrative and
security settings, you can edit user defined fields associated with steps.
To customize the Steps data columns, select a step row or the Steps tab name and
press Shift F10+Enter.
To edit a user defined field, select the field and type new data.
Keyboard Tips: To clear all data in a selected field, press F2+Delete. For a date UDF, to
display the calendar window, press Ctrl+F2.
Tip
To quickly locate a specific activity or step, use the search capability, which enables you
to find items based on a displayed data field you select. See Searching for Data (on
page 291).
Viewing and Sending Activity Feedback
On the Activity Details General tab, all resources assigned to an activity can view notes
sent by the project manager.
If you are the primary resource, you can also send notes to the project manager. All
resources assigned to the activity can read notes recorded by the primary resource.

Introducing P6 Progress Reporter
299
To view or send notes related to an activity
1) Select the activity in the Activities view or open timesheet.
2) On the toolbar choose (Shift+F10+Down Arrow+ Enter or space) to display Activity
Details.
3) Select the General tab.
4) To send notes, choose Feedback to PM.
5) To view notes, choose Notes from PM.
Viewing Your Project List and Project Web Sites
In the Activities and the Timesheet views, you can display a list of the projects you are
currently assigned to work on.
1) On the toolbar, click (Alt+V+P).
To quickly find a specific project, you can search (Ctrl+F) based on the field, or
column, that currently has focus in the Projects window. See Searching for Data (on
page 291).
2) To launch a project's Web site, if available, select the project, then choose Launch
(Alt+L).
To sort the projects list
mouse - Click the title of the column you want to sort by. Click again to change the sort
order.
keyboard - Tab or arrow to a cell in the sort column. To sort in ascending order, Press
Ctrl+Alt+A, or for descending sort, press Ctrl+Alt+D.
Searching for Data
Within any P6 Progress Reporter pages or windows that present data in a row and
column format, you can search for specific items, based on a data field you select. For
example, in the Open Timesheet window, you can search for a timesheet based on Start
Date or Status.
1) In any row, place focus in the column that corresponds to the field you want to
search on.
2) Press Ctrl+F.
3) Specify the search criteria, then choose Find Next (Alt+N).
The first result is highlighted in the list. Pressing Find Next (Alt+N) cycles through the results,
returning to the beginning after you have reached the last result.


301
Import/Export features allow you to bring data into P6 as well as export data to other
tools when needed.
Available Import Options:
Import Projects from other Oracle Primavera users or Microsoft Project
Import Activities
Import Resources
Import Appointments as personal non-work exception time from Microsoft Outlook
and other applications that support the iCalendar format
Available Export Options:
Export Projects
Export Activities
Export Resources
Export Resource Allocation and Cost
Export Project Data to an ERP System
Importing Activities from Excel
You can import new activities into a P6 project from a Microsoft® Excel® (.xls) file.
To import activities:
1) Open one or more projects in the Projects section using one of the following methods:
Click Projects to open the last project or group of projects you were working
with.
Click the Projects menu and choose one of the most-recently used projects
or group of projects.
Click the Projects menu and choose Open Projects to select a project or
group of projects by portfolio type, EPS node, or project code.
2) On the Projects navigation bar, click Activities.
3) On the Activities page, click the Actions menu and select Import/Export
Import from Excel.
4) In the Import Activities dialog box:
a. Click Import File and select a file from the dialog box.
b. Click Select Project and select a project from the dialog box.
c. Click Import.
About Importing and Exporting Data

P6 EPPM User's Guide
302
5) On the Activities page, click the Actions menu and select Save (Ctrl+S).
Tips
The import file must be in Microsoft® Excel® (.xls) format.
Exporting Activities to Excel
You can export activity data to a Microsoft® Excel® (.xls) file.
To export activities:
1) Open one or more projects in the Projects section using one of the following methods:
Click Projects to open the last project or group of projects you were working
with.
Click the Projects menu and choose one of the most-recently used projects
or group of projects.
Click the Projects menu and choose Open Projects to select a project or
group of projects by portfolio type, EPS node, or project code.
2) On the Projects navigation bar, click Activities.
3) On the Activities page:
a. Select a view from the Activity View list.
b. Configure the activity view to determine what data are exported. See Configuring
Activity Views (on page 135).
c. Click the Actions menu and select Import/Export Export to Excel.
4) In the File Download dialog box, click Open to open the Excel spreadsheet or Save to
save the file to your computer.
Tips
All data, except grouping row information, are exported as they appear in the current
activity view.
Creating Import Templates
Create a Microsoft® Excel® template to use when importing new activities into a P6
project.
To create import templates:
1) Open one or more projects in the Projects section using one of the following methods:
Click Projects to open the last project or group of projects you were working
with.
Click the Projects menu and choose one of the most-recently used projects
or group of projects.

About Importing and Exporting Data
303
Click the Projects menu and choose Open Projects to select a project or
group of projects by portfolio type, EPS node, or project code.
2) On the Projects navigation bar, click Activities.
3) On the Activities page:
a. Select an activity view from the Activity View list and configure it to include the
columns you want in the import template. See Configuring Activity View Columns
(on page 137).
b. Click the Actions menu and select Import/Export Create Import Template.
4) In the File Download dialog box, click Open to modify the template or click Save to
save and close it.
Tips
The import template is created as a Microsoft Excel file with the default file name,
ExportDataToSpreadsheet.
When you select columns for your activity view, include Activity ID or Activity Name to
ensure that these fields are added to the import file spreadsheet. These fields are
required in the spreadsheet to ensure that activities added during import are uniquely
identified in your project when the import has completed.
Exporting Risk Data
Risks data can be saved to an Excel spreadsheet (*.xls). All data is exported as it appears
in the current view. Customize the rows to display only the data you want to export.
To export risk data:
1) Click Projects.
2) On the Projects navigation bar, click Risks.
3) On the Risks page, customize the table using the customize features. The fields that
are visible on the page are the fields that are exported to the Excel spreadsheet.
Click Select Columns to select the columns you want displayed in the
spreadsheet.
Click Customize Filter to filter the data by an existing filter, or create a new filter
to customize your view.
4) Click Export to Excel.
If prompted, select whether you want to open or save the export file.

P6 EPPM User's Guide
304
Exporting a List of Reports
Use this task to save a customized list of available reports to a Microsoft® Excel
spreadsheet (*.xls).
All data is exported as it appears in the current view.
To export a list of reports:
1) Click Reports.
2) On the Reports page:
a. Click View and select Schedules or Reports.
b. Modify the table to view only the list of reports you want to export.
Expand or collapse group headings.
Click Columns. Choose any additional columns you would like to
display in the spreadsheet. A check mark indicates the column is selected.
You can also remove columns by clicking on a column name with a check
mark.
c. Click Export to Excel.
If prompted, choose whether you want to open or save the export file.

305
This section highlights some functions that are available only in P6 Professional.
In This Chapter
Reflection Projects .................................................................................................. 305
Future Period Bucket Planning .............................................................................. 312
Editing Past Period Actual Spreads ...................................................................... 343
Project Check Out and Check In ......................................................................... 344
Import from Contract Management ................................................................... 346
Reflection Projects
What is a reflection
A reflection is a copy of a project that has the following characteristics:
1) Has the same name as the original source project with reflection appended to it.
2) Internally, contains a link to the source project that allows the application to merge
changes to the reflection into the source project.
3) Has a what-if status.
After creating a reflection, you can make changes to it. You can then merge selected
changes back into the source project keeping active data in the source project intact.
Creating a reflection facilitates the following work flows and processes:
Creating a sandbox area to test different project scenarios.
Reviewing changes made by team members to activities they own in a reflection.
Using the reflection as an intermediary project lets you review and accept
changes before merging the reflection back into the source project.
Reviewing changes to a project by exporting a reflection as an .XER file. You can
send the .XER file to outside users who can import the file into their database. After
making changes to the project, the outside users can export the file and send the
resulting .XER file back to you. By importing the .XER file back into your reflection,
you can decide which changes to keep when you merge the reflection back into
the source project.
P6 Professional

P6 EPPM User's Guide
306
Creating and using reflections
Follow this procedure to create and use reflections.
1) Create a reflection. (see "Create a Reflection" on page 306)
2) Make changes to the reflection.
3) Preview the changes to the project. (see "Merging a Reflection with the Source
project" on page 307)
4) Optionally, print a report (see "Printing a reflection difference report" on page 307) of
the changes to the project.
5) Merge (see "Merging a Reflection with the Source project" on page 307) selected
changes into the source project.
Create a Reflection
Follow this procedure to create a reflection of a source project. The reflection you create
will have the same name as the source project with an incremental number appended
to it.
Notes:
The Create Reflection context menu will only be available when selecting a
project under an EPS node in which you have the privilege to create projects.
Generally this means that the Responsible Manager assigned to the EPS node in
which the project resides must be assigned to your user name with a profile that
includes the "Create Project within EPS" project privilege.The Create Reflection
context menu will only be available when selecting a project under an EPS node
in which you have the privilege to create projects. Generally this means that the
Responsible Manager assigned to the EPS node in which the project resides must
be assigned to your user name with a profile that includes the appropriate project
privilege as defined in P6.
Project Managers can use the Reflection project and Activity Owner features
together to collect and review activity status information reported by users with
Team Member module access assigned in P6.
Create a reflection
1) In the Projects view, right click on the project for which you want to create a
reflection.
2) In the context menu, click Create Reflection. If the project does not contain any
baselines, the system responds by creating a reflection. Otherwise, the system
responds by displaying the Copy Baselines dialog box. For any baselines you want to
copy, mark checkbox(s) in the Copy column of the Copy Baselines dialog box and
click OK. The system responds by creating a reflection.

P6 Professional
307
Make changes in the reflection
Once a reflection has been created, you can make changes to the reflection as
needed to explore alternative project scenarios.
Printing a reflection difference report
The Preview Changes to Project dialog box provides a print function that allows you to
print a report that lists the differences between the reflection and the source project.
1) In the Projects view, right click on the reflection that you want to print a difference
report.
2) In the context menu, click Merge Reflection into Source Project. If there are any
changes to merge, the system responds by displaying the Preview changes to project
dialog box.
3) In the Group Changes By, choose how you would like group the changes.
4) Expand or collapse the nodes as you would like the information to be displayed in the
printout.
5) Right click anywhere inside the grid and choose Print Preview from the context menu.
6) To set the default printer, paper size, and page orientation, click
7) Click to print the difference report.
Merging a Reflection with the Source project
Creating a reflection allows you to make a copy of a project known as a reflection.
Once a reflection has been created, you can make changes to the reflection as
needed to explore alternative project scenarios. Then, you can merge these updates to
the original project, allowing you to keep active project data intact. This topic assumes
that you have already created a reflection (see "Create a Reflection" on page 306), you
have made changes to the reflection and are ready to either preview and/or merge
selected changes into the source project.
Notes:
The Merge Reflection into Source Project context menu will only be available
when selecting a reflection to which you have superuser access. You will also
need superuser access to the source project associated with the reflection.
Additionally, the source project cannot be opened exclusively by another user nor
can it be checked out.

P6 EPPM User's Guide
308
Changes you make to the following fields in a reflection project will result in new
entries being added to the source project when you merge a reflection into the
source project: Project ID, Activity ID, Resource ID, Role ID, Cost Account, and
Price/Unit. For example, assume that the source project contains an activity with
an Activity ID of A1000. After creating a reflection, you change the Activity ID from
A1000 to A1005 in the reflection project. Then, when you merge the reflection
project into the source project, the source project now contains two activities,
A1000 and A1005, which are identical except for the Activity ID.
Preview changes to be merged
Begin by previewing the changes.
1) In the Projects view, right click on the reflection that you want to merge with the
source project.
2) In the context menu, click Merge Reflection into Source Project. If there are any
changes to merge, the system responds by displaying the Preview Changes to Project
dialog box.
Choose changes to merge
Next, choose changes from the reflection to merge into the source project. There are
two ways the changes can be viewed, or grouped, in the Preview Changes to Project
dialog box: by subject area or by activity. The default is by activity. When you view the
changes by activity, check boxes appear in the Merge column for activity rows. This
allows you to select which activities to merge into the source project.
Notes:
By default, if there are any activities with changes, all activity check boxes will be
marked.
Marking or clearing an activity check box in the Activity grouping has a
corresponding affect in the Subject Area grouping even though the check boxes
are not available. Ensure the Activity radio button is marked if you need to
understand or change which activities are to be merged.
1. In the Group Changes By, choose how you would like group the changes.
2. If you choose Activity in step 1, select activities to be merged by marking the
appropriate Merge checkbox in the Merge column.
Tip:
If the application has detected activities that have changed, two buttons will be
enabled: Select All and Clear All. You can use these buttons to save time if you
have a lot of activities to consider. For example, suppose you knew that there
were only two activities that should be merged out of a large number of changed
activities. In this example, you could save time by clicking the Clear All and then
marking only the two that should be merged.

P6 Professional
309
Determine actions the application should take prior to merging
Under Prior to merging, mark the appropriate check box.
1) Mark the Create a copy of the source project as a baseline if you would like to create
a baseline in the source project with the name of the project with - Bx appended to it,
where x is an incremented number.
2) Mark the Create a backup file of source project if you would like export the project to
an .xer file. You could use this file to rollback the source project after the merge.
Determine actions the application should take after merging
Under After merging, mark the appropriate check box.
1) Mark the Keep reflection check box if you would like the application to keep the
reflection in the EPS after the reflection is successfully merged.
2) Mark the Delete reflection check box if you would like the application to delete the
reflection from the EPS after the reflection is successfully merged.
3) Mark the Replace reflection checkbox if you would like to replace the reflection with
an updated reflection based on the current data in the source project after the
merge.
Note
If you choose the Replace reflection option, the new reflection will be created
with the same baselines that were in the original reflection.
Merge the changes
If for whatever reason, you decide not to merge the changes in the Reflection into the
Source project, click Cancel and no changes will be made to the source project.
Otherwise, click Merge Changes to merge the changes into the source project.
Notes
We suggest opening and scheduling the source project after merging changes
into it.
When you export resource assignments to an XLS file, only the lowest level of cost
accounts associated with resource assignments is exported to the XLS file. For
example, assume your cost account hierarchy has a cost account named CA,
with a subordinate level named CA.A. If you assign the cost account CA.A to a
resource assignment, when you export resource assignments to an XLS file, the XLS
file displays "A" as the cost account, not "CA.A." If you then import this XLS file to
the same project in P6 Professional, in some cases, a duplicate resource
assignment will be created that lists "A" as the assigned cost account for the
duplicate resource assignment.

P6 EPPM User's Guide
310
Using Reflection projects and Activity Owner features to collect and review activity status
The Reflection project and Activity Owner features can be used together to collect and
review activity progress information from project team members who are not assigned as
activity resources.
A Reflection project is a copy of an active project that can be used for what-if analysis.
However, unlike a standard what-if project, a Reflection offers the capability to review all
changes and specify which, if any, should be merged into the active source project.
An Activity Owner who has Team Member module access (defined in P6) and the
required security privileges can update the activity's status and other details in P6. By
offering an Activity Owner OBS access to a Reflection project, rather than its associated
active source project, Project Managers can collect the data they require and have the
ability, through a review process, to ensure data integrity for the active project.
To implement these activity status reporting and review capabilities, do the following:
For the appropriate users, grant the required Team Member module access
(assigned using P6), OBS access, and security privileges.
Ensure that these users have access only to the OBS associated with the Reflection
project. If an activity owner is granted OBS access to the source project, their
changes will be incorporated into the active project without the review
opportunity that a Reflection project provides.
So that they can edit activities for which they are designated as Owner, Team
Members must be granted the required project privileges.
Designate owners for activities.
Create the Reflection project (on page 306), assigning it to the appropriate OBS.
Review and merge changes from the Reflection project to the source project (on
page 307).
Note
Regardless of security privilege settings, users with Team Member module access
(assigned using P6) can not add, delete, or edit WBS elements and they can not
add or delete activities or delete resource assignments.
Frequently asked questions about reflections
Q. Can I view the link in the reflection to the source project?
A. Yes. Use the following procedure to view the link
1) From the Enterprise menu, select Projects.
2) From the View menu, select Columns, then select Customize.
P6 Professional
311
3) In the General section of the Available Options column, select Source Project and
click to move the Source Project field into the Selected Options column.
4) Use the and buttons to move the field's position.
5) Click OK. The system responds by displaying the name of the Project ID in the Source
Project field of reflection projects. Note that this field is read-only.
Q. Can I have multiple reflections pointing to the same source project?
A. Yes.
Q. What happens to the reflection when I delete the source project?
A. The link is deleted from the source project field in the reflection.
Q. Why don't I see the Create Reflection menu option when I right click on a project?
A. The right click option is hidden when any of the following is true:
A group band node is selected
More than one project is selected
Q. Why is the Create Reflection menu option disabled when I right click on a project?
A. The Create Reflection menu option is disabled when you do not have access to
create projects within the EPS node.
Q. Why don't I see the Merge Reflection into Source Project menu option when I right click on a
reflection project?
A. The right click option is hidden when any of the following is true:
A group band node is selected
More than one project is selected
A non-reflection project is selected (i.e. the project does not contain a source project
field value)
The selected project contains a source project field value, but it does not have a
what-if status
The selected project has a what-if status but it does not contain a source project field
value
Q. Why is the Merge Reflection into Source Project disabled?
A. The right click option is disabled when any of the following is true:
The source project has been checked out
The source project and/or the reflection has been opened exclusively by another
user
You do not have super user privileges to both the source project and the reflection

P6 EPPM User's Guide
312
Q. What happens when there are duplicate records for resources?
A. The resources will not be updated. You will have to update the resources in the
source project manually.
Q. What happens if the merge fails?
A. The system responds with a message that the merge process failed, creating the
prmReflectionMerge.log file in the temporary directory, and notifying of log file's location.
Q. How are changes to dates handled?
A. Scheduling related date fields are not shown in the preview but may be updated
upon merging changes.
Q. How are baselines handled when the "Replace reflection" option is used?
A. The new reflection will be created with the same baselines that were in the original
reflection.
Future Period Bucket Planning
Future period bucket planning
When you specify an activity's total budgeted or planned units, the budgeted or
planned units for an assignment to that activity are spread evenly across the duration of
the activity, in the timescale increment you choose. For example, a four-week activity
with 80 budgeted or planned units is spread as follows, assuming a weekly timescale:
Week 1 Week 2 Week 3 Week 4
20h 20h 20h 20h
However, your projects may contain activities for which you know work will be performed
sporadically and at varying levels of effort. For these activities, you can do either of the
following to more accurately capture when you plan for work to be performed on an
activity:
assign a resource curve to the resource/role assignment
manually enter the assignment's budgeted or planned units or remaining units (see
"Manually enter future period assignment values" on page 339) in future period
buckets (timeperiods)
While assigning a resource curve to the resource/role assignment will yield more
accurate results than spreading units evenly across the duration of an activity, the work
you plan to perform per period on an activity may not be fully reflected by the curve. As
a result, performance against the project plan cannot be accurately measured.

P6 Professional
313
To achieve the most precise resource/role distribution plan, you can manually enter the
budgeted or planned resource/role allocation per assignment in the timescale unit you
choose (days, weeks, months, quarters, years, or financial periods). For example, assume
an activity has an original or planned duration of 28 days and budgeted or planned units
of 80 hours. For this activity, you know that the actual work will not be spread evenly
across the duration of the activity; rather, the budgeted or planned units will be spread
as follows:
Week 1 Week 2 Week 3 Week 4
10h 30h 15h 25h
By manually entering the planned resource/role distribution in future period assignment
buckets, you can create an accurate baseline plan to measure against current project
progress. As the current project schedule progresses and you apply actuals, you can
track how the project is performing against plan by comparing the project’s budgeted
or planned future periods to the current project’s actuals.
If work on an activity is not proceeding according to plan, you can manually update the
remaining units for an assignment's future periods, enabling you to measure the
remaining work for an assignment without changing the original plan. Alternatively, if you
choose to re-estimate future work based on changes to the project schedule, you can
edit an assignment's future period budgeted or planned units
while the activity is in progress; if many assignment's require re-estimation, you can
establish a new baseline plan based on your changes.
Tips
You can compare the planned future period resource distribution to actual units
and costs in the Resource Usage Profile, Resource Usage Spreadsheet, Activity
Usage Profile, Activity Usage Spreadsheet, time-distributed reports, and the
Tracking window. If you plan your project work in defined financial periods, after
you store period performance, you can compare the resource distribution you
planned to the project's past period actuals.
Activity costs, including earned value and planned value, are calculated using
the planned future period resource distribution you define for activity assignments.
Note
You must have the 'Edit Future Periods' project privilege to manually enter future
period data.

P6 EPPM User's Guide
314
Future period bucket planning FAQ
Refer to the following questions and answers for important information to consider when
manually planning future period resource allocation. Questions and answers are divided
into the following categories:
General questions
Troubleshooting
Getting started
Application settings
Entering and editing data in future period buckets
Deleting, copying, and pasting future period bucket data
Updating projects
Adding, deleting, or replacing assignments
Importing and exporting data
Miscellaneous
General questions
What is a bucket?
The term "bucket" refers to the timeperiod (or timescale interval) in which you enter data
in a spreadsheet. For example, if the Resource Usage Spreadsheet is configured to
display a Week/Day timescale, the daily timescale intervals in which you can enter data
are referred to as "daily buckets."
In the Help related to future period bucket planning (on page 312), buckets are also
referred to as timeperiods or timescale intervals, where appropriate.
What is the difference between a future period bucket and a manual future period value?
A "future period bucket" refers to the future timeperiod (or timescale interval) displayed in
a spreadsheet. For example, "Enter values in the assignment's future period buckets."
The phrase "manual future period values" refers to the values that exist within future
period buckets. For example, "Changing an activity's start or finish dates may change an
assignment's manual future period values."
How do I know that an assignment has manual future period values?
When an assignment has manual future period values, the module automatically
identifies the future period values as a Manual resource curve. To determine the
assignments that have a manual resource curve, display the Curve column in the
Resource Assignments window. The Curve column displays a value of 'Manual' for
manually-planned resource/role assignments.

P6 Professional
315
Are manual future period values stored in the baseline?
Yes, manual future period values are always stored in the baseline when you save a
copy of the current project as a new baseline. When you restore a baseline, manual
future period values are also restored. Additionally, baselines that contain assignments
with manually-created future period buckets are updated automatically.
Can all users manually enter future period values?
No. You must have the 'Edit Future Periods' project privilege to manually enter or edit
data in future period buckets.
Troubleshooting
Why are some future period buckets gray/uneditable?
When a future period bucket is not eligible for editing, the spreadsheet cell is gray.
Spreadsheet cells are gray/uneditable when any of the following are true:
The activity associated with the assignment has a duration type of Fixed Units or
Fixed Units/Time. You can only manually enter future period values for activities
with a duration type of Fixed Duration & Units and Fixed Duration & Units/Time.
The resource or role assigned to the activity does not have any valid worktime for
the time period. For resource assignments to task-dependent activities, and for all
role assignments to activities, the module determines if there is valid worktime
based on the activity calendar. For resource assignments to resource-dependent
activities, the module determines if there is valid worktime based on the resource
calendar.
The displayed timescale intervals in the spreadsheet are smaller than the minimum
timescale interval used for time-distributed resource calculations. You can
change this setting in the 'Interval for time-distributed resource calculations' field
(User Preferences, Resource Analysis tab). For example, if this option is set to Week,
you can only enter or edit data in weekly, monthly, quarterly, or yearly future
period buckets.
For activities that have not started yet, the date of the timescale interval is prior to
the Planned Start date (for the Budgeted or Planned Units field) or the Remaining
Early Start date (for the Remaining Units field) of the activity.
The activity associated with the assignment has an Actual Finish date (for
Remaining Early Unit buckets only).
For activities that are in progress, the date of the timescale interval is prior to the
Data Date (for Remaining Early Unit buckets only).
The activity associated with the assignment is a milestone activity.
The timescale is set to Day/Shift or Day/Hour.

P6 EPPM User's Guide
316
The timescale is set to display only ordinal dates. You must display primary dates
(with or without ordinal dates) to edit data in future period buckets.
When the timescale is set to display financial period intervals, no financial period is
defined for the timeperiod or the first timeperiod is not within the range of defined
financial period dates.
You choose to display time-distributed Remaining Early units and costs according
to forecast dates rather than remaining early dates in the User Preferences,
Resource Analysis tab. This only applies to the Remaining Units field.
You choose to calculate average values for the spreadsheet in the Spreadsheet
Options dialog box.
You have not been assigned the Edit Future Periods project privilege.
In the Resource Usage Spreadsheet of the Activities window, you display
assignment data for all projects rather than for open projects. If you display data
for all projects, the title of the Display Options bar in the Resource Usage
Spreadsheet is "Display: All Projects." To display data for open projects only, click
the Display Options bar, then choose Show All Projects to remove the checkmark;
the title of the Display Options bar changes to "Display: Open Projects Only."
Why can't I enter different values for the Budgeted or Planned and Remaining Units fields?
For activities that have not started, if the project-level setting 'Link Budgeted or Planned
and At Completion for not started activities' is marked (Project Details, Calculations tab),
the total planned values of the Budgeted or Planned Units and Remaining (Early) Units for
the assignment will always be equal. For example, when you enter a value for a future
period in the Budgeted or Planned Units field, the Remaining (Early) Units field is
automatically populated with the same value; the reverse is also true. If this setting is not
marked, you can enter different values for the same future period in the Budgeted or
Planned Units and Remaining (Early) Units fields; in this case, the total values for each field
are calculated independently for the assignment.
For activities that are in progress, you can always enter different future period values in
the Budgeted or Planned Units and Remaining (Early) Units fields.
Why did the manual future period values I entered change?
There are many reasons why the future period values you entered for an assignment
might change to different values or be placed in a different timeperiod. For example,
remaining unit data for an assignment might change when you apply actuals, or if you
entered values in daily increments and changed the timescale to a larger increment (for
example, days to weeks), the data you see is a roll-up of the daily values you entered.
P6 Professional
317
More specifically, changes to some activity or assignment data can cause the manual
future period values to be respread and, in some cases, recalculated. When you
manually enter data in future period buckets, the bucket values are stored in the
database. When you modify activity or assignment information that causes the values to
respread across future period buckets, the values stored in the database do not change;
only the spread of those values across future period buckets changes. When you modify
activity or assignment data that causes the values to be recalculated, the values you
originally entered are recalculated according to the manual distribution and stored in
the database; the original values are lost.
The sections below detail the activity and assignment fields that may cause manual
future period values to be respread or recalculated.
Changing values in the following ASSIGNMENT-related fields may RESPREAD manual future period
values across buckets:
Planned Start or Finish (Fixed Duration & Units activities only)
Remaining Early Start or Finish (Fixed Duration & Units activities only)
Original or Planned Remaining Duration (Fixed Duration & Units activities only)
Actual, Budgeted or Planned, or Remaining Units
Budgeted or Planned Units/Time
Planned or Remaining Lag
Budgeted or Planned Remaining Cost (see note below)
Drive Activity Dates - You change the driving resource on the assignment.
Rate Source (see note below)
Rate Type (see note below)
Price/Unit (see note below)
Curve - You assign a resource curve to an assignment with manual future period
values.
Note:
When you modify the budgeted or planned and Remaining Cost, Rate Source,
Rate Type, and Price/Unit fields, costs will be recalculated. Manual future period
unit values may be respread only if the 'Calculate costs from units' resource/role
option (or the equivalent 'Calculate costs from units' assignment option) and the
project setting 'Update units when costs change on resource assignments' (Project
Details, Calculations tab) are both selected. For more information, see the next
question below.

P6 EPPM User's Guide
318
Do application settings for linking costs and units affect manual future period values?.
Yes. At the project level, the 'Update units when costs change on resource
assignments' setting (Project Details, Calculations tab) determines if the application
updates units when costs change on assignments to activities throughout the project.
At the assignment level, the 'Calculate costs from units' field (Activity Details,
Resources tab) determines if costs are updated when you change units for that
particular assignment. The 'Update units when costs change on resource assignments'
project-level setting only applies when the 'Calculate costs from units'
assignment-level option is selected.
Note
When you add a resource or add a role, you can choose the option to 'Calculate
costs from units' for that resource's (Resource Details, Details tab) or role's (Roles
dictionary, Prices tab) assignments. The 'Calculate costs from units' assignment-level
option is automatically turned on or off based on this resource/role setting when you
assign a resource/role to an activity. You can change this setting per assignment by
displaying the Calculate Costs From Units column on the Resources tab of Activity
Details, then marking or clearing the checkbox.
When you manually edit future period units and costs for an assignment (for example,
you change the Remaining Cost of the assignment), the following will occur depending
on the values of these settings:
When 'Calculate costs from units' is selected for an assignment, costs are
recalculated when you change the planned or budgeted or remaining units,
regardless of the 'Update units when costs change on resource assignments'
project-level setting. If the project-level setting is also selected, the planned or
budgeted or remaining units are respread when the planned or budgeted or
remaining costs change for the assignment.
When the 'Calculate costs from units' setting is not selected for an assignment, costs
and units are handled independently, regardless of the 'Update units when costs
change on resource assignments' project-level setting.
Changing values in the following ACTIVITY-related fields may RESPREAD manual future period values
across buckets:
Actual, Budgeted or Planned, or Remaining Units
Start Date
Planned or Remaining Lag
Suspend and Resume Date
Activity Type - Manual future period values will only be respread if the activity Finish
Date changes when you change the activity type from Task Dependent to Resource
Dependent, or from Resource Dependent to Task Dependent.
Activity Calendar (editing or changing)

P6 Professional
319
Duration % (Fixed Duration & Units activities only. For more information on the impact
of modifying the Duration % field, refer below to How are actuals applied when I
manually update progress for assignments with manual future period values?)
'Update units when costs change on resource assignments' setting (Project Details,
Calculations tab. For more information on the impact of modifying this setting, refer
below to Do application settings for linking costs and units affect manual future
period values?)
Adding a new assignment - When you add a new assignment to an activity that
already has a resource assignment with manual future period values, the module
may change values for the existing assignment based on your user preference setting
for assignment staffing (User Preferences, Calculations tab). For more information,
refer to below to Can I assign a new resource to an activity that already has a
resource assignment with manual future period values?.
How are actuals applied when I manually update progress for assignments with
manual future period values?)
Actuals are applied to manually-planned assignments according to the following
rules, depending on the way you manually update activity progress:
If you use Progress Spotlight to update activity progress, actuals are applied using the
specified manual planned or budgeted unit distribution; the manual remaining unit
distribution is not considered, even if no manual planned or budgeted unit data exists
for an assignment. When the planned or budgeted and remaining unit values are
different for an assignment, the planned or budgeted unit values overwrite the
existing remaining unit values when you apply actuals.
If you update activity progress by modifying Duration % Complete or Remaining
Duration on the activity, the activity's actual units are updated when you apply
actuals using the manual remaining unit distribution, as long as the project option
'Recalculate Actual Units and Cost when duration percent complete changes'
(Project Details, Calculations tab) is marked.
If you update activity progress by modifying the Remaining Units or Remaining Early
Finish on the assignment, the activity's actual units are updated when you apply
actuals using the manual planned or budgeted unit distribution as long as the project
option 'Recalculate Actual Units and Cost when duration percent complete
changes' (Project Details, Calculations tab) is marked.
If you update activity progress by modifying the Actual Units on the activity or
assignment, manual future period planned or budgeted and remaining unit values
are not updated when you apply actuals.
Do application settings for linking costs and units affect manual future period values?)

P6 EPPM User's Guide
320
Yes. At the project level, the 'Update units when costs change on resource
assignments' setting (Project Details, Calculations tab) determines if the application
updates units when costs change on assignments to activities throughout the project.
At the assignment level, the 'Calculate costs from units' field (Activity Details,
Resources tab) determines if costs are updated when you change units for that
particular assignment. The 'Update units when costs change on resource assignments'
project-level setting only applies when the 'Calculate costs from units'
assignment-level option is selected.
Notes
When you add a resource or add a role, you can choose the option to 'Calculate
costs from units' for that resource's (Resource Details, Details tab) or role's (Roles
dictionary, Prices tab) assignments. The 'Calculate costs from units'
assignment-level option is automatically turned on or off based on this
resource/role setting when you assign a resource/role to an activity. You can
change this setting per assignment by displaying the Calculate Costs From Units
column on the Resources tab of Activity Details, then marking or clearing the
checkbox.
When you manually edit future period units and costs for an assignment (for
example, you change the Remaining Cost of the assignment), the following will
occur depending on the values of these settings:
When 'Calculate costs from units' is selected for an assignment, costs are
recalculated when you change the planned or budgeted or remaining units,
regardless of the 'Update units when costs change on resource assignments'
project-level setting. If the project-level setting is also selected, the planned or
budgeted or remaining units are respread when the planned or budgeted or
remaining costs change for the assignment.
When the 'Calculate costs from units' setting is not selected for an assignment,
costs and units are handled independently, regardless of the 'Update units when
costs change on resource assignments' project-level setting.
Can I assign a new resource to an activity that already has a resource assignment
with manual future period values?.
Yes. When you add an assignment to an activity that already has an existing
assignment, the module adheres to your User Preference settings for assignment
staffing, as described below. For information on setting these preferences, refer to
Select calculation options for resource and role assignments.

P6 Professional
321
Adding a resource assignment to an activity that has an existing resource assignment
When you add a resource assignment to an activity that already has an existing
resource assignment with manual future period values, the module adheres to your
setting in the 'When assigning a resource to an existing activity assignment' field (User
Preferences, Calculations tab, Assignment Staffing section). If you choose to 'Always
use the new resource's Units/Time and Overtime factor,' the manual future period
values of the existing resource assignment may be respread across future period
buckets based on the new resource's values. If you choose to 'Always use current
assignment's Units/Time and Overtime factor,' unit values for the new resource are
spread evenly over future period buckets and the manual future period values for the
existing resource assignment are not changed.
Adding a resource assignment to an activity that has an existing role assignment, or vice versa
When you add a resource assignment to an activity that already has an existing role
assignment with manual future period values (or vice versa), the module adheres to
your setting in the 'When a resource and role share an activity assignment' field (User
Preferences, Calculations tab, Assignment Staffing section). If you choose to 'Always
use resource's Price per Unit,' the manual future period values for the existing role
assignment may be respread across future period buckets based on the new
resource's values. Likewise, if you choose to 'Always use role's Price per Unit,' the
manual future period values for the existing resource assignment may be respread
across future period buckets based on the new role's values.
Changing values in the following ASSIGNMENT-related fields may RECALCULATE manual future period
values:
Budgeted or Planned or Remaining Finish (Fixed Duration & Units/Time activities only)
Original or Planned or Remaining Duration (Fixed Duration & Units/Time activities only)
Changing values in the following ACTIVITY-related fields may RECALCULATE manual future period
values:
Budgeted or Planned or Remaining Finish (Fixed Duration & Units/Time activities only)
Original or Planned or Remaining Duration (Fixed Duration & Units/Time activities only)
Activity Status
Duration Type
Duration % (Fixed Duration & Units/Time activities only. For more information on the
impact of modifying the Duration % field, refer below to How are actuals applied
when I manually update progress for assignments with manual future period values?)
How are actuals applied when I manually update progress for assignments with
manual future period values?)
Actuals are applied to manually-planned assignments according to the following
rules, depending on the way you manually update activity progress:

P6 EPPM User's Guide
322
If you use Progress Spotlight to update activity progress, actuals are applied using the
specified manual planned or budgeted unit distribution; the manual remaining unit
distribution is not considered, even if no manual planned or budgeted unit data exists
for an assignment. When the planned or budgeted and remaining unit values are
different for an assignment, the planned or budgeted unit values overwrite the
existing remaining unit values when you apply actuals.
If you update activity progress by modifying Duration % Complete or Remaining
Duration on the activity, the activity's actual units are updated when you apply
actuals using the manual remaining unit distribution, as long as the project option
'Recalculate Actual Units and Cost when duration percent complete changes'
(Project Details, Calculations tab) is marked.
If you update activity progress by modifying the Remaining Units or Remaining Early
Finish on the assignment, the activity's actual units are updated when you apply
actuals using the manual planned or budgeted unit distribution as long as the project
option 'Recalculate Actual Units and Cost when duration percent complete
changes' (Project Details, Calculations tab) is marked.
If you update activity progress by modifying the Actual Units on the activity or
assignment, manual future period planned or budgeted and remaining unit values
are not updated when you apply actuals.
Removing an assignment (For more information, refer to below to Can I remove or
replace a resource assignment with manual future period values?
Can I remove or replace a resource assignment with manual future period values?
Yes. When you replace the resource or role assigned to an activity, any manual future
period values entered for that assignment are preserved with the new assignment.
When you remove a resource or role assignment that has manual future period
values, the manual future period values are deleted. If other assignments with manual
future period values exist on the same activity, those assignments' manual future
period values may change based on the activity type and your user preference
settings for assignment staffing (User Preferences, Calculations tab). For more
information on setting assignment staffing preferences, refer to Select calculation
options for resource and role assignments.
Getting started
Where can I manually enter future period values?
You can manually enter future period values for an assignment in the Budgeted Units or
Planned Units and Remaining (Early) Units fields in the Resource Usage Spreadsheet in the
Resource Assignments and Activities windows.

P6 Professional
323
Note
To manually enter future period values in the Resource Usage Spreadsheet in the
Activities window, you must choose to display resource assignment data for open
projects only. If you are displaying data for all projects, the title of the Display
Options bar in the Resource Usage Spreadsheet is "Display: All Projects." To display
data for open projects only, click the Display Options bar, then choose Show All
Projects to remove the checkmark; the title of the Display Options bar changes to
"Display: Open Projects Only."
Can I enter future period values for all assignments to activities?
No. You can manually enter future period values for assignments when:
The activity associated with the assignment has a duration type of Fixed Duration &
Units or Fixed Duration and Units/Time. You cannot enter future period values for
assignments to activities with a duration type of Fixed Units or Fixed Units/Time.
The activity associated with the assignment is not a milestone activity.
For more information on these and other future period bucket planning restrictions, see
the next question below.
Why are some future period buckets gray/uneditable?
When a future period bucket is not eligible for manual future period bucket planning, the
spreadsheet cell is gray.
Spreadsheet cells are gray/uneditable when:
The activity associated with the assignment has a duration type of Fixed Units or Fixed
Units/Time (you can only enter manual future period values for activities with a
duration type of Fixed Duration & Units and Fixed Duration & Units/Time).
The resource or role assigned to the activity does not have any valid worktime for the
timeperiod. For resource assignments to task-dependent activities, and for all role
assignments to activities, the module determines if there is valid worktime based on
the activity calendar. For resource assignments to resource-dependent activities, the
module determines if there is valid worktime based on the resource calendar.
The displayed timescale unit in the spreadsheet is smaller than the minimum
timescale unit used for time-distributed resource calculations. You can change this
setting in the 'Interval for time-distributed resource calculations' field (User
Preferences, Resource Analysis tab). For example, if this option is set to Week, you can
only enter or edit data in weekly, monthly, or quarterly timescale buckets.

P6 EPPM User's Guide
324
Can I enter values in any time unit?
The values you enter in the Budgeted or Planned Units and Remaining (Early) Units fields
are converted to the Unit/Time specified in the User Preferences, Time Units tab. For
example, if the Unit/Time user preference is set to Hour and you enter 1d, the value is
converted to 8h. To avoid planning mistakes, you should set the Unit/Time user
preference to the same time unit you use to plan your work. For example, if you plan your
work in hours, set the Unit/Time to Hours.
Can I manually enter or edit values for Remaining Late Units?
No, you can only enter or edit values for budgeted or planned Units and Remaining
(Early) Units.
Application settings
Can I enter future period values in any timescale interval?
No. You can enter values in future period buckets of all timescale intervals EXCEPT
Day/Hour and Day/Shift.
Your user preference setting for 'Interval for time-distributed resource calculations' (User
Preferences, Resource Analysis tab) determines the minimum timescale interval in which
you can enter or edit data. For example, if this option is set to Week, you can only enter
or edit data in weekly, monthly, quarterly, yearly, or financial period buckets. When you
display timescale intervals smaller than the interval specified as your user preference, the
buckets are not editable. Using this case as an example, if you display daily timescale
intervals, the buckets are not editable.
Does it matter which date format I choose, primary dates or ordinal dates?
Yes. You can enter future period values if you choose to display primary dates or a
combination of primary and ordinal dates. You cannot enter future period values when
you choose to display only ordinal dates.
To select timescale settings, click the Display Options bar in the Resource Usage
Spreadsheet, then choose Timescale. For more information on selecting timescale
settings, refer to Change a layout's timescale format.
Can I change timescale settings after I enter values in future period buckets?
Yes. When you select a smaller timescale interval, the values you originally entered in the
larger buckets are spread linearly over the smaller buckets. When you enlarge the
timescale interval, the values you originally entered in the smaller buckets are rolled up
into the larger buckets.

P6 Professional
325
If you subsequently change the timescale back to the setting you used when you
manually entered values in future period buckets, the values appear as you originally
entered them.
Do application settings for linking costs and units affect manual future period values?
Yes. At the project level, the 'Update units when costs change on resource assignments'
setting (Project Details, Calculations tab) determines if the application updates units
when costs change on assignments to activities throughout the project. At the
assignment level, the 'Calculate costs from units' field (Activity Details, Resources tab)
determines if costs are updated when you change units for that particular assignment.
The 'Update units when costs change on resource assignments' project-level setting only
applies when the 'Calculate costs from units' assignment-level option is selected.
Note
When you add a resource or add a role, you can choose the option to 'Calculate
costs from units' for that resource's (Resource Details, Details tab) or role's (Roles
dictionary, Prices tab) assignments. The 'Calculate costs from units' assignment-level
option is automatically turned on or off based on this resource/role setting when you
assign a resource/role to an activity. You can change this setting per assignment by
displaying the Calculate Costs From Units column on the Resources tab of Activity
Details, then marking or clearing the checkbox.
When you manually edit future period units and costs for an assignment (for example,
you change the Remaining Cost of the assignment), the following will occur depending
on the values of these settings:
When 'Calculate costs from units' is selected for an assignment, costs are
recalculated when you change the planned or budgeted or remaining units,
regardless of the 'Update units when costs change on resource assignments'
project-level setting. If the project-level setting is also selected, the planned or
budgeted or remaining units are respread when the planned or budgeted or
remaining costs change for the assignment.
When the 'Calculate costs from units' setting is not selected for an assignment, costs
and units are handled independently, regardless of the 'Update units when costs
change on resource assignments' project-level setting.

P6 EPPM User's Guide
326
Entering and editing data in future period buckets
Can I enter different values for Budgeted or Planned Units and Remaining (Early) Units?
Yes. For not started activities, if the project-level setting 'Link Budgeted or Planned and At
Completion for not started activities' is marked (Project Details, Calculations tab), the
total planned values of the Budgeted or Planned Units and Remaining (Early) Units for the
assignment will always be equal. For example, when you enter a value for a future period
in the Budgeted or Planned Units field, the Remaining (Early) Units field is automatically
populated with the same value; the reverse is also true. If this setting is not marked, you
can enter different values for the same future period in the Budgeted or Planned Units
and Remaining (Early) Units fields; in this case, the total values for each field are
calculated independently for the assignment.
For activities that are in progress, you can always enter different future period values in
the Budgeted or Planned Units and Remaining (Early) Units fields
Can I enter data in financial period buckets?
Yes, you can enter data in financial period buckets for the range of financial period
dates defined in the Financial Periods dictionary. For example, if you have defined
weekly financial periods from January 1st, 2007, through December 31st, 2007, you can
enter data in weekly financial period buckets beginning on or after January 1st, 2007,
and ending on or before December 31st, 2007.
Note:
The setting for 'Interval for time-distributed resource calculations' (User Preferences,
Resource Analysis tab) should not be larger than your defined financial periods.
For example, if you have defined weekly financial periods, the setting for 'Interval
for time-distributed resource calculations' should be Hour, Day, or Week, but not
Month. If this setting is larger than your defined financial periods, you will not be
able to edit most financial period buckets. For example, if the user preference is
set to Month but you have defined weekly financial periods, you will only be able
to edit data for financial period buckets that contain the first day of the month.
Can I overallocate a resource or role when I manually enter future period values?
Yes. If the resource or role on the assignment has valid worktime for a timeperiod, you
can enter an unlimited number of units for the timeperiod, even if the value you enter
overallocates the resource or role.

P6 Professional
327
If no work is planned to be performed on an activity for a timeperiod, do I have to enter a
value?
No. Assume, for example, that you plan your work in weekly planning periods. You have
a four-week task in which work is planned to be performed during weeks 1, 2, and 4, but
no work will be performed during week 3. Given this example, when you enter future
period values, simply do not enter a value for the period in which work will not be
performed, such as:
Week 1 Week 2 Week 3 Week 4
20 15 30
The module treats a blank value the same as a zero value; therefore, you could also
enter a 0 (zero) as the Week 3 value.
Can I manually enter future period values for an assignment that already has an assigned
resource curve?
Yes. In fact, to simplify the process of manually planning future period assignments, you
can apply a resource curve to the assignment that has a similar resource distribution to
the distribution you intend to manually plan, then manually make any necessary
modifications to the future period values.
Note
When you apply a resource curve to an assignment and then manually modify
future period values for that assignment, the resource curve is removed from the
assignment and the assignment is designated as a 'Manual' curve.
Can I enter a zero in a future period bucket?
Yes; however, the module considers the zero value differently depending on where the
value lies in the planned resource distribution.
When you replace an assignment's first future period bucket value with a zero:
When an assignment's first future period bucket contains a non-zero value and you
replace it with a zero (or you delete the value), the duration of the assignment is
shortened and the zero value is converted to start date lag.

P6 EPPM User's Guide
328
For example, assume you've manually planned a five-day assignment with the following
daily bucket values: 8|4|2|6|2. If you change the 8 to a zero (or delete the value), the
planned duration of the assignment is changed to four days with a start date lag of one
day.
Notes
When you enter a leading zero for an assignment and then refresh the window,
the leading zero disappears.
For assignments to not started activities, if the 'Link Budgeted or Planned and At
Completion for not started activities' project option (Project Details, Calculations
tab) is NOT selected and you enter a leading zero for an assignment, one day of
lag is added to both the Planned Start and Remaining Start dates. This occurs
regardless of the field in which you enter the leading zero ( budgeted or planned
Units or Remaining Units) because the Planned Start and Remaining Start dates
must be the same for activities that are not started.
When you enter a zero value in between non-zero values:
If you enter a zero value in between non-zero values for an assignment, the module
considers the zero bucket part of the planned resource distribution. In the following
examples of five-day tasks, the zeros are included in the resource distribution:
2|8|0|4|4
2|0|8|0|4
8|0|0|8|4
When you enter a zero as the last future period bucket value for an assignment:
When you enter a zero after an assignment's last future period bucket value (i.e., there
are no subsequent non-zero values), the module ignores the zero. In the following
example, the zero is ignored:
2|8|4|8|0
Note
When you enter a trailing zero for an assignment and then refresh the window, the
trailing zero disappears.
Can I enter a negative value in a future period bucket?
Yes, if the total units ( budgeted or planned or remaining, exclusive) value for the
assignment is negative. For example, if the total Budgeted or Planned Units for an
assignment is negative, you can enter a negative value in a Budgeted or Planned Units
future period bucket for that assignment.

P6 Professional
329
If the total units ( budgeted or planned or remaining) value for an assignment is negative
and you enter a positive value, the value is automatically converted to a negative value.
Likewise, if the total units (budgeted or planned or remaining) value for an assignment is
positive and you enter a negative value, the value is automatically converted to a
positive value.
If an activity's progress is planned to be suspended, can I enter or edit values for the
activity's assignments in future periods during which progress on the activity will be
suspended?
Yes, you can enter or edit values in future period buckets that are planned to be
suspended, as long as the suspend time has not been scheduled (in other words, the
project has not been scheduled since the suspend and resume dates were added to the
activity).
When the project is scheduled, the suspend and resume dates for the activity are
scheduled accordingly and you can no longer enter or edit data in buckets which are
scheduled to be suspended.
If you enter future period data in a bucket that is planned to be suspended, when you
schedule the project, any work that is planned to occur during the suspend time is
pushed out to the resume date.
Deleting, copying, and pasting future period bucket data
When I copy/paste a project, WBS, or activity, are manual future period values included?
Yes, manual future period values are copied when you copy a project, WBS, or activity,
provided that, when prompted, you choose to copy Resource and Role Assignments in
the Copy Activity Options dialog box.
What happens when I delete a manual future period value?
When you delete a manual future period value, the module considers the value to be a
zero. Depending on where the zero lies during the duration of the assignment (first
bucket, middle bucket, last bucket), the zero may or may not be considered part of the
future period resource distribution.
Refer below to Can I enter a zero in a future period bucket? to learn more about how the
module considers zero values.
Can I enter a zero in a future period bucket?
Yes; however, the module considers the zero value differently depending on where the
value lies in the planned resource distribution.

P6 EPPM User's Guide
330
When you replace an assignment's first future period bucket value with a zero:
When the first future period assignment bucket contains a non-zero value and you
replace it with a zero (or you delete the value), the duration of the assignment is
shortened and the zero value is converted to start date lag.
For example, assume you've manually planned a five-day assignment with the following
daily bucket values: 8|4|2|6|2. If you change the 8 to a zero (or delete the value), the
planned duration of the assignment is changed to four days with a start date lag of one
day.
Notes
When you enter a leading zero for an assignment and then refresh the window,
the leading zero disappears.
For assignments to not started activities, if the 'Link Budget or Planned and At
Completion for not started activities' project option (Project Details, Calculations
tab) is NOT selected and you enter a leading zero for an assignment, one day of
lag is added to both the Planned Start and Remaining Start dates. This occurs
regardless of the field in which you enter the leading zero (Budgeted or Planned
Units or Remaining Units) because the Planned Start and Remaining Start dates
must be the same for not started activities.
When you enter a zero value in between non-zero values:
If you enter a zero value in between non-zero values for an assignment, the module
considers the zero bucket part of the planned resource distribution. In the following
examples of five-day tasks, the zeros are included in the resource distribution:
2|8|0|4|4
2|0|8|0|4
8|0|0|8|4
When you enter a zero as the last future period bucket value for an assignment:
When you enter a zero at the end of an assignment (i.e., there are no subsequent
non-zero values), the module ignores the zero. In the following example, the zero is
ignored:
2|8|4|8|0
Note
When you enter a trailing zero for an assignment and then refresh the window, the
trailing zero disappears.

P6 Professional
331
Are manual future period values deleted when I delete a project, WBS, activity, or
assignment?
Yes, manual future period values are automatically deleted when you delete a project,
WBS, activity, or assignment.
If I delete a resource or role with manual future period values, can I merge the
assignment data with another existing resource or role?
Yes. When you delete a resource or role, you can choose to preserve the associated
assignment data by merging the data with another resource.
Refer to Delete a resource and Delete a role for more detailed information.
Updating projects
If work on an activity is in progress or complete, can I edit the previously defined manual
assignment values?
For Budgeted or Planned units, you can edit manual values for an assignment at any
time (before or after the data date), even if the activity associated with the assignment is
in progress or has an Actual Finish date.
For Remaining (Early) Units, you can edit manual values for an assignment's future period
buckets only (buckets after the data date); you cannot edit an assignment's past period
buckets (buckets before the data date) when an activity is in progress, even if you
manually entered the values before work began on the activity. Once an activity has an
Actual Finish date, you can not edit remaining unit values.
Tip
When work on an activity is not proceeding according to plan, you can
re-estimate the remaining work on the assignment and update the assignment's
remaining without changing the original plan, enabling you to compare the
original baseline plan to when the work actually occurred. If the project schedule
has deviated significantly from the original plan and several activities require
re-estimation, you may want to update the budgeted or planned units for those
assignments and re-baseline the project.
Can I automatically apply actuals for assignments with manual future period values?
Yes. The Auto Compute Actuals option MUST BE SELECTED on the activity or the resource
assigned to the activity for the module to consider manual future period values when
applying actuals.
To set Auto Compute Actuals at the activity level, display the Auto Compute Actuals
column in the Activity Table (Activities window), then mark the checkbox for the
appropriate activities.
P6 EPPM User's Guide
332
You can set Auto Compute Actuals per resource on the Details tab of Resource Details.
Choose Enterprise, Resources, then display Resource Details.
How are actuals applied when I manually update progress for assignments with manual
future period values?
Actuals are applied to manually-planned assignments according to the following rules,
depending on the way you manually update activity progress:
If you use Progress Spotlight to update activity progress, actuals are applied using the
specified manual planned or budgeted unit distribution; the manual remaining unit
distribution is not considered, even if no manual planned or budgeted unit data exists for
an assignment. When the planned or budgeted and remaining unit values are different
for an assignment, the planned or budgeted unit values overwrite the existing remaining
unit values when you apply actuals.
If you update activity progress by modifying Duration % Complete or Remaining Duration
on the activity, the activity's actual units are updated using the manual remaining unit
distribution when you apply actuals, as long as the project option 'Recalculate Actual
Units and Cost when duration percent complete changes' (Project Details, Calculations
tab) is marked.
If you update activity progress by modifying the Remaining Units or Remaining Early Finish
on the assignment, the activity's actual units are updated using the manual planned or
budgeted unit distribution when you apply actuals, as long as the project option
'Recalculate Actual Units and Cost when duration percent complete changes' (Project
Details, Calculations tab) is marked.
If you update activity progress by modifying the Actual Units on the activity or
assignment, manual future period planned or budgeted and remaining unit values are
not updated when you apply actuals.
How does removing progress from an activity affect manual future period values?
When you remove progress from an activity that has manual future period values on its
associated assignment, the module adheres to the setting for removing progress from
activities on the Project Details, Calculations tab.
If you choose to 'Reset Planned or Original Duration and Units to Remaining,' the
assignment's manual future period planned or budgeted unit values are respread to
match the manual remaining unit values.
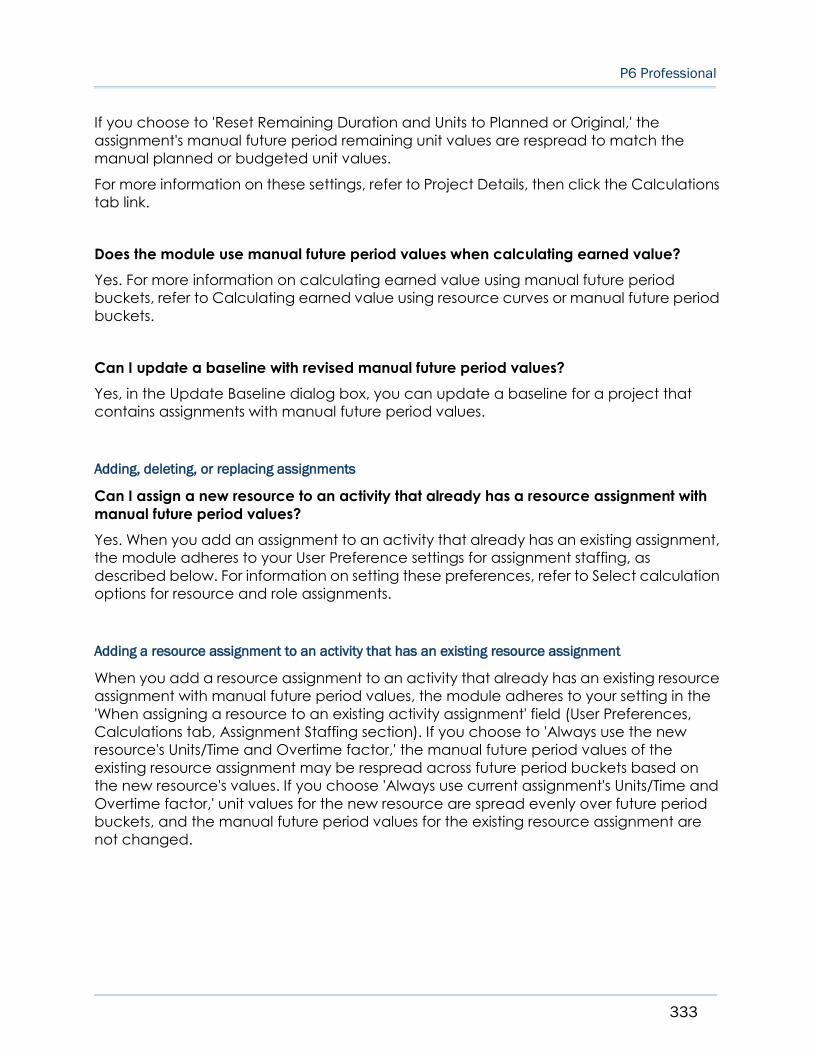
P6 Professional
333
If you choose to 'Reset Remaining Duration and Units to Planned or Original,' the
assignment's manual future period remaining unit values are respread to match the
manual planned or budgeted unit values.
For more information on these settings, refer to Project Details, then click the Calculations
tab link.
Does the module use manual future period values when calculating earned value?
Yes. For more information on calculating earned value using manual future period
buckets, refer to Calculating earned value using resource curves or manual future period
buckets.
Can I update a baseline with revised manual future period values?
Yes, in the Update Baseline dialog box, you can update a baseline for a project that
contains assignments with manual future period values.
Adding, deleting, or replacing assignments
Can I assign a new resource to an activity that already has a resource assignment with
manual future period values?
Yes. When you add an assignment to an activity that already has an existing assignment,
the module adheres to your User Preference settings for assignment staffing, as
described below. For information on setting these preferences, refer to Select calculation
options for resource and role assignments.
Adding a resource assignment to an activity that has an existing resource assignment
When you add a resource assignment to an activity that already has an existing resource
assignment with manual future period values, the module adheres to your setting in the
'When assigning a resource to an existing activity assignment' field (User Preferences,
Calculations tab, Assignment Staffing section). If you choose to 'Always use the new
resource's Units/Time and Overtime factor,' the manual future period values of the
existing resource assignment may be respread across future period buckets based on
the new resource's values. If you choose 'Always use current assignment's Units/Time and
Overtime factor,' unit values for the new resource are spread evenly over future period
buckets, and the manual future period values for the existing resource assignment are
not changed.

P6 EPPM User's Guide
334
Adding a resource assignment to an activity that has an existing role assignment, or vice versa
When you add a resource assignment to an activity that already has an existing role
assignment with manual future period values (or vice versa), the module adheres to your
setting in the 'When a resource and role share an activity assignment' field (User
Preferences, Calculations tab, Assignment Staffing section). If you choose 'Always use
resource's Price per Unit,' the manual future period values for the existing role assignment
may be respread across future period buckets based on the values of the new resource.
Likewise, if you choose 'Always use role's Price per Unit,' the manual future period values
for the existing resource assignment may be respread across future period buckets
based on the new role's values.
Can I remove or replace a resource assignment with manual future period values?
Yes. When you replace the resource or role assigned to an activity, any manual future
period values entered for that assignment are preserved with the new assignment.
When you remove a resource or role assignment that has manual future period values,
the manual future period values are deleted. If other assignments with manual future
period values exist on the same activity, those assignments' manual future period values
may change based on the activity type and your user preference settings for assignment
staffing (User Preferences, Calculations tab). For more information on setting assignment
staffing preferences, refer to Select calculation options for resource and role
assignments.
Importing and exporting data
Can I exchange manual bucket data with other P6 Professional users using P6 XER files?
Yes, you can import and export manual future period buckets using P6 XER files.
Import considerations
You will lose manual future period buckets in a project you are updating with imported
data when all of the following are true:
The XER file you are importing was created using
P6.
The XER file you are importing DOES NOT contain
manual future period buckets.
You choose the Update Existing import action.
You choose to update activity resource assignments.
The project you are updating DOES contain manual
future period buckets.
In all other cases, manual future period buckets remain intact when you import an
XER file.

P6 Professional
335
Can I exchange manual bucket data with other P6 Professional users using P6 XML files?
Yes. When you export a project to a P6 XML file, manual future period buckets are
exported to the file.
When you import a P6 XML file to a project, all manual future period buckets that exist in
the project are retained.
Can I exchange manual bucket data with Oracle Contractor?
Oracle Contractor 6.1 and later users can exchange manual bucket data with P6
Professional using Contractor 6.1 XER files; however, manual future period buckets are
not supported in Oracle Contractor 5.0 and earlier versions.
When you export a project with manual bucket data to a Contractor 5.0 XER, manual
future period buckets are included in the XER file but are not imported to Contractor
(version 5.0 or earlier). When you import a Contractor 5.0 XER to a P6 Professional project
containing manual future period buckets, the manual future period buckets remain
intact.
Can I exchange manual bucket data with Oracle Contract Management?
No. However, the following task information you can import from Contract Management
may affect the spread of manual future period buckets:
Remaining Early Finish
Remaining Finish
Original Duration
Duration % Complete
If the duration of an activity with manual future period assignment buckets changes after
importing data from Contract Management, one of the following will occur:
For activities with a duration type of Fixed Duration & Units, the manual future period
units are logically spread over the new duration of the activity.
For activities with a duration type of Fixed Duration & Units/Time, the difference in units
will be removed from, or added to, the last bucket.
Can I exchange manual bucket data with Microsoft Project?
Yes. You can import and export manual future period buckets to Microsoft Project (MSP)
2002 and 2003 using MSP XML or MPP formats, and to MSP 2007 using MSP XML format.
Due to changes in Microsoft's supported import and export file formats, P6 Professional no
longer supports MPD, MPT, MPX, and MDB files. P6 Professional does not support import
and export using MSP 98 due to the manner in which time-phased data is stored in that
version. You will achieve the most accurate import/export results using MSP 2003.

P6 EPPM User's Guide
336
Export considerations
When you export a project to MSP:
Manual future period buckets are imported to MSP as a contoured curve.
If the Timescale Units setting in MSP is smaller than the setting in the P6 export file (as
specified in the 'Interval for time-distributed resource calculations' field in User
Preferences), the manual future period buckets are spread linearly across the smaller
timescale in MSP. If you change the MSP timescale setting to match the P6
Professional timescale setting, the buckets will display the proper values.
Since MSP does not use forecast dates, if the P6 export file displays time-distributed
data using forecast dates (as specified in User Preferences, Resource Analysis tab),
assignments with manual future period buckets are spread linearly in MSP.
For manually-planned assignments to activities with suspend and resume dates, MSP
honors the suspend and resume dates and spreads the budgeted or planned unit
values accordingly in the Baseline Work field; however, because P6's Actual Units and
Remaining (Early) Units are combined into MSP's Actual Work field, MSP only honors
actual and remaining values up to the Suspend Date or the Data Date, depending
on when the activity's suspend and resume dates fall. If the suspend and resume
dates are both before the Data Date, MSP spreads the Actual Work up to the Data
Date; if only the Suspend Date is before the Data Date, MSP spreads the Actual Work
up to the Suspend Date.
WBS Summary activities with manual future period assignment values are exported to
MSP; however, the manual future period values are not exported. In MSP, the total
budgeted or planned and remaining unit values for assignments to WBS Summary
activities are spread linearly across the duration of the assignment.
Import considerations
When you import a project from MSP:
Suspend and resume dates in MSP are not honored when imported to P6. When you
import an MSP project that has an activity with suspend and resume dates, the
suspend time is imported as a 0 (zero) bucket value for the assignment.
The MPX file format does not support time-phased data and therefore does not
support manual future period buckets. When you import an MPX file, if you choose
the Replace Existing import action and the project you are replacing contains
manual future period buckets, all manual buckets will be deleted.
Can I exchange manual bucket data with P3?
No. When you export a P6 Professional project that contains manual future period
assignment buckets, the total units for assignments with manual future period buckets are
spread evenly over the planned duration of the assignment in P3; the values you
manually entered are not saved.
P6 Professional
337
When you import a P3 project to a P6 Professional project that contains manual future
period assignment buckets, the manual values are deleted if you choose the Update
Existing or Replace Existing import option.
Miscellaneous
Can I update data globally for projects that have assignments with manual future period
values?
Yes. However, changing some values globally may cause manual future period values to
change or, in some cases, be deleted.
For activity resource assignments, globally changing the Planned Finish, Remaining Finish,
and Actual Start may cause manual future period values to change. Manual future
period values are deleted when you globally change the assigned Curve, specify an
Actual Finish date, or set the budgeted or planned and Remaining Units or Units/Time
(Labor, Non-Labor, or Material) to zero.
For activities, globally changing the Actual Start, Planned Finish, Planned or Original
Duration, Remaining Finish, or Remaining Duration may cause manual future period
values to change. Manual future period values are deleted when you globally change
the Duration Type to Fixed Units or Fixed Units/Time, specify an Actual Finish date, or set
the budgeted or planned Units/Time to zero.
Are manual future period values considered when I level resources?
Yes. When a project with manual future period buckets is leveled, assignments with
manual future period values are leveled in the same manner as assignments without
manual future period values.
Create a future period bucket planning layout
You can budget or plan future period resource/role assignments in any type of layout in
the Resource Assignments and Activities windows. This topic contains some steps you
may want to follow when you create a layout to use for future period bucket planning.
When you create a future period bucket planning layout, you should save the layout for
future use.

P6 EPPM User's Guide
338
1. Display editable future period bucket planning fields
You can enter future period budgeted or planned and remaining values in the Budgeted
or Planned Units and Remaining (Early) Units fields in the Resource Usage Spreadsheet. To
display these fields, click the Display Options bar and choose Spreadsheet Fields,
Customize. Move the Budgeted or Planned Units and Remaining Early Units fields to the
Selected Options list; you can also remove all other fields from the Selected Options list.
Click Apply, OK.
Tips
You can display the Actual Units field as well to compare the work that was
planned to be performed (Budgeted or Planned Units) for an assignment versus
the work that has actually occurred (Actual Units). Once an assignment is in
progress, if work is not being performed according to plan, you can adjust the
Remaining (Early) Units as necessary; or, if you choose to re-estimate an
assignment's remaining work, you can adjust the assignment's Budgeted or
Planned Units instead.
To see costs related to the assignments you are manually planning, display the
Budgeted or Planned Cost and Actual Cost fields.
2. Display the Curve, Budgeted or Planned Units, and Remaining (Early) Units columns
When you manually enter a value in a future period bucket for an assignment, the
module automatically enters a value of Manual in the assignment’s associated Curve
column. By displaying the Curve column, you can determine which assignments already
have an assigned resource curve, or a defined manual curve.
For assignments that do not have a defined total Budgeted or Planned Units or
Remaining (Early) Units value, it is useful to display the Budgeted or Planned Units and
Remaining (Early) Units columns. When you display these columns, you can enter or edit
an assignment's total Budgeted or Planned or remaining units to spread the units evenly
over the original or planned duration of the assignment, then manually modify the future
period distribution as necessary.
To display these columns, click the Layout Options bar and choose Columns, Customize.
Move the Curve, Budgeted or Planned Units, and Remaining (Early) Units columns to the
Selected Options list, then modify the remaining columns. Click Apply, OK.
3. Adjust the timescale to reflect your planning periods
Adjust the timescale in the Resource Usage Spreadsheet to reflect the planning periods
in which you typically plan future resource distribution. For example, if you plan your work
in daily buckets, adjust the timescale to Week/Day and enter hourly planning unit values.
Refer to Change a layout's timescale format for details on adjusting the timescale.

P6 Professional
339
Note
If you track past period actuals per financial period and plan to report
performance against manual budgeted or planned future period values, you
should enter future period planning values in financial period timescale units. You
can adjust the timescale to reflect your predefined financial periods. For example,
if your organization has defined weekly financial periods, set the timescale to
Week/Financial Period.
4. Logically group and sort data
Group and sort data in a way that enables you to easily identify resources/roles, the
activities to which they are assigned, and the activities’ associated projects (because
the same activity name may appear in different projects). For example, you can group
and sort the Resource Usage Spreadsheet by project and by resource. For detailed
instructions about grouping and sorting data, refer to Group and sort resource
assignments.
5. Filter out activities you don't want to manually plan
If you are planning future period resource distribution for a project that has already
started, you may want to apply a filter to display only the activities you want to plan,
such as activities that don't have an actual duration or that have a planned start after
the current date or data date.
Alternatively, if a project has already started and you want to update the remaining units
for activities that are in progress, you could apply a filter to display only activities that
have an Actual Start date and do not have an Actual Finish date.
Refer to Filter a layout for detailed instructions.
Manually enter future period assignment values
You can manually enter or edit future period assignment values per bucket for labor,
non-labor, and material resource assignments, as well as for role assignments. Before you
complete the steps below, refer to future period bucket planning FAQ (on page 314) for
important information to consider when you manually plan future period assignments.
1) In the Resource Assignments or Activities window, display the Resource Usage
Spreadsheet.
2) Create a future period bucket planning layout (on page 337).
In the Activities window, you are required to display resource assignment data for
open projects only. Showing data for all projects, causes the title of the Display
Options bar in the Resource Usage Spreadsheet to change to "Display: All Projects." To
display data for open projects only, click the Display Options bar, then choose Show
All Projects to remove the checkmark; the title of the Display Options bar changes to
"Display: Open Projects Only."

P6 EPPM User's Guide
340
3) For each resource assignment you want to manually plan, enter or edit the Planned
or Budgeted Units and/or the Remaining (Early) Units for each assignment bucket for
the original or planned duration of the activity.
Tips
If the total. budgeted or planned units or remaining units have not been defined
for an assignment, you can display the Budgeted or Planned Units and Remaining
(Early) Units columns, then enter the total budgeted or planned or remaining units
for the assignment. When you enter the total budgeted or planned or remaining
units for an assignment, the values are spread evenly over the budgeted or
planned duration of the activity. Then, you can manually modify the values to
define the planned resource distribution. If the total budgeted or planned or
remaining units have already been defined for an assignment, you can edit the
future period distribution as necessary.
You can apply a resource curve to an assignment before you manually enter/edit
future period values for the assignment. For example, if the assignment you want
to manually plan has a planned resource distribution that is similar to a defined
resource curve's distribution, you can apply the resource curve to the assignment.
When you apply the resource curve, future period values are spread across the
planned duration of the activity according to the resource curve distribution; you
can then manually modify the future period values as necessary. Once you
manually modify a resource curve's distribution, the curve is removed from the
assignment.
Assignment buckets that are available for editing display with a white
background; buckets you can not edit display with a gray background. For
information, see Why are some spreadsheet cells gray? in P6 Professional Help.
The values you should enter in the future period buckets are dependent on the
duration of your planning periods (buckets), the timescale you choose, and user
preference settings. For information, see How do user preference settings affect
manual future period planning? in P6 Professional Help.
See below for examples of manually-planned future period assignments.
Notes
If the project option 'Link Budgeted or Planned and At Completion for not started
activities' is selected (Project Details, Calculations tab) and you enter a value in
the Planned or Budgeted Units field for a not started activity, the module
automatically populates the Remaining Units field with the same value; the
reverse is also true. If this setting is not marked, you can enter different values for
the same future period in the Planned or Budgeted Units and Remaining Units
fields; in this case, the total values for each field are calculated independently for
the assignment. The examples below assume that this project option is selected
and the activities have not started.
You must have the 'Edit Future Periods' project privilege to manually enter or edit
future period data.
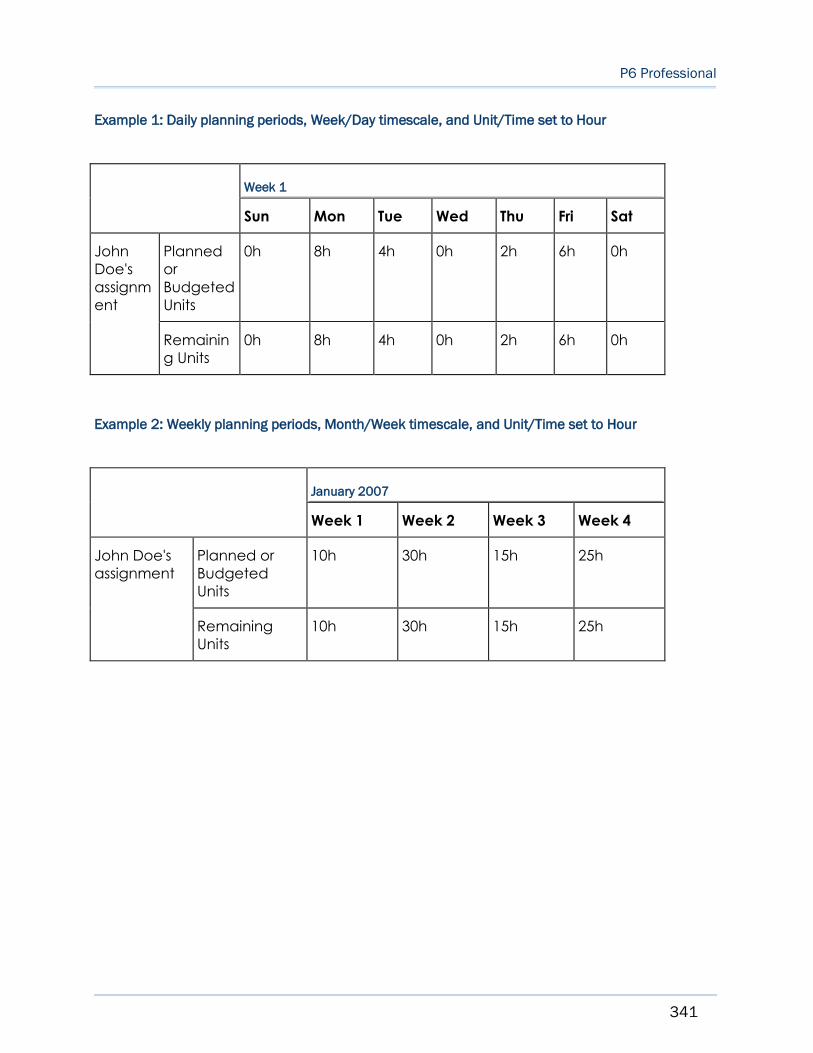
P6 Professional
341
Example 1: Daily planning periods, Week/Day timescale, and Unit/Time set to Hour
Week 1
Sun Mon Tue Wed Thu Fri Sat
John
Doe's
assignm
ent
Planned
or
Budgeted
Units
0h 8h 4h 0h 2h 6h 0h
Remainin
g Units
0h 8h 4h 0h 2h 6h 0h
Example 2: Weekly planning periods, Month/Week timescale, and Unit/Time set to Hour
January 2007
Week 1 Week 2 Week 3 Week 4
John Doe's
assignment
Planned or
Budgeted
Units
10h 30h 15h 25h
Remaining
Units
10h 30h 15h 25h

P6 EPPM User's Guide
342
Example 3: Weekly planning periods, Month/Week timescale, and Unit/Time set to Day
January 2007
Week 1 Week 2 Week 3 Week 4
John Doe's
assignment
Planned or
Budgeted
Units
2d 3d 1d 4d
Remaining
Units
2d 3d 1d 4d
Example 4: Monthly planning periods, Quarter/Month timescale, and Unit/Time set to Day
Q1 2007
Jan Feb Mar
John Doe's
assignment
Planned or
Budgeted Units
15d 20d 10d
Remaining Units 15d 20d 10d
Example 5: Monthly planning periods, Quarter/Month timescale, and Unit/Time set to Week
Q1 2007
Jan Feb Mar
John Doe's
assignment
Planned or
Budgeted Units
2w 3w 1w
Remaining Units 2w 3w 1w

P6 Professional
343
Editing Past Period Actual Spreads
Edit past period actual data
You can view and edit past period actual data for any financial period in the Activity
Table and the Resources tab of Activity Details. The available financial period columns
are listed in the Financial Period Value group of columns in the Columns dialog box.
You can display Activity Table columns for all of the following financial period fields:
(Period Name): Actual Expense Cost
(Period Name): Actual Labor Cost
(Period Name): Actual Labor Units
(Period Name): Actual Material Cost
(Period Name): Actual Nonlabor Cost
(Period Name): Actual Nonlabor Units
(Period Name): Earned Value Cost
(Period Name): Earned Value Labor Units
(Period Name): Planned Value Cost
(Period Name): Planned Value Labor Units
You can change the columns of the Activity Details, Resources tab, to display Actual
Cost and Actual Units columns for any financial period.
After you expose the columns you want, you can edit any value by clicking in the field.
Tips
There might be several financial periods defined in the Financial Periods
dictionary. The Columns dialog box lists all the fields listed above for the range of
financial periods you select in the User Preferences, Application tab. You must
specify a range of financial periods to display; otherwise, financial period columns
are not available.
To edit past period actual data, the actual and actual this period units and cost
must be linked in the project. Before editing past period actual data, verify that
the Link actual to date and actual this period units and costs option is selected on
the Project Details, Calculations tab.
Notes
You cannot edit past period actual data for activities that do not have an actual
start date. You can edit past period actual data for activities that have resource
assignments in the Resource Assignments window or in the Resources tab of
Activity Details.
You cannot edit past period actual data if the project is read only or checked out.
For milestone activities, you can only edit past period expense costs.

P6 EPPM User's Guide
344
You must be assigned the Edit Period Performance, View Project Cost/Financials,
Edit Project WBS Financials, and Add/Edit Project Activities Except Relationships
project privileges to edit past period actual data. You must be assigned the
appropriate project privileges as defined in P6 to edit past period actual data.
Project Check Out and Check In
Managing remote projects
You can "check out" projects so that they can be worked on remotely. Once a project is
checked out, it can no longer be modified until it has been checked in. In addition to
checking in the project, you may replace the existing project with the remote copy of
the project by using the Import wizard.
Check out a project
1) Open the projects you want to check out.
2) Choose File, Check Out.
3) Select the projects you want to check out.
To check out a project, it must be open. If the project you want to check out is not on
the list, click Cancel, open the project, and restart the wizard.
4) Type the name of the file and the location where the file will be saved.
5) Click Finish.
An XER file is created that exports complete project information to other P6
applications.
Note
To move between different wizard windows, click Prev or Next.
View the check-out status of a project
1) Choose Enterprise, Projects.
A red checkmark displays beside any project that is currently checked out.
2) Choose View, Show on Bottom, Project Details.

P6 Professional
345
3) Click the General tab, and check the status of the project in the Check Out Status
field. Privileged users can also change the status of a project in this field.
The Checked Out By field indicates the user that checked out the project.
The Date Checked Out field indicates the date and time the user checked out the
project.
Notes
Changing the status of a project to Checked Out or Checked In, in the General
tab, does not export project information or import updated project information. To
import or export information when checking in or out a project, select Check In or
Check Out on the File menu.
The Checked Out By and Date Checked Out fields are blank when the Check Out
Status is Checked In.
Modify check in update options
1) Open the projects you want to check in.
2) Choose File, Check In, then select the project you want to check in.
3) In the Update Project Options dialog box, select the layout you want to modify and
click Modify.
4) In the Modify Import Configuration dialog box, select the data you want to modify.
5) Select the action to perform during the check-in process.
6) Mark the Delete checkbox to remove unreferenced data, data in the project you are
updating but not included in the check-out file, from the project.
7) Click OK.
Note
The Delete field applies only to relationships to external projects, thresholds,
activities, activity relationships, and activity resource assignments. Global data
types are not affected by this setting.
Check in a project
1) Open the projects you want to check in.
2) Choose File, Check In.
3) Select the file you want to check in.
4) Double click the Import Action field to select how the project data is checked in.
5) Select the data to check in by modifying the layout configuration in the Update
Project Options dialog box.
6) Select the currency for the projects in the Currency Type dialog box.
7) Click Finish.

P6 EPPM User's Guide
346
Note
To move between different wizard windows, click Prev or Next.
Import from Contract Management
Linking Contract Management data
You can import data from the Contract Management module to update schedule
dates, cost information, the Activity Code dictionary, and the Cost Accounts dictionary.
You can also link documents in Contract Management to your project's activities.
Linking to Contract Management and importing data is a three step process detailed in
the following topics:
1) Link P6 Professional to Contract Management (on page 346)
2) Link your project to a Contract Management project (on page 347)
3) Import Contract Management data (on page 347)
Notes
A project can link to only one Contract Management project.
For information about the tables and fields that are converted, see the
ExpMappings9xandlater.pdf file located in the \Documentation\<language>
folder of the P6 EPPM physical media or download.
Link P6 Professional to Contract Management
Before you can link your project to a Contract Management project (on page 347), you
must first set up access to Contract Management in Admin Preferencesusing the P6
Application Settings. Setting up access is generally a one time task that is completed by
the Project Administrator to identify the Contract Management version to which you are
connecting. You must also identify the Contract Management web server.
To set up access to Contract Management:
1) Choose Admin, Admin Preferences.
2) Click the Options tab. Then, in the Link to Contract Management section, mark the
Enable Link to Contract Management checkbox. Next, choose the Contract
Management product version to which you are connecting. Type the URL and port
number to the Contract Management web server.
3) Click Close.
4) Once you set up access to Contract Management, with the required privilege you
can link your project to a Contract Management project (on page 347) to enable
users to import and view Contract Management data (on page 347).

P6 Professional
347
Link your project to a Contract Management project
Linking your project to a Contract Management project enables you to import Contract
Management data to update schedule dates, cost information, the Activity Codes
dictionary, and the Cost Accounts dictionary.
Before you can link your project, you must first Link P6 Professional to Contract
Management (on page 346) in Admin Preferences using the P6 Application Settings.
Setting up access is generally a one time task that is completed by the Project
Administrator to identify the Contract Management product version to which you are
connecting. Once access to Contract Management is set up, if you have the required
security privilege, you can then link your project to a project in Contract Management.
To link your project to a Contract Management project:
1) Choose Enterprise, Projects and display Project Details.
2) Select the project to which you want to link a Contract Management project.
3) Click the Contract Management tab, then mark the 'Allow this project to link with a
Contract Management Project' checkbox. (If the Contract Management, right click
on a tab at the bottom (for example, General) to display the Project Details dialog
box, and move Contract Management tabs section.)
4) In the Group Name:Project Name field, click . Select the name of the Contract
Management/Expedition project to link to your project, then click the Select button.
If you are using Expedition version 8.5, in the Group Name field, type the name of the
Expedition database that contains the project you want to link to. In the Project
Name field, type the name of the Expedition project to link to your project.
5) Choose whether you are prompted for your login and password when retrieving
Contract Management/Expedition data. If you choose to log in without being
prompted, type your login name and password.
Note: If an identical username and password do not already exist in both Contract
Management and P6 Professional, you will be prompted to enter the Contract
Management Name and Password. If an identical username and password already
exist in both Contract Management and P6 Professional, the Select Project Manager
Project popup menu will display for you to select the project.
6) Click Close.
See Also: Linking Contract Management Data (on page 346)

P6 EPPM User's Guide
348
Import Contract Management data
Once you Link P6 Professional to Contract Management (on page 346) and link your
project to a Contract Management project (on page 347), you can specify which
schedule, cost, and dictionary information to import.
1) Choose File, Import from Contract Management.
This option is enabled when the project is linked to a Contract Management project
on the Contract Management tab of Project Details.
2) Mark the checkbox next to each item that you want to import to your project.
3) Click Import, then click OK.
4) The Contract Management Import Report lists all the information that is imported to
your project. Click Commit Changes, then click Yes or No to save the report to a log
file. If you select Yes, specify a filename and location.
5) Click Close. Click Yes to save any changes you made to the import settings or No to
discard changes.
See Also: How data is imported from Contract Management (on page 348)
How data is imported from Contract Management
You can import activity and cost information from Contract Management.
New Activities
Any document in Contract Management that is linked to an activity ID is imported. If the
activity ID matches an ID in the project, the activity is updated. If activity IDs are assigned
in Contract Management that do not match an activity ID in the project, a new activity
is created.
All new activities are placed under the project’s root EPS node. The activities are
assigned the default duration for new activities; they do not contain any dependencies.
Activity Codes dictionary
Global Activity Code: The Spec Section code is available to all projects in the enterprise.
Project Activity Codes: The Responsibility, Contracts, Bid Package, and Submittal Activity
codes are imported at the project level. They are not available to all projects in the
enterprise.
The Responsibility code is imported from the Contacts subsection of the Project
Information section. The Abbreviation and Company Name columns are used as the
code value and description, respectively.
The Contracts code is imported from the Contracts and Purchase Orders subsections of
the Contract Information section. The No. and Description columns are used as the code
value and description, respectively.

P6 Professional
349
When you import the Submittal Activity code, the activity is assigned the code value Yes
to indicate that the item is a submittal.
How Activity Codes are imported
If the code or value does not exist, the imported code or value is added to the
dictionary.
If the code exists but the value does not, the value is added to the dictionary.
If the code and value exist, but the value assigned to the activity does not match the
imported value, the value on the activity is overwritten.
If the activity does not exist, it is created.
Cost Accounts dictionary
Cost codes in Contract Management are imported to the Cost Accounts dictionary. The
Cost Accounts dictionary is available to all projects in the enterprise. All items in the Cost
Worksheet are imported as cost accounts and placed under a root node having the
same name as the imported Contract Management project. The Cost Code and Title
columns are imported as the Cost Account ID and Cost Account Name, respectively.
Cost information
Cost information from Contract Management is imported as Expenses for activities.
Notes
For information about the tables and fields that are converted, see the
ExpMappings9xandlater.pdf file located in the \Documentation\<language>
folder of the P6 EPPM physical media or download.
Some data you import from Contract Management may impact manual future
period assignment values.
How? The following task information you can import from Contract Management
may affect the spread of manual future period buckets:
Remaining Early Finish
Remaining Finish
Original Duration
Duration % Complete
If the duration of an activity with manual future period assignment buckets
changes after importing data from Contract Management, one of the
following will occur:
For activities with a duration type of Fixed Duration & Units, the manual
future period units are logically spread over the new duration of the activity.
For activities with a duration type of Fixed Duration & Units/Time, the
difference in units will be removed from, or added to, the last bucket.

P6 EPPM User's Guide
350
Viewing Contract Management documents
You can view the following types of Contract Management documents as long as the
document is associated with an activity ID from your project schedule:
Drawing Sets
Daily Reports
Materials
Punch Lists
Submittals
Budgeted Contracts
Committed Contracts
Schedule of Values
Change Orders
Purchase Orders
You cannot add, delete, or modify Contract Management documents.
Notes
To display the most current Contract Management documents associated with
the selected project, choose File, Refresh Data.
For information about the tables and fields that are converted, see the
ExpMappings9xandlater.pdf file located in the \Documentation\<language>
folder of the P6 EPPM physical media or download.
See Also: View Contract Management documents (on page 350)
View Contract Management documents
Once you link your project to a Contract Management project (on page 347), you can
view Contract Management documents, such as submittals and contracts.
1) Choose File, Open, then select the project that is linked with Contract Management.
Mark the Retrieve Contract Management documents checkbox at the bottom of the
dialog box to retrieve Contract Management documents.
This checkbox is available only if your project is linked to a Contract Management
project.
2) Click OK to open the project.
3) Choose Project, Activities, then choose View, Show on Bottom, Activity Details.
4) Right-click in Activity Details, then choose Customize Activity Details.
5) In the Available Tabs section, select Contract Management Docs, then click the right
arrow to add it to the tabs displayed in Activity Details. Click OK.

P6 Professional
351
6) Click the Contract Management tab. Select a document, then click View. Then type
your Contract Management username and password. The document displays in your
default web browser.
Tip
Click the Refresh button to ensure you are viewing the most current Contract
Management documents associated with the selected project.
See Also:Viewing Contract Management documents (on page 350)