p10 – test of professional competence in … – test of professional competence in management...
TRANSCRIPT

P10 – Test of Professional Competence in Management Accounting
Thursday 20 November 2008 Instructions to candidates
You are allowed three hours to answer this question paper.
You are allowed 20 minutes reading time before the examination begins during which you should read the question paper and, if you wish, make annotations on the question paper. However, you will not be allowed, under any circumstances, to open the examination answer book and start writing or to use your calculator during the reading time.
This booklet contains the examination question and both the pre-seen and unseen elements of the case material.
Answer the question on page 15, which is detachable for ease of reference. The TOPCIMA Assessment Criteria are also included on page 15.
Maths Tables and Formulae are provided on pages 23 to 26.
Write your full examination number, paper number and the examination subject title in the spaces provided on the front of the examination answer book.
Also write your contact ID and name in the space provided in the right hand margin and seal to close
Contents of this booklet: Page
Pre-seen material – Electricity Generating Corporation
2 - 9
Pre-seen Appendices A – D 10 - 13
Question requirement and Assessment criteria
15
Unseen material
Unseen Appendix E
17 - 20
21
Maths Tables and Formulae 23 - 26
P10
– Te
st o
f Pro
fess
iona
l Com
pete
nce
in M
anag
emen
t Acc
ount
ing
TURN OVER
© The Chartered Institute of Management Accountants 2008
The Electricity Generating Corporation Introduction The Electricity Generating Corporation (EGC) is located in a democratic Asian country. EGC was established as a nationalised industry many years ago. Its home Government at that time had determined that the provision of the utility services of electricity generation and gas production should be managed directly by boards which were accountable directly to Government. In theory, nationalised industries should be run efficiently, on behalf of the public, without the need to provide any form of risk-related return to the funding providers. In other words, EGC, along with other nationalised industries is a non-profit making organisation. This, the Government claimed at the time, would enable prices charged to the final consumer to be kept low. Industry structure EGC operates 12 coal fired power stations across the country and transmits electricity through an integrated national grid system which it manages and controls. It is organised into three regions, Northern, Eastern and Western. Each region generates electricity which is sold to 10 private sector electricity distribution companies which are EGC's only customers. The 10 distribution companies are the suppliers of electricity to final users including households and industry within the country and are not under the management or control of EGC. They are completely independent companies owned by shareholders. The three EGC regions transmit the electricity they generate into the national grid system. A shortage of electricity generation in one region can be made up by taking from the national grid. This is particularly important when there is a national emergency, such as exceptional weather conditions. However, there have been times when EGC has not been able to fully satisfy demand and this has led to power cuts. The charges for electricity generated by EGC are regulated by the Government. EGC sells the electricity it generates to the 10 distribution companies at a uniform price. The 10 distribution companies then sell the electricity they purchase from EGC to the final customer. The Government requires EGC to maintain electricity generation at all times and has in the past guaranteed that its costs will be met in full by the central Government treasury. The nationalised utility industries were set up in a monopolistic position. As such, no other providers of these particular services were permitted to enter the market within the country. Therefore, EGC is the sole generator of electricity in the country. The electricity generating facilities, in the form of the 12 coal fired power stations were all built over 15 years ago and some date back to before EGC came into being. The structure of EGC is that it has a Management Board headed by a Managing Director who reports to senior civil servants in the Government’s Ministry of Energy. Financing of EGC The Government uses its own cash-based accounting system for all the nationalised industries, EGC included. EGC draws funding directly from the Government on a regular basis to cover its cash requirements for its capital needs and any shortfall in its operating costs. The Government does not operate an accruals-based accounting system for the nationalised industries. When EGC was formed, a large amount of Government cash funding was required initially to give it financial stability. The model of financing which emerged for EGC was one that resulted in its costs being guaranteed. As EGC is the monopoly generator of electricity in the country it charges the price approved by the Government to the 10 private sector electricity distribution companies. Any overall financial deficit EGC incurs is made up through additional Government funding. In practice, EGC continues to be a large cash consumer of Government funds. While recognising that it provides funds for capital equipment and renewals, the Government’s aim is
P10 2 November 2008
that EGC should at least cover its operating costs from revenue earned from the 10 private sector electricity distribution companies. There has been no other source of funding for EGC other than income from the 10 private sector electricity distribution companies and funds provided directly from the Government. The Government however, has now instituted a loan system to cover expenditure when EGC needs more cash than it collects in revenue. The argument the Minister of Energy has made is that the Government cannot simply provide unlimited funds for EGC. Any further demands for cash by EGC beyond what it collects in revenue can only be met by loans from the Government. No funding can be obtained from any other source. The loan facilities have been established to emphasise the principle that any additional funding from the Government is a liability to EGC and that it must pay interest on the loan and eventually pay back the capital sum. This principle was established by the Government in a drive to introduce a more commercial basis to EGC’s financing. Government loans have no fixed repayment dates and are made to EGC at a preferential rate of interest, fixed at 2% below the Government-set bank rate. Recently, the Minister of Energy has stated that productivity, return on assets and good stewardship of public funds are of high importance in managing all the nationalised industries. This is a particular challenge for EGC as it is subject to inflationary pressure which has increased in the country over the last year, and its Government-approved prices are set for a period on the basis of a low, rather than a commercial, price. The response of EGC's Managing Director has been that the role of the Management Board is to maintain the provision of electricity generation at any cost rather than maximising investment returns or providing value for money. Introduction of commercial accounting practices at EGC At the request of the Minister of Energy, a pro forma set of accounts incorporating an income statement, balance sheet, cash flow statement and a statement of the changes in equity have been produced for 2006/7 and 2007/8. This is the first time EGC has prepared accounts using commercial accounting principles. The purpose of these accounts is to illustrate how EGC's financial position would appear in a commercial environment. Extracts from this set of pro forma accounts are shown at Appendices A and B. Within these pro forma accounts some of EGC's loans have been "notionally" converted by the Government into ordinary shares in a further attempt to illustrate how EGC's financial reports would appear using the accepted format of commercial accounting principles. Financing costs are only payable on the Government loans as shown in the balance sheet. The pro forma accounts show a loss for the year ended 31 March 2008. Being a nationalised industry and effectively the first set of "commercially based" accounts, there are no retained earnings brought forward into 2006/7. The "Other reserves" is a sum which was vested in EGC when it was first nationalised. This represents the initial capital stock valued on a historical cost basis from the former electricity generating organisations which became EGC when it was nationalised. Capital market EGC exists in a country which has a well developed capital market relating both to equity and loan stock funding. There are well established international institutions, which are able to provide funds and corporate entities are free to issue their own loan stock in accordance with internationally recognised principles.
November 2008 3 P10
Energy consumption within the country Energy consumption has doubled in the country over the last 10 years. EGC continues to use coal fired power stations and now consumes most of the coal mined within the country. Gas consumption in the country has also increased significantly over the same period. Governance of EGC The Managing Director of the Management Board of EGC reports to senior civil servants in the Ministry of Energy. There are no shareholders and ownership of the Corporation rests entirely with the Government. There is a formal annual meeting with senior Government officials at which the financial accounts of EGC are approved. Beyond this there are occasional informal meetings between members of the Management Board and Government officials, particularly when the Minister of Energy is required to present information relating to electricity generation to the country’s Parliament. Structure of EGC All the staff employed by EGC are Government employees. The structure of EGC comprises a hierarchy of many levels of management authority. EGC is managed by the Management Board which comprises the Managing Director, the Directors of each of the Northern, Eastern and Western regions, a Technical Director, the Corporation Secretary and the Finance Director. With the exception of the Corporation Secretary and Finance Director, all the Management Board members are qualified electrical engineers. Within the structure of EGC’s headquarters, there are four support functions; engineering, finance, human resource management (HRM) and administration, each with its own chief officers, apart from HRM. The Senior HRM Officers and Chief Administrative Officer report to the Corporation Secretary. The Chief Accountant reports to the Finance Director and the Chief Engineer to the Technical Director. These functions are replicated in each region, each with its own regional officers and support staff. A structure chart and organisational staffing information is given at Appendices C and D for headquarters and a sample region which shows the engineering function under the heading of “Technical Staff” and ‘’Engineering Staff’’, the finance function under the heading of “Finance Staff” and ‘’Accountancy Staff’’, and HRM and administrative functions under the heading of “Secretariat Staff”. The number of professional engineering and operational staff has increased over the last 10 years in a period when demand for electricity has been increasing. The increase in operational employees has led to an increase in managerial and administrative staff at EGC. At EGC headquarters the management and administrative staff head count has increased to three times its level of a decade ago. In total, the number of staff employed by EGC at 31 March 2008 was 11,608 full time equivalent staff. Management of EGC The Managing Director and Regional Directors all studied in the field of electrical engineering at the country's leading university and have worked together for a long time. Although they did not all attend the university at the same time, they have a strong belief in the quality of their education. After graduation from university, each of the Regional Directors and the Managing Director started work at EGC in a junior capacity and then subsequently gained professional electrical engineering qualifications. They believe that the experience of working up through the ranks of EGC has enabled them to have a clear understanding of EGC’s culture and the technical aspects of the industry as a whole. The Management Board meets formally on a monthly basis but the Regional Directors and the Managing Director regularly meet together on a social level, outside the Management Board meetings at least once a month. One Regional Director was overheard to remark to his Regional Engineer that the only function of the Management Board meetings was to formally agree the decisions made by the Regional Directors and the Managing Director on the golf course.
P10 4 November 2008
The Technical Director is also a qualified electrical engineer but is not a graduate of the same university as the Managing Director and Regional Directors. She obtained a first class honours degree in Engineering with Business. After qualifying as an electrical engineer she took an MBA degree at a prestigious European university and is currently studying for a PhD in electrical engineering on a part-time basis. The Technical Director and the Finance Director tend to work closely together in attempting to introduce improvements in financial control within EGC. The Corporation Secretary has held his post for 22 years and expects to retire in two years’ time. He too has risen through the ranks of EGC, having first started working as a junior clerk in a regional office nearly 40 years ago. He studied hard and obtained a recognised qualification as a corporate secretary by undertaking correspondence courses. In his period of tenure he has been proud to provide the statutory returns as required by different Government ministries. He has always carried out the instructions of the Managing Directors of EGC without question as he has a strong sense of duty. Similarly, he expects total loyalty from the EGC headquarters staff who report to him. The Finance Director is a graduate and a Fellow of CIMA. He has worked in several private enterprise organisations, engaged both in the retail and manufacturing sectors. Since he joined EGC in April 2008, he has been trying to introduce a system of budgetary control as he recognises that the Government is aiming to improve economy and efficiency while, at the same time, maintaining effectiveness in the nationalised industries as a whole. This initiative has been hampered by the fact that all the staff in the regions, including the finance staff, report to the relevant Regional Director and not the functional staff at headquarters. At a recent Management Board meeting, the Managing Director made it clear to the Finance Director that, in his view, the main purpose of EGC is to maintain electricity generation whatever the financial implications. The Regional Directors and the Managing Director all agree that the Government will not reduce its commitment to funding EGC as this would threaten electricity generation. The Finance Director responded by reminding the members of the Management Board that now the Government is making loans not financial grants to EGC and that there is an obligation on EGC to repay these loans at some point in the future. The Managing Director replied that:
“Irrespective of whether it is a loan or a gifted payment, the money is still found by Government and our job is to maintain electricity generation. It is not the role of the Management Board to worry about where the money comes from or in what form it arrives. We can leave that to the country's treasury."
The Managing Director then added to the Finance Director: "Do you realistically expect the Government to demand repayment? I don't."
Decision making at EGC Decision making within EGC is centralised. All decisions on capital expenditure are made by the Management Board and the Regional Directors are able to strongly influence these decisions. Operational decisions are made in each region. Any decision which requires non recurring expenditure over $5,000 must be made by the Regional Management Board. If the sum required is over $1 million, the decision is referred to the EGC Management Board. At EGC headquarters, decisions on expenditure relating to headquarters operations are delegated to the relevant EGC Management Board member but any non recurring expenditure over $5,000 must be referred to the Managing Director for approval. There is a strong culture throughout EGC of committee structures and of documentation being required to support almost any action or activity. Power generation EGC operates 12 coal fired power stations across the country. There is a well developed coal mining industry in the country but extraction is becoming more expensive. There is no other form of electricity generation in the country except for some wind turbine power experiments which only produce a small fraction of the country’s electricity needs.
November 2008 5 P10
The Minister of Energy has stated that the country should progress towards more efficient and also renewable forms of power generation methods. This followed an announcement by the Prime Minister that the country needed to review how it could provide secure energy supplies and also reduce its impact on global warming. Researchers in the country have cited France as an example of a country with a nationalised electricity industry which now generates most of its electricity from nuclear power. The country in which EGC is situated has no nuclear power stations. Some members of the scientific community have concluded that the country will not be able to reduce its harmful emissions without developing a nuclear power generation programme. (The term “harmful emissions” in this context, refers to pollution coming out of electricity generating power stations which damage the environment.) The country's leading researcher into energy development has warned that without nuclear power generation, there will be increased usage of coal. This will generate ever more harmful emissions which will lead to an increase, not a decrease, in global warming. This will attract major criticism from other countries. The researcher added that reliance on wave and solar power was not realistic as their development was not going to be speedy enough to replace existing power generation methods and meet the ever increasing demands for electricity. He did however acknowledge the potential benefit of using wind turbines as a means of environmentally friendly power generation. Another researcher has encouraged the Minister of Energy to clearly set out for the public how nuclear power can contribute to reducing harmful emissions. In the past, EGC tended to over estimate demand and so over-capacity was built into the system, which led to higher costs. That position has now changed and there have been power cuts due to EGC sometimes being unable to fully satisfy demand. No new power stations have been built in the last 15 years. EGC generates electricity using coal fired power stations. The Managing Director and Regional Directors of EGC are not very enthusiastic about other methods of electricity generation and have publicly stated their opposition to nuclear power. Their main concern has been on the grounds of public safety and the safe disposal of spent nuclear fuel. Quite apart from the very large capital investment which would be needed to establish nuclear power stations, they claim that the case for nuclear fuelled electricity production has not yet been proved. In particular, they argue that the cost of decommissioning a nuclear power station is very high. Little research has been undertaken by EGC into alternative methods of power generation or the impact on the environment of continuing to use coal for fuel. The only research that has been done in the past was on ways of generating greater power yields from coal fuel sources. Unsurprisingly, much of this research has been funded by the country's coal production industry.
Price charged by EGC for electricity generated and EGC’s cost structure
A kilowatt (kW) is a unit of energy, representing the rate at which energy is used or produced. EGC, in line with most electricity generators and suppliers in other countries, charges its customers by the kilowatt hour (kWh). A kWh is a unit of energy and represents one hour of electricity consumption at a constant rate of 1 kW. For example an electric fire rated at 1 kWh will consume 1 kW of electricity in one hour. The Government approved price charged by EGC for electricity in 2007/8 was $0⋅22 per kWh.
In total, in the financial year 2007/8 EGC generated and sold 60,000 million kilowatt hours of electricity to the 10 private sector distribution companies (compared with 58,000 million kilowatt hours in 2006/7).
P10 6 November 2008
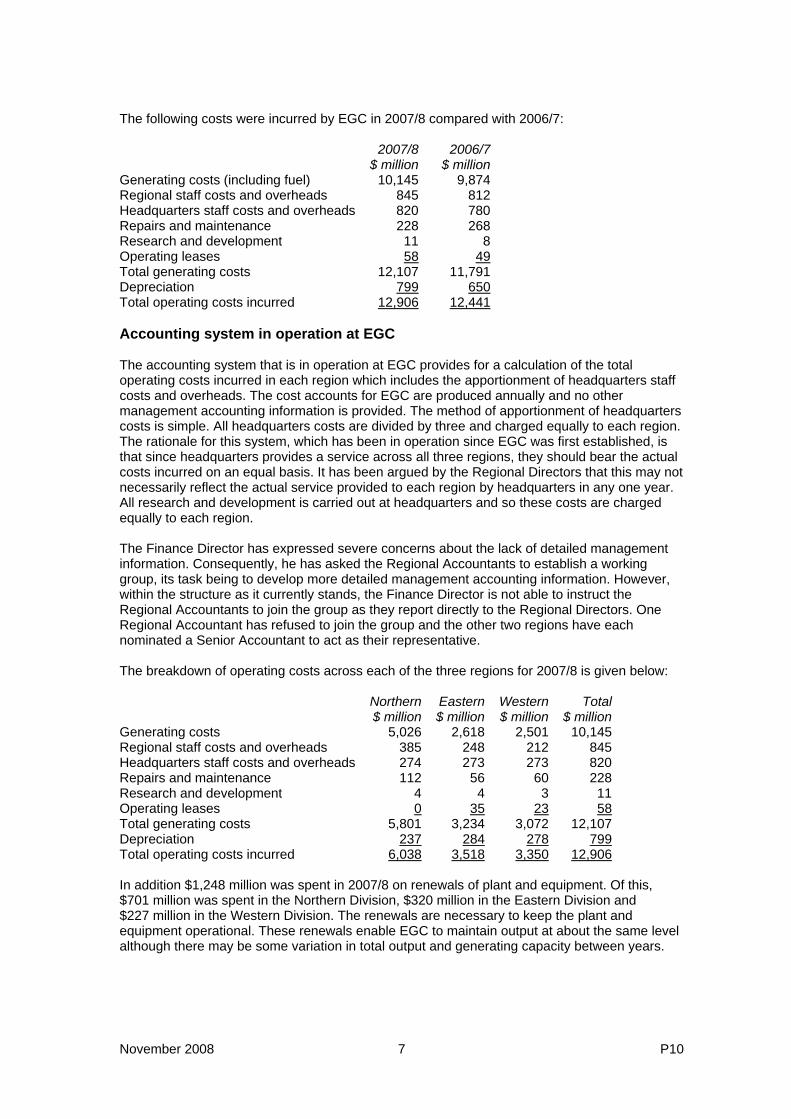
The following costs were incurred by EGC in 2007/8 compared with 2006/7: 2007/8 2006/7 $ million $ millionGenerating costs (including fuel) 10,145 9,874Regional staff costs and overheads 845 812Headquarters staff costs and overheads 820 780Repairs and maintenance 228 268Research and development 11 8Operating leases 58 49Total generating costs 12,107 11,791Depreciation 799 650Total operating costs incurred 12,906 12,441 Accounting system in operation at EGC The accounting system that is in operation at EGC provides for a calculation of the total operating costs incurred in each region which includes the apportionment of headquarters staff costs and overheads. The cost accounts for EGC are produced annually and no other management accounting information is provided. The method of apportionment of headquarters costs is simple. All headquarters costs are divided by three and charged equally to each region. The rationale for this system, which has been in operation since EGC was first established, is that since headquarters provides a service across all three regions, they should bear the actual costs incurred on an equal basis. It has been argued by the Regional Directors that this may not necessarily reflect the actual service provided to each region by headquarters in any one year. All research and development is carried out at headquarters and so these costs are charged equally to each region. The Finance Director has expressed severe concerns about the lack of detailed management information. Consequently, he has asked the Regional Accountants to establish a working group, its task being to develop more detailed management accounting information. However, within the structure as it currently stands, the Finance Director is not able to instruct the Regional Accountants to join the group as they report directly to the Regional Directors. One Regional Accountant has refused to join the group and the other two regions have each nominated a Senior Accountant to act as their representative. The breakdown of operating costs across each of the three regions for 2007/8 is given below: Northern Eastern Western Total $ million $ million $ million $ million Generating costs 5,026 2,618 2,501 10,145 Regional staff costs and overheads 385 248 212 845 Headquarters staff costs and overheads 274 273 273 820 Repairs and maintenance 112 56 60 228 Research and development 4 4 3 11 Operating leases 0 35 23 58Total generating costs 5,801 3,234 3,072 12,107 Depreciation 237 284 278 799Total operating costs incurred 6,038 3,518 3,350 12,906 In addition $1,248 million was spent in 2007/8 on renewals of plant and equipment. Of this, $701 million was spent in the Northern Division, $320 million in the Eastern Division and $227 million in the Western Division. The renewals are necessary to keep the plant and equipment operational. These renewals enable EGC to maintain output at about the same level although there may be some variation in total output and generating capacity between years.
November 2008 7 P10
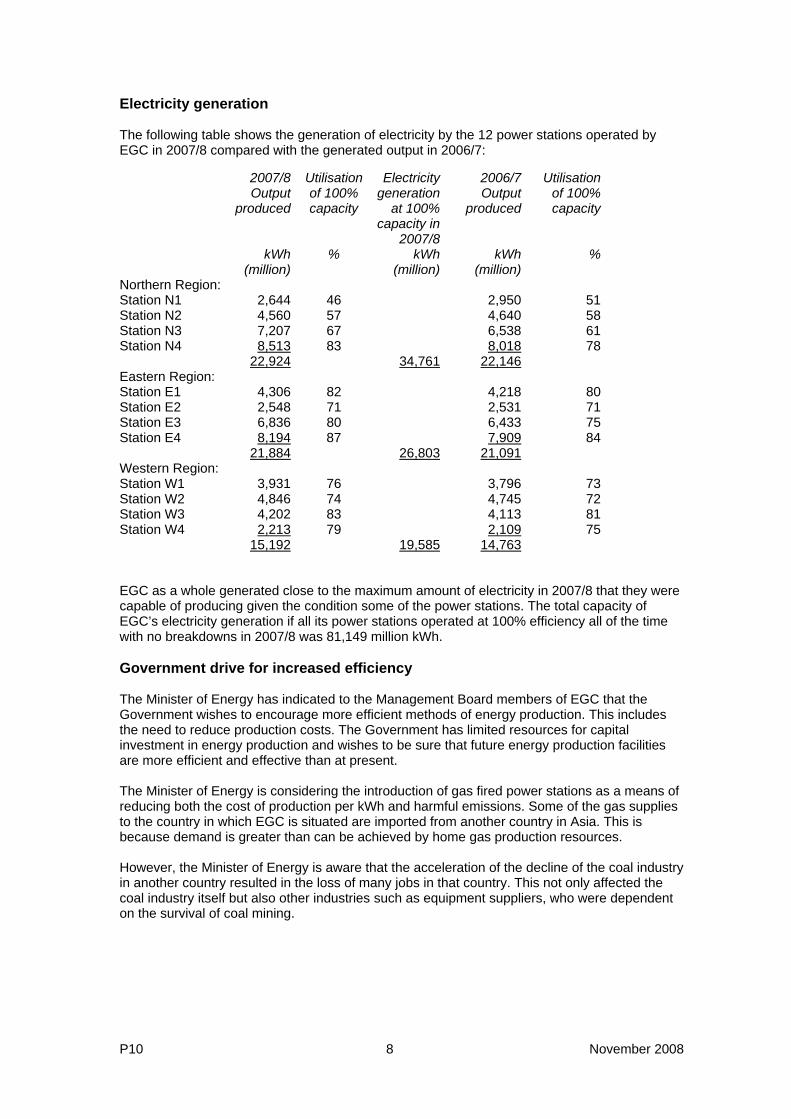
Electricity generation The following table shows the generation of electricity by the 12 power stations operated by EGC in 2007/8 compared with the generated output in 2006/7: 2007/8 Utilisation Electricity 2006/7 Utilisation Output of 100% generation Output of 100% produced capacity at 100%
capacity in 2007/8
produced capacity
kWh (million)
% kWh (million)
kWh (million)
%
Northern Region: Station N1 2,644 46 2,950 51 Station N2 4,560 57 4,640 58 Station N3 7,207 67 6,538 61 Station N4 8,513 83 8,018 78 22,924 34,761 22,146 Eastern Region: Station E1 4,306 82 4,218 80 Station E2 2,548 71 2,531 71 Station E3 6,836 80 6,433 75 Station E4 8,194 87 7,909 84 21,884 26,803 21,091 Western Region: Station W1 3,931 76 3,796 73 Station W2 4,846 74 4,745 72 Station W3 4,202 83 4,113 81 Station W4 2,213 79 2,109 75 15,192 19,585 14,763 EGC as a whole generated close to the maximum amount of electricity in 2007/8 that they were capable of producing given the condition some of the power stations. The total capacity of EGC’s electricity generation if all its power stations operated at 100% efficiency all of the time with no breakdowns in 2007/8 was 81,149 million kWh. Government drive for increased efficiency The Minister of Energy has indicated to the Management Board members of EGC that the Government wishes to encourage more efficient methods of energy production. This includes the need to reduce production costs. The Government has limited resources for capital investment in energy production and wishes to be sure that future energy production facilities are more efficient and effective than at present. The Minister of Energy is considering the introduction of gas fired power stations as a means of reducing both the cost of production per kWh and harmful emissions. Some of the gas supplies to the country in which EGC is situated are imported from another country in Asia. This is because demand is greater than can be achieved by home gas production resources. However, the Minister of Energy is aware that the acceleration of the decline of the coal industry in another country resulted in the loss of many jobs in that country. This not only affected the coal industry itself but also other industries such as equipment suppliers, who were dependent on the survival of coal mining.
P10 8 November 2008

General election called In a surprise move, the Prime Minister has called a general election. Among a number of other major proposals, the governing political party has proposed that one of its first tasks if re-elected would be to make the nationalised industries more efficient and accountable. The main opposition party has included the privatisation of all nationalised industries as a priority if it is elected. There are two main political parties in the country and while other political parties do exist and compete for seats in parliament, they have not been able to form a Government in the past. The probability that one of the two main political parties will win the election is therefore very high. A hung parliament, where no one political party has overall control, has a very low probability and can be ignored.
November 2008 9 P10
APPENDIX A
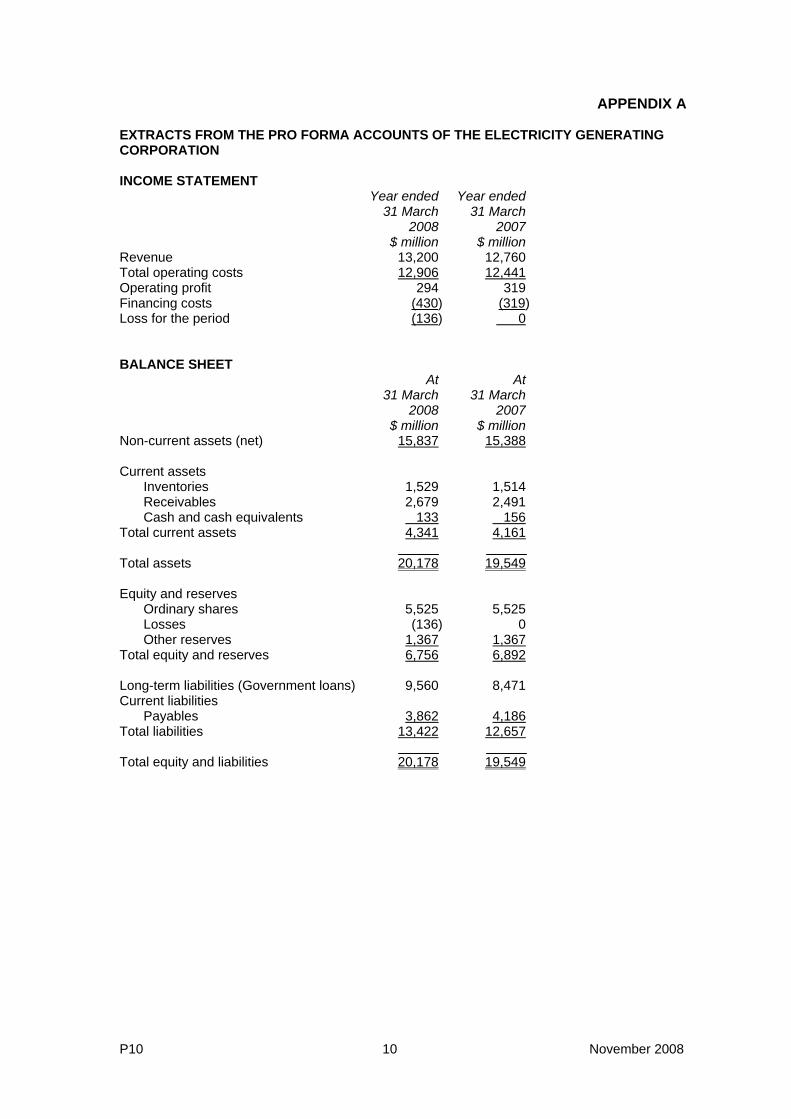
EXTRACTS FROM THE PRO FORMA ACCOUNTS OF THE ELECTRICITY GENERATING CORPORATION INCOME STATEMENT Year ended Year ended 31 March 31 March 2008 2007 $ million $ million Revenue 13,200 12,760 Total operating costs 12,906 12,441Operating profit 294 319 Financing costs (430) (319)Loss for the period (136) 0 BALANCE SHEET At At 31 March 31 March 2008 2007 $ million $ million Non-current assets (net) 15,837 15,388 Current assets
Inventories 1,529 1,514 Receivables 2,679 2,491 Cash and cash equivalents 133 156
Total current assets 4,341 4,161 Total assets 20,178 19,549 Equity and reserves
Ordinary shares 5,525 5,525 Losses (136) 0 Other reserves 1,367 1,367
Total equity and reserves 6,756 6,892 Long-term liabilities (Government loans) 9,560 8,471 Current liabilities
Payables 3,862 4,186Total liabilities 13,422 12,657 Total equity and liabilities 20,178 19,549
P10 10 November 2008

APPENDIX B CASH FLOW STATEMENT FOR THE YEAR ENDED 31 MARCH 2008 $ million $ million Cash flows from operating activities:
Loss (136)Adjustments for:
Interest expense 430 Depreciation 799 (Increase)/decrease in inventories (15)(Increase)/decrease in receivables (188)Increase/(decrease) in payables (324)
702Cash generated from operations 566 Financing costs (430)Net cash from operating activities 136
Cash flows from investing activities:
Purchase of non-current assets (1,248) (renewals of plant and equipment) Cash inflow/(outflow) before financing (1,112) Cash flows from financing activities:
Proceeds from Government loans 1,089
Net decrease in cash and cash equivalents (23)Cash and cash equivalents at 31 March 2007 156Cash and cash equivalents at 31 March 2008 133 STATEMENT OF CHANGES IN EQUITY FOR THE YEAR ENDED 31 MARCH 2008 Share Other Retained Total capital reserves earnings $ million $ million $ million $ million Balance at 1 April 2007 5,525 1,367 0 6,892 Loss for the period (136) (136)Balance at 31 March 2008 5,525 1,367 (136) 6,756
November 2008 11 P10
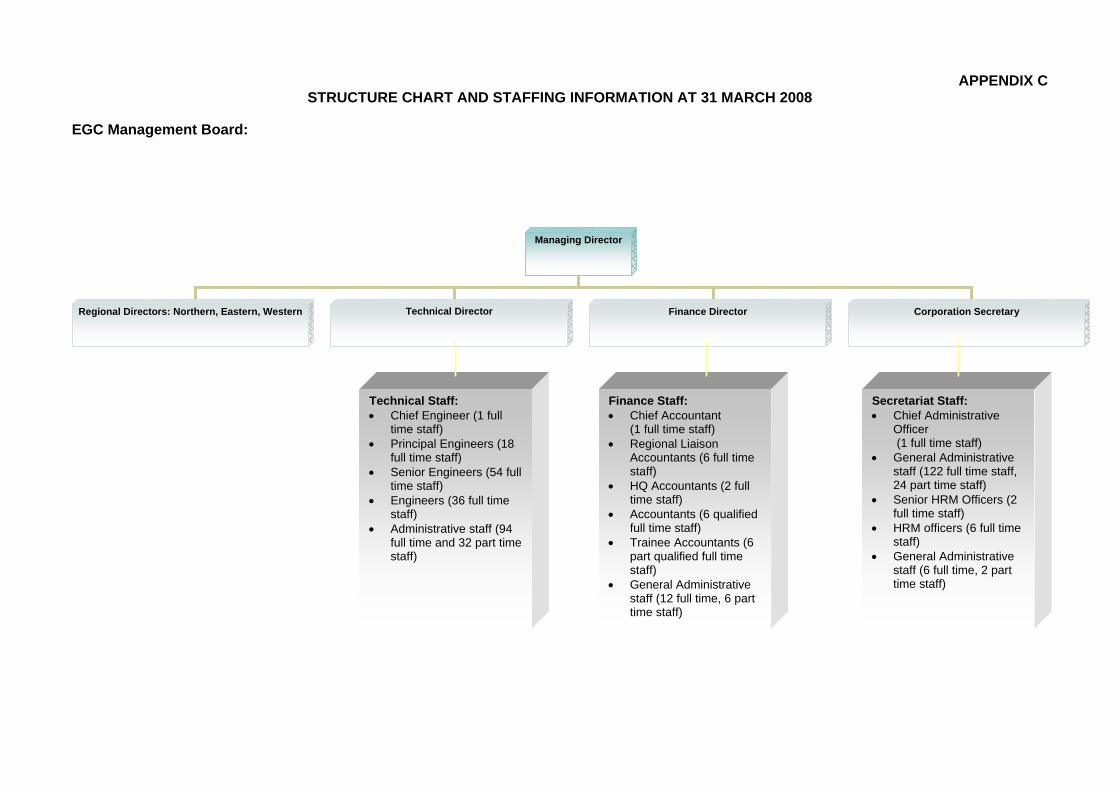
APPENDIX C STRUCTURE CHART AND STAFFING INFORMATION AT 31 MARCH 2008
EGC Management Board:
Managing Director
Regional Directors: Northern, Eastern, Western Technical Director
Finance Director Corporation Secretary
Technical Staff:• Chief Engineer (1 full
time staff) • Principal Engineers (18
full time staff) • Senior Engineers (54 full
time staff) • Engineers (36 full time
staff) • Administrative staff (94
full time and 32 part time staff)
Finance Staff:• Chief Accountant
(1 full time staff) • Regional Liaison
Accountants (6 full time staff)
• HQ Accountants (2 full time staff)
• Accountants (6 qualified full time staff)
• Trainee Accountants (6 part qualified full time staff)
• General Administrative staff (12 full time, 6 part time staff)
Secretariat Staff:• Chief Administrative
Officer (1 full time staff)
• General Administrative staff (122 full time staff, 24 part time staff)
• Senior HRM Officers (2 full time staff)
• HRM officers (6 full time staff)
• General Administrative staff (6 full time, 2 part time staff)
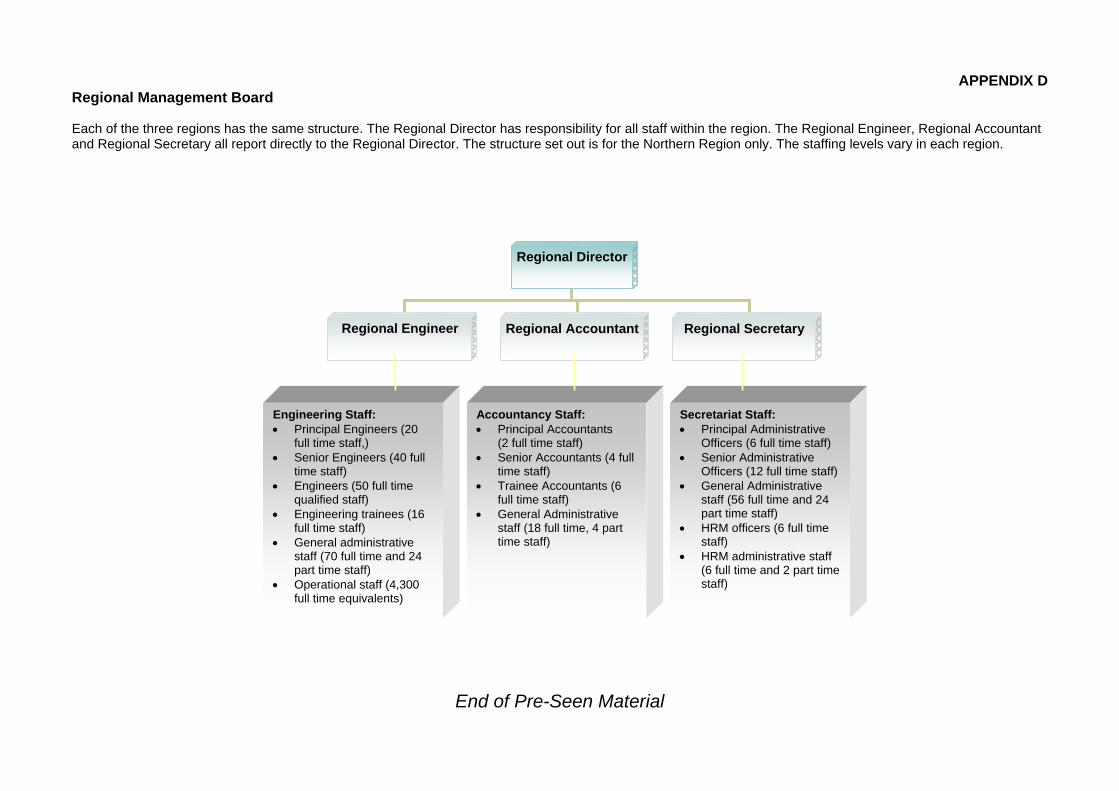
APPENDIX D Regional Management Board Each of the three regions has the same structure. The Regional Director has responsibility for all staff within the region. The Regional Engineer, Regional Accountant and Regional Secretary all report directly to the Regional Director. The structure set out is for the Northern Region only. The staffing levels vary in each region.
Regional Director
Regional Engineer
Regional Accountant Regional Secretary
Engineering Staff:• Principal Engineers (20
full time staff,) • Senior Engineers (40 full
time staff) • Engineers (50 full time
qualified staff) • Engineering trainees (16
full time staff) • General administrative
staff (70 full time and 24 part time staff)
• Operational staff (4,300 full time equivalents)
Accountancy Staff:• Principal Accountants
(2 full time staff) • Senior Accountants (4 full
time staff) • Trainee Accountants (6
full time staff) • General Administrative
staff (18 full time, 4 part time staff)
Secretariat Staff:• Principal Administrative
Officers (6 full time staff) • Senior Administrative
Officers (12 full time staff)• General Administrative
staff (56 full time and 24 part time staff)
• HRM officers (6 full time staff)
• HRM administrative staff (6 full time and 2 part time staff)
End of Pre-Seen Material

This page is blank
P10 14 November 2008
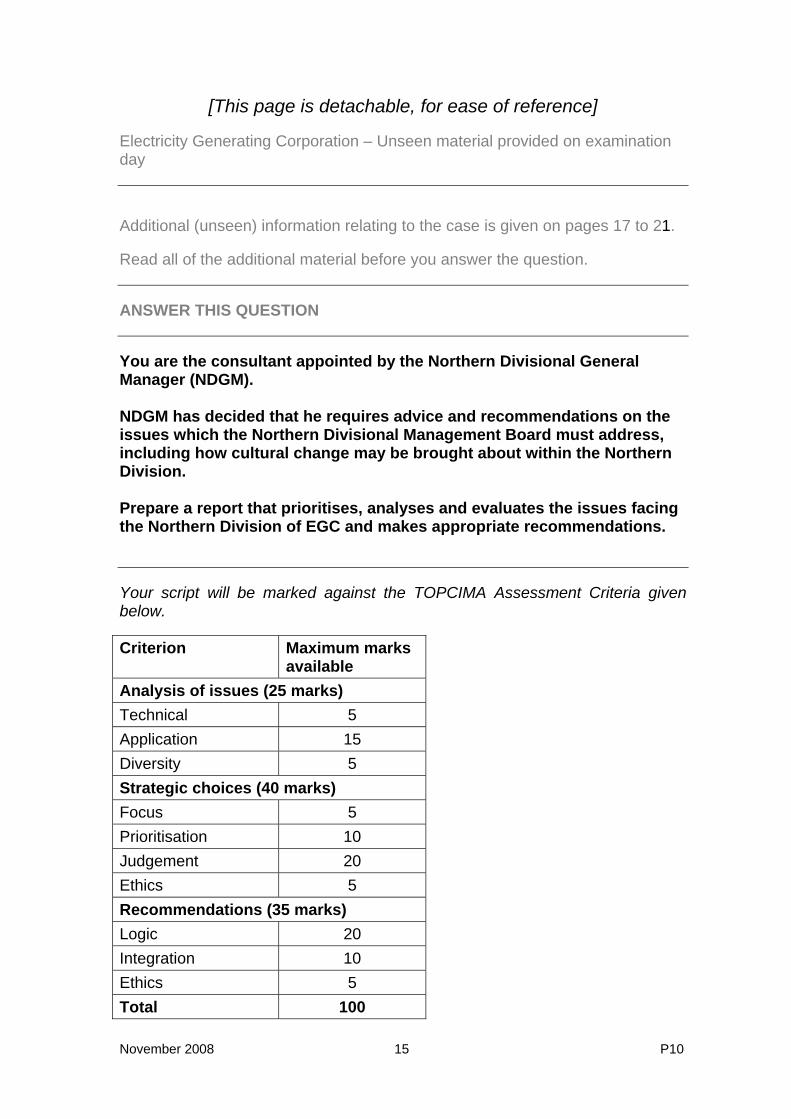
[This page is detachable, for ease of reference] Electricity Generating Corporation – Unseen material provided on examination day Additional (unseen) information relating to the case is given on pages 17 to 21. Read all of the additional material before you answer the question. ANSWER THIS QUESTION You are the consultant appointed by the Northern Divisional General Manager (NDGM). NDGM has decided that he requires advice and recommendations on the issues which the Northern Divisional Management Board must address, including how cultural change may be brought about within the Northern Division. Prepare a report that prioritises, analyses and evaluates the issues facing the Northern Division of EGC and makes appropriate recommendations. Your script will be marked against the TOPCIMA Assessment Criteria given below. Criterion Maximum marks
available Analysis of issues (25 marks) Technical 5 Application 15 Diversity 5 Strategic choices (40 marks) Focus 5 Prioritisation 10 Judgement 20 Ethics 5 Recommendations (35 marks) Logic 20 Integration 10 Ethics 5 Total 100
November 2008 15 P10

This page is blank
P10 16 November 2008
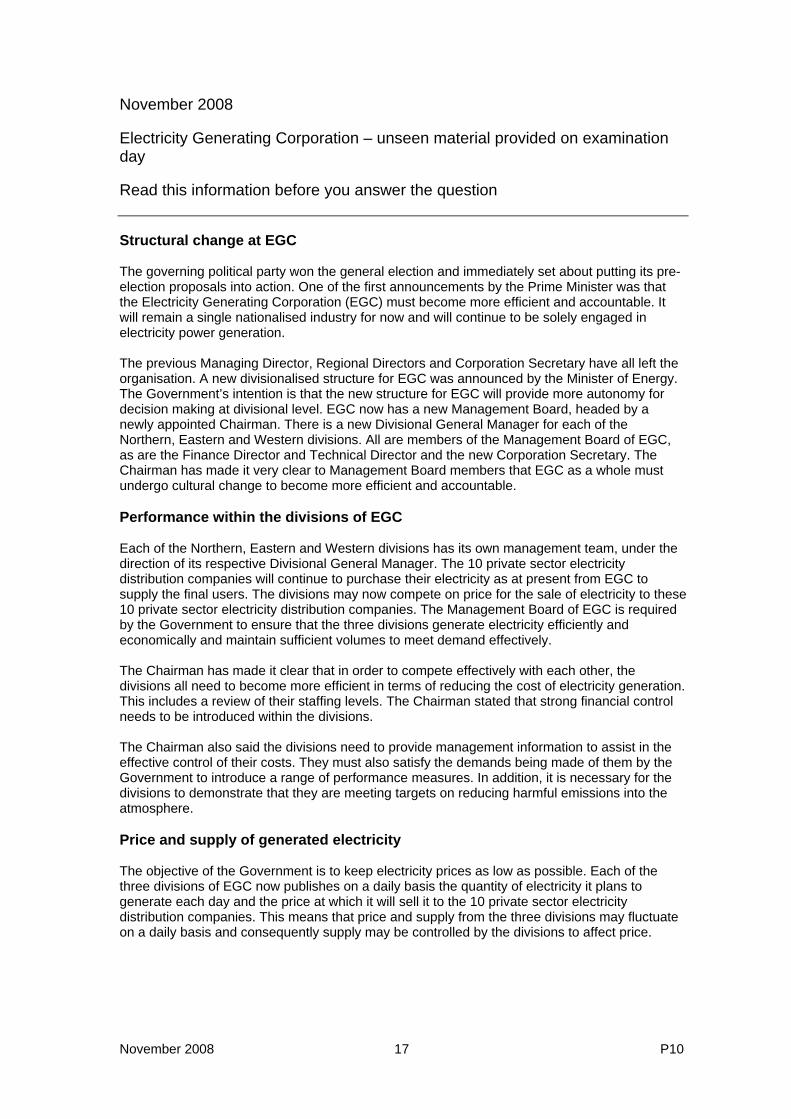
November 2008 Electricity Generating Corporation – unseen material provided on examination day Read this information before you answer the question Structural change at EGC The governing political party won the general election and immediately set about putting its pre-election proposals into action. One of the first announcements by the Prime Minister was that the Electricity Generating Corporation (EGC) must become more efficient and accountable. It will remain a single nationalised industry for now and will continue to be solely engaged in electricity power generation. The previous Managing Director, Regional Directors and Corporation Secretary have all left the organisation. A new divisionalised structure for EGC was announced by the Minister of Energy. The Government’s intention is that the new structure for EGC will provide more autonomy for decision making at divisional level. EGC now has a new Management Board, headed by a newly appointed Chairman. There is a new Divisional General Manager for each of the Northern, Eastern and Western divisions. All are members of the Management Board of EGC, as are the Finance Director and Technical Director and the new Corporation Secretary. The Chairman has made it very clear to Management Board members that EGC as a whole must undergo cultural change to become more efficient and accountable. Performance within the divisions of EGC Each of the Northern, Eastern and Western divisions has its own management team, under the direction of its respective Divisional General Manager. The 10 private sector electricity distribution companies will continue to purchase their electricity as at present from EGC to supply the final users. The divisions may now compete on price for the sale of electricity to these 10 private sector electricity distribution companies. The Management Board of EGC is required by the Government to ensure that the three divisions generate electricity efficiently and economically and maintain sufficient volumes to meet demand effectively. The Chairman has made it clear that in order to compete effectively with each other, the divisions all need to become more efficient in terms of reducing the cost of electricity generation. This includes a review of their staffing levels. The Chairman stated that strong financial control needs to be introduced within the divisions. The Chairman also said the divisions need to provide management information to assist in the effective control of their costs. They must also satisfy the demands being made of them by the Government to introduce a range of performance measures. In addition, it is necessary for the divisions to demonstrate that they are meeting targets on reducing harmful emissions into the atmosphere. Price and supply of generated electricity The objective of the Government is to keep electricity prices as low as possible. Each of the three divisions of EGC now publishes on a daily basis the quantity of electricity it plans to generate each day and the price at which it will sell it to the 10 private sector electricity distribution companies. This means that price and supply from the three divisions may fluctuate on a daily basis and consequently supply may be controlled by the divisions to affect price.
November 2008 17 P10
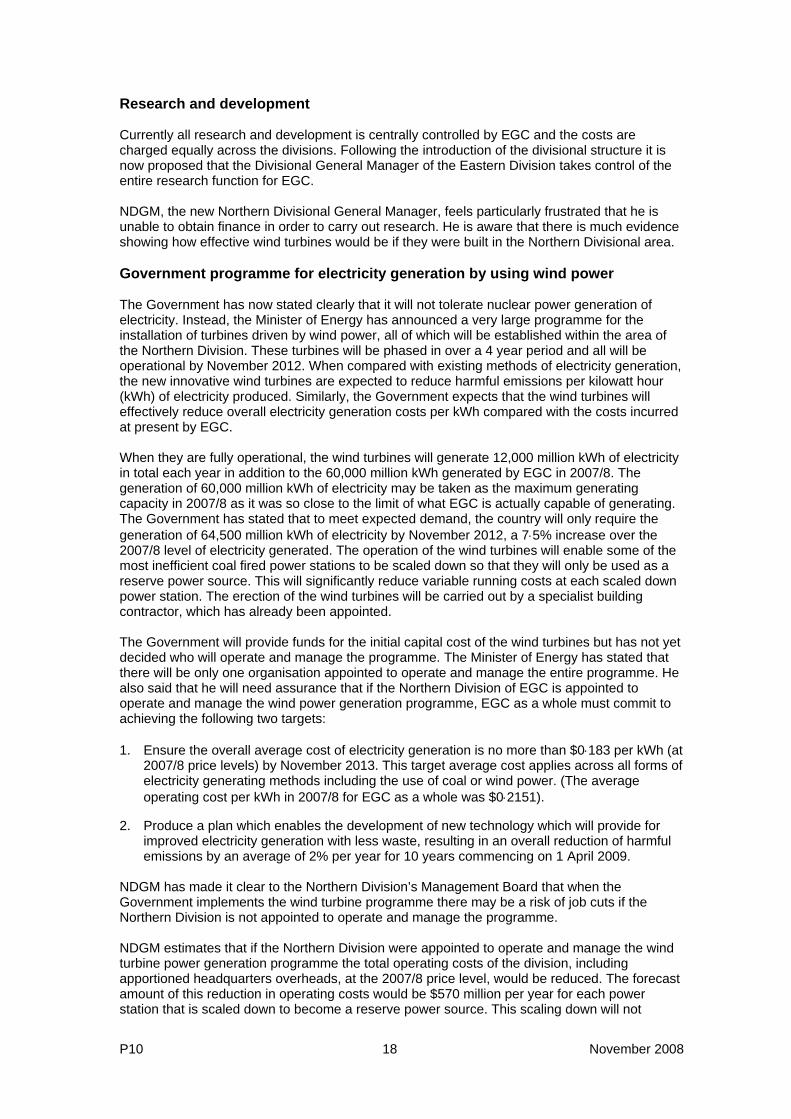
Research and development Currently all research and development is centrally controlled by EGC and the costs are charged equally across the divisions. Following the introduction of the divisional structure it is now proposed that the Divisional General Manager of the Eastern Division takes control of the entire research function for EGC. NDGM, the new Northern Divisional General Manager, feels particularly frustrated that he is unable to obtain finance in order to carry out research. He is aware that there is much evidence showing how effective wind turbines would be if they were built in the Northern Divisional area. Government programme for electricity generation by using wind power The Government has now stated clearly that it will not tolerate nuclear power generation of electricity. Instead, the Minister of Energy has announced a very large programme for the installation of turbines driven by wind power, all of which will be established within the area of the Northern Division. These turbines will be phased in over a 4 year period and all will be operational by November 2012. When compared with existing methods of electricity generation, the new innovative wind turbines are expected to reduce harmful emissions per kilowatt hour (kWh) of electricity produced. Similarly, the Government expects that the wind turbines will effectively reduce overall electricity generation costs per kWh compared with the costs incurred at present by EGC. When they are fully operational, the wind turbines will generate 12,000 million kWh of electricity in total each year in addition to the 60,000 million kWh generated by EGC in 2007/8. The generation of 60,000 million kWh of electricity may be taken as the maximum generating capacity in 2007/8 as it was so close to the limit of what EGC is actually capable of generating. The Government has stated that to meet expected demand, the country will only require the generation of 64,500 million kWh of electricity by November 2012, a 7⋅5% increase over the 2007/8 level of electricity generated. The operation of the wind turbines will enable some of the most inefficient coal fired power stations to be scaled down so that they will only be used as a reserve power source. This will significantly reduce variable running costs at each scaled down power station. The erection of the wind turbines will be carried out by a specialist building contractor, which has already been appointed. The Government will provide funds for the initial capital cost of the wind turbines but has not yet decided who will operate and manage the programme. The Minister of Energy has stated that there will be only one organisation appointed to operate and manage the entire programme. He also said that he will need assurance that if the Northern Division of EGC is appointed to operate and manage the wind power generation programme, EGC as a whole must commit to achieving the following two targets: 1. Ensure the overall average cost of electricity generation is no more than $0⋅183 per kWh (at
2007/8 price levels) by November 2013. This target average cost applies across all forms of electricity generating methods including the use of coal or wind power. (The average operating cost per kWh in 2007/8 for EGC as a whole was $0⋅2151).
2. Produce a plan which enables the development of new technology which will provide for improved electricity generation with less waste, resulting in an overall reduction of harmful emissions by an average of 2% per year for 10 years commencing on 1 April 2009.
NDGM has made it clear to the Northern Division’s Management Board that when the Government implements the wind turbine programme there may be a risk of job cuts if the Northern Division is not appointed to operate and manage the programme. NDGM estimates that if the Northern Division were appointed to operate and manage the wind turbine power generation programme the total operating costs of the division, including apportioned headquarters overheads, at the 2007/8 price level, would be reduced. The forecast amount of this reduction in operating costs would be $570 million per year for each power station that is scaled down to become a reserve power source. This scaling down will not
P10 18 November 2008
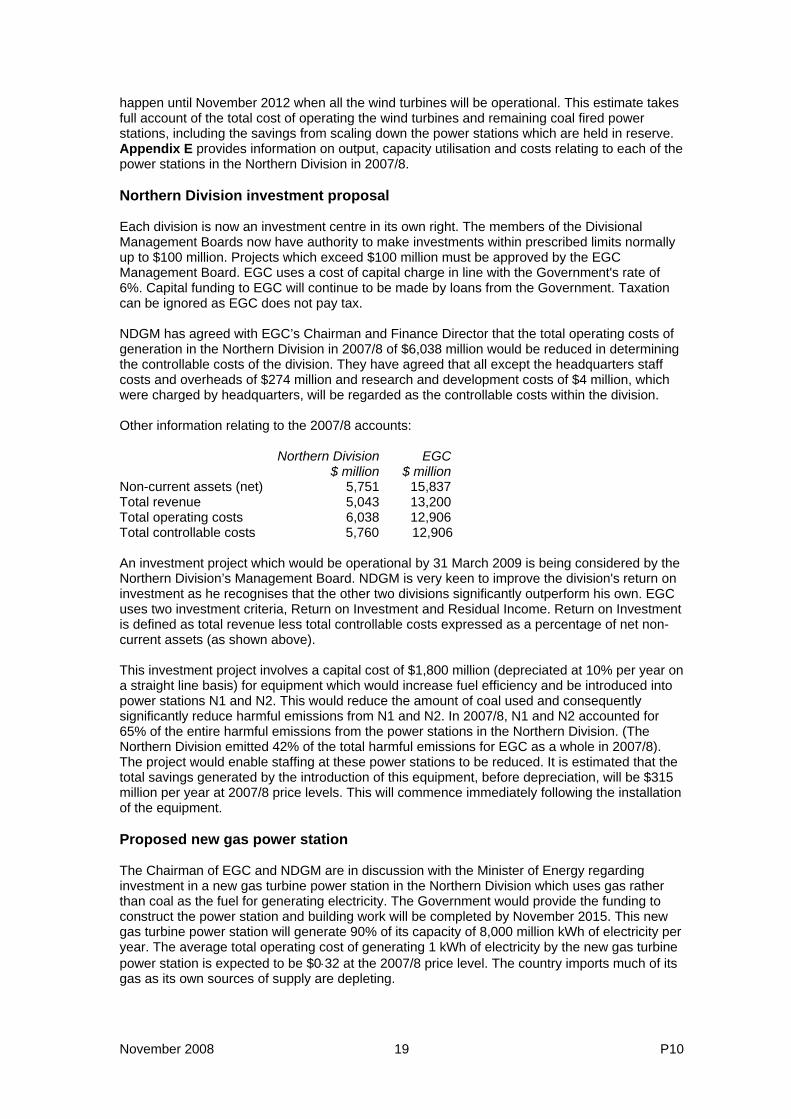
happen until November 2012 when all the wind turbines will be operational. This estimate takes full account of the total cost of operating the wind turbines and remaining coal fired power stations, including the savings from scaling down the power stations which are held in reserve. Appendix E provides information on output, capacity utilisation and costs relating to each of the power stations in the Northern Division in 2007/8. Northern Division investment proposal Each division is now an investment centre in its own right. The members of the Divisional Management Boards now have authority to make investments within prescribed limits normally up to $100 million. Projects which exceed $100 million must be approved by the EGC Management Board. EGC uses a cost of capital charge in line with the Government's rate of 6%. Capital funding to EGC will continue to be made by loans from the Government. Taxation can be ignored as EGC does not pay tax. NDGM has agreed with EGC’s Chairman and Finance Director that the total operating costs of generation in the Northern Division in 2007/8 of $6,038 million would be reduced in determining the controllable costs of the division. They have agreed that all except the headquarters staff costs and overheads of $274 million and research and development costs of $4 million, which were charged by headquarters, will be regarded as the controllable costs within the division. Other information relating to the 2007/8 accounts: Northern Division EGC $ million $ millionNon-current assets (net) 5,751 15,837Total revenue 5,043 13,200Total operating costs 6,038 12,906Total controllable costs 5,760 12,906 An investment project which would be operational by 31 March 2009 is being considered by the Northern Division’s Management Board. NDGM is very keen to improve the division's return on investment as he recognises that the other two divisions significantly outperform his own. EGC uses two investment criteria, Return on Investment and Residual Income. Return on Investment is defined as total revenue less total controllable costs expressed as a percentage of net non-current assets (as shown above). This investment project involves a capital cost of $1,800 million (depreciated at 10% per year on a straight line basis) for equipment which would increase fuel efficiency and be introduced into power stations N1 and N2. This would reduce the amount of coal used and consequently significantly reduce harmful emissions from N1 and N2. In 2007/8, N1 and N2 accounted for 65% of the entire harmful emissions from the power stations in the Northern Division. (The Northern Division emitted 42% of the total harmful emissions for EGC as a whole in 2007/8). The project would enable staffing at these power stations to be reduced. It is estimated that the total savings generated by the introduction of this equipment, before depreciation, will be $315 million per year at 2007/8 price levels. This will commence immediately following the installation of the equipment. Proposed new gas power station The Chairman of EGC and NDGM are in discussion with the Minister of Energy regarding investment in a new gas turbine power station in the Northern Division which uses gas rather than coal as the fuel for generating electricity. The Government would provide the funding to construct the power station and building work will be completed by November 2015. This new gas turbine power station will generate 90% of its capacity of 8,000 million kWh of electricity per year. The average total operating cost of generating 1 kWh of electricity by the new gas turbine power station is expected to be $0⋅32 at the 2007/8 price level. The country imports much of its gas as its own sources of supply are depleting.
November 2008 19 P10

Earth tremor damage to power station N4 A report by geological researchers at the country's leading university has stated that buildings in the Northern Division are becoming increasingly subject to the threat of earth tremors. The report was clear that the area was not subject to serious earthquakes but only to the far less damaging earth tremors. There has been an increase in earth tremors within the area of the Northern Division. These have caused damage to the infrastructure in the area, including to power station N4. The Government has now introduced strict construction regulations requiring all new buildings to be able to withstand earth tremors. Any new power stations across the country will be subject to these construction regulations. A structural report on the damage to power station N4 has concluded that it is safe and can continue to operate at the moment and should be able to do so for the next five years without any reduction of its generating capacity, even if earth tremor activity increases as expected. However, in order to guarantee continuity of its generating capacity after this period, repairs should be carried out within the five-year period. These will cost $1,500 million at the 2007/8 price level. As with other buildings whose capital cost was financed by the Government, power stations do not have any building repair or renewal insurance. The power station, which produced 8,513 million kWh in 2007/8 or about 37% of the total electricity generated in the Northern Division, would have to close down for a period of six months while the repairs are carried out. These repairs would enable the power station to meet the new Government construction regulations and allow it to maintain its long term electricity generating levels at about 83% of capacity. (See Appendix E) Appointment of a consultant NDGM has decided to appoint a consultant to provide him with immediate advice and recommendations on the issues which the Northern Divisional Management Board must address, including how cultural change may be brought about within the Northern Division.
P10 20 November 2008
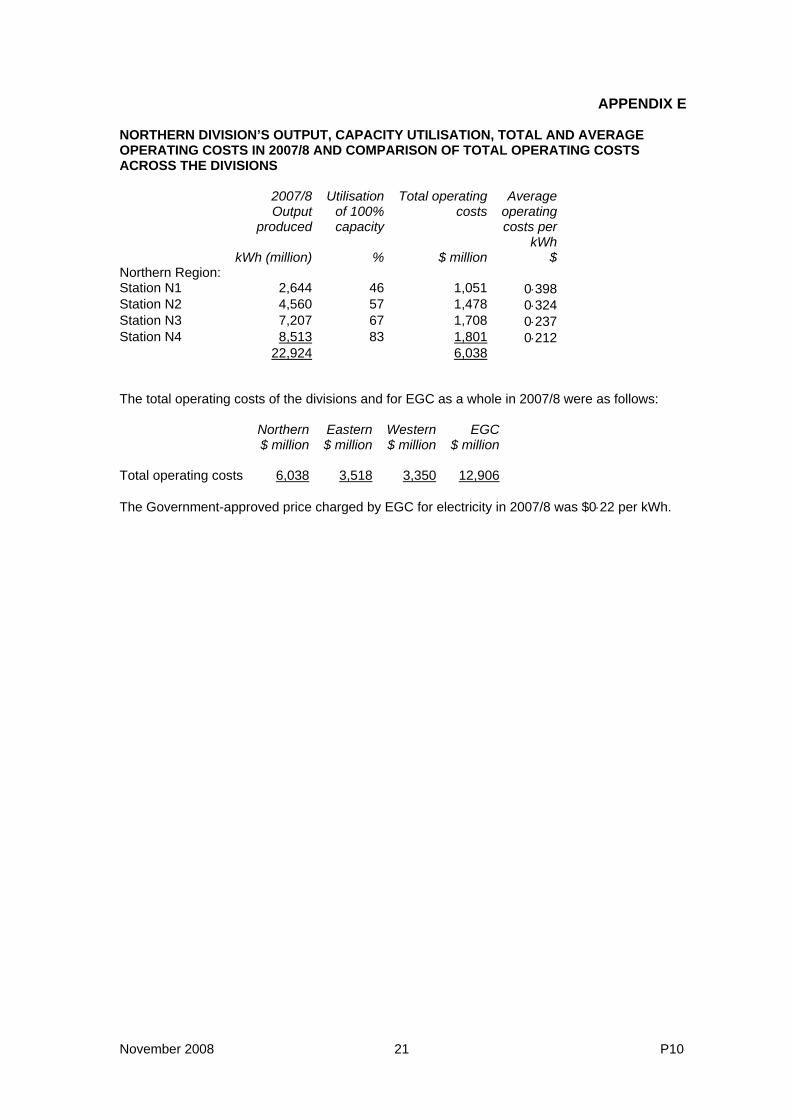
APPENDIX E NORTHERN DIVISION’S OUTPUT, CAPACITY UTILISATION, TOTAL AND AVERAGE OPERATING COSTS IN 2007/8 AND COMPARISON OF TOTAL OPERATING COSTS ACROSS THE DIVISIONS 2007/8 Utilisation Total operating Average Output of 100% costs operating produced capacity costs per kWh kWh (million) % $ million $Northern Region: Station N1 2,644 46 1,051 0⋅398Station N2 4,560 57 1,478 0⋅324Station N3 7,207 67 1,708 0⋅237Station N4 8,513 83 1,801 0⋅212 22,924 6,038 The total operating costs of the divisions and for EGC as a whole in 2007/8 were as follows: Northern Eastern Western EGC $ million $ million $ million $ million Total operating costs 6,038 3,518 3,350 12,906 The Government-approved price charged by EGC for electricity in 2007/8 was $0⋅22 per kWh.
November 2008 21 P10

This page is blank
P10 22 November 2008
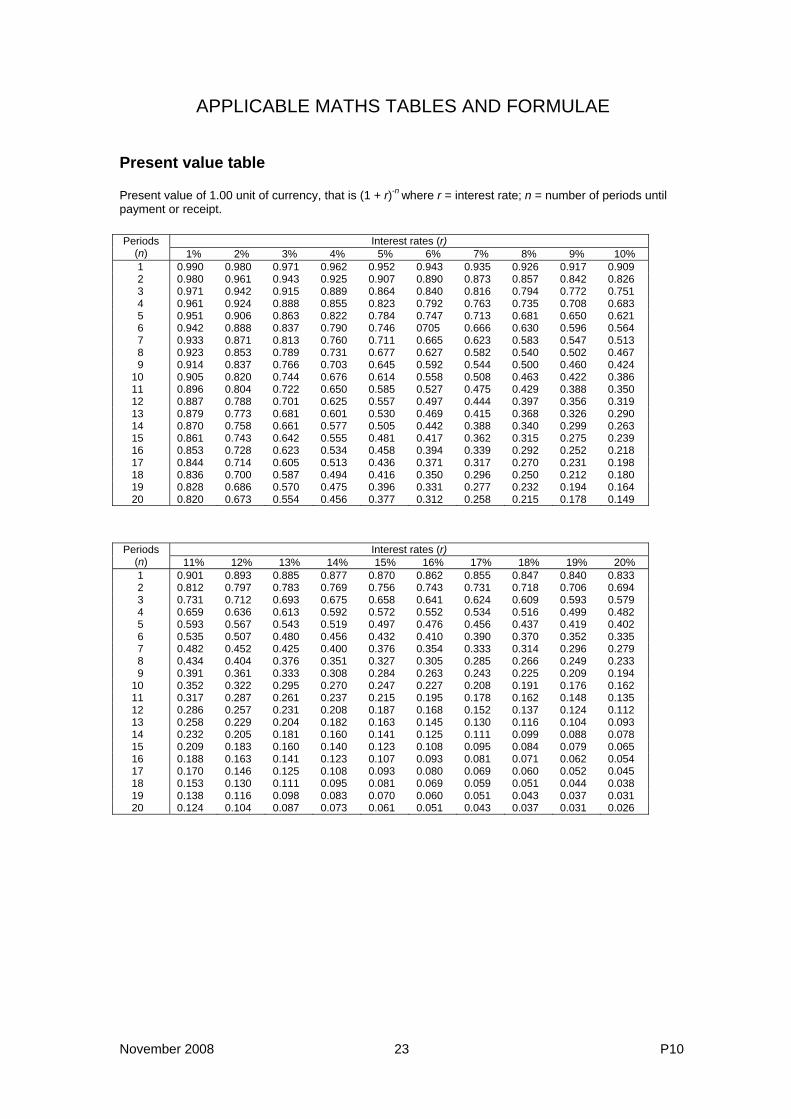
APPLICABLE MATHS TABLES AND FORMULAE Present value table Present value of 1.00 unit of currency, that is (1 + r)-n where r = interest rate; n = number of periods until payment or receipt.
Interest rates (r) Periods (n) 1% 2% 3% 4% 5% 6% 7% 8% 9% 10% 1 0.990 0.980 0.971 0.962 0.952 0.943 0.935 0.926 0.917 0.909 2 0.980 0.961 0.943 0.925 0.907 0.890 0.873 0.857 0.842 0.826 3 0.971 0.942 0.915 0.889 0.864 0.840 0.816 0.794 0.772 0.751 4 0.961 0.924 0.888 0.855 0.823 0.792 0.763 0.735 0.708 0.683 5 0.951 0.906 0.863 0.822 0.784 0.747 0.713 0.681 0.650 0.621 6 0.942 0.888 0.837 0.790 0.746 0705 0.666 0.630 0.596 0.564 7 0.933 0.871 0.813 0.760 0.711 0.665 0.623 0.583 0.547 0.513 8 0.923 0.853 0.789 0.731 0.677 0.627 0.582 0.540 0.502 0.467 9 0.914 0.837 0.766 0.703 0.645 0.592 0.544 0.500 0.460 0.424 10 0.905 0.820 0.744 0.676 0.614 0.558 0.508 0.463 0.422 0.386 11 0.896 0.804 0.722 0.650 0.585 0.527 0.475 0.429 0.388 0.350 12 0.887 0.788 0.701 0.625 0.557 0.497 0.444 0.397 0.356 0.319 13 0.879 0.773 0.681 0.601 0.530 0.469 0.415 0.368 0.326 0.290 14 0.870 0.758 0.661 0.577 0.505 0.442 0.388 0.340 0.299 0.263 15 0.861 0.743 0.642 0.555 0.481 0.417 0.362 0.315 0.275 0.239 16 0.853 0.728 0.623 0.534 0.458 0.394 0.339 0.292 0.252 0.218 17 0.844 0.714 0.605 0.513 0.436 0.371 0.317 0.270 0.231 0.198 18 0.836 0.700 0.587 0.494 0.416 0.350 0.296 0.250 0.212 0.180 19 0.828 0.686 0.570 0.475 0.396 0.331 0.277 0.232 0.194 0.164 20 0.820 0.673 0.554 0.456 0.377 0.312 0.258 0.215 0.178 0.149
Interest rates (r) Periods (n) 11% 12% 13% 14% 15% 16% 17% 18% 19% 20% 1 0.901 0.893 0.885 0.877 0.870 0.862 0.855 0.847 0.840 0.833 2 0.812 0.797 0.783 0.769 0.756 0.743 0.731 0.718 0.706 0.694 3 0.731 0.712 0.693 0.675 0.658 0.641 0.624 0.609 0.593 0.579 4 0.659 0.636 0.613 0.592 0.572 0.552 0.534 0.516 0.499 0.482 5 0.593 0.567 0.543 0.519 0.497 0.476 0.456 0.437 0.419 0.402 6 0.535 0.507 0.480 0.456 0.432 0.410 0.390 0.370 0.352 0.335 7 0.482 0.452 0.425 0.400 0.376 0.354 0.333 0.314 0.296 0.279 8 0.434 0.404 0.376 0.351 0.327 0.305 0.285 0.266 0.249 0.233 9 0.391 0.361 0.333 0.308 0.284 0.263 0.243 0.225 0.209 0.194 10 0.352 0.322 0.295 0.270 0.247 0.227 0.208 0.191 0.176 0.162 11 0.317 0.287 0.261 0.237 0.215 0.195 0.178 0.162 0.148 0.135 12 0.286 0.257 0.231 0.208 0.187 0.168 0.152 0.137 0.124 0.112 13 0.258 0.229 0.204 0.182 0.163 0.145 0.130 0.116 0.104 0.093 14 0.232 0.205 0.181 0.160 0.141 0.125 0.111 0.099 0.088 0.078 15 0.209 0.183 0.160 0.140 0.123 0.108 0.095 0.084 0.079 0.065 16 0.188 0.163 0.141 0.123 0.107 0.093 0.081 0.071 0.062 0.054 17 0.170 0.146 0.125 0.108 0.093 0.080 0.069 0.060 0.052 0.045 18 0.153 0.130 0.111 0.095 0.081 0.069 0.059 0.051 0.044 0.038 19 0.138 0.116 0.098 0.083 0.070 0.060 0.051 0.043 0.037 0.031 20 0.124 0.104 0.087 0.073 0.061 0.051 0.043 0.037 0.031 0.026
November 2008 23 P10
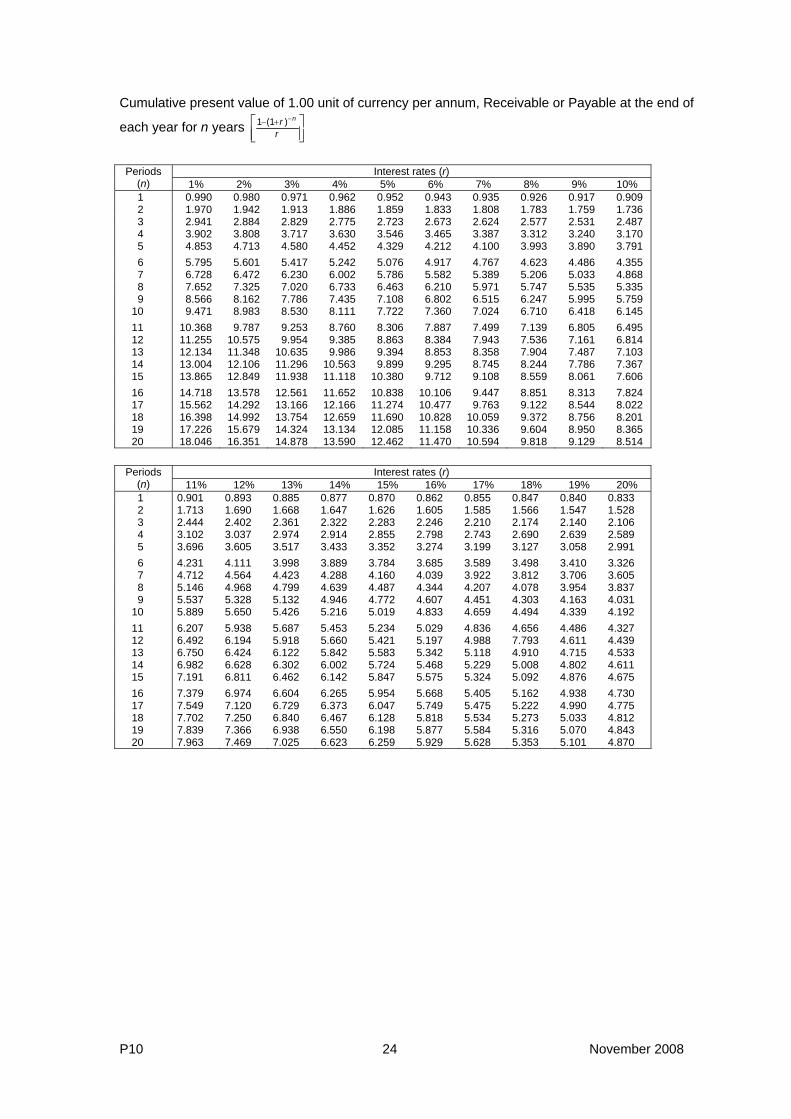
Cumulative present value of 1.00 unit of currency per annum, Receivable or Payable at the end of
each year for n years ⎥⎦⎤
⎢⎣⎡ −+−
rr n)(11
Interest rates (r) Periods
(n) 1% 2% 3% 4% 5% 6% 7% 8% 9% 10% 1 0.990 0.980 0.971 0.962 0.952 0.943 0.935 0.926 0.917 0.909 2 1.970 1.942 1.913 1.886 1.859 1.833 1.808 1.783 1.759 1.736 3 2.941 2.884 2.829 2.775 2.723 2.673 2.624 2.577 2.531 2.487 4 3.902 3.808 3.717 3.630 3.546 3.465 3.387 3.312 3.240 3.170 5 4.853 4.713 4.580 4.452 4.329 4.212 4.100 3.993 3.890 3.791 6 5.795 5.601 5.417 5.242 5.076 4.917 4.767 4.623 4.486 4.355 7 6.728 6.472 6.230 6.002 5.786 5.582 5.389 5.206 5.033 4.868 8 7.652 7.325 7.020 6.733 6.463 6.210 5.971 5.747 5.535 5.335 9 8.566 8.162 7.786 7.435 7.108 6.802 6.515 6.247 5.995 5.759 10 9.471 8.983 8.530 8.111 7.722 7.360 7.024 6.710 6.418 6.145 11 10.368 9.787 9.253 8.760 8.306 7.887 7.499 7.139 6.805 6.495 12 11.255 10.575 9.954 9.385 8.863 8.384 7.943 7.536 7.161 6.814 13 12.134 11.348 10.635 9.986 9.394 8.853 8.358 7.904 7.487 7.103 14 13.004 12.106 11.296 10.563 9.899 9.295 8.745 8.244 7.786 7.367 15 13.865 12.849 11.938 11.118 10.380 9.712 9.108 8.559 8.061 7.606 16 14.718 13.578 12.561 11.652 10.838 10.106 9.447 8.851 8.313 7.824 17 15.562 14.292 13.166 12.166 11.274 10.477 9.763 9.122 8.544 8.022 18 16.398 14.992 13.754 12.659 11.690 10.828 10.059 9.372 8.756 8.201 19 17.226 15.679 14.324 13.134 12.085 11.158 10.336 9.604 8.950 8.365 20 18.046 16.351 14.878 13.590 12.462 11.470 10.594 9.818 9.129 8.514
Interest rates (r) Periods
(n) 11% 12% 13% 14% 15% 16% 17% 18% 19% 20% 1 0.901 0.893 0.885 0.877 0.870 0.862 0.855 0.847 0.840 0.833 2 1.713 1.690 1.668 1.647 1.626 1.605 1.585 1.566 1.547 1.528 3 2.444 2.402 2.361 2.322 2.283 2.246 2.210 2.174 2.140 2.106 4 3.102 3.037 2.974 2.914 2.855 2.798 2.743 2.690 2.639 2.589 5 3.696 3.605 3.517 3.433 3.352 3.274 3.199 3.127 3.058 2.991 6 4.231 4.111 3.998 3.889 3.784 3.685 3.589 3.498 3.410 3.326 7 4.712 4.564 4.423 4.288 4.160 4.039 3.922 3.812 3.706 3.605 8 5.146 4.968 4.799 4.639 4.487 4.344 4.207 4.078 3.954 3.837 9 5.537 5.328 5.132 4.946 4.772 4.607 4.451 4.303 4.163 4.031 10 5.889 5.650 5.426 5.216 5.019 4.833 4.659 4.494 4.339 4.192 11 6.207 5.938 5.687 5.453 5.234 5.029 4.836 4.656 4.486 4.327 12 6.492 6.194 5.918 5.660 5.421 5.197 4.988 7.793 4.611 4.439 13 6.750 6.424 6.122 5.842 5.583 5.342 5.118 4.910 4.715 4.533 14 6.982 6.628 6.302 6.002 5.724 5.468 5.229 5.008 4.802 4.611 15 7.191 6.811 6.462 6.142 5.847 5.575 5.324 5.092 4.876 4.675 16 7.379 6.974 6.604 6.265 5.954 5.668 5.405 5.162 4.938 4.730 17 7.549 7.120 6.729 6.373 6.047 5.749 5.475 5.222 4.990 4.775 18 7.702 7.250 6.840 6.467 6.128 5.818 5.534 5.273 5.033 4.812 19 7.839 7.366 6.938 6.550 6.198 5.877 5.584 5.316 5.070 4.843 20 7.963 7.469 7.025 6.623 6.259 5.929 5.628 5.353 5.101 4.870
P10 24 November 2008

FORMULAE Valuation Models (i) Irredeemable preference share, paying a constant annual dividend, d, in perpetuity,
where P0 is the ex-div value:
P0 = prefk
d
(ii) Ordinary (Equity) share, paying a constant annual dividend, d, in perpetuity, where P0 is the ex-div value:
P0 = ek
d
(iii) Ordinary (Equity) share, paying an annual dividend, d, growing in perpetuity at a constant rate, g, where P0 is the ex-div value:
P0 = gk
d
-e
1 or P0 =
gk
g
−
+
e
0 ][1d
(iv) Irredeemable (Undated) debt, paying annual after tax interest, i (1-t), in perpetuity, where P0 is the ex-interest value:
P0 = net
][1
dk
ti −
or, without tax:
P0 = dk
i
(v) Future value of S, of a sum X, invested for n periods, compounded at r% interest:
S = X[1 + r]n
(vi) Present value of £1 payable or receivable in n years, discounted at r% per annum:
PV = n
r ][1
1
+
(vii) Present value of an annuity of £1 per annum, receivable or payable for n years, commencing in one year, discounted at r% per annum:
PV = ⎥⎦
⎤⎢⎣
⎡+
−n
rr ][1
11
1
(viii) Present value of £1 per annum, payable or receivable in perpetuity, commencing in one year, discounted at r% per annum:
PV = r
1
November 2008 25 P10
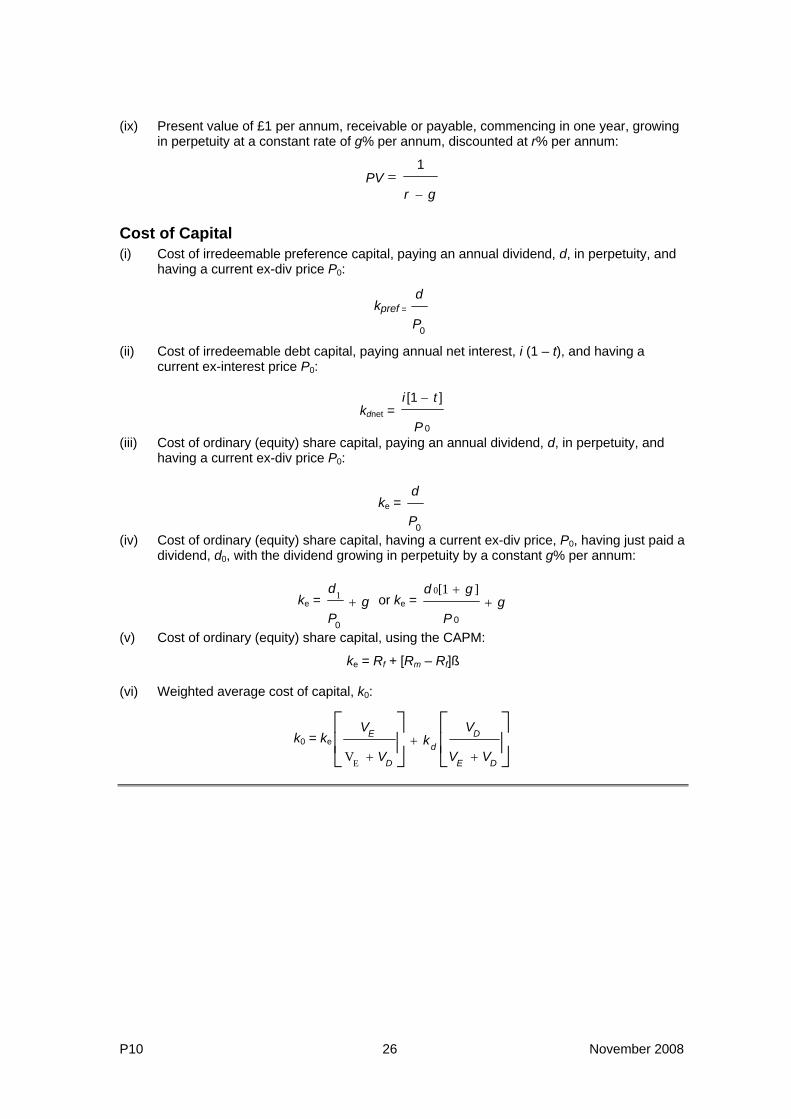
(ix) Present value of £1 per annum, receivable or payable, commencing in one year, growing in perpetuity at a constant rate of g% per annum, discounted at r% per annum:
PV = gr −
1
Cost of Capital (i) Cost of irredeemable preference capital, paying an annual dividend, d, in perpetuity, and
having a current ex-div price P0:
kpref =
0P
d
(ii) Cost of irredeemable debt capital, paying annual net interest, i (1 – t), and having a current ex-interest price P0:
kdnet = 0
][1
P
ti −
(iii) Cost of ordinary (equity) share capital, paying an annual dividend, d, in perpetuity, and having a current ex-div price P0:
ke =
0P
d
(iv) Cost of ordinary (equity) share capital, having a current ex-div price, P0, having just paid a dividend, d0, with the dividend growing in perpetuity by a constant g% per annum:
ke = gP
d+
0
1 or ke = g
P
gd+
+
0
]1[0
(v) Cost of ordinary (equity) share capital, using the CAPM:
ke = Rf + [Rm – Rf]ß
(vi) Weighted average cost of capital, k0:
k0 = ke ⎥⎦
⎤⎢⎣
⎡⎥⎦
⎤⎢⎣
⎡+
++ DE
Dd
D
E
VV
Vk
V
V
EV
P10 26 November 2008

This page is blank
November 2008 27 P10

P10 – Test of Professional Competence in Management
Accounting
November 2008
P10 28 November 2008