p r o t e o m ics& journal of ioi l o f nfo krappmann et
TRANSCRIPT
Research Article Open Access
Krappmann et al., J Proteomics Bioinform 2014, 7:9http://dx.doi.org/10.4172/jpb.1000328
Research Article Open Access
Volume 7(9) 264-271 (2014) - 264 J Proteomics BioinformISSN: 0974-276X JPB, an open access journal
Journal of Proteomics & BioinformaticsJo
urna
l of P
roteomics & Bioinformatics
ISSN: 0974-276X
*Corresponding author: Thomas Letzel, Chair of Urban Water Systems Engineering, TU München, Am Coulombwall, 85748 Garching, Germany, Tel: +49 (0)89 2891 3780; Fax: +49 (0)89-289-13718; E-mail: [email protected]
Received July 03, 2014; Accepted August 25, 2014; Published August 28, 2014
Citation: Krappmann M, Kaufmann CM, Scheerle RK, Grassmann J, Letzel T (2014) Achroma Software-High-Quality Policy in (a-)Typical Mass Spectrometric Data Handling and Applied Functional Proteomics. J Proteomics Bioinform 7: 264-271. doi:10.4172/jpb.1000328
Copyright: © 2014 Krappmann M, et al. This is an open-access article distributed under the terms of the Creative Commons Attribution License, which permits unrestricted use, distribution, and reproduction in any medium, provided the original author and source are credited
AbstractData evaluation of mass spectrometric raw data is an essential step to obtain high-quality results. In our days
an exorbitant amount of raw data are produced in analytical (bio)chemistry due to the utilization of sophisticated experimental setups. The recently published free software Achroma has been developed to overcome increasing data processing challenges by providing the possibility of a comprehensive data analysis (http://openmasp.hswt.de/pages/project/achroma.php). To illustrate (a-)typical data evaluation, an online coupled continuous flow system hyphenated with mass spectrometric detection was applied to investigate enzymatic activity changes in the presence of regulatory molecules and alternative substrates. The extended software strategy, the processing as well as evaluation of data is presented in detail based on enzymatic assays of intestinal alkaline phosphatase (iAP) and acetylcholine esterase (AChE). Different Achroma data evaluation modules enabled a high quality analysis. This included the elucidation of enzymatic substrate preferences by means of the calculation of negative and positive peak areas as well as the identification of an inhibitory molecule by comparing different mass spectra with regard to their overall composition. The possibility of an automatically performed validity control to monitor the systems robustness furthermore emphasized the usefulness of Achroma software regarding its applicability in the area of 'functional proteomics' data handling.
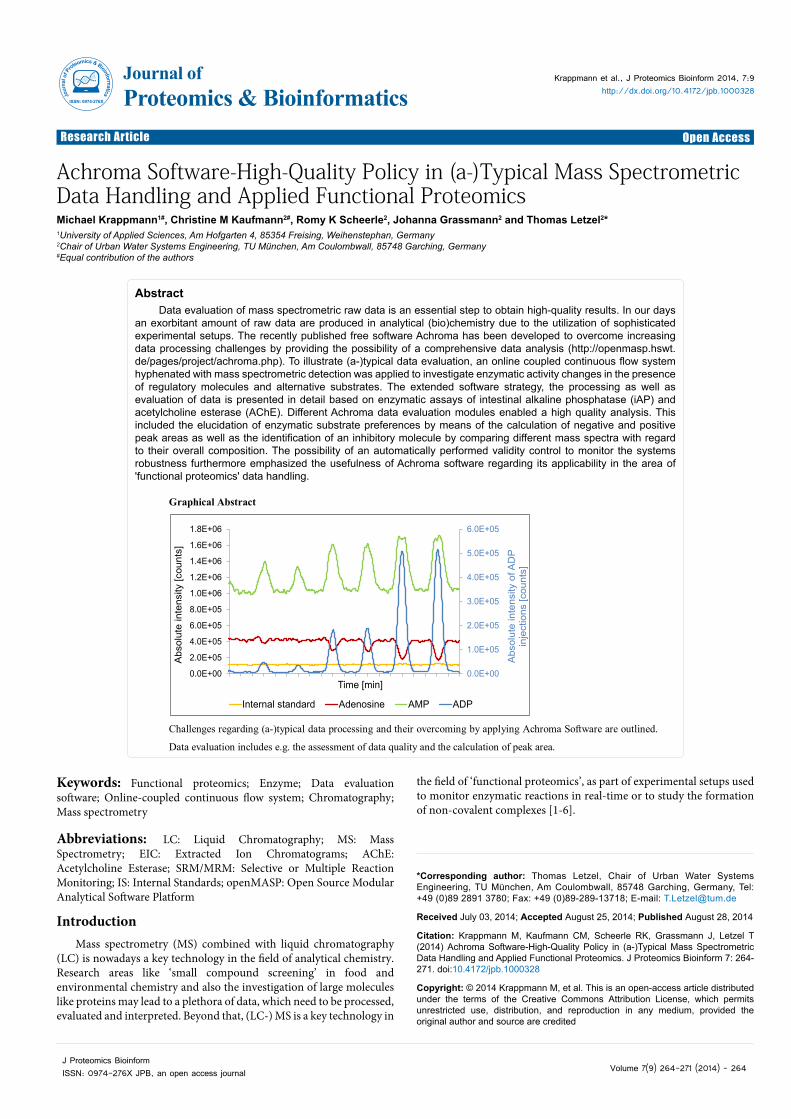
Graphical Abstract
Challenges regarding (a-)typical data processing and their overcoming by applying Achroma Software are outlined.
Data evaluation includes e.g. the assessment of data quality and the calculation of peak area.
0.0E+00
1.0E+05
2.0E+05
3.0E+05
4.0E+05
5.0E+05
6.0E+05
0.0E+00
2.0E+05
4.0E+05
6.0E+05
8.0E+05
1.0E+06
1.2E+06
1.4E+06
1.6E+06
1.8E+06
555657585960616263646566676869707172737475
Abs
olut
e in
tens
ity o
f AD
P
inje
ctio
ns [c
ount
s]
Abs
olut
e in
tens
ity [c
ount
s]
Time [min]
Internal standard Adenosine AMP ADP
Achroma Software-High-Quality Policy in (a-)Typical Mass Spectrometric Data Handling and Applied Functional ProteomicsMichael Krappmann1#, Christine M Kaufmann2#, Romy K Scheerle2, Johanna Grassmann2 and Thomas Letzel2* 1University of Applied Sciences, Am Hofgarten 4, 85354 Freising, Weihenstephan, Germany2Chair of Urban Water Systems Engineering, TU München, Am Coulombwall, 85748 Garching, Germany#Equal contribution of the authors
Keywords: Functional proteomics; Enzyme; Data evaluation software; Online-coupled continuous flow system; Chromatography; Mass spectrometry
Abbreviations: LC: Liquid Chromatography; MS: Mass Spectrometry; EIC: Extracted Ion Chromatograms; AChE: Acetylcholine Esterase; SRM/MRM: Selective or Multiple Reaction Monitoring; IS: Internal Standards; openMASP: Open Source Modular Analytical Software Platform
IntroductionMass spectrometry (MS) combined with liquid chromatography
(LC) is nowadays a key technology in the field of analytical chemistry. Research areas like ‘small compound screening’ in food and environmental chemistry and also the investigation of large molecules like proteins may lead to a plethora of data, which need to be processed, evaluated and interpreted. Beyond that, (LC-) MS is a key technology in
the field of ‘functional proteomics’, as part of experimental setups used to monitor enzymatic reactions in real-time or to study the formation of non-covalent complexes [1-6].

Citation: Krappmann M, Kaufmann CM, Scheerle RK, Grassmann J, Letzel T (2014) Achroma Software-High-Quality Policy in (a-)Typical Mass Spectrometric Data Handling and Applied Functional Proteomics. J Proteomics Bioinform 7: 264-271. doi:10.4172/jpb.1000328
Volume 7(9) 264-271 (2014) - 265 J Proteomics BioinformISSN: 0974-276X JPB, an open access journal
The rapid improvement of analytical instruments and thereby the emergence of new and complex experimental setups further contribute to an increasing amount of data and in this manner to data evaluation challenges. One single experiment may result in thousands of mass spectra and extracted ion chromatograms (EIC), depending on the complexness of the analyzed mixtures, the measurement time and the number of substrate and product traces, especially in multiplexing approaches.
In this regard, the application of an online coupled continuous flow system to detect changes in enzymatic activity in the presence of regulatory molecules may result in the emergence of complex data sets. This well-established technique has already been applied for the detection of interactions between proteins and compounds of interest [7], for the detailed investigation of enzyme inhibitors [8,9] or even on the screening of complex mixtures for unknown enzyme regulatory compounds [8-10]. The applicability of this systems has already been proven for the investigation of several enzymes, i.e. acetylcholine esterase (AChE) [9,8], phosphodiesterase [10], glutathione S-transferase [11] and cathepsin B [8]. In the presented work the setup was applied for the investigation of AChE and iAP enzymatic assays, either to find regulatory molecules from complex mixtures or to detect the enzymatic response to alternative substrates. Both applications were found to result in unusual data sets, which enclose the presence of positive and negative peaks within the assay EICs. The introduction of complex mixtures with unknown composition furthermore necessitated a fast and easy identification of potential enzyme regulatory compounds. Standard software provided by LC/MS hardware vendors is usually expensive and often does not comprise all functions required for entire data analysis. Researchers may have to conduct additional procedures like the export of data and further handling with common spread sheet software. This software type however in most cases lacks certain requirements for a detailed data evaluation. Thus, the development of new software allowing automated data handling and rapid as well as easy data interpretation and data evaluation is essential. Consequently, a special free software–Achroma–was developed and applied to clearly visualize, process and analyze a large amount of chromatographic and mass spectrometric data. So far, the Achroma software includes several independent data handling modules, like a) ‘chromatogram comparison’ for the calculation of a quotient of particular EICs to track signal inconstancies, b) ‘signal recognition’ of positive and negative peak signals (incl. signal area calculation) and c) ‘signal comparison’ tool. Latter enables the discovery of differences between two spectra at two different defined time points, e.g. comparing the EICs baseline range with a signal of enzymatic regulation. In contrast to common data evaluation software the possibility of a data quality examination was implemented into Achroma software to obtain helpful information about the robustness of the applied experimental setup. Automatically performed signal recognition and signal comparison furthermore provide a distinct reduction of elaborate manual data processing time.
In contrast to other available software tools for selective or multiple reaction monitoring (SRM/MRM) [12], e.g. like Skyline [13] or ATAQS [14], Achroma provides the calculation of negative peak areas, which may occur in continuous flow experiments of enzymatic activity determination in the presence of regulatory compounds. By adding the possibility of a difference spectrum calculation, Achroma software tool further stands out from classical SRM/MRM software regarding helpful features for functional proteomics data evaluation. Achroma software and its features were exemplarily employed on AChE and iAP enzymatic assays to evaluate data quality features and to illustrate application-oriented data evaluation. The enzymatic assay data were
processed with respect to a) performing data quality control and signal robustness assessment via EIC correlation of an internal standard (IS) and the EIC of an assay component, b) monitoring signal changes of iAP enzymatic assay induced by the injection of competitive substrates and c) screening of single compounds contained in complex mixtures on their regulatory effect on AChE, e.g. inhibitory effects.
Materials and MethodsReagents and chemicals
All compounds for the enzymatic assays were purchased from Sigma-Aldrich (Steinheim, Germany): AChE from Electrophorus electricus type VI-S (AChE, Enzyme Commission (EC) number 3.1.1.7, Mw ~280 kDa), acetylcholine chloride (AChCl, Mw 181.7 Da), galanthamine hydrobromide from Lycoris sp. (Mw 368.3 Da), iAP from bovine intestinal mucosa (EC 3.1.3.1., Mw ~160 kDa), Adenosine 5′-triphosphate (ATP, Mw 507.2 Da), Adenosine 5’-diphosphate (ADP, Mw 427.2 Da), Adenosine 5’-monophosphate (AMP, Mw 347.2 Da), LC-MS grade reagent water, LC-MS grade methanol and ammonium acetate (Mw 77.1 Da, >98%). L-histidine (Mw 155.16 Da) served as internal standard and was obtained from Merck Chemicals (Darmstadt, Germany).
A house dust extract sample was used for screening experiments. The sample was taken from a household with visible mould infestation and was prepared as follows: 0.5 g house dust was sieved and the particle fraction ≤ 63 µm was extracted with 5 mL methanol/H20 (84:15). 1 mL was evaporated to dryness, resolved in methanol/H20 (20:80), filtered with a 45 µm RC-filter and used for application in enzymatic assays.
Instrumentation
Online coupled continuous flow system: The experiments were performed using an online coupled continuous flow system with sample introduction part (Injector, Rheodyne, California, sample loop volume: 2 µL) as presented in Figure 1.
In setup 1 (Figure 1, middle trace: light grey dashed line), the enzymatic activity of iAP was measured towards its nucleotide substrate AMP. Activity changes in AMP substrate degradation along with adenosine (Ado) product generation, caused by the introduction of additional AMP substrate as well as increasing concentrations of the competitive nucleotide substrates ADP and ATP [15], were investigated. Concentration of the enzyme and the AMP substrate introduced to the system were 2.4 U/mL and 80 µM, respectively. Both were solved in 10 mM ammonium acetate pH 7.4.
Setup 2 (Figure 1, middle trace: black solid line) was used for the determination of the AChE activity with regard to an enzymatic regulation potentially caused by a chromatographically separated house dust mixture of unknown molecules. Initial concentrations were set to 0.05 nM of AChE and 10 µM of acetylcholine, either solved in
enzyme
substrate
ESI-MS
Isocratic pump
Syringe pump
Quaternary pump
Sample
HT-HPLC
2nd reaction coil
Setup 1
Setup 2
orinjector
sample
Figure 1: Schematic setup of the online coupled continuous flow system.

Citation: Krappmann M, Kaufmann CM, Scheerle RK, Grassmann J, Letzel T (2014) Achroma Software-High-Quality Policy in (a-)Typical Mass Spectrometric Data Handling and Applied Functional Proteomics. J Proteomics Bioinform 7: 264-271. doi:10.4172/jpb.1000328
Volume 7(9) 264-271 (2014) - 266 J Proteomics BioinformISSN: 0974-276X JPB, an open access journal
10 mM ammonium acetate pH 7.4. Internal standard L-histidine was introduced to the systems along with the enzyme solutions and was set to an initial concentration of 80 µM. In both setups the enzyme was provided in a syringe (2.5 mL, Hamilton-Bonaduz, Switzerland) located in a syringe pump with a flow rate set to 25 µL/min (Figure 1, upper trace) (Model 11 Plus, Harvard Apparatus, Hugo Sachs Elektronik, Hugstetten, Germany). Substrate solution was filled in a superloop (volume 10 mL, Amersham Biosciences, Uppsala, Sweden) and introduced to the system with a flow rate of 50 µL/min (Figure 1, bottom trace). Samples were injected into the continuous flow delivered by the quaternary pump via an injector (Rheodyne, California, sample loop volume: 2 µL). The quaternary pump flow rate (1100 series, Agilent Technologies, Waldbronn, Germany) was set to 25 µL/min, taking the sample either directly to the first reaction coil (setup 1) or along to the chromatographic column (setup 2). The isocratic pump (1260 series, Agilent Technologies, Waldbronn, Germany) was connected to the superloop for pumping the substrate solution to the system (Figure 1, bottom trace). Pumps were controlled by ChemStation software (version B.04.03, Agilent Technologies, Waldbronn, Germany). Reaction coils 1 and 2 (Teflon, 0.25 mm ID) were knitted as described in literature [16] to provide a sufficient mixing of enzyme and injected sample (reaction coil 1, flow-through time of ~1.3 min) and of the enzyme-sample mixture with the substrate (reaction coil 2, flow-through time of ~2.9 min), respectively. Apart from reaction coil 1 and 2 all further modules in both setups were connected with PEEK tubing. In setup 1, 10 mM ammonium acetate pH 7.4 was delivered continuously by the quaternary pump (Figure 1, middle trace). In setup 2 an isocratic eluent flow with 90% 10 mM ammonium acetate pH 7.4 with 10% methanol was used to separate the sample on a high temperature-compatible Zirchrom PBD column (100x1 mm, 3 µm) (ZirChrom Separations, Inc., Anoka, MN, USA), which was integrated into a column oven (HT HPLC 2000, Scientific Instruments Manufacturer GmbH, Oberhausen, Germany) (Figure 1, middle trace). The organic solvent concentration tolerable for AChE was preliminarily tested [17], whereupon 10% methanol was found to be suitable to maintain sufficient enzymatic activity. A temperature gradient was applied to improve the chromatographic separation. Initial temperature was set 30°C, followed by a linear temperature increase up to 120°C within a time range of 20 min, whereupon 120°C was held for 10 min. After completion of the gradient, the column was automatically reconditioned to the starting temperature of 30°C.
Mass spectrometric assay detection: Samples were analyzed using a single quadrupole mass spectrometer (MSQ Plus, Wissenschaftliche Gerätebau Dr. Ing. Herbert Knauer GmbH, Berlin, Germany) equipped with an electrospray ionization source in positive ionization mode. Mass spectrometric parameters were as follows: 300°C probe temperature, 3.5 kV needle voltage and 75 V cone voltage. In setup 1, the mass range for the iAP assay component detection was 100-1000 m/z, whereas in setup 2, the mass range for experiments performed with AChE was 100-800 m/z.
The following signals were analyzed in the AChE assay with the substrate acetylcholine: substrate signal m/z 146 (M)+ and product signal m/z 104 (M–CH3COOH)+.
For data evaluation of iAP assays, related m/z signals were summarized, using m/z 268.1 and 290.1, i.e. (Ado+H)+and (Ado+Na)+; m/z 348.1, 370.1, 386.0, 392.0 and 408.0, i.e. (AMP+H)+, (AMP+Na)+, (AMP+K)+, (AMP-H+2Na)+ and (AMP-H+Na+K)+ and m/z 428.0, 450.0, 466.0, 472.0 and 488.0, i.e. (ADP+H)+, (ADP+Na)+, (ADP+K)+, (ADP-H+2Na)+ and (ADP-H+Na+K)+.
Data evaluation
Mass spectrometric data was acquired using Xcalibur software 2.1.0.1139 (Thermo Fisher Scientific Inc., Waltham, MA, USA). For data evaluation with Achroma software either an entire Xcalibur data file was processed directly with an Xcalibur-implemented file converter tool, followed by a further conversion step with Achroma converter software or individual EICs of interest were transferred to Office Excel, whereupon further processing was again performed with Achroma converter (Figure 2).
The latter procedure leads to a minor amount of information, only containing data of particular EICs, which is sufficient in case of known m/z values of interest and advantageous regarding the reduction of the final data volume and file sizes. In contrast by converting the entire Xcalibur data file the mass spectrometric information recorded is entirely preserved. A more detailed explanation regarding the conversion of raw data is provided on the Achroma web page [18].
Data interpretation of enzymatic assays was accomplished by applying several Achroma modules after smoothing the data: ‘Chromatogram comparison’ tool allows the calculation of a quotient of two independent EICs, e.g. the traces of an internal standard and an assay component. Hence, the ratio obtained enables the correction of experimental data for intensity irregularities.
Moreover, enzymatic regulation manifested as negative or positive peaks present in the EIC traces was detected with ‘signal recognition’ module to assess peak areas, thereby obtaining numerical values that correspond to an alteration of enzymatic activity, whether it is inhibitory or activating. Further evaluation of data was carried out using ‘spectra comparison’. By means of this module, regulatory molecules affecting enzymatic activity can be easily identified by comparing the mass spectrum of a time point of altered enzymatic activity with the mass spectrum of a non-regulated time range. In doing so, differences
Data acquisition
Data processing with software of hardware vendor (here Xcalibur)
Whole data set (Xcalibur .txt file)
Single EICs of interest (.txt or .csv)
Xcalibur converter
Data export to spreadsheet software
Achroma converterWhole data set
(Achroma .txt file)Single EICs of interest
(Achroma .txt file)
Peak detection and area
calculation
Evaluation of data robustness
Data
eval
uatio
nw
ithAc
hrom
a
chromatogram comparison
signal recognition
spectra comparisonIdentification of
regulatory compounds
Data robustness assessment passed
Positive/negative peak(s) indicating enzymatic regulation
Figure 2: Data evaluation steps from data acquisition to data processing with Achroma software.

Citation: Krappmann M, Kaufmann CM, Scheerle RK, Grassmann J, Letzel T (2014) Achroma Software-High-Quality Policy in (a-)Typical Mass Spectrometric Data Handling and Applied Functional Proteomics. J Proteomics Bioinform 7: 264-271. doi:10.4172/jpb.1000328
Volume 7(9) 264-271 (2014) - 267 J Proteomics BioinformISSN: 0974-276X JPB, an open access journal
regarding the total composition of both spectra or merely the alteration of single m/z signal intensities respectively can be revealed. Temporarily emerging m/z values or m/z values with a distinct increase of intensity are presented as negative signals and vice versa.
Results and DiscussionA continuous flow system coupled with MS detection (Figure 1)
was applied to study enzymatic activity of iAP and AChE, respectively. Temporary increases or decreases of mass spectrometric substrate or product traces in the presence of inhibiting or activating molecules can be used to identify regulatory molecules from complex mixtures. In the absence of regulatory molecules, a constant trace of substrate and product is continuously detected, which reflects an unchanged enzymatic activity.
The presence of e.g. an inhibiting molecule is reflected by a temporary increase of substrate intensity (positive peak) and a simultaneously occurring decrease of product intensity (negative peak). In this regard, the evaluation of positive as wells as negative peak signals to assess enzymatic activity changes is inevitable. To address this need a former Achroma software version was developed and recently published [19]. Data quality and also the overall data evaluation procedure was considered applying three modules of Achroma software-‘signal recognition’, ‘spectra comparison’ and ‘chromatogram comparison’.
The handling and processing of raw data with a new Achroma version (incl. additional functionality like an extended file converter tool) is demonstrated by means of iAP enzymatic activity measured with the online coupled continuous flow system in section 3.1 (Figure 1 and Setup 1). A further verification of proper data analysis is shown by the evaluation of AChE enzymatic assay measured in the presence of a chromatographically separated complex real house dust extract, which was introduced to the system (Figure 1 and Setup 2).
Intestinal alkaline phosphatase assay data evaluation
iAP is able to dephosphorylate the nucleotide AMP, thereby generating the nucleoside product adenosine. iAP (Figure 1, upper trace) and AMP (Figure 1, bottom trace) were introduced to the online coupled continuous flow system, resulting in a constant AMP substrate trace and an enzymatically dephosphorylated Ado product trace. Enzyme and substrate concentrations were chosen to obtain an enzymatic substrate conversion rate that results in a sufficient mass spectrometric substrate as well as product trace intensity. The injection of different concentrations of substrate AMP or alternative substrates ADP or ATP led to the generation of intermediates and an altered Ado product generation, which is due to the enzyme´s ability to dephosphorylate its substrates in a stepwise manner [15].
As previously investigated, iAP activity measurements towards AMP compared to ADP and ATP revealed the enzyme´s preference to dephosphorylate the latter two with a rate about twice and thrice as high, respectively [15].
ADP and ATP injections (Figure 1, middle trace) consequently caused a reduced generation of the final product Ado, which is solely formed through AMP dephosphorylation. Additionally, injected ADP or ATP are largely degraded to AMP or AMP and ADP by the removal of one or two phosphate groups, respectively [20].
Assessment of signal stability and overall data quality: After successfully adapting iAP enzymatic assay to the online coupled continuous flow system, first experiments showed recurring drops within assay component traces. To investigate whether these
inconstancies are due to mass spectrometric detection or related to changes of enzymatic activity, data was assessed with Achroma software module ‘chromatogram comparison’. The extent of signal inconstancies within the course of internal standard and assay component traces (substrate, intermediates or product) can easily be displayed, compared and corrected (Figure 3). By doing so, actual enzymatic activity changes due to the presence of regulatory molecules and events of system-related intensity loss can be distinguished. This data correction step is therefore particularly important, since signal inconstancies might lead to a feigning of enzyme regulation. ‘Chromatogram comparison’ tool hence provides the possibility to monitor and correct assay EICs for signal detection irregularities and potentially assign them either to signal suppression effects due to injected molecules, pumping inconsistencies, system leakage or others.
Assay traces of the internal standard (IS) and the substrate AMP (Figure 3) are selected by entering the respective masses into the provided input field of Achroma software (Figure 3, solid black line, exemplary m/z range 155 to 156 and 347 to 348). By means of chromatogram comparison the data were edited by calculating the quotient of those molecule EICs, resulting in a constant and consistent ratio which is corrected for signal inconstancies (Figure 3C).
A tolerance interval can be additionally selected (Figure 3, dashed line box and Figure 3C) to control the resulting EIC after correction. The tolerance interval is shown as additional lines below and above the calculated quotient chromatogram (Figure 3C). The correction procedure applied to the data might therefore also reveal further inconstancies beyond the events of obvious signal losses, which would be clearly revealed as signals ranging out of the tolerance interval set. Those exceeding signals might therefore be accounted to enzymatic regulation events, which were previously concealed by the more dominant signal inconstancies. In case of the data set exemplarily used, no further irregularity is apparent, visible by the trace´s course lying within the tolerance limit of 10%.
relativ
e in
tens
ity
100
100
100
%
%
%
10
347 348155 156
11
AMPIS
AMP
IS
IS/AMP
A
B
C
Figure 3: First experiments with iAP and AMP as substrate revealed distinct signal inconstancies in all assay traces, which could be corrected with Achroma software tool ‘chromatogram comparison’. The respective software interface comprises of fields to enter m/z ranges of two molecules of interest (Box, black solid line), e.g. m/z range 347 to 348 of assay substrate AMP (A) and internal standard (IS) m/z range 155 to 156 (B). An intensity minimum of 1 was selected for both EICs. A tolerance level can be set to monitor the output of the calculated correction (Box, dashed line). The calculation of a quotient of AMP EIC (A) and IS EIC (B) resulted in a corrected and constant EIC (C). Tolerance value is set to ±10% and is displayed in C as solid line below and above the corrected EIC.

Citation: Krappmann M, Kaufmann CM, Scheerle RK, Grassmann J, Letzel T (2014) Achroma Software-High-Quality Policy in (a-)Typical Mass Spectrometric Data Handling and Applied Functional Proteomics. J Proteomics Bioinform 7: 264-271. doi:10.4172/jpb.1000328
Volume 7(9) 264-271 (2014) - 268 J Proteomics BioinformISSN: 0974-276X JPB, an open access journal
injections of ADP was calculated for Ado, AMP as well as ADP. The decrease of trace intensities is presented as negative bars, whereas the intensity increases are displayed as positive bars (Figure 4D).
Injection of 80 µM and 160 µM ADP solutions to the iAP assay with AMP substrate led to a preferred and complete degradation of ADP in reaction coil 1 (Figure 4C) and in this manner to an associated slight increase of AMP (Figure 4B) and of the final product Ado (Figure
After successfully examining the quality of the data set, evaluation regarding the effects of an alternative substrate introduced to iAP assay as well as the finding of regulatory molecules were accomplished by applying additional Achroma software modules.
Enzymatic regulation in the presence of alternative substrates: The activity of iAP towards its substrate AMP was investigated in the presence of different concentrations of injected AMP and alternative substrates ADP and ATP. Changes in Ado product and intermediate generation as well as enzymatic preferences regarding nucleotide substrates ought to be detected and analyzed. Data processing is exemplarily described by means of iAP enzymatic assay with AMP substrate and ADP injections to the online coupled continuous flow system (Figure 4). Evaluation was performed by entering the m/z of an assay component of interest into the respective input field (Figure 4, I) to display the corresponding EIC traces of the product (Ado), the substrate (AMP) and the competitive substrate (ADP) (Figure 4A-C). EIC smoothing was conducted with a moving average algorithm, similar to the Savitzky-Golay algorithm (Figure 4, III) [18].
Subsequently, peak recognition was automatically performed with Achroma software by selecting the provided option “negative signals” (Figure 4, II) in case of data showing mainly negative peaks (Figure 4A) and vice versa (Figure 4B and C). If necessary, the software provides the possibility to manually adjust the starting and end point of individual peaks (Figure 4, IV). Alterations of trace intensities of product Ado (Figure 4A), substrate AMP (Figure 4B) and competing substrate ADP (Figure 4C) were further evaluated using the peak areas obtained from Achroma Software (Figure 4D). A peak area average value of four
80µM160µM
320µM
1mM
2mM
-2.5E+05
-5.0E+04
1.5E+05
3.5E+05
5.5E+05
7.5E+05
Pea
k ar
ea
Ado AMP ADP
relativ
e in
tens
ity [%
]
100
0 10 20 30Time [min]
relativ
e in
tens
ity [%
]
100
0 10 20 30Time [min]
relativ
e in
tens
ity [%
]
100
0 10 20 30Time [min]
80µM 160µM 320µM 1mM 2mM ADP
80µM 160µM 320µM 1mM 2mM ADP 80µM 160µM 320µM 1mM 2mM ADPsignal changes of Ado trace signal changes of AMP trace
signal changes of ADP trace
A B
C D
I
II III IV
Figure 4: Data evaluation of positive and negative peak signals with Achroma ‘signal recognition’ module is exemplarily demonstrated by iAP assay with AMP substrate and injections of different ADP concentrations. EICs of Ado (A), AMP (B) and ADP (C) are presented. Each ADP concentration was injected twice, resulting in trace responses of all assay components (framed areas). Positive peak areas (AMP, ADP) and negative peak areas (Ado) are furthermore displayed as positive and negative bars with their respective standard deviations out of n=4 (D). The data evaluation interface is divided into functional subdivisions: selection of m/z range of interest with specified intensity minimum (I), automatic detection of positive or negative peak signals respectively (II), further options to edit data like smoothing of EICs, signal calculation with smoothed graph and displaying of automatically calculated peak areas (III), manual adjustment of peak starting and end points and possibility to include or exclude non-detected or false detected peaks respectively (IV).
A
-4.00E+05-3.00E+05-2.00E+05-1.00E+050.00E+001.00E+052.00E+053.00E+054.00E+055.00E+056.00E+05
0 1000 2000
Pea
k ar
ea
ATP injections [µM]
Ado AMP ADP ATP IS
C
-2.00E+05
0.00E+00
2.00E+05
4.00E+05
6.00E+05
8.00E+05
1.00E+06
1.20E+06
0 1000 2000
Pea
k ar
ea
AMP injections [µM]
-2.00E+05
-1.00E+05
0.00E+00
1.00E+05
2.00E+05
3.00E+05
4.00E+05
5.00E+05
6.00E+05
7.00E+05
8.00E+05
0 1000 2000
Pea
k ar
ea
ADP injections [µM]
B
Figure 5: Dependency between calculated peak areas of Ado (■), AMP (), ADP (♦) and ATP () and the injection of AMP, ADP or ATP in different concentrations (80 µM, 160 µM, 320 µm, 1 mM and 2 mM); internal standard (IS) peak areas are presented as well (O). Standard deviations shown are calculated out of n=4.

Citation: Krappmann M, Kaufmann CM, Scheerle RK, Grassmann J, Letzel T (2014) Achroma Software-High-Quality Policy in (a-)Typical Mass Spectrometric Data Handling and Applied Functional Proteomics. J Proteomics Bioinform 7: 264-271. doi:10.4172/jpb.1000328
Volume 7(9) 264-271 (2014) - 269 J Proteomics BioinformISSN: 0974-276X JPB, an open access journal
4A). ADP concentration above 160 µM caused a more pronounced and gradual increase of AMP intensities and a progressive decrease of the Ado level, which can be explained by the availability of non-degraded, enzymatically favored substrate ADP. High levels of competing ADP therefore resulted in the generation of mainly AMP and a further reduced Ado generation. Detailed data evaluation with AMP, ADP and ATP injections was performed in the same manner as described and is comparatively displayed in Figure 5.
The injection of additional AMP to the system led to a distinct increase of AMP peak areas, which is likely due to the inability of iAP to degrade the majority of AMP injected to the system. The rise of Ado product level was consequently found to be minor and only slightly increased for all AMP concentrations (Figure 5A).
In contrast, data examination with ADP injections revealed a more pronounced increase of AMP intermediate product peak areas (Figure 5B), which reflects the enzymatic substrate preference towards ADP compared to AMP. The simultaneous decrease of Ado furthermore indicates the preferred degradation of ADP to AMP rather than AMP to Ado (Figure 5B). The non-linearity of AMP peak areas with increasing ADP concentrations injected might be accounted to a substrate saturation occurring above a certain level of injected ADP (Figure 5B). This results in an increasing amount of non-degraded ADP and concurrently less generated AMP, due to the systems limited reaction time span (Figure 1, 2nd reaction coil). To verify the thesis of actual substrate saturation and to exclude the possibility of mass spectrometric signal suppression effects, controls containing no enzyme were measured in the online coupled continuous flow system. 80, 160, 320, 1000 and 2000 µM AMP was injected respectively, investigating the peak area progression with increasing concentrations. Data evaluation of AMP peak areas with Achroma showed a linear increase up to 2 mM of injected AMP (data not shown), which in turn supports the assumption of the non-linear AMP increase visible in Figure 5B to be due to substrate saturation.
The injection of ATP to the system furthermore reduces the generation of Ado, which is again due to the enzymes substrate preference towards ATP and ADP. Minor concentrations of injected ATP resulted in a distinct increase of AMP and only a slight rise of ADP levels, which is accounted to the enzyme´s ability to rapidly degrade ATP as well as a major proportion of the thereby generated ADP to AMP within the reaction time span provided (Figure 1, 2nd reaction coil) (Figure 5C). ATP injections of 1mM and beyond led to a flattening of AMP, ADP and Ado peak area progression, which is again attributed to substrate saturation.
Within the time ranges of assay component peak calculations, also the peak areas of the internal standard were assessed (Figure 5A-C). The absence of distinct intensity changes in the course of the internal standard EIC furthermore confirms the finding of negative peaks within the EIC of Ado to be an actual alteration in enzyme activity rather than mere signal suppression.
In this manner the signal recognition tool of Achroma software supports a more detailed data interpretation by providing the possibility to calculate positive and negative peak areas as well as regulation effects.
Identification of regulatory molecules and differences in spectra composition and intensities: Injection of alternative substrates to iAP enzymatic assay resulted in the emergence of negative and positive peaks within the assay component EICs. To be able to investigate the spectra composition, which corresponds to the time point of altered substrate degradation, ’spectra comparison’ module was exemplarily
applied for the data evaluation of ADP injections (compare Figure 4 and 5B). The module is convenient in terms of investigating differences between two different spectra or even provides the possibility to identify signal intensity changes, e.g. caused by the injection of a competitive molecule like ADP. To illustrate the procedure of data evaluation with spectra comparison, two independent signals present in the AMP substrate trace were exemplarily selected (Figure 6A, dashed lines, corresponding to the injection of 80 µM ADP and 2 mM ADP). In both cases the time point of the respective assay baseline spectrum is marked as solid black line (manually set to 80 seconds prior to the respective peak maximum; see Figure 6, top right).
A spectra comparison was automatically performed by subtracting the spectrum corresponding to the selected peak maximum (Figure 6A, dashed lines) from the reference baseline spectrum corresponding to the selected minimum (Figure 6A, solid lines). Molecules possessing higher intensities within the selected peak spectrum compared to the reference peak spectrum are therefore displayed as negative signal and vice versa (Figure 6B and 6C) [19]. The injection of 80 µM ADP (Figure 6A, left dashed line) results in an increase of Ado and AMP signal and no detectable ADP signal (Figure 6B). As already discussed and displayed in Figure 4 at low ADP concentrations, the total amount of ADP can be enzymatically degraded to AMP and Ado, therefore causing negative signals for both molecules in the spectra comparison data evaluation.
Injection of 2 mM ADP (Figure 6A, right dashed line) however reveals a decrease of Ado and an increase of AMP as well as the emergence of ADP signals and co-occurring increases of ADP and AMP Na- and K adducts (Figure 6C).
With high ADP concentrations introduced to the system, ADP can be only partially degraded to AMP, resulting in a negative signal of remaining ADP and a distinctively higher negative signal for AMP. The positive Ado signal visible in the spectrum reflects the reduced amount of the final enzymatic product Ado, which is generated in lower quantity due to the presence of the favored ADP substrate.
Acetylcholine esterase assay data evaluation
The identification of regulatory substances from complex mixtures
rel.
inte
nsity
[%]
100
rel.
inte
nsity
[%]
100
0 10 20 30
rel.
inte
nsity
[%]
100A
B C
[AMP+H]+
[Ado+H]+[AMP+Na]+
[AMP+K]+
[AMP+H]+[AMP+Na]+
[AMP +K]+[ADP+H]+
[ADP+Na]+[ADP+K]+
[Ado+H]+
Time [min]
m/zm/z
Figure 6: ‘Spectra comparison’ interface of the Achroma software and data evaluation of signal peaks: Injection of 80 µM (A, left dashed line) and 2 mM ADP (A, right dashed line) with no injection baseline time points (A, dark solid lines); difference spectrum of 80 µM ADP injection (B); difference spectrum of 2 mM ADP injection (C). AMP and ADP appeared as positively charged ions, either with proton, sodium or potassium. Ado was solely detected as protonated ion.

Citation: Krappmann M, Kaufmann CM, Scheerle RK, Grassmann J, Letzel T (2014) Achroma Software-High-Quality Policy in (a-)Typical Mass Spectrometric Data Handling and Applied Functional Proteomics. J Proteomics Bioinform 7: 264-271. doi:10.4172/jpb.1000328
Volume 7(9) 264-271 (2014) - 270 J Proteomics BioinformISSN: 0974-276X JPB, an open access journal
is an emerging research area, which becomes more and more important within the scope of pharmaceutical, environmental or nutritional issues [1,8,21]. In a current project different house dust extracts were used for the screening of their regulatory influence on enzymatic systems. The investigation of the extract and especially their partially unknown molecular composition led to a large amount of data that had to be evaluated.
Enzymatic activity response and identification of regulatory molecules from complex mixtures: The identification of negative and/or positive EIC peak areas, indicating enzymatic regulation, and simultaneously the evaluation of the related mass spectra detected at time points of regulation, serve as a basis for the finding of enzyme regulatory compounds. In this regard, the effects of house dust extracts were investigated on their influence on AChE activity.
A positive control was included by spiking the house dust extract with the known AChE inhibitor galanthamine. The spiked extract sample was injected to the system and chromatographically separated by HT-HPLC (Figure 1, setup 2, middle trace) before it was introduced to the continuous flow containing AChE (Figure 1, upper trace). Data evaluation with the Achroma ‘signal recognition’ module revealed two negative peaks, which were automatically identified and tagged in the continuous trace of the assay product choline (Figure 7A, light and dark grey area). The negative peaks may therefore indicate the presence of an AChE regulatory compound contained in the house dust sample. The peak areas in the product trace can be easily calculated with Achroma and may also provide further information about the strength of an enzymatic regulation. After calculating and analyzing the recognized negative signal peaks, software module ‘spectra comparison’ was applied. By comparing the spectrum underlying a negative peak signal time range with a constant signal time range spectrum (baseline), information about differences between their compositions was obtained (Figure 7B and 7C). Subsequently regulatory extract compounds can be easily identified by means of their
m/z. The spectrum comparison of the negative signal 1 (Figure 7A, 7B and 7D, light grey area) with the constant non-regulated baseline spectrum (Figure 7A, dashed line) revealed no significant characteristic difference of m/z signals. In contrast, the comparison of the negative peak 2 spectrum (Figure 7A and 7C, dark grey area) with the baseline spectrum (Figure 7A, dashed line) showed a distinct difference, which is displayed as negative spectrum signal with a m/z of 288 (Figure 7C). The signal is only apparent in the spectrum of the negative peak 2 area and seems to affect the activity of AChE. To verify this finding, the EIC of m/z 288 was visualized (Figure 7E), hereby revealing a retention time, which is identical with the time point of the negative EIC peak signal within the (choline) product trace. Since the house dust extract was spiked with a known AChE inhibitor, m/z 288 could be assigned to galanthamine (M+H)+, therewith clearly showing the applicability of the experimental setup as well as the benefits of Achroma software for a comprehensive data analysis.
ConclusionAchroma software features were presented in detail, in this manner
demonstrating the software to be a powerful and beneficial tool. It supports a fast and wide-ranging interpretation of (a-)typical mass spectrometrically detected enzymatic assay data, e.g. data which are obtained with an online coupled continuous flow system. The three modules ‘signal recognition’, ‘signal comparison’ and ‘chromatogram comparison’ discussed in this work provide several possibilities regarding data evaluation. Negative and positive signal peak areas within the trace of a substrate, intermediate and/or product EIC could be assessed for iAP enzymatic assay with ‘signal recognition’ module. Detailed examination of the recorded mass spectrometric data thus revealed the enzyme´s substrate preference towards ADP and ATP in comparison to AMP. Besides the injection of alternative substrates, negative and positive peaks are often related to events of enzymatic regulation, e.g. caused by an inhibitor. In this context AChE activity was investigated in the presence of chromatographically separated house dust extracts, spiked with a known AChE inhibitor as positive control. An enzymatic assay response related to the inhibitor added could be detected and evaluated with Achroma modules ‘signal recognition’ and ‘spectra comparison’. The latter provided the comparative assessment of mass spectrometric spectra, detected at different time points to identify the compound responsible for AChE inhibition. Besides the finding of newly emerging molecule signals, e.g. like enzyme inhibiting or activating compounds from complex mixtures, also intensity changes could be easily identified.
The third module, ‘chromatogram comparison’, provides an easy means to control and correct mass spectrometric data for signal loss or signal inconstancies. It was therefore employed to assess signal inconstancies within iAP enzymatic assay traces in comparison to the course of an internal standard also taken along. The calculation of a quotient and in this manner the correction of assay EICs revealed the nature of signal loss events as related to mass spectrometric detection rather than enzymatic regulation.
Achroma software was shown to be efficient for the analysis of mass spectrometric data, whose evaluation has been too complex, time consuming or even impossible heretofore. However, further adaptions are necessary to fully exploit the improvement potential. For this purpose the functionality of Achroma software will be transferred into an open source modular analytical software platform (openMASP) to revise and expand the modules explained in this work. By switching to the open source platform the implemented code of Achroma will
baseline
negativepeak1 productsingnalcholine
negativepeak2
spectrum baseline
spectrum negative peak2
characteristic signal at m/z 288
product signal choline
EIC m/z 288
Time [min]
rela
tive
inte
nsity
[%]
E
rela
tive
inte
nsity
[%]
C
Time [min]
spectrum baseline
rela
tive
inte
nsity
[%]
B
D
A
rela
tive
inte
nsity
[%]
spectrum negative peak1
no singnificant andcharacteristic signals
0 5 10 15 20 25 30
100
Figure 7: Screening of a house dust extract on its regulatory influence on AChE activity. Detection of negative signals and calculation of signal areas present in the course of the product trace was performed with the ‘signal recognition’ software tool (A). Comparison of the product EIC baseline spectrum with the spectra corresponding to the negative peak areas was done with ‘spectra comparison’ tool (B,C). No significant difference of baseline spectrum to negative peak 1 spectrum was detected (B,D). A potentially enzyme regulatory substance was identified, reflected by a characteristic difference between baseline spectrum and negative area spectrum (m/z 288, C). EIC of regulatory substance revealed the concurrence of the compound´s retention time and the time point of regulation (D).

Citation: Krappmann M, Kaufmann CM, Scheerle RK, Grassmann J, Letzel T (2014) Achroma Software-High-Quality Policy in (a-)Typical Mass Spectrometric Data Handling and Applied Functional Proteomics. J Proteomics Bioinform 7: 264-271. doi:10.4172/jpb.1000328
Volume 7(9) 264-271 (2014) - 271 J Proteomics BioinformISSN: 0974-276X JPB, an open access journal
be free, open and downloadable for users, in this manner enabling the participation of external software developers/analysts in improving and adjusting the software functions or even adding new modules to the analytical software platform. Until then every potential user can download the Achroma software for free and may use it as helpful as it is. Further information regarding software and hardware requirements can be found in a previous publication [19] or on the Achroma web page [18].
Acknowledgment
The authors would like to thank for financial support the German Federal Ministry of Economics and technology within the agenda for the promotion of industrial cooperative research and development (IGF) on the basis of a decision by the German Bundestag. The access was opened by the member organization DECHEMA and organized by the AiF, Arbeitsgemeinschaft industrieller Forschungsvereinigungen, Cologne, Germany (IGF Project No. 450 ZN). We also thank Knauer Wissenschaftliche Gerätebau GmbH (Berlin, Germany) for the Quadrupole mass spectrometer as a loan and the Institut für Energie- und Umwelttechnik e.V., Duisburg (especially Dr. Thorsten Teutenberg) for the house dust samples.
References
1. Grassmann J, Scheerle RK, Letzel T (2012) Functional proteomics: application of mass spectrometry to the study of enzymology in complex mixtures. Anal Bioanal Chem 402: 625-645.
2. Greis KD (2007) Mass spectrometry for enzyme assays and inhibitor screening: an emerging application in pharmaceutical research. Mass Spectrom Rev 26: 324-339.
3. Letzel T (2008) Real-time mass spectrometry in enzymology. Anal Bioanal Chem 390: 257-261.
4. Ruotolo BT, Verbeck GF, Thomson LM, Gillig KJ, Russell DH (2002) Observation of conserved solution-phase secondary structure in gas-phase tryptic peptides. J Am Chem Soc 124: 4214-4215.
5. Dennhart N, Letzel T (2006) Mass spectrometric real-time monitoring of enzymatic glycosidic hydrolysis, enzymatic inhibition and enzyme complexes. Anal Bioanal Chem 386: 689-698.
6. Kaltashov IA, Fenselau C (1997) Stability of secondary structural elements in a solvent-free environment: the alpha helix. Proteins 27: 165-170.
7. Hogenboom AC, de Boer AR, Derks RJ, Irth H (2001) Continuous-flow, on-line monitoring of biospecific interactions using electrospray mass spectrometry. Anal Chem 73: 3816-3823.
8. Kool J, Giera M, Irth H, Niessen WM (2011) Advances in mass spectrometry-
based post-column bioaffinity profiling of mixtures. Anal Bioanal Chem 399: 2655-2668.
9. de Jong CF, Derks RJE, Bruyneel B, Niessen W, Irth H (2006) High-performance liquid chromatography-mass spectrometry-based acetylcholinesterase assay for the screening of inhibitors in natural extracts. J Chromatogr A 1112: 303-310.
10. Schenk T, Breel GJ, Koevoets P, van den Berg S, Hogenboom AC, et al. (2003) Screening of natural products extracts for the presence of phosphodiesterase inhibitors using liquid chromatography coupled online to parallel biochemical detection and chemical characterization. J Biomol Screen 8: 421-429.
11. Kool J, Eggink M, van Rossum H, van Liempd SM, van Elswijk DA, et al. (2007) Online biochemical detection of glutathione-S-transferase P1-specific inhibitors in complex mixtures. J Biomol Screen 12: 396-405.
12. Colangelo CM, Chung L, Bruce C, Cheung KH (2013) Review of software tools for design and analysis of large scale MRM proteomic datasets. Methods 61: 287-298.
13. MacLean B, Tomazela DM, Shulman N, Chambers M, Finney GL, et al. (2010) Skyline: an open source document editor for creating and analyzing targeted proteomics experiments. Bioinformatics 26: 966-968.
14. Brusniak MY, Kwok ST, Christiansen M, Campbell D, Reiter L, et al. (2011) ATAQS: A computational software tool for high throughput transition optimization and validation for selected reaction monitoring mass spectrometry. BMC bioinformatics 12: 78.
15. Kaufmann CM, Grassmann J, Treutter D, Letzel T (2014) Utilization of real-time electrospray ionization mass spectrometry to gain further insight into the course of nucleotide degradation by intestinal alkaline phosphatase. Rapid Commun Mass Spectrom 28: 869-878.
16. Schebb NH, Vielhaber T, Jousset A, Karst U (2009) Development of a liquid chromatography-based screening methodology for proteolytic enzyme activity. J Chromatogr A 1216: 4407-4415.
17. Scheerle RK, Grassmann J, Letzel T (2012) Real-time ESI-MS of enzymatic conversion: impact of organic solvents and multiplexing. Anal Sci 28: 607-612.
18. Krappmann (2012) open MASP.
19. Krappmann M, Letzel T (2012) Achroma: a software strategy for analysing (a-)typical mass-spectrometric data. Analytical Methods 4: 1060-1071.
20. Moss DW, Walli AK (1969) Intermediates in the hydrolysis of ATP by human alkaline phosphatase. Biochim Biophys Acta 191: 476-477.
21. Shi SY, Zhou HH, Zhang YP, Jiang XY, Chen XQ, et al. (2009) Coupling HPLC to on-line, post-column (bio)chemical assays for high-resolution screening of bioactive compounds from complex mixtures. TrAC-Trends Anal Chem 28: 865-877.
Citation: Krappmann M, Kaufmann CM, Scheerle RK, Grassmann J, Letzel T (2014) Achroma Software-High-Quality Policy in (a-)Typical Mass Spectrometric Data Handling and Applied Functional Proteomics. J Proteomics Bioinform 7: 264-271. doi:10.4172/jpb.1000328