p lamprey t s - united states fish and wildlife service · confederated tribes of the umatilla...
TRANSCRIPT

PACIFIC LAMPREY TOXICITY STUDY
PREPARED BY
STRATUS CONSULTING
AND
OREGON STATE UNIVERSITY USGS, OREGON COOPERATIVE FISH AND WILDLIFE RESEARCH UNIT
FOR THE
PORTLAND HARBOR NATURAL RESOURCE TRUSTEE COUNCIL
Revised July 15, 2013

Prepared for:
Portland Harbor Natural Resource Trustee Council
Confederated Tribes of the Warm Springs Reservation of Oregon Nez Perce Tribe
Confederated Tribes of Siletz Indians Confederated Tribes of the Umatilla Indian Reservation
Confederated Tribes of the Grand Ronde Community of Oregon National Oceanic and Atmospheric Administration
Oregon Department of Fish and Wildlife U.S. Department of the Interior
Prepared by:
Stratus Consulting Inc. PO Box 4059
Boulder, CO 80306-4059 303-381-8000
Contacts:
Jeffrey Morris Jennifer Peers Joshua Lipton
and
Oregon State University
USGS, Oregon Cooperative Fish and Wildlife Research Unit 104 Nash Hall
Corvallis, OR 97331-3803
Contacts: Julia Unrein
Rob Chitwood Carl Schreck
Revised July 15, 2013 SC12470
Pacific Lamprey Toxicity Study

SC12470
Contents List of Figures ............................................................................................................................... ix List of Tables ................................................................................................................................ xi List of Acronyms and Abbreviations ....................................................................................... xiii
Section 1 Introduction ........................................................................................................... 1
1.1 Problem Definition.................................................................................................. 1 1.2 Sediment and Lamprey Collection.......................................................................... 2
1.2.1 Fall 2009 collection of sediment and lamprey ............................................ 2 1.2.2 Summer 2010 collection of sediment and lamprey ..................................... 2 1.2.3 Analytical chemistry of sediment samples ................................................. 4 1.2.4 Ammocoete acclimation and holding ......................................................... 4
1.3 Statistical Analysis ................................................................................................ 20
Section 2 Task 2a: Depuration Trial ................................................................................. 20
2.1 Objective ............................................................................................................... 20 2.2 Methods ................................................................................................................ 20
2.2.1 First depuration trial .................................................................................. 20 2.2.2 Second depuration trial ............................................................................. 22
2.3 Results ................................................................................................................... 22 2.4 Discussion ............................................................................................................. 28
Section 3 Task 2b: Holding Container (Corral) Trial ..................................................... 28
3.1 Objective ............................................................................................................... 28 3.2 Methods ................................................................................................................ 29 3.3 Results ................................................................................................................... 30 3.4 Discussion ............................................................................................................. 32
Section 4 Task 2c: Feeding Trial ........................................................................................ 33
4.1 Objective ............................................................................................................... 33 4.2 Methods ................................................................................................................ 33 4.3 Results ................................................................................................................... 34 4.4 Discussion ............................................................................................................. 34

Stratus Consulting Contents (Revised 7/15/2013)
Page vi SC12470
Section 5 Task 3: Contaminated Sediment Exposure Pre-pilot Test and Task 4: Physiology Endpoints ............................................................................ 37
5.1 Objective ............................................................................................................... 37 5.2 Methods ................................................................................................................ 38
5.2.1 Sediments .................................................................................................. 38 5.2.2 Experimental design ................................................................................. 38 5.2.3 Ammocoete sampling and preservation .................................................... 38 5.2.4 Dry weight and lipid and ash content ....................................................... 39 5.2.5 Gill Na+/K+ ATPase activity ..................................................................... 39 5.2.6 Histology ................................................................................................... 39
5.3 Results ................................................................................................................... 40 5.3.1 Water quality ............................................................................................. 40 5.3.2 Survival and behavior ............................................................................... 40 5.3.3 Growth ...................................................................................................... 40 5.3.4 Lipid content ............................................................................................. 44 5.3.5 Histology ................................................................................................... 44 5.3.6 Gill Na+/K+ ATPase activity ..................................................................... 44
5.4 Discussion ............................................................................................................. 50
Section 6 Task 5: Behavioral Endpoints ........................................................................... 51
6.1 Objective ............................................................................................................... 51 6.2 Methods ................................................................................................................ 51
6.2.1 Multiple sediment trough exposures – preference and burrowing time tests ................................................................................................... 51
6.2.2 Single sediment exposures – burrowing time tests ................................... 51 6.3 Results ................................................................................................................... 54
6.3.1 Multiple sediment trough exposures – preference and burrowing time tests ................................................................................................... 54
6.3.2 Single sediment exposures – burrowing time tests ................................... 56 6.4 Discussion ............................................................................................................. 60
Section 7 Task 6: Induction of Metamorphosis ................................................................ 61
7.1 Objective ............................................................................................................... 61 7.2 Methods ................................................................................................................ 61 7.3 Results ................................................................................................................... 61 7.4 Discussion ............................................................................................................. 62

Stratus Consulting Contents (Revised 7/15/2013)
Page vii SC12470
Section 8 Task 7: Contaminated Sediment Exposure Pilot Test ..................................... 62
8.1 Objective ............................................................................................................... 62 8.2 Methods ................................................................................................................ 62
8.2.1 Sediments .................................................................................................. 62 8.2.2 Experimental design ................................................................................. 62 8.2.3 Experimental monitoring and sampling .................................................... 63
8.3 Results ................................................................................................................... 64 8.3.1 Water quality ............................................................................................. 64 8.3.2 Growth ...................................................................................................... 64 8.3.3 Lipid content ............................................................................................. 68 8.3.4 Histology ................................................................................................... 68 8.3.5 Gill Na+/K+ ATPase activity ..................................................................... 71
8.4 Discussion ............................................................................................................. 72
References .................................................................................................................................... 72

SC12470
Figures 1 Ammocoete holding tank .................................................................................................. 19 2 Ammocoete in beaker during depuration trial .................................................................. 21 3 Mean wet-weight measurements from first depuration trial (n = 10) ............................... 24 4 Mean ash content of non-depurated and depurated (72 hours) ammocoetes from
first depuration trial (n = 9) .............................................................................................. 24 5 Photographs of ash from depurated (left) and non-depurated (right) ammocoetes .......... 25 6 Mean change in wet weight for ammocoetes depurated for 24, 48, and 72 hours
from second depuration trial (n = 5) ................................................................................. 27 7 Mean ash content in ammocoetes depurated for 0, 24, 48, and 72 hours from
second depuration trial (n = 5) .......................................................................................... 27 8 Holding containers used in corral trials ............................................................................ 29 9 Mean change in wet weight in ammocoetes held in corrals of differing sizes
(n = 10 for all the “corral” treatments and n =1 for the “no corral” treatment) ................ 33 10 Mean (n = 3) change in wet weight among ammocoetes held in different sediment
types, with different water sources and different feeding regimes ................................... 37 11 Mean initial wet weight (a) and length (b) in all ammocoetes loaded into each
corral (n = 90) ................................................................................................................... 42 12 Mean change in depurated wet weight for individual ammocoetes exposed to each
sediment type for 30 days and 60 days (n = 15) ............................................................... 43 13 Mean change in length for individual ammocoetes exposed to each sediment
type after 30- and 60-day exposures (n = 15) ................................................................... 43 14 Mean lipid content (n = 3) in individual ammocoetes exposed to each sediment
type after 30- and 60-day exposures ................................................................................. 44 15 Encysted digenean trematode parasite (arrow) in the gill lamella of an ammocoete
exposed to GAS sediment for 60 days .............................................................................. 45 16 Encysted digenean trematode parasite (arrow) in the kidney of an ammocoete
exposed to GAS sediment for 60 days .............................................................................. 46 17 Granuloma (arrow; likely from a degraded encysted parasite) in the liver of an
ammocoete exposed to OSU sediment for 30 days .......................................................... 47 18 Encysted digenean trematode parasites (arrows) in the heart of an ammocoete
exposed to OSU sediment for 60 days .............................................................................. 48 19 Encysted digenean trematode parasites (arrows) in the oropharynx of an
ammocoete exposed to SRS sediment for 60 days ........................................................... 49 20 Gill Na+/K+ ATPase activity in individual ammocoetes exposed to each
sediment type after 30- and 60-day exposures (n = 3) ...................................................... 50 21 Sediment preference experiment using OSU, SRS, and GAS sediments ......................... 52

Stratus Consulting Figures (Revised 7/15/2013)
Page x SC12470
22 Sediment burrowing time experiment, with individual ammocoetes in each exposure container .................................................................................................... 53
23 Ammocoete sediment preference in paired sediment trials ............................................. 55 24 Time to initiate burrowing (a) and time to complete burrowing (b) in one
uncontaminated (RE2) and three contaminated (GA2, AR2, and SWI) sediments .......... 57 25 Ammocoete mean burrowing times in uncontaminated (RE2) and contaminated
(GA2, AR2, and SWI) sediments ..................................................................................... 58 26 Mean time to initiate burrowing and complete burrowing in RE2
(uncontaminated), GA2, AR2, and SWI (contaminated) sediments used in test series 1 and 2 (see Section 6.2.2) ............................................................................... 60
27 Individual lamprey corrals in larger circular exposure tanks ........................................... 63 28 Mean initial wet weight (a) and length (b) in all ammocoetes loaded into each corral
(n = 144) ............................................................................................................................ 66 29 Mean change in depurated wet weight for individual ammocoetes exposed to
each sediment type after a 45-day exposure (n = 12 in all treatments, except for sediments RE1 and SW1 where n = 11) ........................................................................... 67
30 Mean change in length for individual ammocoetes exposed to each sediment type after a 45-day exposure (n = 12 in all treatments, except RE1 and SW1 where n = 11) .................................................................................................................... 69
31 Mean lipid content (n = 6 in all treatments, except RE1, RE3, GAA, and SWI where n = 5) in individual ammocoetes exposed to each sediment type after a 45-day exposure ................................................................................................................ 69
32 Counts of encysted parasites and granulomas on histology slides prepared from individual ammocoetes exposed to each sediment type after a 45-day exposure (n = 3) ................................................................................................................ 70
33 Gill Na+/K+ ATPase activity in individual ammocoetes exposed to each sediment type after a 45-day exposure (n = 5 for sediments AR1, GAA, and SWI; n = 4 for sediments RE1, RE3, AR2, ARM, MAR, OST, and SC1; and n = 3 for sediments MSC and GA2) ........................................................................................... 71

SC12470
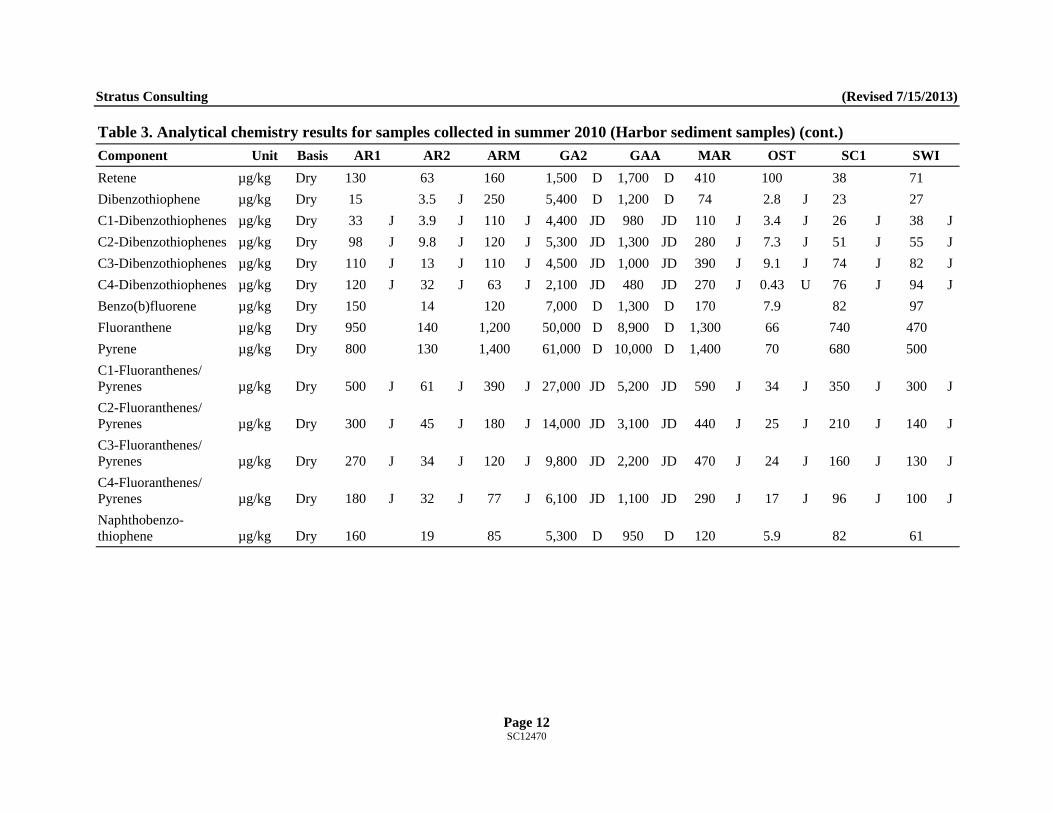
Tables 1 Sediment sampling locations on the Willamette River ....................................................... 3 2 Analytical chemistry results for samples collected in fall 2009 and for MSC ................... 5 3 Analytical chemistry results for samples collected in summer 2010
(Harbor sediment samples) ................................................................................................. 8 4 Analytical chemistry results for samples collected in summer 2010
(Willamette River reference samples) .............................................................................. 16 5 Water quality monitoring results from ammocoete holding tanks.................................... 19 6 Measurements of non-depurated ammocoetes from first depuration trial ........................ 22 7 Measurements of depurated ammocoetes from first depuration trial ............................... 23 8 Measurements of non-depurated ammocoetes from second depuration trial ................... 25 9 Measurements of depurated ammocoetes from second depuration trial ........................... 26 10 Water quality monitoring results from second depuration trial ........................................ 28 11 Summary of corral trial setup ........................................................................................... 29 12 Weights and lengths of ammocoetes in corral trials ......................................................... 30 13 Water quality monitoring results from corral trials .......................................................... 32 14 Summary of feeding trial setup ......................................................................................... 34 15 Weights and lengths of ammocoetes in feeding trial ........................................................ 35 16 Water quality monitoring results from feeding trial ......................................................... 36 17 Average water quality for each sediment type during the 30- and 60-day
exposures in Task 3 ........................................................................................................... 41 18 Study design and results of multiple sediment preference experiments ........................... 55 19 Mean time for ammocoetes to initiate and complete burrowing into different
sediments in burrowing test series 1 and 2 and corresponding ammocoete lengths ......... 59 20 Average water quality for each sediment type during the 45-day exposure ..................... 65 21 Initial and final wet weight and length measurements of ammocoetes
(n = 12 for each sediment type for all analyses, except final measurements for RE1 and SW1 where n = 11) ....................................................................................... 68

SC12470
Acronyms and Abbreviations ADP adenosine diphosphate AR1 Arkema 1 sediment sampling site AR2 Arkema 2 sediment sampling site ARM Arco/Mobil sediment sampling site ATP adenosine triphosphate ATPase class of enzymes that catalyze the decomposition of adenosine triphosphate CAS Columbia Analytical Services COC chain of custody DDD dichlorodiphenyldichloroethane DDE dichlorodiphenyldichloroethylene DDT dichlorodiphenyltrichloroethane DDx group of organochlorine pesticides and breakdown products, including
dichlorodiphenyltrichloroethane, dichlorodiphenyldichloroethylene, and dichlorodiphenyldichloroethane
DO dissolved oxygen DRO diesel range organics EC electrical conductivity EDTA ethylenediaminetetraacetic acid FPGL Fish Performance and Genetics Laboratory GA2 Gasco 2 sediment sampling site GAA Gasco 1 (alternate) sediment sampling site GAS Gasco sediment sampling site GC gas chromatography GRO gasoline range organics HPLC high-pressure liquid chromatography HSD honestly significant difference IACUC Institutional Animal Care and Use Committee KClO4 potassium perchlorate

Stratus Consulting Acronyms and Abbreviations (Revised 7/15/2013)
Page xiv SC12470
LOD level of detection LOQ level of quantitation MAR Marcom sediment sampling site MDL method detection limit MRL method reporting limit MSC masonry sand control OST Oregon Steel sediment sampling site OSU Oregon State University pond sediment sampling site PAH polycyclic aromatic hydrocarbon PCB polychlorinated biphenyl PLA Pacific lamprey ammocoete RE1 Reference sediment sampling site 1 RE2 Reference sediment sampling site 2 RE3 Reference sediment sampling site 3 RRO residual range organics SC1 Schnitzer 1 sediment sampling site SEI sucrose, EDTA, and imidazole SEID SEI + sodium deoxycholate acid SOP standard operating procedure SRS Siletz River sediment sampling site SWI Swan Island sediment sampling site TOC total organic carbon TPH total petroleum hydrocarbon USFWS U.S. Fish and Wildlife Service

SC12470
1. Introduction Contaminants such as chlorinated hydrocarbons, petroleum-related compounds, metals, and other hazardous substances have been released from various sources and have come to be located in Portland Harbor (hereafter, the Harbor) sediments. The concentrations of many of these compounds are elevated in the Harbor compared to upstream locations. Sediments from specific areas in the Harbor have demonstrated toxicity to benthic invertebrates, and sediment-associated biota and fish collected from the area have accumulated contaminants (e.g., Windward Environmental, 2008b; Windward Environmental and Integral Consulting, 2007, 2008). Habitat in the Harbor may be an important resting and foraging area for Pacific lamprey ammocoetes (PLAs; Lampetra tridentata) as they transition to the Lower Columbia River and prepare for their marine life stage. Ammocoetes collected from the Harbor have accumulated higher concentrations of some organochlorine compounds than ammocoetes collected upstream.
The Portland Harbor Trustee Council is evaluating potential natural resource injuries to ammocoetes. Insufficient information is available to determine if contaminant exposures to ammocoetes exceed concentrations that could cause injuries or prevent colonization of the Harbor by ammocoetes. In addition, restoration efforts for ammocoetes could be more successful if sediment toxicity to the species were better understood.
1.1 Problem Definition
Problem description: Lamprey ammocoetes are the only detritivorous fish present in the Lower Willamette River (Windward Environmental, 2008a). Their survival, growth, and behavior could be affected from exposure to contaminants in sediment in the Harbor.
Conceptual model of potential hazard: Industrial and municipal sources have released contaminants into the Harbor. Some of these contaminants have come to be located in bed sediments, some contaminants remain near their release points, and others have been transported away from their sources into downstream areas (Integral Consulting et al., 2009). Some of the contaminated sediments are within depositional or other areas where ammocoetes would settle as they move downriver. Ammocoetes readily burrow into sediment at settling areas and filter feed within the sediment or at the sediment surface (e.g., Claire, 2002). They are potentially exposed to contaminants in porewater, transition zone water, surface water, suspended sediment at the interface between surface water and sediment, and by consuming contaminated sediment and detritus. Ammocoetes could be exposed to hazardous substances through dermal, ingestion, and gill uptake pathways. Water toxicity tests conducted on ammocoetes suggest they are moderately sensitive to contaminants (Windward Environmental, 2008a), but their response to contaminants

Stratus Consulting (Revised 7/15/2013)
Page 2 SC12470
from exposure in sediments has not been evaluated. Responses in ammocoetes exposed to sample sediments obtained from the Harbor in sediment toxicity tests will be used to determine whether sediment toxicity tests provide a suitable tool to identify and quantify injury in ammocoetes.
Primary study question: Do contaminant concentrations in Harbor sediment cause identifiable and quantifiable injuries to ammocoetes? The specific objective of this study is to evaluate whether measurable adverse effects are observed in controlled laboratory exposures of ammocoetes to Harbor sediments.
1.2 Sediment and Lamprey Collection
1.2.1 Fall 2009 collection of sediment and lamprey
In November 2009, 30 gal of sediment were collected from the Gasco site (GAS) in the Harbor (Table 1; see location in Stratus Consulting, 2009) and approximately 50 gal of sediment were collected from the Siletz River just downstream of the Siletz Highway (229) bridge in Siletz, OR (SRS; see location in Stratus Consulting, 2011a). Approximately 2,000 to 2,500 ammocoetes were collected from multiple locations in the Siletz River. Of these, approximately 500 were longer than 80 mm; the remaining individuals were between 15 and 80 mm. See the Portland Harbor Pacific Lamprey Ammocoete Study: Sediment Collection and Analysis Plan (Stratus Consulting, 2009) and Sampling Plan: Field Collection of Ammocoetes for Pacific Lamprey Toxicity Study (Stratus Consulting, 2011a) for the collection locations and methods that were used to collect sediments and lamprey in fall 2009. The Aquatic Program of the Siletz Indians held the ammocoetes at the Lhuuke Illahee Fish Hatchery on the Siletz River in large circular tanks with at least 6 in. of wood-chip substrate and a continual supply of fresh water from the Siletz River for approximately 5 months. Approximately 400 ammocoetes were transported in April 2010 to the Fish Performance and Genetics Laboratory (FPGL), Oregon State University (Corvallis), for use in this study. The remaining ammocoetes were retained by the Aquatic Program of the Siletz Indians for other purposes.
1.2.2 Summer 2010 collection of sediment and lamprey
Approximately 200 ammocoetes were collected during August and September 2010 from various locations in the Siletz River using electro-fishing gear and delivered to FPGL on September 21, 2010. See the Sampling Plan: Field Collection of Ammocoetes for Pacific Lamprey Toxicity Study (Stratus Consulting, 2011a) for methods used.

Stratus Consulting (Revised 7/15/2013)
Page 3 SC12470
Table 1. Sediment sampling locations on the Willamette River. All sediment was collected in summer 2010 unless otherwise noted.
Sampling site ID Name
Approximate river mile
Primary contaminants of interest
OST Oregon Steel 2.1 PCBs,a zinc, copper
SC1 Schnitzer 1 3.7 PCBs, phthalates, PAHs,b zinc, copper
ARM Arco/Mobil 5.1 PAHs, TPHc (diesel)
MAR Marcom 5.6 Tributyl tin, zinc, copper, PAHs
GAA Gasco 1 (alternate) 6.1 Cyanide, PAHs, DDxd
GAS/GA2e Gasco 2 6.2 PAHs, DDx
AR1 Arkema 1 7.3 DDx, dioxins/furans, chlordane
AR2 Arkema 2 7.4 Perchlorate, DDx
SWI Swan Island 8.5 Copper, zinc, PAHs
RE1 Reference site 1 19.1 None
RE2 Reference site 2 23.2 None
RE3 Reference site 3 23.2 None
a. Polychlorinated biphenyls. b. Polycyclic aromatic hydrocarbons. c. Total petroleum hydrocarbon. d. Includes dichlorodiphenyltrichloroethane (DDT), dichlorodiphenyldichloroethylene (DDE), and dichlorodiphenyldichloroethane (DDD). e. GAS samples were collected in fall 2009, and GA2 samples were collected in summer 2010.
Approximately 10 gal of sediment were collected from each of 12 locations on the Willamette River during the week of July 26, 2010 (Table 1). Nine locations were areas in the Harbor previously found to contain contaminated sediments; three upstream locations served as reference areas. All sediment was maintained under chain of custody (COC) by U.S. Fish and Wildlife Service (USFWS) personnel who were present during the sediment collection. The sediment was stored at a secure USFWS facility until it was delivered to FPGL on July 30, 2010, by the same USFWS personnel. See the Sampling Plan: Field Collection of Sediments for Pacific Lamprey Toxicity Study (Stratus Consulting, 2011b) and the Sampling Report: Field Collection of Sediments for Pacific Lamprey Toxicity Study (Stratus Consulting, 2011c) for a detailed description of the sediment collection and handling activities.

Stratus Consulting (Revised 7/15/2013)
Page 4 SC12470
1.2.3 Analytical chemistry of sediment samples
Following the fall 2009 sediment collection, composite samples of the GAS and SRS sediment were collected from the holding buckets in the field and sent to Columbia Analytical Services (CAS; Kelso, WA) for analytical chemistry and particle size analyses.
Prior to the pre-pilot sediment exposure test (Task 3; Section 5), two additional samples were collected and submitted to CAS for analysis: a sample of Oregon State University pond sediment (OSU) and a second composite sample from the fall 2009 GAS sediment collected using an incremental sampling methodology [PLA standard operating procedure (SOP) P.11; Stratus Consulting, 2011d].
Composite samples from the summer 2010 sampling and the masonry sand control (MSC) sediment were collected and submitted to CAS for analysis at the beginning of the pilot sediment exposure test (Task 3; Section 5) in October 2010. These test results are summarized in Tables 2 through 4.
1.2.4 Ammocoete acclimation and holding
Approximately 600 ammocoetes were transported from the Siletz River to the FPGL in 3 batches of 200 ammocoetes each. The first two deliveries in March and April 2010 consisted of ammocoetes collected in fall 2009. The third delivery in November 2010 consisted of ammocoetes collected in summer 2010.
Ammocoetes were acclimatized to FPGL conditions for at least three weeks before trials began. Approximately 200 ammocoetes at a time were held in each of two 1.5-m diameter by 1.5-m high oval stock tanks filled with a 14.4-cm deep mixture of 80% clean masonry sand and 20% woodchip substrate (Figure 1).1 Ammocoetes were fed a 1:1 ratio of Baker’s yeast and a microencapsulated larval fish enrichment diet (Argent Chemical Laboratories, Redmond, WA; ammocoete diet), suspended in warm water, and delivered at 2% body weight three times per week. Pathogen-free well water was introduced from a spray bar at the top of the tank at a rate of 7.2 L/min. A horizontal effluent standpipe drained water out of the tank at a height of 27 cm above the tank bottom. During holding, dissolved oxygen (DO), temperature, pH, and conductivity of the water were recorded daily, and ammonia was tested weekly.
1. Following the Institutional Animal Care and Use Committee (IACUC) guidelines (IACUC, permit #4022).

Stratus Consulting (Revised 7/15/2013)
Page 5 SC12470
Table 2. Analytical chemistry results for samples collected in fall 2009 and for MSC
Component Unit Basis
GAS (sampled
in the field)
GAS (sampled in laboratory
prior to Task 3) SRS OSU MSC
Total solids Percent Wet 51.6 58.4 80 53.1 97.3
Ammonia as nitrogen mg/kg Dry 67.4 87.9 6.89 33.1 1.68
TOC Percent Dry 2.61 3.07 0.5 0.117 0.133
Gravel (> 2.00 mm) Percent Dry 1.26 0.48 0.9 19 0.5
Sand, very coarse (> 1.00 mm to 2.00 mm) Percent Dry 1.99 0.64 1.15 12.5 5.5
Sand, coarse (> 0.500 mm to 1.00 mm) Percent Dry 2.86 2.13 3.73 8.56 19.2
Sand, medium (> 0.250 mm to 0.500 mm) Percent Dry 9.38 4.67 38.4 5.5 54.4
Sand, fine (> 0.125 mm to 0.250 mm) Percent Dry 21.9 17.8 38.4 6.58 0.58
Sand, very fine (> 0.0625 mm to 0.125 mm) Percent Dry 17.4 25.6 10.7 5.46 16.4
Silt (0.0039 mm to 0.0625 mm) Percent Dry 39.1 40.2 4.58 33 0.8
Clay (< 0.0039 mm) Percent Dry 5.11 3.67 0.75 13.4 0.24
Sulfide, acid-volatile mol/g Dry 0.23 J 0.11 0.11 J 0.254 0.005 U
Cadmiuma mol/g Dry NA NA NA NA 0.00047 U
Coppera mol/g Dry NA NA NA NA 0.0076
Leada mol/g Dry NA NA NA NA 0.003 U
Nickela mol/g Dry NA NA NA NA 0.005
Silvera mol/g Dry NA NA NA NA 0.001 U
Zinca mol/g Dry NA NA NA NA 0.0657
Copper mg/kg Dry 34.2 39.3 72 36 6.8
Mercury mg/kg Dry 0.148 0.095 0.017 J 0.038 0.007 J
Zinc mg/kg Dry 96 125 88.6 66.6 33.9

Stratus Consulting (Revised 7/15/2013)
Page 6 SC12470
Table 2. Analytical chemistry results for samples collected in fall 2009 and for MSC (cont.)
Component Unit Basis
GAS (sampled
in the field)
GAS (sampled in laboratory
prior to Task 3) SRS OSU MSC
Tetra-n-butyltin g/kg Dry 0.85 U 0.75 U 0.55 U 0.82 U 0.46 U
Tri-n-butyltin cation µg/kg Dry 3.6 2.5 0.54 U 0.8 U 0.45 U
Di-n-butyltin cation µg/kg Dry 2.9 2.8 0.24 U 0.36 U 0.2 U
n-Butyltin cation µg/kg Dry 0.51 U 2.1 0.33 U 0.49 U 0.27 U
DRO mg/kg Dry 1,400 DZ 1,700 DZ 3.9 J 12 J 3.5 J
GRO mg/kg Dry 7.6 J 81 Y 2.1 U 3.4 U 1.6 U
RRO mg/kg Dry 2,200 DZ 3,600 DZ 34 J 99 J 12 J
2,4’-DDD µg/kg Dry 13 Ui 33 6.3 Ui 3.3 Ui 0.13 U
4,4’-DDD µg/kg Dry 42 PD 62 D 25 PD 0.11 U 0.11 U
2,4’-DDE µg/kg Dry 9.7 Ui 0.82 Ui 6.3 Ui 0.16 U 0.16 U
4,4’-DDE µg/kg Dry 4.5 Ui 12 3 JD 0.11 U 0.11 U
2,4’-DDT µg/kg Dry 6.1 Ui 22 12 PD 0.058 U 0.058 U
4,4’-DDT µg/kg Dry 1.7 U 49 D 10 PD 0.17 U 0.17 U
Aroclor 1016 µg/kg Dry 20 Ui 2.1 U 12 Ui 2.1 U 2.1 U
Aroclor 1221 µg/kg Dry 61 Ui 2.1 U 44 Ui 2.1 U 2.1 U
Aroclor 1232 µg/kg Dry 140 Ui 2.1 U 96 Ui 2.1 U 2.1 U
Aroclor 1242 µg/kg Dry 46 Ui 2.1 U 28 Ui 2.1 U 2.1 U
Aroclor 1248 µg/kg Dry 12 Ui 2.1 U 5.4 Ui 2.1 U 2.1 U
Aroclor 1254 µg/kg Dry 97 Ui 110 11 Ui 2.1 U 2.1 U
Aroclor 1260 µg/kg Dry 15 Ui 2.1 U 12 Ui 2.1 U 2.1 U

Stratus Consulting (Revised 7/15/2013)
Page 7 SC12470
Table 2. Analytical chemistry results for samples collected in fall 2009 and for MSC (cont.)
Component Unit Basis
GAS (sampled
in the field)
GAS (sampled in laboratory
prior to Task 3) SRS OSU MSC
Aroclor 1262 µg/kg Dry 9.2 Ui NA 5 Ui 2.1 U 2.1 U
Aroclor 1268 µg/kg Dry 4.2 Ui NA 2.1 U 2.1 U 2.1 U
a. These metals are simultaneously extracted metals. Notes: DRO: Diesel range organics. GRO: Gasoline range organics. RRO: Residual range organics. TOC: Total organic carbon. D: The reported result is from a dilution. J: Estimated concentration. Result is greater than detection limit but less than reporting limit. P: The gas chromatography (GC) or high-pressure liquid chromatography (HPLC) confirmation criterion was exceeded. The relative percent difference is greater than 40% between the two analytical results. U: Analyte was not detected at or above the reporting limit. i: The method reporting limit/method detection limit (MRL/MDL) or level of quantitation/level of detection (LOQ/LOD) is elevated due to a matrix interference. The chromatogram indicated the presence of non-target background components. The matrix interference prevented the adequate resolution of the target compound at the normal limit of detection. Y: The chromatographic fingerprint of the sample resembles a petroleum product eluting in approximately the correct carbon range, but the elution pattern does not match the calibration standard. This could be due to mixtures of petroleum products and (or) degradation of petroleum products in the field-collected sample. Z: The chromatographic fingerprint does not resemble a distinct petroleum product standard currently on file at CAS. This could be due to mixtures of petroleum products and (or) degradation of petroleum products in the field-collected sample.

Stratus Consulting (Revised 7/15/2013)
Page 8 SC12470
Table 3. Analytical chemistry results for samples collected in summer 2010 (Harbor sediment samples)
Component Unit Basis AR1 AR2 ARM GA2 GAA MAR OST SC1 SWI
Total solids Percent Wet 67.2 44.3 52.8 49 41.5 53.1 54.5 52.2 58.5
Ammonia as nitrogen mg/kg Dry 72.6 123 154 193 158 92.7 51.1 96.8 58.1
TOC Percent Dry 1.46 2.52 2.15 5.02 3.61 2.59 1.97 1.86 1.75
Gravel (> 2.00 mm) Percent Dry 9.86 0.71 0.4 0.58 0.03 0.83 2.35 0.14 0.82
Sand, very coarse (> 1.00 mm to 2.00 mm) Percent Dry 3.58 0.6 0.71 1.22 0.37 0.93 1.29 7.41 1.78
Sand, coarse (> 0.500 mm to 1.00 mm) Percent Dry 7.61 1.29 5.32 9.64 0.89 1.67 5.36 5.22 12.9
Sand, medium (> 0.250 mm to 0.500 mm) Percent Dry 20.1 6.32 10.4 6.65 1.22 3.01 29.9 7.52 33.1
Sand, fine (> 0.125 mm to 0.250 mm) Percent Dry 7.12 7.5 5.65 9.24 0.49 9.83 10 0.49 10
Sand, very fine (> 0.0625 mm to 0.125 mm) Percent Dry 10.1 7.03 7.59 18.3 12.67 30.2 5.72 31.8 8.36
Silt (0.0039 mm to 0.0625 mm) Percent Dry 37.9 70.7 63.6 47.8 73.3 50.3 45.8 44.2 27.9
Clay (< 0.0039 mm) Percent Dry 2.93 10.3 13.8 5.81 8.79 2.19 5.56 4.79 6.29
Sulfide, acid-volatile uMole/g Dry 0.031 J 0.489 0.038 J 0.344 0.095 0.096 0.019 J 0.044 0.036 J
Cadmium uMole/g Dry 0.0012 0.0013 U 0.0011 U 0.0013 U 0.0015 U 0.0011 U 0.0011 U 0.0021 0.0021
Copper uMole/g Dry 0.157 0.0326 0.0597 0.024 0.024 0.0238 0.0216 0.0954 0.105
Lead uMole/g Dry 0.384 0.007 U 0.01 0.013 0.008 U 0.024 0.015 0.046 0.017

Stratus Consulting (Revised 7/15/2013)
Page 9 SC12470
Table 3. Analytical chemistry results for samples collected in summer 2010 (Harbor sediment samples) (cont.)
Component Unit Basis AR1 AR2 ARM GA2 GAA MAR OST SC1 SWI
Nickel uMole/g Dry 0.091 0.016 0.016 0.034 0.012 U 0.009 0.009 0.03 0.015
Silver uMole/g Dry 0.002 U 0.0028 U 0.0023 U 0.0026 U 0.0032 U 0.0024 U 0.0024 U 0.0024 U 0.0022 U
Zinc uMole/g Dry 0.222 0.157 0.186 0.263 0.13 * 0.281 * 0.27 0.787 0.628
Copper mg/kg Dry 166 92.6 47.6 53.5 52.2 101 37.5 71.6 85.6
Mercury mg/kg Dry 0.086 0.065 0.138 0.259 0.094 0.187 0.079 0.208 0.114
Zinc mg/kg Dry 119 130 112 145 118 193 221 281 256
Tetra-n-butyltin µg/kg Dry 1.3 Ui 1 U 0.84 U 0.9 U 1.1 U 1.5 J 0.81 U 0.85 U 0.76 U
Tri-n-butyltin cation µg/kg Dry 6.2 1 J 1.1 J 1.4 J 1.2 J 130 1.3 J 21 70
Di-n-butyltin cation µg/kg Dry 3.7 1.9 J 0.58 J 1.7 J 0.81 J 21 2.4 23 290 D
n-Butyltin cation µg/kg Dry 2.1 2 J 0.9 J 1.8 J 1.4 J 11 2 22 63
DRO mg/kg Dry 160 H 85 Z 490 Y 1,300 Z 360 Z 340 Y 48 Z 300 H 210 H
GRO mg/kg Dry 11 Z 4.7 J 32 Y 17 Z 6.1 J 5.9 J 3.4 U 4.6 J 5.3 J
RRO mg/kg Dry 660 O 570 Z 700 O 2,600 O 1,000 Z 870 O 310 Z 1,400 O 1,000 O
2,4’-DDD µg/kg Dry 300 PD 89 D 17 P 26 8.2 Ui 2.4 Ui 2 Ui 3.7 Ui 11
4,4’-DDD µg/kg Dry 470 PD 170 D 25 90 D 19 1.6 1.2 Ui 2.8 0.71 JP
2,4’-DDE µg/kg Dry 75 Ui 5.2 P 5.3 P 3.6 P 1.3 Ui 0.68 Ui 2.9 Ui 0.96 Ui 0.86 Ui
4,4’-DDE µg/kg Dry 190 D 150 D 16 P 15 P 5.6 1.3 P 1.5 Ui 2.8 Ui 1.8 P
2,4’-DDT µg/kg Dry 200 PD 170 D 4.8 Ui 6.8 Ui 2.5 Ui 1.9 4.7 P 11 18 Ui
4,4’-DDT µg/kg Dry 1,800 D 1,200 D 7 140 D 2.8 Ui 2.7 7.2 16 70 Ui

Stratus Consulting (Revised 7/15/2013)
Page 10 SC12470
Table 3. Analytical chemistry results for samples collected in summer 2010 (Harbor sediment samples) (cont.)
Component Unit Basis AR1 AR2 ARM GA2 GAA MAR OST SC1 SWI
Aroclor 1016 µg/kg Dry 910 Ui 12 U 2.1 U 2.2 U 2.6 U 2.1 U 2.1 U 2.1 U 11 U
Aroclor 1221 µg/kg Dry 3,500 Ui 12 U 2.1 U 2.2 U 2.6 U 2.1 U 2.1 U 2.1 U 11 U
Aroclor 1232 µg/kg Dry 2,400 Ui 12 U 2.1 U 2.2 U 2.6 U 2.1 U 2.1 U 2.1 U 11 U
Aroclor 1242 µg/kg Dry 1,500 Ui 12 U 2.1 U 6.9 Ui 13 Ui 5.8 Ui 2.1 U 67 11 U
Aroclor 1248 µg/kg Dry 850 Ui 12 U 2.1 U 2.2 U 2.6 U 2.1 U 2.1 U 2.1 U 11 U
Aroclor 1254 µg/kg Dry 1,100 Ui 180 Ui 45 Ui 41 Ui 22 Ui 23 P 100 160 11 U
Aroclor 1260 µg/kg Dry 960 Ui 13 Ui 43 45 12 Ui 22 Ui 49 Ui 2.1 U 610 D
Aroclor 1262 µg/kg Dry 210 U 12 U 2.1 U 2.2 U 2.6 U 2.1 U 2.1 U 2.1 U 11 U
Aroclor 1268 µg/kg Dry 210 U 12 U 2.1 U 2.2 U 2.6 U 2.1 U 2.1 U 2.1 U 11 U
cis/trans-Decalin µg/kg Dry 3.2 J 1.4 U 8.3 53 D 8 U 6.9 1.4 U 1.4 U 3.3 J
C1-Decalins µg/kg Dry 15 J 3.1 J 25 J 88 JD 26 JD 27 J 1.4 U 7.2 J 11 J
C2-Decalins µg/kg Dry 65 J 9.6 J 58 J 350 JD 100 JD 71 J 1.4 U 23 J 37 J
C3-Decalins µg/kg Dry 100 J 22 J 82 J 730 JD 170 JD 140 J 1.4 U 62 J 65 J
C4-Decalins µg/kg Dry 140 J 33 J 100 J 820 JD 190 JD 230 J 1.4 U 110 J 120 J
Benzo(b)thiophene µg/kg Dry 0.9 U 0.88 J 10 280 D 52 D 21 0.87 U 1.4 J 1.5 J
C1-Benzothiophenes µg/kg Dry 3.1 J 0.87 U 22 J 560 JD 90 JD 10 J 0.87 U 1.7 J 2.2 J
C2-Benzothiophenes µg/kg Dry 6.3 J 0.87 U 68 J 1,400 JD 220 JD 15 J 0.87 U 3.2 J 3.3 J
C3-Benzothiophenes µg/kg Dry 6.5 J 1.2 J 70 J 1,300 JD 240 JD 19 J 0.87 U 3.2 J 5.6 J
C4-Benzo(b)thiophenes µg/kg Dry 15 J 0.87 U 62 J 1,200 JD 230 JD 41 J 0.87 U 7.7 J 5 J
Naphthalene µg/kg Dry 12 6.1 110 2,900 D 790 D 350 9.4 17 23

Stratus Consulting (Revised 7/15/2013)
Page 11 SC12470
Table 3. Analytical chemistry results for samples collected in summer 2010 (Harbor sediment samples) (cont.)
Component Unit Basis AR1 AR2 ARM GA2 GAA MAR OST SC1 SWI
C1-Naphthalenes µg/kg Dry 12 J 4.2 J 72 J 4,200 JD 1,000 JD 96 J 5.3 J 13 J 9.7 J
C2-Naphthalenes µg/kg Dry 50 J 6.9 J 370 J 9,000 JD 2,300 JD 120 J 6.3 J 30 J 25 J
C3-Naphthalenes µg/kg Dry 100 J 6.8 J 440 J 8,300 JD 2,200 JD 200 J 5.8 J 53 J 50 J
C4-Naphthalenes µg/kg Dry 110 J 8.1 J 260 J 4,900 JD 1,200 JD 290 J 6.3 J 41 J 34 J
Biphenyl µg/kg Dry 3.8 J 2.1 J 26 370 D 320 D 28 1.8 J 8.9 5.1
Dibenzofuran µg/kg Dry 10 3.9 J 24 670 D 240 D 55 2.7 J 18 8.7
Acenaphthylene µg/kg Dry 6.4 3.5 J 33 830 D 200 D 65 3.1 J 8.8 21
Acenaphthene µg/kg Dry 8.9 6.2 480 7,100 D 880 D 99 4.4 J 27 18
Fluorene µg/kg Dry 20 8 260 5,400 D 2,600 D 110 4.7 34 20
C1-Fluorenes µg/kg Dry 22 J 3.3 J 130 J 3,400 JD 920 JD 82 J 2.7 J 20 J 19 J
C2-Fluorenes µg/kg Dry 72 J 11 J 170 J 4,800 JD 1,200 JD 310 J 7.7 J 47 J 43 J
C3-Fluorenes µg/kg Dry 110 J 9.9 J 170 J 4,800 JD 1,200 JD 540 J 6.9 J 63 J 62 J
Anthracene µg/kg Dry 71 9.2 270 12,000 D 19,000 D 150 9 99 77
Phenanthrene µg/kg Dry 210 50 1,900 D 40,000 D 9,500 D 660 27 400 240
C1-Phenanthrenes/ Anthracenes µg/kg Dry 170 J 25 J 490 J 23,000 JD 5,700 JD 470 J 20 J 200 J 160 J
C2-Phenanthrenes/ Anthracenes µg/kg Dry 230 J 34 J 350 J 18,000 JD 4,400 JD 800 J 26 J 180 J 140 J
C3-Phenanthrenes/ Anthracenes µg/kg Dry 240 J 33 J 230 J 11,000 JD 2,700 JD 970 J 31 J 160 J 120 J
C4-Phenanthrenes/ Anthracenes µg/kg Dry 240 J 43 J 180 J 6,100 JD 1,900 JD 940 J 8.8 J 140 J 130 J
Stratus Consulting (Revised 7/15/2013)
Page 12 SC12470
Table 3. Analytical chemistry results for samples collected in summer 2010 (Harbor sediment samples) (cont.)
Component Unit Basis AR1 AR2 ARM GA2 GAA MAR OST SC1 SWI
Retene µg/kg Dry 130 63 160 1,500 D 1,700 D 410 100 38 71
Dibenzothiophene µg/kg Dry 15 3.5 J 250 5,400 D 1,200 D 74 2.8 J 23 27
C1-Dibenzothiophenes µg/kg Dry 33 J 3.9 J 110 J 4,400 JD 980 JD 110 J 3.4 J 26 J 38 J
C2-Dibenzothiophenes µg/kg Dry 98 J 9.8 J 120 J 5,300 JD 1,300 JD 280 J 7.3 J 51 J 55 J
C3-Dibenzothiophenes µg/kg Dry 110 J 13 J 110 J 4,500 JD 1,000 JD 390 J 9.1 J 74 J 82 J
C4-Dibenzothiophenes µg/kg Dry 120 J 32 J 63 J 2,100 JD 480 JD 270 J 0.43 U 76 J 94 J
Benzo(b)fluorene µg/kg Dry 150 14 120 7,000 D 1,300 D 170 7.9 82 97
Fluoranthene µg/kg Dry 950 140 1,200 50,000 D 8,900 D 1,300 66 740 470
Pyrene µg/kg Dry 800 130 1,400 61,000 D 10,000 D 1,400 70 680 500
C1-Fluoranthenes/ Pyrenes µg/kg Dry 500 J 61 J 390 J 27,000 JD 5,200 JD 590 J 34 J 350 J 300 J
C2-Fluoranthenes/ Pyrenes µg/kg Dry 300 J 45 J 180 J 14,000 JD 3,100 JD 440 J 25 J 210 J 140 J
C3-Fluoranthenes/ Pyrenes µg/kg Dry 270 J 34 J 120 J 9,800 JD 2,200 JD 470 J 24 J 160 J 130 J
C4-Fluoranthenes/ Pyrenes µg/kg Dry 180 J 32 J 77 J 6,100 JD 1,100 JD 290 J 17 J 96 J 100 J
Naphthobenzo-thiophene µg/kg Dry 160 19 85 5,300 D 950 D 120 5.9 82 61

Stratus Consulting (Revised 7/15/2013)
Page 13 SC12470
Table 3. Analytical chemistry results for samples collected in summer 2010 (Harbor sediment samples) (cont.)
Component Units Basis AR1 AR2 ARM GA2 GAA MAR OST SC1 SWI
C1-Naphthobenzo-thiophenes µg/kg Dry 140 J 17 J 66 J 5,600 JD 1,100 JD 160 J 9.6 J 94 J 97 J
C2-Naphthobenzo-thiophenes µg/kg Dry 160 J 27 J 50 J 4,400 JD 930 JD 170 J 18 J 120 J 170 J
C3-Naphthobenzo-thiophenes µg/kg Dry 150 J 41 J 65 J 3,700 JD 870 JD 160 J 25 J 150 J 230 J
C4-Naphthobenzo-thiophenes µg/kg Dry 82 J 33 J 35 J 1,200 JD 320 JD 91 J 22 J 99 J 180 J
Benz(a)anthracene µg/kg Dry 850 51 350 24,000 D 4,400 D 510 25 350 220
Chrysene µg/kg Dry 1,200 160 480 28,000 D 5,300 D 630 40 450 330
C1-Chrysenes µg/kg Dry 470 J 39 J 180 J 16,000 JD 3,400 JD 310 J 21 J 220 J 150 J
C2-Chrysenes µg/kg Dry 330 J 33 J 130 J 12,000 JD 2,700 JD 270 J 20 J 160 J 140 J
C3-Chrysenes µg/kg Dry 230 J 32 J 83 J 6,700 JD 1,400 JD 190 J 26 J 120 J 110 J
C4-Chrysenes µg/kg Dry 140 J 39 J 55 J 3,900 JD 730 JD 150 J 48 J 85 J 98 J
Benzo(b)fluoranthene µg/kg Dry 2,000 120 540 31,000 D 5,800 D 860 49 540 330
Benzo(k)fluoranthene µg/kg Dry 600 33 150 7,900 D 1,700 D 230 15 160 100
Benzo(a)fluoranthene µg/kg Dry 140 13 91 4,800 D 810 D 130 7.3 57 40
Benzo(e)pyrene µg/kg Dry 1,100 65 360 20,000 D 4,000 D 550 34 320 180
C30-Hopane µg/kg Dry 240 96 94 430 D 130 D 400 68 380 470
Benzo(a)pyrene µg/kg Dry 940 73 520 31,000 D 5,500 D 740 42 350 210
Perylene µg/kg Dry 310 35 170 7,700 D 1,400 D 260 40 140 110

Stratus Consulting (Revised 7/15/2013)
Page 14 SC12470
Table 3. Analytical chemistry results for samples collected in summer 2010 (Harbor sediment samples) (cont.)
Component Unit Basis AR1 AR2 ARM GA2 GAA MAR OST SC1 SWI
Indeno(1,2,3-cd)pyrene µg/kg Dry 860 55 450 22,000 D 4,400 D 650 38 290 160
Dibenz(a,h)anthracene µg/kg Dry 200 11 63 3,500 D 700 D 99 6.3 67 32
Benzo(g,h,i)perylene µg/kg Dry 660 57 500 25,000 D 4,800 D 720 44 300 180
4-Methyldibenzo-thiophene µg/kg Dry 12 J 1.2 J 37 J 1,400 JD 370 JD 34 J 1.2 J 8.3 J 13 J
2-Methyldibenzo-thiophene µg/kg Dry 11 J 0.93 J 36 J 1,500 JD 350 JD 26 J 1.1 J 7.3 J 11 J
1-Methyldibenzo-thiophene µg/kg Dry 3.4 J 0.43 U 11 J 440 JD 89 JD 15 J 0.43 U 2.2 J 3.7 J
3-Methylphenanthrene µg/kg Dry 38 J 5.5 J 120 J 4,900 JD 1,200 JD 95 J 4.2 J 46 J 37 J
2-Methylphenanthrene µg/kg Dry 47 J 6.7 J 140 J 6,600 JD 1,500 JD 120 J 4.8 J 55 J 38 J
2-Methylanthracene µg/kg Dry 16 J 2.5 J 43 J 2,600 JD 1,300 JD 30 J 1.9 J 22 J 18 J
9-Methylphenanthrene µg/kg Dry 31 J 4.6 J 91 J 4,700 JD 960 JD 110 J 3.6 J 32 J 32 J
1-Methylphenanthrene µg/kg Dry 31 J 4.2 J 88 J 3,600 JD 830 JD 81 J 3.4 J 33 J 31 J
2-Methylnaphthalene µg/kg Dry 9.5 3.7 J 66 2,900 D 1,000 D 94 4.7 11 7.5
1-Methylnaphthalene µg/kg Dry 6.6 2.5 J 39 3,500 D 500 D 46 2.4 J 7.6 5.3
2,6-Dimethylnaph-thalene µg/kg Dry 24 2.4 J 120 3,800 D 1,300 D 64 2.8 J 11 9.5

Stratus Consulting (Revised 7/15/2013)
Page 15 SC12470
Table 3. Analytical chemistry results for samples collected in summer 2010 (Harbor sediment samples) (cont.)
Component Unit Basis AR1 AR2 ARM GA2 GAA MAR OST SC1 SWI
2,3,5-Trimethylnaph-thalene µg/kg Dry 26 2.2 J 130 2,500 D 500 D 60 2.1 J 13 11
Carbazole µg/kg Dry 9.4 3.2 J 10 1,600 D 4,400 D 35 1.6 J 23 11
Notes: *: The result is an outlier. See case narrative. D: The reported result is from a dilution. H: The chromatographic fingerprint of the sample resembles a petroleum product, but the elution pattern indicates the presence of a greater amount of heavier molecular weight constituents than the calibration standard. J: Estimated concentration. Result is greater than detection limit but less than reporting limit. O: The chromatographic fingerprint of the sample resembles an oil but does not match the calibration standard. P: The GC or HPLC confirmation criterion was exceeded. The relative percent difference is greater than 40% between the two analytical results. U: Analyte was not detected at or above the reporting limit. i: The MRL/MDL or LOQ/LOD is elevated due to a matrix interference. The chromatogram indicated the presence of non-target background components. The matrix interference prevented adequate resolution of the target compound at the normal limit of detection. Y: The chromatographic fingerprint of the sample resembles a petroleum product eluting in approximately the correct carbon range, but the elution pattern does not match the calibration standard. This could be due to mixtures of petroleum products and (or) degradation of petroleum products in the field-collected sample. Z: The chromatographic fingerprint does not resemble a distinct petroleum product standard currently on file at CAS. This could be due to mixtures of petroleum products and (or) degradation of petroleum products in the field-collected sample.

Stratus Consulting (Revised 7/15/2013)
Page 16 SC12470
Table 4. Analytical chemistry results for samples collected in summer 2010 (Willamette River reference samples)
Component Unit Basis RE1 RE2 RE3
Total solids Percent Wet 50 44.5 49.1
Ammonia as nitrogen mg/kg Dry 100 84.2 59.7
TOC Percent Dry 2.16 2.7 1.79
Gravel (> 2.00 mm) Percent Dry 0.16 0 0.19
Sand, very coarse (> 1.00 mm to 2.00 mm) Percent Dry 1.09 0.72 0.41
Sand, coarse (> 0.500 mm to 1.00 mm) Percent Dry 1.01 0.44 0.67
Sand, medium (> 0.250 mm to 0.500 mm) Percent Dry 2.57 0.39 5.85
Sand, fine (> 0.125 mm to 0.250 mm) Percent Dry 14.3 1.24 21.5
Sand, very fine (> 0.0625 mm to 0.125 mm) Percent Dry 31.2 5.25 12.6
Silt (0.0039 mm to 0.0625 mm) Percent Dry 52.1 75.4 52.3
Clay (< 0.0039 mm) Percent Dry 3.58 19 8.84
Sulfide, acid-volatile uMole/g Dry 0.011 U 0.009 U 0.012 U
Cadmium uMole/g Dry 0.0012 U 0.00095 U 0.0012 U
Copper uMole/g Dry 0.0374 0.0599 0.0311
Lead uMole/g Dry 0.006 U 0.005 0.007 U
Nickel uMole/g Dry 0.016 0.012 0.01 U
Silver uMole/g Dry 0.0024 U 0.002 U 0.0026 U
Zinc uMole/g Dry 0.114 0.0837 0.0806 *
Copper mg/kg Dry 34.8 42.9 37.5
Mercury mg/kg Dry 0.046 0.06 0.041
Zinc mg/kg Dry 80 92.5 83

Stratus Consulting (Revised 7/15/2013)
Page 17 SC12470
Table 4. Analytical chemistry results for samples collected in summer 2010 (Willamette River reference samples) (cont.)
Component Unit Basis RE1 RE2 RE3
Tetra-n-butyltin µg/kg Dry 0.88 U 0.98 U 0.9 U
Tri-n-butyltin Cation µg/kg Dry 0.86 U 0.96 U 0.88 U
Di-n-butyltin Cation µg/kg Dry 0.38 U 0.51 J 0.39 U
n-Butyltin Cation µg/kg Dry 0.55 J 0.76 J 0.56 J
DRO mg/kg Dry 30 J 56 J 34 J
GRO mg/kg Dry 3.7 U 450 O 3.8 U
RRO mg/kg Dry 310 Z 4.3 U 260 Z
2,4’-DDD µg/kg Dry 0.13 U 0.35 J 0.14 U
4,4’-DDD µg/kg Dry 0.27 Ui 1.2 Ui 0.12 U
2,4’-DDE µg/kg Dry 0.16 U 0.18 U 0.17 U
4,4’-DDE µg/kg Dry 0.81 J 1.1 JP 0.87 J
2,4’-DDT µg/kg Dry 0.058 U 0.066 U 0.06 U
4,4’-DDT µg/kg Dry 1 Ui 0.61 J 0.18 U
Aroclor 1016 µg/kg Dry 2.1 U 2.4 U 2.2 U
Aroclor 1221 µg/kg Dry 2.1 U 2.4 U 2.2 U
Aroclor 1232 µg/kg Dry 2.1 U 2.4 U 2.2 U
Aroclor 1242 µg/kg Dry 2.1 U 2.4 U 2.2 U
Aroclor 1248 µg/kg Dry 2.1 U 2.4 U 2.2 U
Aroclor 1254 µg/kg Dry 2.1 U 2.4 U 2.2 U
Aroclor 1260 µg/kg Dry 2.1 U 2.4 U 2.2 U

Stratus Consulting (Revised 7/15/2013)
Page 18 SC12470
Table 4. Analytical chemistry results for samples collected in summer 2010 (Willamette River reference samples) (cont.)
Component Unit Basis RE1 RE2 RE3
Aroclor 1262 µg/kg Dry 2.1 U 2.4 U 2.2 U
Aroclor 1268 µg/kg Dry 2.1 U 2.4 U 2.2 U
Notes: *: The result is an outlier. See case narrative. J: Estimated concentration. Result is greater than detection limit but less than reporting limit. O: The chromatographic fingerprint of the sample resembles an oil but does not match the calibration standard. P: The GC or HPLC confirmation criterion was exceeded. The relative percent difference is greater than 40% between the two analytical results. U: Analyte was not detected at or above the reporting limit. i: The MRL/MDL or LOQ/LOD is elevated due to a matrix interference. The chromatogram indicated the presence of non-target background components. The matrix interference prevented adequate resolution of the target compound at the normal limit of detection. Z: The chromatographic fingerprint does not resemble a distinct petroleum product standard currently on file at CAS. This could be due to mixtures of petroleum products and (or) degradation of petroleum products in the field-collected sample.

Stratus Consulting (Revised 7/15/2013)
Page 19 SC12470
Figure 1. Ammocoete holding tank.
Over the course of 8 months (June 2010 to January 2011), only 10 mortalities in the 600+ ammocoetes held were observed in the holding tanks. Ambient temperature at the facility ranged from 12 to 14C, DO ranged from 7.2 to 9.8 mg/L, pH ranged from 6.4 to 7.0, conductivity ranged from 270 to 320 µS/cm, and total ammonia levels were consistently below 0.3 ppm (Table 5). Stock holding methods demonstrated the ability for ammocoetes to be successfully reared under FPGL conditions and husbandry practices.
Table 5. Water quality monitoring results from ammocoete holding tanks Holding tank 1
(6/2/2010–10/28/2010) Holding tank 2
(6/3/2010–12/15/2010)
n Mean Standard deviation n Mean
Standard deviation
EC (µS/cm) 41 334 147 97 311 96
Temperature (°C) 42 13.1 0.5 96 12.6 0.7
pH 42 6.7 0.1 97 6.7 0.1
DO (mg/L) 42 9.0 0.4 96 8.8 0.5
Ammonia (ppm) 5 0.3 0.1 17.0 0.3 0.2
Unionized ammonia (ppm) 5 0.0004 0.0002 17 0.0004 0.0002
EC: electrical conductivity.

Stratus Consulting (Revised 7/15/2013)
Page 20 SC12470
1.3 Statistical Analysis
We conducted statistical comparisons with ANOVA ( = 0.05) followed by Tukey HSD (honestly significant difference) post hoc pairwise comparisons using MinitabTM Version 13.31 (Minitab Statistical Software, Minitab Inc.). In some cases, a Bonferroni adjustment of the alpha level was required to compare time series data. Also, some data required a log transformation in order to meet assumptions of equal variance. Cases where a Bonferroni adjustment or a log transformation were necessary are identified in the results section for each task where statistical significance among comparisons is reported.
2. Task 2a: Depuration Trial
2.1 Objective
We performed this trial to evaluate whether a depuration period is necessary before weighing ammocoetes that have been living in sediment to determine if abiotic particles in their gut significantly alter their weight. If a depuration period appears necessary for accurate measurements, depuration would be applied to all subsequent trials and tasks that involve weighing ammocoetes.
2.2 Methods
Two depuration trials were conducted. In the first trial, we tracked individuals over time and compared them to a control group. In the second trial, we measured a subset of ammocoetes at each time interval. In both trials, we attempted to use ammocoetes of similar sizes.
2.2.1 First depuration trial
Prior to the first depuration trial, 20 ammocoetes were held in a 75.6-L aquarium containing approximately 15 cm of OSU sediment for 2 weeks and fed the ammocoete diet described in Section 1.2.4. The water level was approximately 13 cm above the sediment. Water was delivered at the top of the tank through nylon tubing at a rate of 200 mL/min and drained from a cylindrical drainpipe at the opposite end of the tank.
After a 2-week holding period, 19 ammocoetes were recovered from the aquarium (one was lost, presumed deceased) and length and wet weight were measured immediately (0 hour depuration). Wet weight was measured by placing an ammocoete on a dry weigh-boat and recording to the nearest hundredth of a gram (0.01 g) (see PLA SOP P.7, Stratus Consulting, 2011d). Nine fish

Stratus Consulting (Revised 7/15/2013)
Page 21 SC12470
were euthanized according to PLA SOP P.3 (Stratus Consulting, 2011d) and stored at -20°C for later analysis of dry weight and ash content.
An additional 10 ammocoetes were placed into separate 1-L beakers with no sediment for depuration. Because ammocoetes are not accustomed to being in open water, cotton balls were placed in each beaker to provide cover, reduce stress, and accommodate for ammocoetes’ natural tendency to burrow and avoid light (Figure 2). Each static container was filled with 10 cm of well water, aerated with an air stone, and covered with black mesh to reduce ambient lighting. Ammocoetes were not fed during the depuration period. Wet-weight measurements were taken at 24, 48, and 72 hours from the start of the trial. After 72 hours, the ammocoetes were removed from the beakers, euthanized, and stored at -20°C for later analysis of dry weight and ash content.
Figure 2. Ammocoete in beaker during depuration trial.
Water quality was measured in the holding tank at the initiation of the trial and in 3 randomly selected beakers at 0, 24, 48, and 72 hours.
Dry and ash weights were determined according to PLA SOP P.14 (Stratus Consulting, 2011d). The frozen samples were thawed and dried in a 60°C oven until their weights were constant. The dry weight of each sample was recorded. The dry samples were then ashed in a muffle furnace at 525°C for 5 hours to burn off all organic content, and the residual material was reweighed.

Stratus Consulting (Revised 7/15/2013)
Page 22 SC12470
2.2.2 Second depuration trial
Thirty ammocoetes were removed directly from the holding tanks, and length and wet weight were measured immediately (0-hour depuration). Ten fish were euthanized according to PLA SOP P.3 (Stratus Consulting, 2011d). The remaining 20 ammocoetes were placed into an aquarium containing OSU sediment and held for 2 weeks. After 2 weeks, these 20 ammocoetes were placed into beakers, as in the first depuration trial. At 0, 24, 48, and 72 hours from the start of the trial, 5 individuals were removed from beakers, wet-weight measurements were recorded, and the individuals were euthanized according to PLA SOP P.3 (Stratus Consulting, 2011d).
Dry and ash weights for all ammocoetes were obtained in the same manner as described for the first depuration trial.
2.3 Results
Results from the first depuration trial are presented in Tables 6 and 7. Figure 3 presents the wet-weight measurements of the ammocoetes over time from the first trial. The mean weights of the ammocoetes decreased over time, with the largest decrease occurring in the first 24 hours. After 72 hours, the average decrease in the wet weight of ammocoetes was 29%. The mean wet weight at hour 0 was significantly (P < 0.01; Bonferroni-adjusted alpha level of 0.0125 based on time series data with four measurements through time) greater than the wet weights at hours 48 and 72. There were no other significant differences among wet weights (Figure 3).
Table 6. Measurements of non-depurated ammocoetes from first depuration trial
Ammocoete Length (mm)
Wet weight (g)
Dry weight (g)
Ash weight (g)
A-1 85 1.07 0.12 0.014
A-2 89 1.11 0.12 0.010
A-3 90 1.02 0.10 0.013
A-4 83 0.92 0.10 0.012
A-5 77 0.91 0.07 0.006
A-6 89 1.19 0.14 0.014
A-7 94 1.29 0.16 0.012
A-8 88 0.83 0.08 0.009
A-9 77 0.67 0.06 0.006
Mean 86 1.00 0.105 0.011
Standard deviation 6 0.19 0.034 0.003

Stratus Consulting (Revised 7/15/2013)
Page 23 SC12470
Table 7. Measurements of depurated ammocoetes from first depuration trial
Ammocoete Length (mm)
0 hours wet weight
(g)
24 hours wet weight
(g)
48 hours wet weight
(g)
72 hours wet weight
(g)
72 hours dry
weight (g)
72 hours ash
weight (g)
A-11 86 1.02 0.87 0.77 0.78 0.10 0.006
A-12 83 0.86 0.68 0.66 0.65 0.08 0.005
A-13 90 1.87 1.08 1.07 1.01 0.15 0.007
A-14 89 1.26 1.00 0.92 0.89 0.11 0.007
A-15 87 1.43 1.05 0.86 0.88 0.12 0.008
A-16 84 0.89 0.74 0.76 0.72 0.08 0.006
A-17 83 0.97 0.94 0.85 0.84 0.10 0.006
A-18 78 1.19 0.62 0.62 0.66 0.07 0.005
A-19 90 1.03 1.07 0.99 0.96 0.11 0.006
A-20 74 0.70 0.63 0.56 0.56 0.06 0.004
Mean 84 1.12 0.87 0.81 0.80 0.098 0.006
Standard deviation 5 0.34 0.19 0.16 0.15 0.027 0.001
The depurated ammocoetes from the first trial (72-hour total depuration period) had a significantly (P < 0.01; based on analysis of log-transformed data to meet assumptions of equal variance in the data) lower ash content (6.2%, based on dry weight) than non-depurated ammocoetes (10.5%, based on dry weight; Figure 4). This may indicate that the non-depurated ammocoetes had more inorganic material in their gut. This is supported by the visual observation of fecal material in the ash from the non-depurated ammocoetes that was not observed in the depurated ammocoetes (Figure 5).
Results from the second depuration trial are presented in Tables 8 and 9. The second depuration trial resulted in an average loss of 8.2, 8.2, and 7.1% body weight for the 24-, 48-, and 72-hour groups, respectively (Figure 6). In the second trial, percent ash to dry body mass was not significantly different among depuration groups (Figure 7). This indicates that ammocoetes may have had variable amounts of sediment in their guts or that elimination may occur at different rates among individuals. We detected no significant differences among depurated and non-depurated fish, which is contrary to the results in the initial trial.
Water quality monitoring results from the second trial are presented in Table 10.

Stratus Consulting (Revised 7/15/2013)
Page 24 SC12470
Figure 3. Mean wet-weight measurements from first depuration trial (n = 10). Error bars are one standard error of the mean. Treatments that are significantly different (P < 0.01) from each other are indicated with different uppercase letters.
Figure 4. Mean ash content of non-depurated and depurated (72 hours) ammocoetes from first depuration trial (n = 9). Error bars are one standard error of the mean. Treatments that are significantly different (P < 0.01) from each other are indicated with an asterisk.
Hours depurated
0 24 48 72
Wet
we
igh
t (g
)
0.0
0.2
0.4
0.6
0.8
1.0
1.2
1.4
A
A, BB B
Treatment
Non-Depurated Depurated
Ash
co
nte
nt
(% b
ased
on
dry
wei
gh
t)
0
2
4
6
8
10
12
*
*

Stratus C
Figure ammoc
onsulting
5. Photogracoetes. A fec
Table 8. Mdepuratio
Ammocoete
HT-1
HT-2
HT-3
HT-4
HT-5
HT-6
HT-7
HT-8
HT-9
HT-10
Mean
Standard de
aphs of ash fcal pellet is p
Measuremenon trial
e Le(m
9
7
7
7
eviation
from depurpresent in the
nts of non-d
ength mm)
W
90.5
71.5
68
78
79.5
69
86
91
74
76.5
78
8
Page 25 SC12470
rated (left) ae non-depura
depurated am
Wet weight (g)
1.39
0.64
0.49
0.62
0.92
0.53
0.80
1.35
0.69
0.82
0.83
0.32
and non-depated ash (red
mmocoetes
Dry weigh(g)
0.29
0.13
0.05
0.10
0.15
0.07
0.09
0.16
0.08
0.11
0.12
0.07
(R
purated (rigd circle).
from secon
ht Ash we(g)
0.00
0.00
0.00
0.00
0.00
0.00
0.00
0.00
0.00
0.00
0.00
0.00
Revised 7/15/
ght)
nd
eight )
08
05
04
05
06
03
06
08
05
05
06
02
/2013)

Stratus Consulting (Revised 7/15/2013)
Page 26 SC12470
Table 9. Measurements of depurated ammocoetes from second depuration trial
Ammocoete Hours
depurated Length (mm)
Initial wet weight
(g)
Final wet weight
(g)
Wet-weight loss
(%) Dry weight
(g) Ash weight
(g)
A-1 0 87.5 0.99 0.99 N/A 0.185 0.008
A-2 0 92 1.15 1.15 N/A 0.262 0.010
A-3 0 82.5 0.88 0.88 N/A 0.095 0.007
A-4 0 78 0.86 0.86 N/A 0.171 0.009
A-5 0 93 1.2 1.2 N/A 0.146 0.011
A-6 24 115 2.53 2.43 4.0 0.552 0.017
A-7 24 92 1.12 0.98 12.5 0.124 0.006
A-8 24 95 1.11 1.02 8.1 0.122 0.008
A-9 24 104 1.7 1.58 7.1 0.268 0.011
A-10 24 96 1.05 0.95 9.5 0.108 0.007
A-11 48 105 1.74 1.67 4.0 0.223 0.012
A-12 48 73 0.71 0.64 9.9 0.077 0.003
A-13 48 73 0.62 0.58 6.5 0.099 0.003
A-14 48 97.5 1.2 1.1 8.3 0.125 0.009
A-15 48 73.5 0.49 0.43 12.2 0.046 0.002
A-16 72 90 0.98 0.93 5.1 0.109 0.007
A-17 72 100.5 1.53 1.46 4.6 0.184 0.011
A-18 72 94 0.94 0.85 9.6 0.102 0.017
A-19 72 95 1.29 1.16 10.1 0.148 0.008
A-20 72 97 1.01 0.95 5.9 0.098 0.008

Stratus Consulting (Revised 7/15/2013)
Page 27 SC12470
Figure 6. Mean change in wet weight for ammocoetes depurated for 24, 48, and 72 hours from second depuration trial (n = 5). Error bars are one standard error of the mean.
Figure 7. Mean ash content in ammocoetes depurated for 0, 24, 48, and 72 hours from second depuration trial (n = 5). Error bars are one standard error of the mean.
Hours depurated
24 48 72C
ha
ng
e in
we
t w
eig
ht
(%)
-10
-8
-6
-4
-2
0
Hours depurated
0 24 48 72
Ash
co
nte
nt
(% b
ased
on
dry
wei
gh
t)
0
2
4
6
8
10
12

Stratus Consulting (Revised 7/15/2013)
Page 28 SC12470
Table 10. Water quality monitoring results from second depuration trial
Hour Container Temperature
(°C) pH DO
(mg/L) EC
(µS/cm)
0 Holding tank 13.0 6.8 8.5 848
A-11 15.0 7.3 7.2 836
A-9 14.9 7.3 7.4 831
A-15 15.0 7.3 7.3 824
24 A-16 15.0 7.4 7.4 825
A-15 14.8 7.4 7.5 831
A-9 15.0 7.4 7.4 829
48 A-17 13.7 7.2 7.3 841
A-18 13.6 7.4 7.4 842
A-12 13.6 7.4 7.5 852
72 A-18 15.8 7.3 7.8 848
A-17 15.8 7.4 7.9 848
A-19 15.7 7.4 8.0 848
2.4 Discussion
The results of the two depuration trials were variable with the first trial indicating that a depuration period may result in significant weight loss due to the evacuation of inorganic material from the ammocoete gut. Given that the two depuration trials used different methods (repeated weighing of the same individuals in the first depuration trial and weighing of different individuals in the second depuration trial), the results cannot be directly compared. However, because the first depuration trial indicated that the largest decrease in weight occurred over the first 24 hours, we opted to implement a 24-hour depuration period before and after each trial to reduce variability in weights introduced by gut content.
3. Task 2b: Holding Container (Corral) Trial
3.1 Objective
The objective of the holding container trial was to determine if different-diameter holding containers (corrals) significantly affect ammocoete growth.

Stratus Consulting (Revised 7/15/2013)
Page 29 SC12470
3.2 Methods
For this trial, we held ammocoetes in several different containers for 30 days and evaluated changes in weight and length. We compared a mixed population (no corrals) with 3 sizes of 1/16-in. mesh isolation corrals (3-in., 4-in., and 6-in. diameter; PLA SOP P.8; Stratus Consulting, 2011d) and two types of tanks (12-in. diameter round and 21.5-gal rectangular). Table 11 summarizes the treatments, and Figure 8 shows the round and rectangular tanks. Each corral and the surrounding tank area were filled with 10.2 cm of OSU sediment. Corrals were suspended from the lip of each tank, with their top portion open to allow for individualized feeding and observation.
Table 11. Summary of corral trial setup
Tank Subcontainer Number of
tanks Ammocoetes
per tank Total
ammocoetes
12-in. round None 3 5 15
12-in. round 3-in. mesh bags 2 5 10
21.5-gal rectangle 3-in. mesh bags 1 10 10
21.5-gal rectangle 4-in. mesh bags 1 10 10
21.5-gal rectangle 6-in. mesh bags 2 5 10
Figure 8. Holding containers used in corral trials. Round tanks are shown in the left-hand photograph (individual mesh bags in tank on the left, mixed population in tank on the right). Rectangular tanks are shown in the right-hand photograph.

Stratus Consulting (Revised 7/15/2013)
Page 30 SC12470
All animals received 3 mL of the ammocoete diet (described in Section 1.2.4) used for ammocoetes in the stock tank at the surface three times a week for 30 days. During the trial, well water was delivered to each rectangular tank at a rate of approximately 200 mL/min through nylon tubing and drained from a covered horizontal drainpipe at the opposite end of the tank. Water was delivered to each round tank at a rate of approximately 150 mL/min through nylon tubing placed near the standpipe in the middle of each tank. Water quality testing was conducted on a subset of experimental tanks daily.
All ammocoetes were depurated for 24 hours before the initiation of the trial. Weights and lengths were measured according to PLA SOP P.7 (Stratus Consulting, 2011d) and ammocoetes were placed into their respective containers according to PLA SOP P.9 (Stratus Consulting, 2011d) and held for 30 days. After 30 days, the ammocoetes were removed from the sediments, depurated for 24 hours, and weights and lengths were measured again.
3.3 Results
No mortality was observed in any of the treatments. Table 12 presents the pre- and post-trial weights and lengths of each ammocoete in the mesh corral exposures and the average pre- and post-trial weights and lengths of the five ammocoetes in each 12-in. round mixed population tank. Table 13 summarizes the water quality measurements in each tank over the trial period.
Table 12. Weights and lengths of ammocoetes in corral trials
Tank/ ammocoete ID Tank Subcontainer
Initial length (mm)
Initial wet weight
(g)
Final length (mm)
Final wet weight
(g)
T1-1 21.5-gal rectangle 3-in. corrals 77.5 0.57 76.0 0.54
T1-2 21.5-gal rectangle 3-in. corrals 102.0 1.36 103.0 1.32
T1-3 21.5-gal rectangle 3-in. corrals 102.0 1.57 105.0 1.44
T1-4 21.5-gal rectangle 3-in. corrals 87.5 1.02 83.0 0.59
T1-5 21.5-gal rectangle 3-in. corrals 91.5 1.13 92.0 1.03
T1-6 21.5-gal rectangle 3-in. corrals 79.0 0.60 81.0 0.54
T1-7 21.5-gal rectangle 3-in. corrals 76.5 0.60 74.5 0.56
T1-8 21.5-gal rectangle 3-in. corrals 80.0 0.60 83.0 0.54
T1-9 21.5-gal rectangle 3-in. corrals 86.5 0.95 85.0 0.81
T1-10 21.5-gal rectangle 3-in. corrals 86.0 1.07 85.0 0.91
T2-1 21.5-gal rectangle 4-in. corrals 85.0 0.94 83.0 0.68
T2-2 21.5-gal rectangle 4-in. corrals 87.5 0.97 85.0 0.82

Stratus Consulting (Revised 7/15/2013)
Page 31 SC12470
Table 12. Weights and lengths of ammocoetes in corral trials (cont.)
Tank/ ammocoete ID Tank Subcontainer
Initial length (mm)
Initial wet weight
(g)
Final length (mm)
Final wet weight
(g)
T2-3 21.5-gal rectangle 4-in. corrals 101.0 1.64 102.0 1.47
T2-4 21.5-gal rectangle 4-in. corrals 82.5 0.84 85.0 0.75
T2-5 21.5-gal rectangle 4-in. corrals 97.0 1.48 99.0 1.33
T2-6 21.5-gal rectangle 4-in. corrals 90.0 1.09 95.0 1.00
T2-7 21.5-gal rectangle 4-in. corrals 91.5 1.18 92.5 1.05
T2-8 21.5-gal rectangle 4-in. corrals 72.0 0.54 70.0 0.50
T2-9 21.5-gal rectangle 4-in. corrals 98.0 1.40 98.0 1.18
T2-10 21.5-gal rectangle 4-in. corrals 71.5 0.56 70.0 0.58
T3-1 21.5-gal rectangle 6-in. corrals 92.5 1.15 94.0 1.11
T3-2 21.5-gal rectangle 6-in. corrals 103.0 1.58 103.0 1.41
T3-3 21.5-gal rectangle 6-in. corrals 83.5 0.87 85.0 0.83
T3-4 21.5-gal rectangle 6-in. corrals 94.0 1.17 93.5 1.00
T3-5 21.5-gal rectangle 6-in. corrals 100.5 1.50 104.0 1.38
T4-6 21.5-gal rectangle 6-in. corrals 84.0 0.93 82.0 0.75
T4-7 21.5-gal rectangle 6-in. corrals 89.5 1.01 91.0 0.92
T4-8 21.5-gal rectangle 6-in. corrals 91.0 1.16 90.5 1.04
T4-9 21.5-gal rectangle 6-in. corrals 89.0 1.09 89.0 1.02
T4-10 21.5-gal rectangle 6-in. corrals 99.0 1.26 99.0 1.13
R1-1 12-in. round 3-in. corrals 64.0 0.42 63.5 0.40
R1-2 12-in. round 3-in. corrals 85.5 0.91 83.5 0.82
R1-3 12-in. round 3-in. corrals 88.0 0.83 82.0 0.76
R1-4 12-in. round 3-in. corrals 87.0 0.94 84.5 0.80
R1-5 12-in. round 3-in. corrals 85.0 0.90 84.0 0.75
R2-1 12-in. round 3-in. corrals 93.5 1.01 91.0 0.85
R2-2 12-in. round 3-in. corrals 77.0 0.79 75.0 0.57
R2-3 12-in. round 3-in. corrals 83.5 0.99 84.5 0.86
R2-4 12-in. round 3-in. corrals 95.5 0.97 93.0 0.79
R2-5 12-in. round 3-in. corrals 93.0 1.17 91.0 1.00
R3 12-in. round NA (mean of 5) 86.9 0.98 84.1 0.85
R4 12-in. round NA (mean of 5) 81.2 0.91 79.4 0.77
R5 12-in. round NA (mean of 5) 90.9 1.07 86.3 0.89

Stratus Consulting (Revised 7/15/2013)
Page 32 SC12470
Table 13. Water quality monitoring results from corral trials
Temperature (°C) pH DO (mg/L) EC (µS/cm)
Container n Mean Standard deviation Mean
Standard deviation Mean
Standard deviation Mean
Standard deviation
R1 8 13.5 0.32 6.66 0.08 8.9 0.34 288 4.50
R2 9 13.1 0.30 6.65 0.05 8.8 0.35 288 7.26
R3 6 13.3 0.33 6.64 0.08 8.9 0.27 290 4.27
R4 7 13 0.32 6.64 0.04 9.0 0.40 290 3.09
R5 5 13.1 0.24 6.68 0.06 9.0 0.14 288 2.30
T1 9 13.4 0.74 6.62 0.05 8.5 0.46 289 1.87
T2 8 13.1 0.32 6.63 0.03 8.6 0.49 290 2.53
T3 4 13.3 0.13 6.67 0.03 8.8 0.18 286 8.92
T4 4 13.1 0.56 6.63 0.03 8.9 0.30 289 1.63
Over the 30-day trial, all individuals but one (ammocoete T2-10) in the individual corrals lost weight. The pooled results from each of the round tanks without corrals suggested that these ammocoetes also lost weight (Figure 9). There was no significant difference in the weight lost between ammocoetes held in the corrals in the rectangular tanks and the corrals in the round tanks. The weight loss in the ammocoetes held in a mixed population in the round tanks was very similar to the weight loss in ammocoetes held in 3-in. corrals in the round tanks. However, no statistical comparison can be made because the initial and final weights of ammocoetes in the mixed population are based on the average weights of all the ammocoetes (i.e., we could not track individual ammocoetes in the mixed population).
3.4 Discussion
Although all ammocoetes in this trial lost weight, there were no significant differences among any of the different corral diameters. Also, no differences were seen between ammocoetes that were held in a corral and those that were allowed to roam free in the exposure tank. Therefore, in subsequent trials (Tasks 3 and 7), a 3-in. corral in a round tank was utilized because this configuration maximized the use of space in the laboratory while maintaining the ability to individually track each ammocoete’s growth.

Stratus Consulting (Revised 7/15/2013)
Page 33 SC12470
Figure 9. Mean change in wet weight in ammocoetes held in corrals of differing sizes (n = 10 for all the “corral” treatments and n = 1 for the “no corral” treatment). Error bars are one standard error of the mean.
4. Task 2c: Feeding Trial
4.1 Objective
The objective of this trial was to determine if ammocoete growth is affected by the type of water delivered to each exposure tank.
4.2 Methods
For this trial, we compared water type and feeding treatments for ammocoetes (Table 14). We evaluated the growth of ammocoetes over a 30-day period in OSU sediment with well water alone, well water plus the ammocoete diet described in Task 2a, and conditioned well water.2 In addition, we investigated a treatment of SRS sediment where ammocoetes were exposed to well water plus the ammocoete diet. 2. Well water was biologically conditioned in a 1,890-L (500-gal) outdoor flume containing a mixture of cobble/wood chips that was initially seeded with yeast to promote biological activity. Flows in the conditioning flume were minimal. Water was brought within 0.5°C of ambient FPGL temperature before being introduced to treatment tanks at a rate of approximately 120 mL/min.
Corral Diameter
3" 4" 6" 3" No corral
Ch
ang
e in
wet
wei
gh
t (%
)
-20
-15
-10
-5
0
Rectangular Tanks Round Tanks

Stratus Consulting (Revised 7/15/2013)
Page 34 SC12470
Table 14. Summary of feeding trial setup
Sediment Water type Feeding Notes
SRS Well Ammocoete diet
OSU Well None
OSU Well Ammocoete diet Results from Task 2b because treatment was duplicative
OSU Conditioned well None
Before being placed into exposure tanks, ammocoetes were removed from the holding tank and depurated for 24 hours. They were measured and weighed according to PLA SOP P.7 (Stratus Consulting, 2011d). Each treatment consisted of three 12-in. diameter round tanks with 5 ammocoetes in each, for a total of 15 ammocoetes per treatment. Water was delivered to each round tank at a rate of approximately 150 mL/min through nylon tubing at standpipe in the middle of each tank. Water quality testing was conducted daily on a subset of experimental tanks. After 30 days of exposure, ammocoetes were removed from the tanks, depurated for 24 hours, and re-weighed and measured.
4.3 Results
No mortality was observed in any of the treatments. Table 15 presents the average pre- and post-trial weights and lengths of the five ammocoetes in each 12-in. round mixed population tank. The pooled weights of ammocoetes in all treatments and replicates indicate that the ammocoetes in all treatments lost weight over the 30-day period (Figure 10). There were no significant differences in weight loss among any of the treatments. Water quality monitoring data for each tank are presented in Table 16.
4.4 Discussion
Conditioning the well water did not significantly affect the change in weight or survival in any of the treatments. Therefore, well water was used in subsequent trials.

Stratus Consulting (Revised 7/15/2013)
Page 35 SC12470
Table 15. Weights and lengths of ammocoetes in feeding trial
Initial length
(mm) Initial wet weight
(g) Final length
(mm) Final wet weight
(g)
Sediment Water type Feeding Tank MeanStandard deviation Mean
Standard deviation Mean
Standard deviation Mean
Standard deviation
SRS Well Ammocoete diet R13 86.2 5.6 0.91 0.26 83.4 6.6 0.77 0.27
R14 85.6 8.9 0.94 0.31 83.3 10.2 0.76 0.27
R15 86.8 16.6 1.13 0.58 84.6 16.9 0.91 0.50
OSU Well None R7 92.1 6.1 1.07 0.20 88.1 6.6 0.86 0.19
R8 90.3 9.8 1.09 0.35 89.8 9.6 0.91 0.30
R9 86.8 9.4 0.90 0.30 82.4 10.4 0.75 0.28
Well Ammocoete diet R3 86.9 11.7 0.98 0.38 84.1 11.6 0.85 0.31
R4 81.2 16.3 0.91 0.47 79.4 15.4 0.77 0.36
R5 90.9 7.7 1.07 0.31 86.3 8.3 0.89 0.28
Conditioned None R10 82.7 7.3 0.76 0.13 78.3 7.0 0.63 0.10
R11 84.3 10.8 0.91 0.35 80.2 10.2 0.74 0.29
R12 80.1 10.4 0.78 0.26 77.0 9.7 0.59 0.25

Stratus Consulting (Revised 7/15/2013)
Page 36 SC12470
Table 16. Water quality monitoring results from feeding trial
Temp. (°C) pH DO (mg/L) EC (µS/cm)
Sediment Water type Feeding Tank n MeanStandard deviation Mean
Standard deviation Mean
Standard deviation Mean
Standard deviation
SRS Well Ammocoete diet R13 11 13.1 0.34 6.64 0.08 9.1 0.25 291 4.66
R14 11 13.1 0.44 6.64 0.03 8.8 0.50 288 5.71
R15 10 13.1 0.31 6.65 0.09 8.8 0.36 289 6.65
OSU Well None R7 11 13.5 0.51 6.64 0.08 8.9 0.36 291 4.96
R8 11 13.1 0.32 6.63 0.05 8.8 0.47 288 5.55
R9 9 13.1 0.29 6.65 0.05 8.8 0.35 289 6.42
Well Ammocoete diet R3 6 13.3 0.33 6.64 0.08 8.9 0.27 290 4.27
R4 7 13.0 0.32 6.64 0.04 9.0 0.40 290 3.09
R5 5 13.1 0.24 6.68 0.06 9.0 0.14 288 2.30
Conditioned None R10 11 14.0 0.86 6.89 0.10 9.7 0.46 288 5.03
R11 11 13.7 0.81 6.97 0.16 9.6 0.70 286 4.73
R12 9 13.9 0.73 7.02 0.12 9.6 0.63 288 7.81

Stratus Consulting (Revised 7/15/2013)
Page 37 SC12470
Figure 10. Mean (n = 3) change in wet weight among ammocoetes held in different sediment types, with different water sources and different feeding regimes. Error bars are one standard error of the mean.
5. Task 3: Contaminated Sediment Exposure Pre-pilot Test and Task 4: Physiology Endpoints
5.1 Objective
Task 3 involved a pilot assay of a larger-scale sediment bioassay using two uncontaminated sediments and one contaminated sediment. Handling and exposure methods developed in Task 2 were applied to the assay. For Task 3, survival, growth, and behavior of ammocoetes were monitored as bioassay endpoints.
The objective of Task 4 was to expand on the survival, growth, and behavior endpoints included in Task 3 to evaluate the use of alternative measures of physiological fitness in the pilot bioassay.
Treatments
SRS OSU OSU OSU
Ch
ang
e in
we
t w
eig
ht
(%)
-25
-20
-15
-10
-5
0
well water well water well water conditioned
yes no yes no
Sediment:Water:Feeding?

Stratus Consulting (Revised 7/15/2013)
Page 38 SC12470
5.2 Methods
5.2.1 Sediments
Sediment used for this task included SRS, GAS, and OSU. Sediment was collected in 5-gal buckets in the field. To ensure each ammocoete and replicate tank received a representative sample of the total sediment collected in the field, sediment was incrementally loaded into each exposure corral (PLA SOP P.5; Stratus Consulting, 2011d). Eighteen 1-foot diameter tanks, containing five 3-in. diameter corrals, were filled with one of the three sediment types. Representative sediment subsamples were shipped overnight to CAS for physical and chemical analyses (PLA SOP P.11; Stratus Consulting, 2011d).
5.2.2 Experimental design
Water flowed over the sediment-loaded corrals for at least 24 hours before ammocoetes were added. After removal from the stock tank, ammocoetes were depurated for 24 hours, and lengths and weights of individual ammocoetes were measured (PLA SOP P.7; Stratus Consulting, 2011d). Ammocoetes were loaded in random order into each corral. Fifteen ammocoetes (three circular tanks with five corrals per tank) were exposed to each sediment type for 30 days and another 15 ammocoetes were exposed to each sediment type for 60 days. Ammocoetes were fed the ammocoete diet three times per week. Feed was delivered at the surface and was also injected approximately 2 in. into the sediment of each corral.
5.2.3 Ammocoete sampling and preservation
At the conclusion of the trial, ammocoetes were removed, rinsed of sediment using well water, weighed and measured (PLA SOP P.7; Stratus Consulting, 2011d), placed into individual depuration containers for 24 hours, and reweighed. Ammocoetes were then euthanized using an overdose of buffered MS-222 (PLA SOP P.3, Stratus Consulting, 2011d). In a subset of each treatment group, the third and fourth gill pouch was excised and placed in 100 µL of SEI [sucrose, ethylenediaminetetraacetic acid (EDTA), and imidazole] buffer and flash frozen in liquid nitrogen. These gill pouch samples were stored at -80C for later gill Na+/K+ ATPase (a class of enzymes that catalyze the decomposition of adenosine triphosphate) activity measurements. The remaining ammocoetes from each treatment were preserved either in 10% buffered formalin for histological analysis or stored at -20C for proximate analysis of dry weight and lipid and ash content.

Stratus Consulting (Revised 7/15/2013)
Page 39 SC12470
5.2.4 Dry weight and lipid and ash content
In order to compare lipid and ash content in fish reared in each treatment, we used a proximate analysis protocol developed by Reynolds and Kunz (2001). Ammocoetes were thawed and weighed in pre-weighed tins and dried to a constant weight at 60°C. Samples were then ground with a mortar and pestle and placed in pre-weighed thimbles for lipid extraction. Lipids were extracted with a Soxhlet apparatus using a 7:2 ratio by volume of hexane:isopropyl alcohol as a solvent. After the lean mass was obtained, all samples were placed back into aluminum tins and ashed in a muffle furnace for five hours at 525°C. Ash samples were weighed, and contents were retained for archival purposes.
5.2.5 Gill Na+/K+ ATPase activity
The third and fourth gill pouch from three ammocoetes out of each treatment were excised and immediately immersed in 100-µL SEI buffer (250 mM sucrose, 10 mM Na2-EDTA, and 50 mM imidazole) and flash frozen in liquid nitrogen, according to a protocol developed for larval and metamorphosizing sea lamprey (Petromyzon marinus) by Reis-Santos et al. (2008). Samples were stored at -80°C until the day they were assayed. Gill Na+/K+ ATPase activity was determined using a method from McCormick (1993). Samples were partially thawed and then sodium deoxycholate acid was added to make a 1X concentration of SEID (SEI + sodium deoxycholate acid). After homogenization for 15–20 seconds using a Kontes mortar and pestle, samples were centrifuged at 5,000 m/S2 (i.e., g-forces, or G) for 30 seconds, and the supernatant was retained. Two sets of three subsamples of the supernatant were added to a 96 well plate. Ouabain was added to one set (0.5 nmol at a 1:1 ratio) to inhibit gill Na+/K+ ATPase activity, thus making it possible to distinguish this activity from background non-specific ATPase activity. Absorbance was read at 340 nm at 25°C using a Spectra Max 190 absorbance plate reader; absorbance readings were recorded for 10 min. Gill Na+/K+ ATPase activity was calculated by subtracting the ouabain-inhibited slope from the uninhibited slope and dividing by the protein content of the homogenate, determined using the Bradford protein assay kit (Pierce Biochemical). Gill Na+/K+ ATPase activity measurements were expressed as µmol adenosine diphosphate (ADP)/mg protein/hour.
5.2.6 Histology
Histological analysis was performed to assess the general health of ammocoetes and to identify the presence and prevalence of tissue damage and/or parasites associated with exposure to sediment treatments. Samples were preserved in 10% buffered formalin until processed. Ammocoetes were cut in half longitudinally between the last gill pouch and the mid-gut. Tissues were embedded in paraffin for microtome sectioning and archival purposes. All slides were

Stratus Consulting (Revised 7/15/2013)
Page 40 SC12470
stained with hematoxylin and eosin before mounting. A veterinary pathologist assisted with the microscopy.
5.3 Results
5.3.1 Water quality
Overlying water quality in each of the 18 exposure tanks (3 tanks per treatment) remained consistent throughout the 30- and 60-day exposures (Table 17).
5.3.2 Survival and behavior
There were no mortalities during any of the test treatments over the course of the 30- and 60-day exposures. Ammocoetes placed on the contaminated GAS sediment remained on the surface of the sediment and took noticeably longer to burrow into the sediment than ammocoetes placed on the uncontaminated SRS or OSU sediment. This behavior was explored in more detail in Task 5 experiments (Section 6).
5.3.3 Growth
The average initial weight and length of all ammocoetes loaded into each corral was 1.0 0.3 g and 90 8 mm, respectively (n = 90; Figure 11). There were no significant differences among initial ammocoete weights or lengths in any treatment.
On average, ammocoetes in 30- and 60-day exposures to GAS and OSU sediment lost weight, while ammocoetes in the 30- and 60-day exposures to SRS sediment gained weight (Figure 12). Therefore, there was a significant (P < 0.01) difference in the change in live weight between the 30- and 60-day SRS treatments and all other treatments. There were no significant differences in weight loss among the GAS and OSU treatments, and there was no significant difference in weight gain between the SRS treatments.
Similar to changes in weight, on average, we observed a reduction in length in ammocoetes in 30- and 60-day exposures to GAS and OSU sediment, whereas ammocoetes in the 30- and 60-day exposures to SRS sediment grew (Figure 13). The change in length in ammocoetes in the SRS 30-day treatment was significantly (P < 0.01) greater than in ammocoetes exposed to OSU sediment for 30 days. The change in length in ammocoetes in the SRS 60-day treatment was significantly (P < 0.01) greater than in ammocoetes for all GAS and OSU treatments. There were no significant differences between any GAS and OSU treatments, and the difference between the 30- and 60-day SRS treatments was not significant.

Stratus Consulting (Revised 7/15/2013)
Page 41 SC12470
Table 17. Average water quality for each sediment type during the 30- and 60-day exposures in Task 3
Sediment
Exposure duration
(days)
Flow rate (mL/min)
Temp (°C) pH
DO (mg/L)
Average Standard deviation Average
Standard deviation Average
Standard deviation Average
Standard deviation
GAS 30 NA NA 13.5 0.03 6.74 0.01 8.7 0.02
GAS 60 209 25 13.5 0.15 6.73 0.02 8.7 0.07
OSU 30 NA NA 13.4 0.05 6.69 0.01 8.7 0.04
OSU 60 217 9 13.4 0.14 6.71 0.01 8.7 0.08
SRS 30 167 20 13.4 0.07 6.74 0.02 8.8 0.04
SRS 60 195 18 13.4 0.05 6.76 0.07 8.8 0.08
Table 17. Average water quality for each sediment type during the 30- and 60-day exposures in Task 3 (cont.)
Sediment
Exposure duration
(days)
EC (µS/cm)
Total ammonia (ppm)
Unionized ammonia (ppm)
Average Standard deviation Average
Standard deviation Average
Standard deviation
GAS 30 293 1.3 0.40 0.20 0.0006 0.0003
GAS 60 295 0.6 0.45 0.38 0.0006 0.0005
OSU 30 293 1.5 0.20 0.00 0.0002 0.0000
OSU 60 295 0.9 0.24 0.09 0.0003 0.0001
SRS 30 292 1.0 0.27 0.12 0.0003 0.0001
SRS 60 296 0.9 0.28 0.10 0.0004 0.0002

Stratus Consulting (Revised 7/15/2013)
Page 42 SC12470
Figure 11. Mean initial wet weight (a) and length (b) in all ammocoetes loaded into each corral (n = 90). Error bars are one standard error of the mean.
Treatment
GAS-30 GAS-60 OSU-30 OSU-60 SRS-30 SRS-60
Init
ial
len
gth
(m
m)
0
20
40
60
80
100
GAS-30 GAS-60 OSU-30 OSU-60 SRS-30 SRS-60
Init
ial
we
t w
eig
ht
(g)
0.0
0.2
0.4
0.6
0.8
1.0
1.2
1.4(a)
(b)

Stratus Consulting (Revised 7/15/2013)
Page 43 SC12470
Figure 12. Mean change in depurated wet weight for individual ammocoetes exposed to each sediment type for 30 days and 60 days (n = 15). Error bars are one standard error of the mean. Treatments that are significantly different (P < 0.01) from each other are indicated with different uppercase letters.
Figure 13. Mean change in length for individual ammocoetes exposed to each sediment type after 30- and 60-day exposures (n = 15). Error bars are one standard error of the mean. Treatments that are significantly different (P < 0.01) from each other are indicated with different letters.
Treatment
GAS-30 GAS-60 OSU-30 OSU-60 SRS-30 SRS-60
Ch
ang
e in
we
t w
eig
ht
(%)
-20
-15
-10
-5
0
5
10
15
A A A A
B
B
Treatment
GAS-30 GAS-60 OSU-30 OSU-60 SRS-30 SRS-60
Ch
ang
e i
n l
eng
th (
%)
-6
-4
-2
0
2
4
6
A,B A,B B A,B
A,C
C
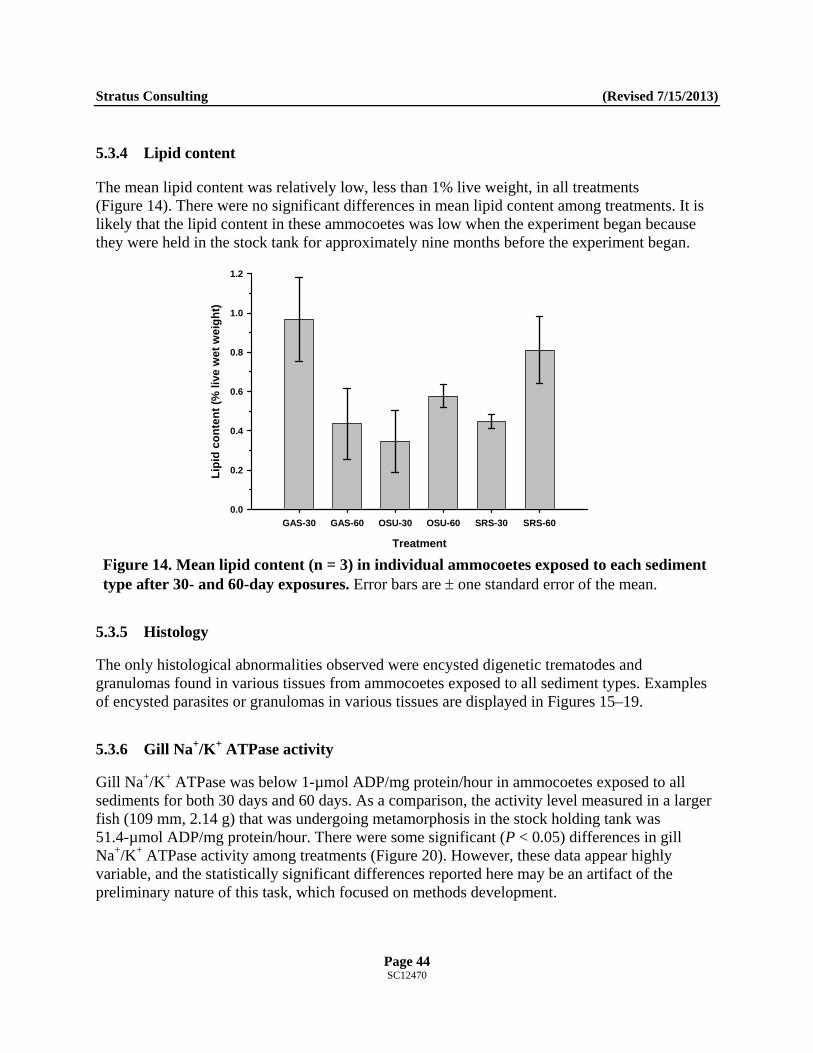
Stratus Consulting (Revised 7/15/2013)
Page 44 SC12470
5.3.4 Lipid content
The mean lipid content was relatively low, less than 1% live weight, in all treatments (Figure 14). There were no significant differences in mean lipid content among treatments. It is likely that the lipid content in these ammocoetes was low when the experiment began because they were held in the stock tank for approximately nine months before the experiment began.
Figure 14. Mean lipid content (n = 3) in individual ammocoetes exposed to each sediment type after 30- and 60-day exposures. Error bars are one standard error of the mean.
5.3.5 Histology
The only histological abnormalities observed were encysted digenetic trematodes and granulomas found in various tissues from ammocoetes exposed to all sediment types. Examples of encysted parasites or granulomas in various tissues are displayed in Figures 15–19.
5.3.6 Gill Na+/K+ ATPase activity
Gill Na+/K+ ATPase was below 1-µmol ADP/mg protein/hour in ammocoetes exposed to all sediments for both 30 days and 60 days. As a comparison, the activity level measured in a larger fish (109 mm, 2.14 g) that was undergoing metamorphosis in the stock holding tank was 51.4-µmol ADP/mg protein/hour. There were some significant (P < 0.05) differences in gill Na+/K+ ATPase activity among treatments (Figure 20). However, these data appear highly variable, and the statistically significant differences reported here may be an artifact of the preliminary nature of this task, which focused on methods development.
Treatment
GAS-30 GAS-60 OSU-30 OSU-60 SRS-30 SRS-60
Lip
id c
on
ten
t (%
liv
e w
et
we
igh
t)
0.0
0.2
0.4
0.6
0.8
1.0
1.2

Stratus C
Figure ammoc
onsulting
15. Encystecoete expose
ed digenean ed to GAS se
trematode ediment for
Page 45 SC12470
parasite (arr 60 days. Im
rrow) in themage taken a
(R
e gill lamellaat 200 magn
Revised 7/15/
a of an nification.
/2013)

Stratus C
Figure exposed
onsulting
16. Encysted to GAS se
ed digenean diment for
trematode 60 days. Im
Page 46 SC12470
parasite (armage taken at
rrow) in thet 200 magn
(R
e kidney of anification.
Revised 7/15/
an ammoco
/2013)
oete

Stratus C
Figure an amm
onsulting
17. Granulomocoete exp
oma (arrowosed to OSU
w; likely fromU sediment
Page 47 SC12470
m a degradefor 30 days
ed encysteds. Image take
(R
d parasite) inen at 200× m
Revised 7/15/
n the liver omagnification
/2013)
of n.

Stratus C
Figure exposed
onsulting
18. Encysted to OSU se
ed digenean diment for
trematode 60 days. Im
Page 48 SC12470
parasites (amage taken at
arrows) in tht 200× magn
(R
he heart of nification.
Revised 7/15/
an ammoco
/2013)
oete

Stratus C
Figure ammoc
onsulting
19. Encystecoete expose
ed digenean ed to SRS se
trematode ediment for
Page 49 SC12470
parasites (a60 days. Im
arrows) in thmage taken at
(R
he oropharyt 100× magn
Revised 7/15/
ynx of an nification.
/2013)

Stratus Consulting (Revised 7/15/2013)
Page 50 SC12470
Figure 20. Gill Na+/K+ ATPase activity in individual ammocoetes exposed to each sediment type after 30- and 60-day exposures (n = 3). Error bars are one standard error of the mean. Treatments that are significantly different (P < 0.05) from each other are indicated with different uppercase letters.
5.4 Discussion
The results from Tasks 3 and 4 demonstrate that conducting a long-term sediment bioassay with PLAs is possible in terms of being able to track individual ammocoetes (i.e., corrals) and that control survival was excellent (100%). However, growth appears to be highly variable, with many ammocoetes actually shrinking in size after 30- and 60-day exposures in both contaminated and uncontaminated sediments. Therefore, growth may not be a robust or sensitive endpoint for use in evaluating the effects of sediment contamination on ammocoetes. Analyses of other physiological endpoints, including lipid content and gill Na+/K+ ATPase activity and histology, are also possible and were included in pilot testing analysis (Task 7; Section 8).
Treatment
GAS-30 GAS-60 OSU-30 OSU-60 SRS-30 SRS-60Gil
l N
a+/K
+ A
TP
ase
acti
vity
(m
ol
AD
P/
g p
rote
in/h
)
0.0
0.2
0.4
0.6
0.8
1.0
A
B,CA,B,C
A,B
C
C

Stratus Consulting (Revised 7/15/2013)
Page 51 SC12470
6. Task 5: Behavioral Endpoints
6.1 Objective
The objective of Task 5 was to determine if ammocoetes actively avoid burrowing into contaminated sediments from the Harbor. If some form of avoidance is observed, the test results may be used to design more in-depth behavior experiments.
6.2 Methods
6.2.1 Multiple sediment trough exposures – preference and burrowing time tests
Sediment preference and burrowing time were observed to determine the effects of contaminated sediments on behavior. In the preliminary test, removable partitions were used to create discrete adjacent sediment blocks (30.5 cm wide × 45.7 cm long) in a trough tank with clean water flowing over the sediment. The three sediments used in this preference trial, from upstream to downstream, were OSU, SRS, and GAS (Figure 21). Partitions were used to keep the sediments separated while loading. After loading, the partitions were removed and clean water flowed over the sediment for two days. Twenty-three ammocoetes were introduced, one at a time (randomly over the sediment surface), and the trough was covered with black mesh to diffuse overhead lighting. Partitions were reinserted after seven days, and the number of ammocoetes in each sediment type was recorded.
A second round of four sediment preference trials was conducted using a similar design. However, for this trial, only 2 sediments were tested at one time and 15 ammocoetes were exposed in each paired sediment tank for 5 days before the partition was reinserted. The four paired sediment trials, from upstream to downstream were (1) GA2 and RE1, (2) RE3 and SWI, (3) SRS and GA2, and (4) SRS and RE2. In addition to counting the ammocoetes in each sediment type, the time to initiate burrowing was also recorded for each ammocoete during the third of these trials (SRS and GA2).
6.2.2 Single sediment exposures – burrowing time tests
The goal of these tests was to determine if burrowing time was different in four sediment types (RE2, AR2, GA2, and SWI).

Stratus Consulting (Revised 7/15/2013)
Page 52 SC12470
(a)
(b)
Figure 21. Sediment preference experiment using OSU, SRS, and GAS sediments. Arrow indicates direction of water flow across all three sediment types (a). Close-up of the interface (dashed line) between OSU and SRS sediments (b).
GASOSU SRS GASOSU SRS
OSU SRSOSU SRS

Stratus Consulting (Revised 7/15/2013)
Page 53 SC12470
In the first series of burrowing time tests, one ammocoete was added to each of five 474-mL containers per sediment type (sediments RE2, AR2, GA2, and SWI; 20 total containers). The five containers for each sediment type were then submerged into a 30.5-cm diameter circular tank at a depth of 10.2 cm (Figure 22; four total tanks). Each container held 6.4 cm of sediment and had 0.3-cm holes drilled above the sediment on either side of the container above the sediment to allow water to flow through. To provide water exchange, water was introduced to the circular tanks at a rate of 200 mL/min. After being held for 30 seconds in a small container over the sediment to allow them to orient head down, a single ammocoete was added to each container. When an ammocoete was released, observers recorded the time duration to initiate burrowing and the total time until the animal was completely buried. Observations were made until the animal was completely buried or 120 min after the release. The experiments were video recorded to confirm the observed times.
Figure 22. Sediment burrowing time experiment, with individual ammocoetes in each exposure container.
In the second series of burrowing time tests, three sediment types (RE2, GA2, and SWI) were tested in a slightly different exposure setup. The same small containers were used; however, in this series, they were placed into three 57-L rectangular aquariums filled with clean water, and each had a plastic lid to prevent the ammocoetes from escaping the individual containers. One sediment type was held in four or five small containers per aquaria. Four trials were conducted sequentially over the course of 1 week for a total sample size of 17 per sediment type. To

Stratus Consulting (Revised 7/15/2013)
Page 54 SC12470
account for any differences among the aquaria, the type of sediment assigned to each aquarium was alternated in each trial. Unlike the first series of burrowing trials, this series did not utilize flow-through water exchange. Rather, the containers were placed into the aquaria, and allowed to settle overnight. A 50% water exchange was performed just before tests began to siphon out any sediment that settled outside of the containers. A single ammocoete was added to each container using a funnel apparatus with a filter cloth plug at the end that was removed after 1 min of settling time, allowing the ammocoete to enter the container and access the sediment. Observations were made in an equivalent manner as in the first series, and the experiments were also video recorded.
Statistical comparisons of the burrowing times in each sediment type between series one and two were conducted using a Kruskal-Wallis rank sum test (α = 0.05; Minitab® version 16.2.2). Comparisons of pooled series of one and two burrowing data for each contaminated sediment type against the reference was conducted using a one-tailed multiple comparison test after a Kruskal-Wallis test using R version 2.15.3 with the “pgirmess” package (version 1.5.7) and “kruskalmc” function (http://perso.orange.fr/giraudoux).
6.3 Results
6.3.1 Multiple sediment trough exposures – preference and burrowing time tests
After 7 days of exposure to OSU, SRS, and GAS, 4 ammocoetes were found in OSU, 15 in SRS, and 4 in GAS sediment.
Of the four dual-sediment preference trials, three trials were conducted with uncontaminated versus contaminated sediment and one was conducted with two uncontaminated sediments. After 5 days of exposure in each of the 3 uncontaminated versus contaminated trials (Trials 1, 2, and 3), the number of ammocoetes found in the uncontaminated sediments was higher than in the contaminated sediments. After 5 days in the exposure trough, the number of ammocoetes in either sediment in the uncontaminated versus uncontaminated trial was nearly even (Table 18; Figure 23). The sediment grain size distribution in the two uncontaminated sediments used in Trial 4 were not similar, suggesting that differences in grain size within this range did not affect sediment preference (Figure 23).
The time to complete burrowing was also recorded during the third trial (SRS versus GA2). On average, ammocoetes completed burrowing significantly faster in the uncontaminated SRS sediment compared to the contaminated GA2 sediment (0.48 min and 1.02 min, respectively; p < 0.01, two-sample t-test).

Stratus Consulting (Revised 7/15/2013)
Page 55 SC12470
Table 18. Study design and results of multiple sediment preference experiments
Trial # Typea
Sediment type # Ammocoetes after 5 days
Upstream Downstream Upstream Downstream
1 C vs. U GA2 RE1 6 8
2 C vs. U RE3 SWI 9 6
3b C vs. U SRS GA2 11 4
4 U vs. U SRS RE2 7 8
a. C vs. U: Contaminated versus uncontaminated. U vs. U: Uncontaminated versus uncontaminated. b. Burrowing time trial conducted.
Figure 23. Ammocoete sediment preference in paired sediment trials. For each pair, the upstream sediment is shown on the left and the downstream sediment is shown on the right. Pie charts represent sediment grain size distribution for the two uncontaminated sediments paired in Trial 4 (SRS vs. RE2).
Sediment
GA2 vs RE1 RE3 vs SWI SRS vs GA2 SRS vs RE20
20
40
60
80 ContaminatedUncontaminated
>0.50.125 - 0.5<0.125
Sediment Grain Size (mm)
RE2 (reference)
SRS (natal)

Stratus Consulting (Revised 7/15/2013)
Page 56 SC12470
6.3.2 Single sediment exposures – burrowing time tests
Although the exposure systems used in the first and second series of burrowing time tests were slightly different (see Section 6.2.2), three of the same sediments (RE2, GA2, and SWI) were used in each set of test series and there were no significant differences in time to initiate burrowing (Figure 24a) or time to complete burrowing (Figure 24b) among the two exposure series for each sediment type (Kruskal-Wallis test, α = 0.05). Therefore, the results of the two exposure series for each sediment type were pooled for further analysis.
Sediment grain size distributions varied among sediments and are displayed in Figure 25. The mean times to initiate burrowing for any of the contaminated sediments were not significantly different than the reference sediment (Table 19, Figure 26). The time to complete burrowing was significantly longer in the GA2 and AR2 contaminated sediments than in the reference sediment. Finally, although the mean time to complete burrowing was much longer in the SWI contaminated sediment than in the reference, this difference was not statistically significant (Table 19, Figures 25 and 26; statistical comparisons conducted using a multiple comparison test after a Kruskal-Wallis rank sum test, α = 0.05).
Two ammocoetes exposed to SWI sediment in the second series failed to completely burrow after 120 min (maximum test observation duration). Therefore, the time to complete burrowing was categorized as 120 min for these 2 ammocoetes for all subsequent analyses.
In the second series of tests, all ammocoetes were left in their containers for 24 hours following the 120-min burrowing observation period. After 24 hours, the observers made several additional observations. The observers noted that 1 of the 2 SWI ammocoetes that did not burrow within 120 min was now completely buried and the other was dead. Additionally, observers noted that several ammocoetes had re-emerged from the sediment: Out of 14 total exposure chambers that were quantified for burrowing behavior for each of the 3 sediments, 8 ammocoetes exposed to GA2 sediment and one ammocoete exposed to RE2 sediment had re-emerged. The overwhelming re-emergence of ammocoetes in the GA2 sediment (57%) compared to the RE2 sediment (7%) and the SWI sediment (0%), suggests a possible aversion to the particular types of contaminants in the GA2 sediment. GA2 contains much higher concentrations of petroleum hydrocarbons and PAHs than SWI, and SWI contains higher concentrations of butyltins and PCBs than GA2 (e.g., Table 3).

Stratus Consulting (Revised 7/15/2013)
Page 57 SC12470
Figure 24. Time to initiate burrowing (a) and time to complete burrowing (b) in one uncontaminated (RE2) and three contaminated (GA2, AR2, and SWI) sediments. The differences in the exposure scenarios for test series 1 (shaded circles) and 2 (open circles) are described in Section 6.2.2. AR2 was not included in test series 2 (ND = no data).
RE2 (reference) GA2 AR2 SWI
Tim
e t
o i
nit
iate
bu
rro
win
g (
min
)
0
2
4
6
8
10
12
14
16
Test series 1Test series 2
(a)
(b)
RE2 (reference) GA2 AR2 SWI
Tim
e t
o c
om
ple
te b
urr
ow
ing
(m
in)
0
10
20
30
40
50
120
ND
ND
2 ammocoetes did notcomplete burrowingin 120 min

Stratus Consulting (Revised 7/15/2013)
Page 58 SC12470
Figure 25. Ammocoete mean burrowing times in uncontaminated (RE2) and contaminated (GA2, AR2, and SWI) sediments. Sample size was 19 for all sediments except AR2 (n = 5). Error bars are one standard error of the mean. Asterisks indicate significant differences from the reference sediment (RE2; multiple comparison test after a Kruskal-Wallis rank sum test, α = 0.05). Two ammocoetes never completely burrowed in 120 min in SWI. Pie charts represent sediment grain size distributions for each sediment type. Grain size distribution for the SRS natal sediment is presented for reference.
Mean Time to Complete Burrowing (min)
0 7 14 21 28
RE2
GA2
AR2
SWI
*
>0.50.125 - 0.5<0.125
Sediment Grain Size (mm)
SRS (natal)
SWI
AR2
RE2 (reference)
GA2*

Stratus Consulting (Revised 7/15/2013)
Page 59 SC12470
Table 19. Mean time for ammocoetes to initiate and complete burrowing into different sediments in burrowing test series 1 and 2 and corresponding ammocoete lengths
Sediment Burrowing
series
Time to initiate burrowing
Time to complete burrowing
Ammocoete length
n
(min) Standard deviation
(min)
Standard deviation
(min)
Standard deviation
RE2 1 0.7 1.4 2.0 0.9 91.8 10.5 5
2 1.5 1.6 1.1 0.8 82.8 13.4 14
1/2 combo 1.3 1.6 1.3 0.9 84.8 13.1 19
AR2 1 0.3 0.3 8.4 11.9 85.8 14.1 5
2 NDa ND ND ND ND ND ND
1/2 combo 0.3 0.3 8.4 11.9 85.8 14.1 5
GA2 1 2.3 1.7 8.4 5.7 86.2 19.6 5
2 3.0 4.4 4.3 4.8 82.0 12.5 14
1/2 combo 2.8 3.8 5.4 5.2 83.1 14.2 19
SWI 1 1.3 1.9 49.2 64.6 85.4 22.2 5
2 1.2 1.7 6.6 13.6 81.9 10.8 14
1/2 combo 1.2 1.7 17.8 37.9 82.8 14.0 19
a. No data collected, test not conducted.

Stratus Consulting (Revised 7/15/2013)
Page 60 SC12470
Figure 26. Mean time to initiate burrowing and complete burrowing in RE2 (uncontaminated), GA2, AR2, and SWI (contaminated) sediments used in test series 1 and 2 (see Section 6.2.2). Sample size was 19 for all sediments except AR2 (n = 5).
6.4 Discussion
Results of these preliminary experiments suggest that the presence of contaminants affects ammocoete behavior in terms of sediment preference, speed of burrowing, and aversion to contaminated sediments. Ammocoetes appear to prefer uncontaminated sediment and burrow into uncontaminated sediment faster than they burrow into contaminated sediment.
Sediment
RE2 GA2 AR2 SWI0
5
10
15
20Mean time to initiate burrowingMean time to complete burrowing

Stratus Consulting (Revised 7/15/2013)
Page 61 SC12470
7. Task 6: Induction of Metamorphosis
7.1 Objective
The objective of this task was to determine if metamorphosis can be induced in PLAs in the laboratory. The results of this trial will help determine the feasibility of conducting future experiments that focus on the effects of contaminant exposure during lamprey metamorphosis, which may be a more sensitive life stage for these organisms.
7.2 Methods
This trial was conducted based on protocols developed by Manzon et al. (1998). These authors demonstrated that potassium perchlorate (KClO4) can induce metamorphosis in larval sea lamprey (Petromyzon marinus). Twenty-four large ammocoetes (> 90 mm) were held in four rectangular 5-gal tanks (6 ammocoetes/tank). Each tank was aerated and water was exchanged weekly during the 60-day trial. Two of the four tanks were treated with 0.05% KClO4 with each weekly exchange, and the other two tanks received fresh water only. All tanks were fed a 3% wet-body-weight ration once a week. All animals were weighed and measured (PLA SOP P.7; Stratus Consulting, 2011d), and photographed before and after the 60-day trial. After 60 days, the stage of metamorphosis was assessed visually and gill pouches were removed from each fish to measure gill Na+/K+ ATPase activity (see Section 5.2.5 for methods).
7.3 Results
The average initial weight of ammocoetes in the control and KClO4-treated tanks was 1.63 0.71 g and 1.69 g 0.62 g, respectively. The average initial length of ammocoetes in the control and KClO4-treated tanks was 105 13 mm and 106 11 mm, respectively. There were no significant differences in initial weights or lengths of ammocoetes between the two treatments. There was no visible evidence that any of the ammocoetes in either treatment group were undergoing metamorphosis before or after the 60-day trial. Furthermore, the mean gill Na+/K+ ATPase activity in the control and treatment groups, 0.86 1.31 and 0.60 0.46 µmol ADP/mg protein/hour, respectively, was very low compared to the gill Na+/K+ ATPase activity measured in a larger fish (109 mm, 2.14 g) that was undergoing metamorphosis in the stock holding tank (51.4 µmol ADP/mg protein/hour). There were no significant differences in gill Na+/K+ ATPase activity among fish from the two treatment groups in this trial.

Stratus Consulting (Revised 7/15/2013)
Page 62 SC12470
7.4 Discussion
Although this technique has been used to induce metamorphosis in other lamprey species (e.g., Manzon et al., 1998), it was not successful in this preliminary trial. However, more work is necessary to determine if this technique did not work with Pacific lamprey because the sample size used during this preliminary trial was relatively small and the body condition of these ammocoetes may not have been high enough to begin metamorphosis.
8. Task 7: Contaminated Sediment Exposure Pilot Test
8.1 Objective
The objective of this task was to perform a pilot sediment bioassay to evaluate the toxicity of contaminated sediment from 10 sites in the Harbor to PLAs.
8.2 Methods
8.2.1 Sediments
Nine contaminated sediments collected from the Harbor, two reference sediments collected upstream from the Harbor, and one laboratory control sediment (clean masonry sand) were used to conduct a 45-day sediment bioassay with ammocoetes. The sediment sampling protocol and sampling locations for each sediment type are described in Stratus Consulting (2011b, 2011c).
8.2.2 Experimental design
Each sediment type was loaded into four 7.6-cm diameter lamprey corrals (see Task 3 description in Section 5) in each of three 20.5-cm diameter circular tanks (Figure 27) according to PLA SOP P.5 (Stratus Consulting, 2011d), for a total of 12 lamprey corrals per sediment type. Representative sediment samples were also collected from each sediment type during the loading process according to PLA SOP P.5 (Stratus Consulting, 2011d). These samples were shipped overnight on ice to CAS for subsequent chemical and physical analyses (PLA SOP P.11; Stratus Consulting, 2011d) and archiving.

Stratus Consulting (Revised 7/15/2013)
Page 63 SC12470
Figure 27. Individual lamprey corrals in larger circular exposure tanks.
Sediment was loaded into corrals on four consecutive days as follows: 10/25/2010 – MSC, SC1, AR1; 10/26/2010 – RE1, OST, GA2; 10/27/2010 – ARM, SWI, AR2; and 10/28/2010 – RE3, GAA, MAR. Water flowed through each tank for 24 hours prior to adding ammocoetes to any of the corrals. One ammocoete was placed at random into each corral (PLA SOP P.9; Stratus Consulting, 2011d) 24 hours after loading sediment into the corral. Ammocoetes were depurated for at least 24 hours, then were anesthetized (PLA SOP P.3; Stratus Consulting, 2011d), weighed, and measured (PLA SOP P.7; Stratus Consulting, 2011d), and randomly loaded into each corral (PLA SOP P.9; Stratus Consulting, 2011d).
8.2.3 Experimental monitoring and sampling
During the 45-day experiment, basic water quality parameters (temperature, pH, DO, EC) and flow rates were monitored in each tank on a rotating schedule so that no tank went more than 3 days without basic water quality measurements and no more than approximately 9 days without flow rate measurements. All corrals were monitored daily and at the end of the 45-day experiment for dead and moribund ammocoetes (PLA SOP P.10; Stratus Consulting, 2011d). At the end of the experiment, live ammocoetes were rinsed to remove sediment, depurated for

Stratus Consulting (Revised 7/15/2013)
Page 64 SC12470
24 hours in individual containers containing cotton gauze, weighed and measured (PLA SOP P.7; Stratus Consulting, 2011d), and euthanized (PLA SOP P.3; Stratus Consulting, 2011d). The third gill pouch was excised from half of the ammocoetes removed from each sediment type (six) and immersed in 100 µL of ice-cold SEI buffer before flash freezing in liquid nitrogen. Samples were stored at -80°C for future NA+/K+ ATPase activity measurement. The bodies of three of these ammocoetes were preserved in 10% buffered formalin for histology. A section was removed from the abdomen from the remaining three ammocoetes and preserved in RNAlater® for potential future analysis of detoxification enzymes. The remaining ammocoetes (five–six) were stored at -20C for dry weight and ash and lipid analyses.
8.3 Results
8.3.1 Water quality
Overlying water quality in each of the 36 exposure tanks (3 tanks per sediment type) remained consistent throughout the 45-day exposure (Table 20). The average (n = 27) total ammonia and unionized ammonia concentrations in all treatments were 0.18 0.06 and 0.0002 0.0001 mg/L, respectively.
8.3.2 Growth
The average initial weight and length of all ammocoetes loaded into each corral were 1.4 0.7 g and 93 17 mm, respectively (n = 144; Figure 28). There were no significant differences in initial ammocoete weight or length among any of the sediment types.
On average, ammocoetes in all treatments lost weight during the 45-day exposure (Figure 29, Table 21). Ammocoetes held in MSC lost the most weight (18.7% based on wet weight), which was expected because this treatment was a starvation control to determine maximum weight loss for ammocoetes held in sediment with no organic carbon and without feed. The MSC treatment lost significantly (P < 0.05) more weight than the AR2 treatment. There were no other significant differences in change in weight among any treatments.
Ammocoetes in most of the sediment types did not increase in length, and many of the ammocoetes shrunk slightly (Figure 30, Table 21). There were no significant differences in change in length in ammocoetes among any sediment types.

Stratus Consulting (Revised 7/15/2013)
Page 65 SC12470
Table 20. Average water quality for each sediment type during the 45-day exposure
Sediment
Flow rate (mL/min)
Temperature (°C)
pH
DO (mg/L)
EC (µS/cm)
Average Standard deviation Average
Standard deviation Average
Standard deviation Average
Standard deviation Average
Standard deviation
MSC 198 22 12.0 0.06 6.66 0.02 8.2 0.09 293 0.3
RE1 219 15 11.9 0.07 6.68 0.00 8.2 0.05 293 1.3
RE3 212 12 11.9 0.04 6.71 0.04 8.0 0.03 294 1.1
AR1 203 13 12.0 0.02 6.68 0.02 8.1 0.21 293 1.2
AR2 200 9 11.9 0.08 6.69 0.02 8.2 0.03 293 1.4
ARM 203 2 11.9 0.08 6.69 0.02 8.1 0.03 293 2.1
GA2 207 13 11.9 0.04 6.70 0.01 8.1 0.04 292 0.6
GAA 214 5 11.9 0.05 6.70 0.03 8.0 0.05 293 1.4
MAR 195 15 11.9 0.04 6.68 0.03 8.0 0.02 293 1.4
OST 198 12 12.0 0.03 6.67 0.04 8.1 0.05 293 0.7
SC1 198 9 11.9 0.03 6.64 0.03 8.2 0.03 293 1.5
SW1 193 17 11.9 0.05 6.68 0.03 8.1 0.07 294 1.2

Stratus Consulting (Revised 7/15/2013)
Page 66 SC12470
Figure 28. Mean initial wet weight (a) and length (b) in all ammocoetes loaded into each corral (n = 144). Error bars are one standard error of the mean. There were no significant differences in weight or length among ammocoetes loaded into corrals containing each sediment type.
Sediment type
MSC RE1 RE3 AR1 AR2 ARM GA2 GAA MAR OST SC1 SW1
Init
ial
len
gth
(m
m)
0
10
20
30
40
50
60
70
80
90
100
110
MSC RE1 RE3 AR1 AR2 ARM GA2 GAA MAR OST SC1 SW1
Init
ial
wet
wei
gh
t (g
)
0.0
0.5
1.0
1.5
2.0(a)
(b)

Stratus Consulting (Revised 7/15/2013)
Page 67 SC12470
Figure 29. Mean change in depurated wet weight for individual ammocoetes exposed to each sediment type after a 45-day exposure (n = 12 in all treatments, except for sediments RE1 and SW1 where n = 11). Error bars are one standard error of the mean. Sediment types with significantly different (P < 0.05) changes in mean ammocoete weight are indicated with an asterisk.
Sediment type
MSC RE1 RE3 AR1 AR2 ARM GA2 GAA MAR OST SC1 SW1
Ch
ang
e i
n w
et w
eig
ht
(%)
-25
-20
-15
-10
-5
0
5
10
* *

Stratus Consulting (Revised 7/15/2013)
Page 68 SC12470
Table 21. Initial and final wet weight and length measurements of ammocoetes (n = 12 for each sediment type for all analyses, except final measurements for RE1 and SW1 where n = 11). All ammocoetes were depurated for 24 hours prior to weighing.
Sediment
Initial wet weight (g) Final wet weight (g) Initial length (mm) Final length (mm)
Average Standard deviation Average
Standard deviation Average
Standard deviation Average
Standard deviation
MSC 0.93 0.31 0.77 0.28 80.8 10.7 78.7 9.8
RE1 1.27 0.68 1.18 0.66 91.5 18.0 91.3 19.8
RE3 1.64 0.83 1.50 0.82 97.3 21.0 97.8 21.7
AR1 1.54 0.74 1.38 0.70 97.4 18.0 96.4 18.4
AR2 1.60 0.50 1.49 0.51 100.8 11.0 101.2 12.4
ARM 1.26 0.60 1.13 0.60 91.6 16.8 90.1 16.4
GA2 1.24 0.91 1.11 0.91 87.3 22.0 85.5 23.4
GAA 1.30 0.67 1.19 0.66 92.1 17.8 91.9 19.3
MAR 1.51 0.67 1.38 0.67 96.8 15.8 96.5 17.1
OST 1.33 0.60 1.18 0.57 93.0 14.8 92.0 15.4
SC1 1.15 0.58 1.04 0.56 87.5 16.6 86.4 16.8
SW1 1.50 0.76 1.41 0.78 96.2 18.4 100.5 26.9
8.3.3 Lipid content
Lipid content in individual ammocoetes at the end of the 45-day exposure was highly variable and ranged from 0.13% 0.22 (MSC) to 5.1% 3.8 (RE3) based on live weight. There were no significant differences in lipid content among ammocoetes in different sediment types (Figure 31).
8.3.4 Histology
Histological abnormalities were consistent with the observations from ammocoetes examined in Task 3 (Section 5). The only histological abnormalities documented were encysted digenetic trematodes and granulomas likely caused by degraded encysted parasites found in ammocoetes from all sediment types. Counts of parasites and granulomas per slide did not indicate that any sediment type affected the prevalence or severity of infection (Figure 32).

Stratus Consulting (Revised 7/15/2013)
Page 69 SC12470
Figure 30. Mean change in length for individual ammocoetes exposed to each sediment type after a 45-day exposure (n = 12 in all treatments, except RE1 and SW1 where n = 11). Error bars are one standard error of the mean.
Figure 31. Mean lipid content (n = 6 in all treatments, except RE1, RE3, GAA, and SWI where n = 5) in individual ammocoetes exposed to each sediment type after a 45-day exposure. Error bars are one standard error of the mean.
Sediment type
MSC RE1 RE3 AR1 AR2 ARM GA2 GAA MAR OST SC1 SW1
Ch
ang
e in
len
gth
(%
)
-4
-3
-2
-1
0
1
2
Sediment type
MSC RE1 RE3 AR1 AR2 ARM GA2 GAA MAR OST SC1 SW1
Lip
id c
on
ten
t (%
liv
e w
et w
eig
ht)
0
2
4
6
8

Stratus Consulting (Revised 7/15/2013)
Page 70 SC12470
Figure 32. Counts of encysted parasites and granulomas on histology slides prepared from individual ammocoetes exposed to each sediment type after a 45-day exposure (n = 3). Tissues analyzed include gill (a), muscle (b), heart (c), liver (d), and kidney (e). A sum of encysted parasites and granulomas observed on all tissues for each individual fish is also presented (f). Error bars are one standard error of the mean.
MSC RE1 RE3 AR1 AR2 ARM GA2 GAA MAR OST SC1 SW1
Gil
l par
asit
e/g
ran
ulo
ma/
slid
e
0.0
0.5
1.0
1.5
2.0
2.5
3.0
MSC RE1 RE3 AR1 AR2 ARM GA2 GAA MAR OST SC1 SW1
Mu
scle
par
asit
e/g
ran
ulo
ma/
slid
e
0
2
4
6
8
Sediment type
MSC RE1 RE3 AR1 AR2 ARM GA2 GAA MAR OST SC1 SW1
Hea
rt p
aras
ite/
gra
nu
lom
a/sl
ide
0.0
0.2
0.4
0.6
0.8
1.0
MSC RE1 RE3 AR1 AR2 ARM GA2 GAA MAR OST SC1 SW1
Liv
er p
aras
ite/
gra
nu
lom
a/sl
ide
0.0
0.2
0.4
0.6
0.8
1.0
1.2
1.4
MSC RE1 RE3 AR1 AR2 ARM GA2 GAA MAR OST SC1 SW1
Kid
ney
par
asit
e/g
ran
ulo
ma/
slid
e
0.0
0.2
0.4
0.6
0.8
1.0
1.2
1.4
Sediment type
MSC RE1 RE3 AR1 AR2 ARM GA2 GAA MAR OST SC1 SW1
To
tal
par
asit
e/g
ran
ulo
ma/
fish
0
2
4
6
8
10
(a)
(b)
(c)
(d)
(e)
(f)

Stratus Consulting (Revised 7/15/2013)
Page 71 SC12470
8.3.5 Gill Na+/K+ ATPase activity
The larger ammocoetes utilized in this task compared to Task 3 resulted in a large size range among ammocoete gill pouch samples. Therefore, some samples fell outside the protein standard curve and/or the activity slopes became non-linear as a result of excess protein. Samples with protein concentrations that fell outside the standard curve were not included in this analysis. Of the samples that did fall within the standard curve, gill Na+/K+ ATPase activity was below 2 µmol ADP/mg protein/hour in ammocoetes exposed to all sediments, except for one ammocoete from AR2 and GAA, which had activity levels at 5.6 and 12.8 µmol ADP/mg protein/hour, respectively. However, these levels were still much lower than the gill Na+/K+ ATPase activity level measured in a larger fish (109 mm, 2.14 g) that was undergoing metamorphosis in the stock holding tank (51.4 µmol ADP/mg protein/hour). There were no significant differences in mean gill Na+/K+ ATPase activity in ammocoetes exposed to any sediment types (Figure 33).
Figure 33. Gill Na+/K+ ATPase activity in individual ammocoetes exposed to each sediment type after a 45-day exposure (n = 5 for sediments AR1, GAA, and SWI; n = 4 for sediments RE1, RE3, AR2, ARM, MAR, OST, and SC1; and n = 3 for sediments MSC and GA2). Error bars are one standard error of the mean.
Sediment type
MSC RE1 RE3 AR1 AR2 ARM GA2 GAA MAR OST SC1 SW1Gil
l N
a+/K
+ A
TP
ase
ac
tivi
ty (m
ol
AD
P/
g p
rote
in/h
)
0
1
2
3
4
5
6

Stratus Consulting (Revised 7/15/2013)
Page 72 SC12470
8.4 Discussion
PLAs were not measurably adversely affected by any of the contaminated sediments collected from the Harbor compared to control and reference sediments in terms of survival, growth, lipid content, and histology in this 45-day exposure.
References Claire, C. 2002. Pacific Lamprey Larvae Life History, Habitat Utilization, and Distribution in the South Fork Clearwater River Drainage, Idaho. Technical Report 2000-2002. Bonneville Power Administration, Portland, OR. Available: http://pisces.bpa.gov/release/documents/documentviewer.aspx?pub = I00004039-3.pdf.
Integral Consulting, Windward Environmental LLC, Kennedy/Jenks Consultants, and Anchor QEA LLC. 2009. Portland Harbor RI/FS Remedial Investigation Report. Draft. Prepared for the Lower Willamette Group. October 27.
Manzon, R.G., J.G. Eales, and J.H. Youson. 1998. Blocking of KC1O4-induced metamorphosis in premetamorphic sea lampreys by exogenous thyroid hormones (TH): Effects of KC1O4 and TH on serum TH concentrations and intestinal thyroxine outer-ring deiodination. General and Comparative Endocrinology 112:54–62.
McCormick, S.D. 1993. Methods for non-lethal gill biopsy and measurement of Na+, K+ -ATPase activity. Canadian Journal of Fisheries and Aquatic Sciences 50:656–658.
Reis-Santos, P., S.D. McCormick, and J.M. Wilsom. 2008. Ionregulatory changes during metamorphosis and salinity exposure of juvenile sea lamprey (Petromyzon marinus L.). The Journal of Experimental Biology 211:978–988.
Reynolds, D.S. and T.H. Kunz. 2001. Standard methods for destructive body composition analysis. In Body Composition Analysis of Animals: A Handbook of Nondestructive Methods, Speakman, J.R. (ed.). Cambridge University Press, Cambridge. pp. 39–55.
Stratus Consulting. 2009. Portland Harbor Pacific Lamprey Ammocoete Study: Sediment Collection and Analysis Plan. Prepared for Stan Van de Wetering & Tom Downey, Siletz Indians; Mike Karnosh, Grand Ronde Community; Rob Neely, National Oceanic and Atmospheric Administration; and Jeremy Buck & Stephen Zylstra, U.S. Fish and Wildlife Service. Stratus Consulting Inc., Boulder, CO. November 4.

Stratus Consulting (Revised 7/15/2013)
Page 73 SC12470
Stratus Consulting. 2011a. Sampling Plan: Field Collection of Ammocoetes for Pacific Lamprey Toxicity Study. Prepared for the Portland Harbor Natural Resource Trustee Council. Stratus Consulting Inc., Boulder, CO. January 28.
Stratus Consulting. 2011b. Sampling Plan: Field Collection of Sediments for Pacific Lamprey Toxicity Study. Prepared for the Portland Harbor Natural Resource Trustee Council. Stratus Consulting Inc., Boulder, CO. January 28.
Stratus Consulting. 2011c. Sampling Report: Field Collection of Sediments for Pacific Lamprey Toxicity Study. Prepared by Stratus Consulting for the Portland Harbor Natural Resource Trustee Council. January 28.
Stratus Consulting. 2011d. Portland Harbor Pacific Lamprey Ammocoete Study: Laboratory Testing Plan. Prepared for the Portland Harbor Natural Resource Trustee Council. Stratus Consulting Inc., Boulder, CO. January 28.
Windward Environmental. 2008a. Portland Harbor RI/FS Round 3 Lamprey Ammocoete Phase 2 Toxicity Testing Data Report. Draft. Prepared for the Lower Willamette Group by Windward Environmental LLC. May 7.
Windward Environmental. 2008b. Portland Harbor RI/FS Round 3B Bioassay Testing Data Report. Draft. Prepared for the Lower Willamette Group by Windward Environmental LLC. April 21. Seattle, WA.
Windward Environmental and Integral Consulting. 2007. Portland Harbor RI/FS Round 2 Mussel and Lamprey Ammocoete Tissue Data Report. Draft. Prepared for The Lower Willamette Group. Windward Environmental LLC and Integral Consulting Inc. October 1.
Windward Environmental and Integral Consulting. 2008. Portland Harbor RI/FS Round 3 Pre-Breeding White Sturgeon (Acipenser transmontanus) Tissue Data Report. Draft. Prepared for the Lower Willamette Group. Windward Environmental LLC and Integral Consulting Inc. February 29.

STRATUS CONSULTING
1881 Ninth Street, Suite 201 Boulder, Colorado 80302 phone 303.381.8000 fax 303.381.8200 (headquarters)
1920 L Street, N.W., Suite 420 Washington, D.C. 20036 phone 202.466.3731 fax 202.466.3732
w w w . s t r a t u s c o n s u l t i n g . c o m