((p j p g ) project under satreps research program) ho...
TRANSCRIPT

Development of LCS Scenario in Iskandar Malaysia( project under SATREPS research program)( p j p g )
HO Chin Siong and Janice SimsonFeb 22 2011 JapanFeb 22 2011 Japan
Symposium on Towards Low carbon Society in Asia -Asia LCS Scenario and Actions-
How to achieve sustainable low carbon society?
JST JICA 2011 2015JST‐JICA 2011‐ 2015 Technical Cooperation Project
UTM, IRDA, PTHM and JPBD Malaysia Kyoto University, Okayama University and NIES Japan

PRESENTATION OUTLINE
1. BACKGROUND
– Challenges and Issues
– National Vision
2. CASE STUDY‐ ISKANDAR MALAYSIA
h l l– Comprehensive Development Plan 2025
– Modeling output
3. SATREPS PROJECT
– JICA –JST visitJICA JST visit
– Workshops

Background ‐MALAYSIA

R id b i i d
ISSUES AND CHALLENGESRapid urbanization and industrialization
Relatively high carbon intensity dependence on fossil fuel
High Private car ownership
Low density development and urban sprawl
Low efficiency appliances
4

1 MALAYSIA CHARTING DEVELOPMENT 1 MALAYSIA CHARTING DEVELOPMENT TOWARDS A HIGH INCOME NATIONTOWARDS A HIGH INCOME NATION
NATIONAL VISION 2010
• The 2011 Budget, with the aim to position Malaysia as a developed and high-income economy with
TOWARDS A HIGH INCOME NATIONTOWARDS A HIGH INCOME NATION
as a developed and high income economy with inclusive and sustainable development, will continue to ensure that the most conducive socio-economic environment is created through the G t T f ti P (GTP) tGovernment Transformation Programme (GTP) to underpin growth.
The 10The 10thth Malaysia PlanMalaysia Plan Building an environment thatBuilding an environment that enhances Qualityenhances Quality Building an environment that Building an environment that enhances Quality enhances Quality
of Lifeof Life New urbanism and New urbanism and compact citycompact city Growth concentrated in Growth concentrated in urban conurbationurban conurbation Safe city Safe city initiativesinitiativesyy Developing climate resilient growth Developing climate resilient growth policypolicy Adaptation measuresAdaptation measures Mitigation measuresMitigation measures Incentives for Incentives for RE and EERE and EE ImprovingImproving Solid waste managementSolid waste management
55
Improving Improving Solid waste managementSolid waste management Conserving forestConserving forest Reducing Reducing emission to improve air qualityemission to improve air quality

COP 15 – Malaysia’s targetCOP 15 Malaysia s target
• Prime Minster of Malaysia, Y.A.B Dato’ Sri Mohd Najib bin Tun Abdul Razak, in COP15 last year at Copenhagen, Denmark, y p g , ,proposed to reduce CO2emission intensity in Malaysia to 40 per cent by the yearto 40 per cent by the year 2020 compared with its 2005 levels, subject to assistance from developed countries.from developed countries.
COP15 on Dec 17, 2009 at Copenhagen, Denmark
6/9
Copenhagen, Denmark

CURRENT GREEN POLICIES IN MALAYSIA
National Green Technology Policy 2009‐ Energy, Building , Water and waste management and Transportation
Malaysia Budget 2010‐2011
‐ Developing Putrajaya and Cyberjaya as pioneer township inDeveloping Putrajaya and Cyberjaya as pioneer township in green technology
National policy on Climate Change
‐ Roadmap for Malaysia to achieve 40% reduction of GHG emission by 2020emission by 2020
Green Neighborhood Guidelines – JPBD 2010
S t l ti N i hb h d tt d d i G‐Smart location, Neighbourhood pattern and design, Green Infrastructure.
Green Township Framework –Guide Towards LC Cities 2010‐MIP
7

Case studyIskandar Development RegionIskandar Development Region
2,216 km2
Population 1,353,200Population 1,353,200
IskandarDevelopment
Region

Comprehensive Development Plan 2006Comprehensive Development Plan 2006‐‐20252025
DEVELOPMENT STRATEGIES:DEVELOPMENT STRATEGIES:
Balanced Development
Protect and Conserve Nature, Historic and Open Spaces
Focused Development at Areas with Existing & Adequate Infrastructure
Promote Infill & Redevelopment
Enhance Accessibility
Promote Key Economic Areas as Focal Point For Growth
Manage Regional Growth
Pl f I ti & S t i bl I f t t & UtilitiDownloadable at
Page 9
Plan for Innovative & Sustainable Infrastructure & Utilities
Promote Planned Communities which produce Quality and Sustainable Neighbourhoods
www.iskandarmalaysia.com.my

The Iskandar Malaysia VisionEconomic Growth
“To develop Iskandar Malaysia into a strong and sustainable metropolis of international standing”sustainable metropolis of international standing”
Year 2005 Projected (2025)
GDP (RM) 70 billion 325.5 billion325.5 billion
Year 2005 Projected (2025)
Per capita GDP (RM) 51,765 108,850108,850
Employment 0.610 million 1.428 million1.428 million
10
Population 1.4 million 3.1 million3.1 million

Socio Economic Scenario of IM2005 2025 2025/2005
Population 1,353,200 3,005,815 2.2
No. of households 317,762 751,454 2.4
GDP (mil RM) 37 641 176 224 4 7GDP (mil RM) 37,641 176,224 4.7
GDP per capita (RM/capita) 27,817 58,628 2.1
Gross output (mil RM) 121,431 474,129 3.9
Primary industry (mil RM) 1,860 5,375 2.9
Secondary industry (mil RM) 83 502 263 444 3 2Secondary industry (mil RM) 83,502 263,444 3.2
Tertiary industry (mil RM) 36,069 205,309 5.7
Floor space for commercial (mil m2) 6.8 19.3 2.8
Offices 1.3 1.7 2.9
Shops 5 7 16 3 2 9Shops 5.7 16.3 2.9
Hospitals & Schools 0.6 1.2 2.1
Passenger transport demand (mil p‐km) 3,816 8,677 2.311

Iskandar Malaysia: Geographical Area
SenaiSenai SkudaiSkudai
• Focused Development at 5 Flagships• 2,217 km2 or 550,000 acres• 3 times the size of Singapore• 1 4 million populationSenai Senai –– SkudaiSkudai
(Kulaijaya)(Kulaijaya)
Flagship
• 1.4 million population
Johor BahruJohor Bahru
Flagship
FlagshipFlagship
Eastern Gate Development Eastern Gate Development (Pasir Gudang (Pasir Gudang –– Tanjong Langsat)Tanjong Langsat)NusajayaNusajaya
Johor Bahru Johor Bahru City CentreCity Centre
Western Gate DevelopmentWestern Gate DevelopmentSingapore
Flagship
Western Gate Development Western Gate Development (Port Tanjung Pelepas)(Port Tanjung Pelepas)

Project Progress Update – Flagship A
Upgrading of Komtar(In progress)
Johor Johor BahruBahruCity CentreCity Centre
Artist Impression
Transformation of Johor Bahru City Centre (Planning) – Sg. Segget clean up
Johor Johor BahruBahruCity CentreCity Centre
Heritage Trail (Completed)
Johor Johor BahruBahruCity CentreCity Centre
Sultan Iskandar Complex Johor Johor BahruBahruCit C tCit C t (Completed) ‐ CIQCity CentreCity Centre
13

Project Progress Update – Flagship B
Kota Iskandar (Completed)NusajayaNusajaya Kota Iskandar (Completed)
Horizon Hills
Educity
SiLC
Kota Iskandar
Puteri Harbour
Medini
East LedangPuteri Harbour (In progress)NusajayaNusajaya
14Actual Picture

Project Progress Update – Flagship C
• Asia Petroleum HubWestern Gate Western Gate DevelopmentDevelopment
• Port Tanjung PelepasWestern Gate Western Gate DevelopmentDevelopment
March 2009
DevelopmentDevelopment
Source: PTP
•One of the fastest growing container ports in the world
•4 new berths will be added by end 2010 - increasing the port’s capacity by 3.2mn TEUs to 11.2mn TEUs.
15MMC Corp, PTP – expansion
• PTP is ranked 18th world busiest container seaport.

Project Progress Update – Flagship D
Eastern Gate Eastern Gate DevelopmentDevelopment
• Acerinox (Bahru Stainless Sdn Bhd)Construction in progress
Construction siteTanjung Langsat Area
The main component of the Tanjung Langsat development is the 4200 acre Tanjung Langsat Industrial Complex developed by Johor Corp It designed
Source: Johor Corp, IRDA 16
Tanjung Langsat Industrial Complex developed by Johor Corp. It designed for Light, Medium & Heavy Industries.

Project Progress Update – Flagship E
• Senai International Airport – Airside Development (completed)
SenaiSenai ‐‐ SkudaiSkudai
Runway extension 446m –100% Completed
• Senai Hi‐Tech ParkSenaiSenai ‐‐ SkudaiSkudai
Source: Senai Airport Terminal Services
• Kulai Cyber CitySenaiSenai ‐‐ SkudaiSkudai
h i l• Johor Premium OutletSenaiSenai ‐‐ SkudaiSkudai
17

LCS scenario study using ExSSE t b g d L b d ti it Labor participation ratioExport by goods
Government expenditure
Investment
Labor productivity Labor participation ratio
Demographic compositionTaxation and
social securityLabor demand Population
Wage IncomeImport ratio
Input coefficient matrix Consumption pattern
IO analysis
Output by industry
Household sizeFloor area per output
Energy service demand d i i f
Consumption
Number of household
Output of commercial
i d tPopulation
Output of manufacturing
i d t
Trip per person
Trip distance
Modal share
per driving force
Fuel shareEnergy efficiency
householdindustry
Commercial building floor
area
Freight transport demand
Passenger transport demand
industry
Freight generation per output
Transport distance
CO2 emission factorarea demand demand
Energy demandCarbon sink
18
Modal shareCO2 emission
Methodology developed by Shimada et.al (2006), Gomi et. Al (2007)

Energy Demand By Sector12,000 Freight transport
Energy demand in IM is projected to increase from 1,442 10,000
12,000
Passenger transportIndustry
10,93610,936
232%
p j3,286 ktoe (toe: tonne oil equivalent) in 2005 to 10,936 ktoe in 2025 for the BaU case (BaU: business as usual)
790
8,000
(kto
e) .
y
5 9155 9155 9155 915 (BaU: business as usual)
6,635 253 834
6,000
y de
man
d ( 5,9155,9155,9155,915
Industry is expected to be 6,635 ktoe and will maintain the largest share of 61%.
3,494359572
2 000
4,000
Ene
rg 3,2863,286
g
240 1,091 649 382
978 6851,733
0
2,000
19
2005 2025 BaU 2025 CM

12,000 CoalEnergy Demand by Energy Sources
1,84410,000
Hydro power
Solar & wind powerBiomass Increase in demand for
3 854
61
8,000
(kto
e) .
Biomass
Natural gas
Petroleum
Increase in demand for natural gas (3.2 times) the consumption in 2005.
3,854
19333
9646,000
gy d
eman
d
Energy sources such as bi l d
4 9781 209 3,694
447
60289
4,000
Ene
rg biomass, solar and wind power will be newly introduced for primary energy in 2025
1,729
4,978
788
1,209 ,
0
2,000primary energy in 2025 CM case.
02005 2025 BaU 2025 CM
20
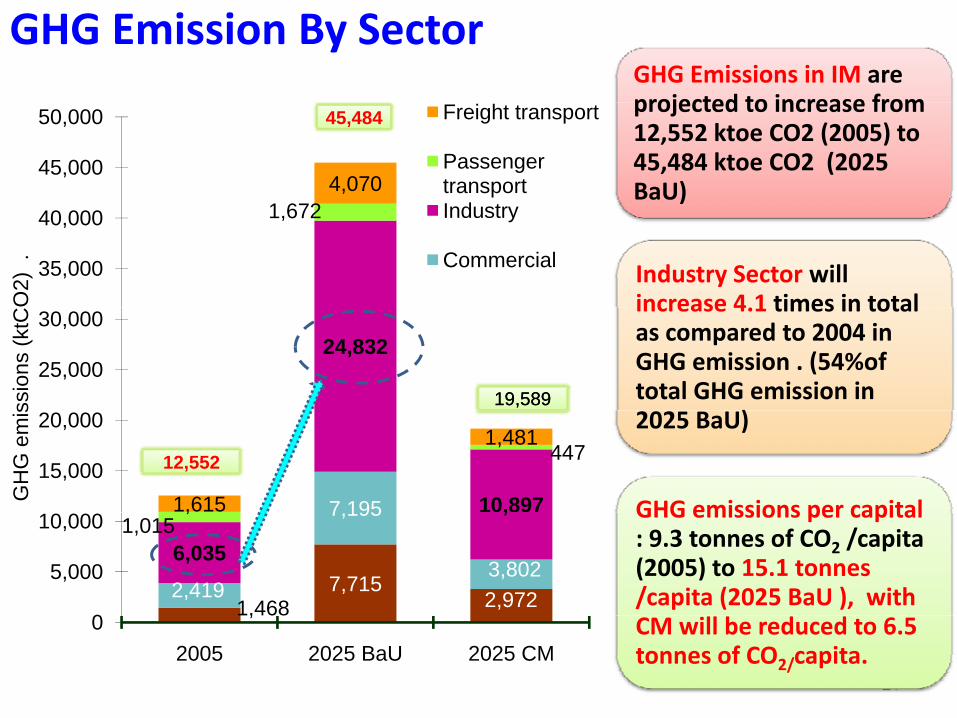
GHG Emissions in IM are projected to increase from
GHG Emission By Sector
1 6724,070
45,000
50,000 Freight transport
Passenger transportI d t
45,48445,484 projected to increase from 12,552 ktoe CO2 (2005) to 45,484 ktoe CO2 (2025 BaU)
1,672
35,000
40,000
O2)
.
Industry
Commercial Industry Sector will increase 4.1 times in total
24,83225,000
30,000
ssio
ns (k
tC
19,58919,58919,58919,589
increase 4.1 times in total as compared to 2004 in GHG emission . (54%of total GHG emission in
)
7 195 10,897
447
1,615
1,481 15,000
20,000
GH
G e
mis
12,55212,552
2025 BaU)
GHG emissions per capital
1,4687,715
2,972 2,419
7,195
3,8026,035
,1,015
,
0
5,000
10,000 GHG emissions per capital : 9.3 tonnes of CO2 /capita (2005) to 15.1 tonnes /capita (2025 BaU ), with
21
1,4680
2005 2025 BaU 2025 CMCM will be reduced to 6.5 tonnes of CO2/capita.

Potential Mitigation in IM50,000
5521
623
40,000
45,000
,
)
Transport demand management
tions
10831
777 3510
30,000
35,000
ons
(kt-C
O2) Fuel shifting
Efficiency improvement (buildings)
ssio
n R
educ
t
57%262%
45483
19162
4463 20,000
25,000
ons/
redu
ctio
Efficiency improvement (transport)
Efficiency improvement (industry)
Em
is5 %
52%
12552
19162
5 000
10,000
15,000
GH
G e
mis
sio
Efficiency improvement (power sector)
GHG emissions
0
5,000
2005 2025 BaU 2025 CM
G
22

BuildingsLow Carbon Cities Policy Package
•Environmental performance standard and evaluation of buildings•Adjustment of tax rate of fixed asset tax•Low interest loans to investment to
ffi i t b ildi
•Environmental performance standard of equipments•Environmental labeling•Education and information service•Green purchasing policy
•Subsidy to introduce photovoltaic power generation system
energy efficient buildingsp g p y
Environmental performance
Transport & Land use Industry•Urban planning•Transport planning•Tax rate adjustment to fixed asset•Investment to public transport
•Environmental performance standard of vehicles•Tax rate adjustment to energy efficient vehicles•Promotion of bio fuel
•Subsidy to investment to energy efficient equipments•Promotion of technology transfer
•Incentive to introduce energy efficient equipments & buildings •Controlling urban growth &
choice of transport mode
Energy efficiency i t
Lowering CO2i t it
Transport d d t l
q p g•Incentive to introduce renewable energy choice of transport mode
Mitigation of GHG emissions from Iskandar Malaysia
improvement intensity demand control
23

Preliminary findings Mitigation Measures
24

SATREPS PROJECT - Science and Technology Research Partnership for Sustainable Development -
• Project Title: Development of Low Carbon Society Scenarios for Asian Regions
• Project Period: Five years (2011~2015)
• Project Area: Iskandar Development Region (IM), Malaysia
• Sponsored by JICA (Malaysian side) and JST(Japanese side)
• Total fund supported by JICA : 190 Million JYTotal fund supported by JICA : 190 Million JY
• Project Purpose:Develop Methodology for creating Low-Carbon Society (LCS) scenarios and applied to
Iskandar Development Region (IM), as well as other regions in Malaysia, and the research findings are disseminated to Asian Countries.
25

RESEARCH OUTPUT ANDRESEARCH OUTPUT AND ACTIVITIES
1.Methodology to create LCS scenarios which is et odo ogy to c eate CS sce a os c sappropriate for Malaysia.
2 LCS scenarios are created and utilized for policy2.LCS scenarios are created and utilized for policy development in Iskandar Malaysia (IM).
3.Co-benefit of LCS policies on air pollution and on recycling-based society is quantified in IM.
4.Organizational arrangement of UTM to conduct trainings on LCS scenarios for Malaysia and Asian countries is prepared and a network for LCS in Asia iscountries is prepared, and a network for LCS in Asia is established.

IMPLEMENTATION ARRANGEMENT AND OUTPUTOUTPUT

RESEARCH PROJECT TIMELINE 2011-2015
Interim project Evaluation• Need substantial input to blueprints etc.• Compiling the the first draft of LCS roadmap
Final project Evaluation
2011 2012 2013 2014 2015
ACTIVITY 1: METHODOLOGY
Apply the whole methodology and tools
Revising and ImprovementRevising and Improvement
ACTIVITY 2: IMPLEMENTATION
Design the scenarios and roadmaps
Details for ImplementationI l i R i i d
e project
IMPLEMENTATIONImplementation Revising and
Improvement
ACTIVITY3: AIR & SWM
Detailed basic survey System integration W
rap up
th
AIR & SWMy g
Manual development
ACTIVITY 4:DISSEMINATION
International Expert Workshop once per yearInternational Training Workshop once per year
W
28
Stage 1Stage 2 Stage 4
Stage 3

LCS Activities in Malaysia…
Expert Talk Held by JPBD KLGuided tour around Putrajaya by PJC
Meeting with Vice Chancellor of UTM LCS UTM team & Japan team members.

Day 1: AIM Training – participants from Japan, China, India, Malaysia, Indonesia, Thailand, South Korea and Taiwan
Prof. Yuzuru Matsuoka (Head of LCS Project – Kyoto U; Dr. Junichi Fujino, NIES; Dr. Zainah Ibrahim JPBD R&D; Dr. ... (Executive Director of NIES) and Boyd Joeman IRDA
Members of the LCS IM, Japan Team

LCS UTM Research Workshop – 07 Jan 2011

Env’lEnv’l
Implement Implement Comply . Enforce Comply . Enforce
i ii i Planning Planning & & MngtMngt
Social & Social & Cultural Cultural DevDev
Com & Com & Industry Industry Planning Planning
TalentWorkforce;
LValue‐ CDPCDPFed Fed
P liP li
Monitor . ReviewMonitor . Review
GreenGreen‐‐
DevDev& Dev& Dev Low carbon lifestyle
added products & services
CDPCDPPolicyPolicy
NPPNPP IRDA’s IRDA’s BPsBPsGreenGreen
focused focused AgendaAgenda
IntegratedIntegratedTransport Transport
Economic Economic DevDev
BPsBPs
LCSLCSGreen
Economy
TODs
AgendaAgenda
RE &RE &
Modes Infrastructure Corridors
Movements
LCSLCSEconomyDPsDPs
SWMSWM
Land Use Land Use PlanningPlanning
RE & RE & ResourcesResources Reuse
Recycle Reduce Compost
FIT EE blgs & areas
Rainwater harvesting
Decarbonising
UD Phased Dev & DC
Decarbonising development/ Development
Process

Synergy of LCS research and application in Synergy of LCS research and application in Iskandar MalaysiaIskandar Malaysia
Actions on the Actions on the Research:Research:
InstitutionsInstitutions
AcademiaAcademia
PolicyPolicy
(IRDA)(IRDA)
ground: ground:
See and TouchSee and Touch
LCSLCS
BPsBPs
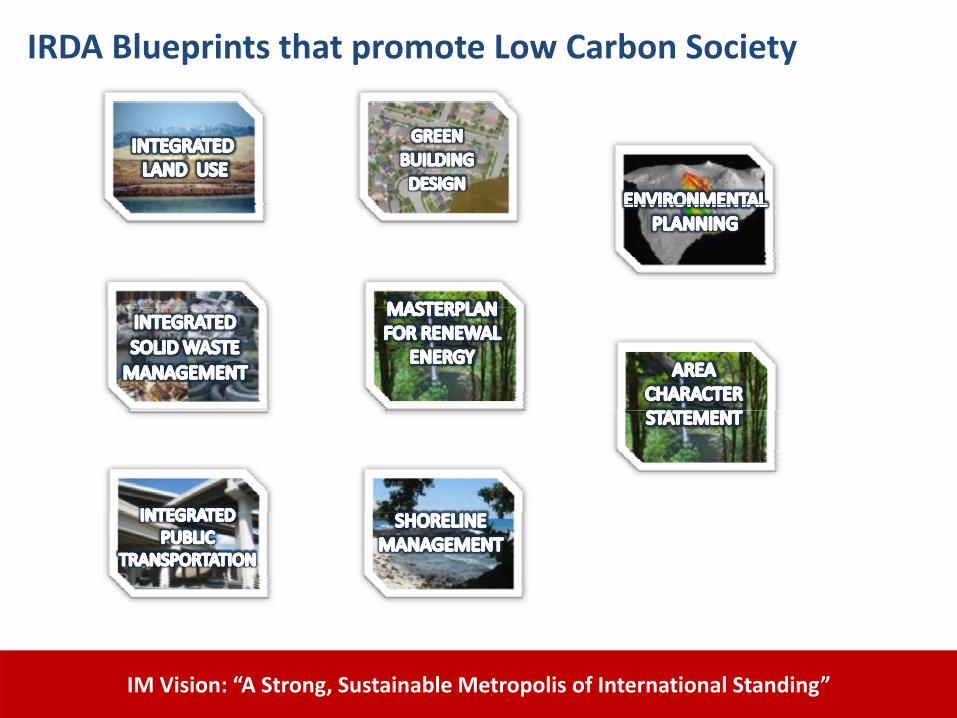
IRDA Blueprints that promote Low Carbon Society
3IM Vision: “A Strong, Sustainable Metropolis of International Standing”

Essential MechanismsEssential Mechanisms
Government: Government: Political Will Political Will
& & CommitmentCommitment
LCSLCSAwarenessAwareness‐‐Raising & Raising & FundingFunding LCSLCS Public Public
InvolvementInvolvement
FundingFunding
CapacityCapacityCapacityCapacity‐‐BuildingBuilding

IRDA’s expectations from the LCS ProjectIRDA’s expectations from the LCS Project
H ill th LCS S i h l t d IM’ CO• How will the LCS Scenarios help to reduce IM’s CO2 emissions between 30‐50% by 2025?
• How do we translate the results from the research into policies and proposals that can be implemented? REAL SOLUTIONSimplemented? REAL SOLUTIONS
• How will the results enhance our blueprints? Identify GAPS
•• CDP Review 2015CDP Review 2015

Conclusion
1• LCS Scenario development needs national vision and political/
society commitment and input.
2• The use of model to quantify this vision into quantifiable variables –
AIM model from NIES and Kyoto University2 AIM model from NIES and Kyoto University
D t ll ti d S t f t i d lli i
3• Data collection and Support of experts in modelling exercise –
Capacity building
4• To realize a LCS, IM has to have new and bold policies to
encourage and promote businesses and citizens have to take countermeasures to lower the emissions levels.
37
4 countermeasures to lower the emissions levels.

THANK YOU FOR THE ATTENTION.
3838