p in ipat human population - university of iceland · domestication of plants and animals ... on...
TRANSCRIPT

UAU102F Fall
Throstur Thorsteinsson ([email protected]) 1
Forecasting population growth
Throstur Thorsteinsson
1. Hunters and gatherers• Low population density
2. Early, pre-industrial agriculture• Allowed a much greater density of people
• The first major increase in human population
3. Machine age• Industrial revolution increased possibility of increased density
• Significant increase in EROI
4. The Modern era• Rate of population has slowed in wealthy nations but continues
to increase rapidly in poorer, less developed nations.
Four stages
1. Hunters gatherers
2. Pre-industrial agriculture
3. Industrial agriculture
4. Industrial revolution
3 and 4 occurred at the same time
Taking what nature gives you - hardly any domination
Omnivorous non-specialist animal
Competed with other species in food-webs
Constrained by available photosynthetic energy
Low life expectancy, low population density
12000 BP in southwestern Asia
8000 – 9000 BP in China and Mexico
Involved: Domestication of plants and animals
Initially shifting cultivations (slash and burn) - sustainable?
Increased population density from 2 to 25 – 1000persons per km2.

UAU102F Fall
Throstur Thorsteinsson ([email protected]) 2
Why did they “go for it”?
Saw the prospects for a better life?
Needed to in order to survive - possible that the population had increased beyond what the H&G systems could sustain
Gave more reliable food supplies
Provided higher energy return
Enabled higher population densities
What were the Cultural Implications?
What were the Environmental Implications?
Cultural Implications of the transition:
Less time devoted to gathering food
Cultural evolution
Increased population density
Beginning of Urbanization
Social stratification
The ancient city of Mohenjo-daro, built around 2600 BC by the Ancient Indus valley civilization
Environmental Implications: Large areas of forest cleared
Increased population density and thus land could not lay fallow as needed
Soil erosion
Distribution of plants and animals shifted in favor of domesticates
Diseases - monocultures made the system vulnerable
Slowly progressing domination
Development of irrigation and fertilization
Simple machines such as simple plows and irrigation systems
Land did not need to lay fallow
Population density continued to increase
EROI remained relatively low (energy return on investment)
Energy return on investment (EROI)
Describes how much energy is invested in the system compared to what we get out.
Energy out/energy in
Can be used as an indicator of scarcity

UAU102F Fall
Throstur Thorsteinsson ([email protected]) 3
Began in China ca 1200 with the use of coal
Slowly progressed as various inventions enabled more efficient use of energy Steam engine (coal)
Internal combustion engine (oil)
Gas turbines
Humans became energy slaves!
Possible to link major changes in human history to changes in energy use.
Enabled increased population densities
Urbanization and urban growth
New human enterprises
Increased production in less time: Increased use of inputs
Increased use of outputs and waste
Increased pressure on the environment
Thomas Malthus 1798 (classical economist) “Essay on the Principle of Population”
Populations increase in size exponentially
Food supplies increase linearly
Thus population growth will outstrip the food resources, with catastrophic consequences—mass starvation, poverty, and economic and social collapse.
True? Why/why not?
4 6 8 10 12 14 16 18 20 22 24
0
20
40
60
80
100
120
140Linear
Exponential
Time
Va
lue

UAU102F Fall
Throstur Thorsteinsson ([email protected]) 4
Ester Boserup 1965: “The conditions of Agricultural Growth”
Population growth triggers higher productivity through land intensification and innovation of new technology -improving the human condition.
Julian Simon: More people, more minds
Human population grows exponentially
Economic growth (goods and services produced), increase as well – and due to the laws of thermodynamics this growth requires material and energy inputs.
Pressures on resources and the environment mount - BUT how can we know what the impact on the environment may be if population keeps growing at current rates?
Formula to represent population change:
Pt = Pt-1 + (B – D) + (I – E)
P: population at time (t) or at time (t-1)
B: Births
D: Deaths
I: Immigration
E: Emigration
Some Statistics see: http://www.census.gov/ipc/www/idb/
Current Population: 7,342,192,000 (28 September 2016)
Crude birth rates: average annual births/1000 population
Crude death rates: average annual deaths/1000 population
Total fertility rate: average number of children a woman has from
15-49 yrs old
Rate of natural increase: birth rate-death rate
Net growth rates: birth rate-death rate
Infant mortality rates: Annual number of death of infants under the age
of 1 per 1000 life births
Life expectancy at birth: Average number of years a newborn infant can expect to live under current mortality levels
Age-specific death and birth rates: Age class effects taken into
account

UAU102F Fall
Throstur Thorsteinsson ([email protected]) 5
The World FactBook (CIA) - https://www.cia.gov/library/publications/the-world-
factbook/fields/2127.html, CC BY-SA 3.0, https://commons.wikimedia.org/w/index.php?curid=7248239
the expected number of children born per woman in her child-bearing years
CIA World Factbook of 2015
http://vizhub.healthdata.org/le/

UAU102F Fall
Throstur Thorsteinsson ([email protected]) 6
http://world.bymap.org/MedianAge.html
Current Population (1 Jan 2015): ~329 100
Crude Births per 1000 indiv: 13.9
Crude Deaths per 1000 indiv: 6.3
Annual growth rate: 1.2%
Infant Mortality per 1000 indiv: 2.1
Life Expectancy (at birth): 83
Total Fertility Rate: 2.0 per woman https://hagstofa.is/media/49889/hag_160621b.pdf
Current Population(2008): 18,931,686
Crude Births per 1000 indiv: 42
Crude Deaths per 1000 indiv: 12
Annual growth rate: 3.0 %
Infant Mortality per 1000 indiv: 75.3
Life Expectancy (at birth): 55.1
Total Fertility Rate: 5.86 per woman
More data, Population Reference Bureau
http://www.prb.org/DataFinder
r: growth rate
Doubling time
Take natural log at both sides…
or 70/(growth rate in %)
Doubling time
Nrdt
dN
)exp(0 trNN
)exp(2 200 xtrNNN
rrt x
7.0)2ln(2
UAU102F Fall
Throstur Thorsteinsson ([email protected]) 7
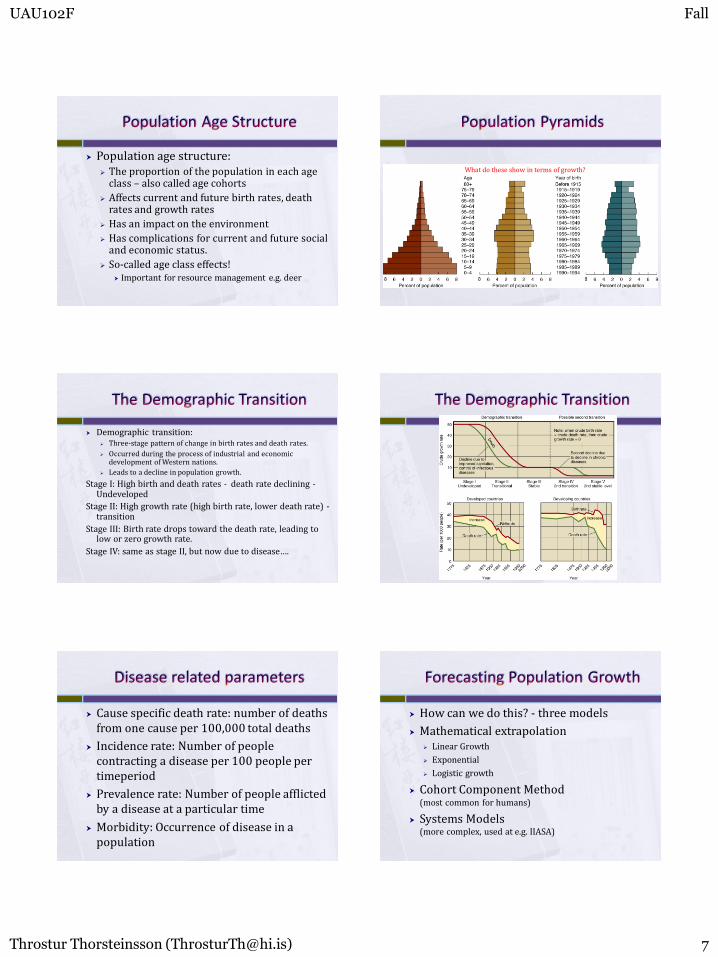
Population age structure: The proportion of the population in each age
class – also called age cohorts
Affects current and future birth rates, death rates and growth rates
Has an impact on the environment
Has complications for current and future social and economic status.
So-called age class effects! Important for resource management e.g. deer
What do these show in terms of growth?
Demographic transition: Three-stage pattern of change in birth rates and death rates.
Occurred during the process of industrial and economic development of Western nations.
Leads to a decline in population growth.
Stage I: High birth and death rates - death rate declining -Undeveloped
Stage II: High growth rate (high birth rate, lower death rate) -transition
Stage III: Birth rate drops toward the death rate, leading to low or zero growth rate.
Stage IV: same as stage II, but now due to disease….
Cause specific death rate: number of deaths from one cause per 100,000 total deaths
Incidence rate: Number of people contracting a disease per 100 people per timeperiod
Prevalence rate: Number of people afflicted by a disease at a particular time
Morbidity: Occurrence of disease in a population
How can we do this? - three models
Mathematical extrapolation Linear Growth
Exponential
Logistic growth
Cohort Component Method (most common for humans)
Systems Models (more complex, used at e.g. IIASA)

UAU102F Fall
Throstur Thorsteinsson ([email protected]) 8
Exponential growth
Characterizes anything that can grow without limit
Same as compounding formula in economics
Pt+N = Pt*(1+r)^N
Pt+1 = Pt*(1+r) ^1
Logistic or density dependent growth
Upper limit to the ultimate size - carrying capacity, K
Constant
Can be assessed
Growth determined by:
Pt = Pt-1 + r* Pt-1 * (K - Pt-1)/K
Definition: The maximum population of a species an area can support without reducing its ability to support the same species in the future
Function both of the area and the organism (ex. Ceteris paribus (= all other things being equal or held constant)
Larger area higher K)
Determined by size limiting factors, such as space, food, energy etc.
Affects birth and death rates.
What determines K – and can it be estimated?
Human carrying capacity
Factors: Food supply
Land and soil resources
Water resources
NPP
Population density
Technology
Is it static?
Biophysical carrying capacity
Social carrying capacity
Breaks population into
age cohorts (usually 5
year) by gender, ethnicity
Cohort specific death and
birth rates.
Cohort specific
immigration/emigration
0-4
10-14
5-9
15-19
10-14
5-9
15-19
T1 T2
0-4
B
BD
D
D
DD
D
D
D

UAU102F Fall
Throstur Thorsteinsson ([email protected]) 9
Where are these pyramids from ?
Population expected to reach 10 billions in 2050
GDP/capita to increase 2 - 4 fold
If P really is a culprit for environmental degradation - how can it be reduced?
Should we?
Ethics?