p-hacking in academic research: evidence from … · p-hacking in academic research: ... since we...
TRANSCRIPT

P-hacking in Academic Research: Evidence from Experimental Accounting
Studies*
Huasheng Gao
Fanhai International School of Finance
Fudan University
Wei Li
Nanyang Business School
Nanyang Technological University
This version: March 2018
Abstract
Abstract: We provide evidence that accounting experimental studies are prone to p-hacking.
Extracting p-values from experimental accounting studies published on the two top accounting
journals from 1990 to 2016, we find an unusual abundance of p-values that are just significant: the
frequency of p-values equal to 0.05 far exceeds what would be expected based on the frequency
of neighboring p-values. The discontinuity at 0.05 is more pronounced for articles written by
untenured authors, male authors, sole author, and authors from higher-ranking schools. Lastly, we
do not find a similar discontinuity from archival accounting articles.
Keywords: P-hacking; Experimental accounting; Statistical significance
* We are grateful for the helpful comments from the seminar participants at the Nanyang Technological University, University of Adelaide, Shanghai University of Finance and Economics, Fudan University, and seminar participants in the First Fanhai Economics and Finance Workshop. All errors are our own.

1
1. Introduction
In July 2014, a renowned professor of accountancy, Dr. James Hunton, was found guilty of
research fraud. An investigation by his employer concluded that James Hunton was responsible
for fabricating data for at least two publications, and that he “cannot determine with confidence
which other papers may be based on fabricated data”1. Until 2015, the misconduct leads to 32
retractions of articles published on top accounting journals, and causes a shock to the accounting
community.
The episode also illustrates the undisclosed flexibility available to experimentalists when
conducting data collection and analyses2. As Harvey (2017) points out, such flexibility and
discretions greatly facilitate p-hacking, which refers to the practices of trying many tests to
produce the most significant results and file-drawer insignificant ones3. While p-hacking is still
far away from being regarded as outright fraud, it inevitably increases the chance of making false
positive errors ─ the incorrect rejection of null hypothesis. False positive errors are costly. They
mislead valuable research resources to fruitless research programs (Simonsohn, Nelson, and
Simmons, 2011, 2014); moreover, a field rife with false positives may find its credibility
undermined. Hence, it is important for us to know whether p-hacking is widespread in a field.
In this paper, we investigate the prevalence of p-hacking among experimental accounting
studies by revealing a discontinuity in the pooled distribution of reported p-values. The
1 http://retractionwatch.com/2015/09/09/a-new-member-enters-the-top-10-on-our-leaderboard-james-hunton/ 2 Dr. Hunton claimed that the data he fabricated is subject to stringent confidential agreement with his fictive
participants, therefore he couldn’t disclose any original data used in the two studies. When Hunton collaborated
with his co-authors, he also used the same excuse as shield and provided them only with summary information of
the “original data”. The (claimed) confidential data sources obviously gave Hunton many conveniences in carrying
out the fraud. 3 Simonsohn, Nelson, and Simmons (2011) provide examples of various forms of p-hacking in experimental
psychology.

2
discontinuity in distribution enables us to detect p-hacking because of an important feature of the
Null Hypotheses Significance Testing (NHST): for an effect to be considered significant, its
corresponding p-value must be ≤ 0.05. Results with p-values larger than 0.05 are deemed
insignificant and have lower chance of publication. Based on this arbitrary threshold for
significance, we hypothesize that if p-hacking is widespread, there should be too much “just”
significant p-values (target beating).
Our finding is consistent with this hypothesis: the histogram of p-values from
experimental accounting articles exhibits a sharp discontinuity at 0.05. The frequency of “just”
significant p-value (0.05) is higher than the frequencies of 0.04 and 0.03. More interestingly, the
frequency of 0.06 is unusually low: it is lower than the frequency of 0.07, suggesting that at least
part of the marginally significant results from the articles are inflated into significant results.
For an alternative story to be able to summarize our results, it has to explain not only why
frequency of 0.05 is much higher than other smaller p-values (0.03 and 0.04), but also why
frequency for 0.06 is not as high as would be expected based on the frequency of 0.07. Given
that publication bias ─ the preference for publishing significant results ─ works against finding
these irregularities, we interpret the discontinuity at 0.05 as strong evidence of p-hacking.
We then perform formal statistical tests to assess of the extent of p-hacking. To do so, we
fit the distribution of p-values to an exponential distribution that minimizes the error of fitting.
The R-square from the fitting exercise is on average above 98%. Our conservative estimate from
the fitting shows that expected frequency of 0.05 should be 23% less than observed. The
residual of fitting for 0.05 is also significantly larger than the mean residuals of other p-values.

3
Having showed the existence and extent of p-hacking, we turn to examine what predict
the extent of p-hacking by exploiting the cross-sectional variation in authors’ incentive and
opportunities to conduct p-hacking. We identify five author and paper characteristics that are
important. For example, we find that p-hacking is more prevalent among articles written by un-
tenured authors, male authors, sole author, and authors from higher ranking schools. The cross-
sectional variations in the extent of p-hacking again confirm that the discontinuity is indeed
caused by p-hacking.
Lastly, we investigate whether archival accounting studies also exhibit p-hacking. Our
results show a highly right-skewed histogram of p-values from archival accounting studies, but
we do not find a similar discontinuity at 0.05 based on these articles. This result suggests that p-
hacking problem in archival accounting studies (if any) is not as severe as experimental
accounting studies.
Our paper makes at least two contributions. It is the first to conduct a formal analysis on
the existence, and more importantly, the extent of p-hacking among experimental accounting
studies. Experimental accounting studies have been playing an increasingly important role in
advancing accounting research, partly due to its relative advantage on answering questions that
cannot be done using archival data, and on offering timely feedback regarding accounting policy
issues. We emphasize that the importance of experimental accounting studies call for
maintaining a higher standard of credibility and transparency in the field.
Furthermore, our paper complements Masicampo and Lalande (2012) and Krawczyk
(2015), among others, who study similar question in the field of experimental psychology. In
addition, Heat et al. (2015) investigate the extent of p-hacking among 14 disciplines. Their
results show considerable variation on the extent of p-hacking across disciplines, and psychology

4
is on the top of the list. None of these papers, however, ask whether easily obtainable author and
paper characteristics help to predict the extent of p-hacking. In addition to confirming their main
finding in the field of experimental accounting research, our paper extend their works by
exploring the determinants of p-hacking, which may help potential readers, including journal
editors and referees, to make more informed decisions.
The rest of this article proceeds as follows. In Section 2, we introduce our sample
construction and empirical strategy; in Section 3 we present evidence on the existence and extent
of p-hacking; Section 4 further explores the factors that shape researchers’ incentive to conduct
p-hacking, Section 5 presents additional tests, and we conclude in Section 6.
2. Our sample and empirical strategy
2.1. Sample construction
Our aim is to include in our sample as many experimental accounting studies from
influential accounting journals as possible. Since we are not experts in this field, we use a
computer program to search among all articles on two top publishers of experimental studies –
The Accounting Review (TAR) and Journal of Accounting Research (JAR) – from 1990 to
20164. We record an article if its abstract contains keyword “experiment”, but not “(quasi-)
natural experiment”5. Once an article meets this simple criteria, we then download it for further
data collection. To be included in our sample, an article must have at least one p-value
4 Our sample period starts from 1990 because that’s when Dallas Ranking for accounting divisions across the world
starts to be available, which we will need to conduct subsample analysis. 5 Alternatively, we can also rely on JEL Classification code to distinguish experimental studies from archival
studies, but this information is not provided on the website of the two journals.

5
mentioned in its text. We also exclude articles that are retracted from the two journals. In the
end, we have 239 articles as our final sample, 157 from TAR and the rest from JAR.
To analyze what affect researchers’ incentive to do p-hacking, we further collect a series
of author and article characteristics. For each article, we collect: author tenure information,
ranking of author-affiliated school, number of years since graduation, graduation school ranking,
author gender, number of subjects in the experiments, whether p-values are two-tailed, and
number of authors for a paper. We believe that these variables may either directly or indirectly
capture authors’ incentive to do p-hacking. For example, ceteris paribus, tenured authors do not
have a strong concern for future employment, and thus are unlikely to engage in p-hacking to
increase the chance of publication; motivated by the literature on gender differences in risk-
taking, we also include author gender as a potential predictor of p-hacking; p-hacking requires
coordination among authors, and coordination cost is likely higher when more authors contribute
to a study, we thus include number of authors for each article.
To obtain tenure, graduation, and school ranking information for each researcher, we
search for “author name” + “affiliated school” on google. Most of these searches deliver an
author’s latest CV, from which we can determine the year of tenure and graduation. We then
collect information on school ranking from The UTD Top 100 Business School Research
Rankings. Since our focus is experimental accounting studies, we are interested in the ranking of
accounting division of a specific university, we thus choose to rank the schools by the number of
accounting top journal publications in a given year6. Note that for each article-author-school
combination, the ranking for that school is two years before the publication of that article. We
6 We choose three top journals in the accounting field: TAR, JAR, and Journal of Accounting Economics (JAE).

6
introduce this two-year lag to capture the ranking status while a paper is written rather than when
it’s published. If a school is not on the ranking list, we replace its ranking with the lowest
ranking number on the ranking list in a specific year. Finally, if we cannot find CV for an
author, we rely on other credible sources to obtain as much information as possible7.
We manually check each article to obtain the number of subjects, in articles where
multiple experiments are conducted, we sum the number of subjects from the experiments.
Lastly, we check whether all p-values in a paper are based on two-tailed tests.
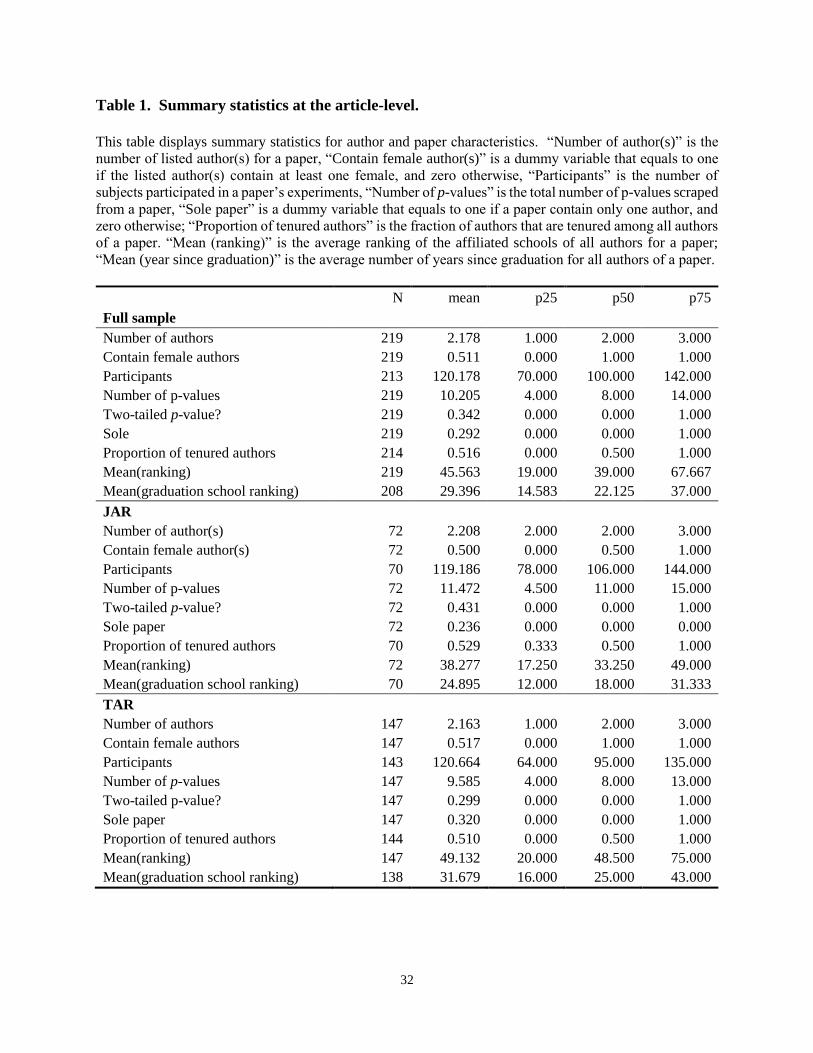
Table 1 offers a glimpse of the characteristics of experimental studies in our sample. An
average article in our sample has 2.2 authors, 0.5 female authors, 120 subjects in the
experiments, and mentions 15 p-values in its text. About 34.2% of the articles report only two-
tailed p-values, and 29.2% are sole works. When we break the total sample by journal, we notice
that about two third of the articles in our sample comes from TAR8, which publishes more
behavioral research than JAR does. We also find that the variables do not exhibit big differences
between two journals.
[Insert Table 1 about here]
2.2. Methodology
After transforming all downloaded pdf files into txt format, we use a Python script to
search for numbers between 0 and 1 immediately preceded by “p =”, “p-value =”, “ptwo−tailed
=”, and “pone−tailed =”, regardless of spacing or capitalization. We deliberately ignore numbers
after “p <”, “p-value <”, etc., because we cannot assign these numbers into exact bins when
7 Those sources include school website, LinkedIn, and BYU Accounting author search, etc. 8 Differences in number of observations among variables are due to missing values.

7
plotting the p-curve9. We also do not attempt to uncover the exact p-values for these cases using
the underlying F-statistics, as linking each p-value to its original test in an article can be quite
time-consuming.
Our script cannot retrieve p-values within tables, because the formatting of tables in pdf
is messy and varies from article to article, rendering the search impractical. However, by
focusing only p-values mentioned in the text, we ensure that a p-value is not recorded twice in
our sample; furthermore, researchers are more likely to mention in text their main results’
significance level than other covariates’, this suits the examination of our hypothesis that
researchers have the strongest incentive to engage in p-hacking for their key findings.
Our initial search yields 3,433 p-values. However, not all of these p-values are
informative about the extent of p-hacking. We are particularly interested in any irregularities in
the cross-sectional distribution of the p-values at focal point such as 0.01, 0.05, and 0.10, we
exclude all p-values larger than 0.15. Our final sample contains 2,235 (65%) p-values from the
initial sample.
We then pool the p-values across articles and time to generate a distribution of p-value.
Of particular interest is the distribution at 0.05. We also notice that discontinuity in distribution
is widely adopted in contexts where asymmetric incentives induce subjects to beat various
targets, such as earnings management to report small profits and positive earnings growth (see,
e.g., Burgstahler and Dichev, 1997), and hedge fund return misreporting to report gains rather
than losses (see, for example, Bollen and Pool, 2009).
9 If we also include these p-values in our sample, our main results will only become stronger, because “≤” is
commonly followed by threshold value 0.05. This is unsurprising since a p-value of 0.049 is more likely to be
rounded to “p-value ≤ 0.05” than a p-value of 0.039.

8
It is worthwhile to emphasize that we do not have any further knowledge about the
articles in our sample, such as the topic of interest, hypotheses tested, and design of experiments.
Hence, it is possible that our script captures numbers that are not p-values, or quoted p-values
from elsewhere, and that some relevant p-values will be ignored. However, these imperfections
will only add trivial noises into our final sample. We see no reasons that suggest otherwise.
3. Empirical results
We present two sets of results to determine whether p-hacking to turn insignificant results into
significant exist or not. First, we provide graphical evidence in the form of histogram on the
cross-sectional distributions of the p-values. Second, we fit the distribution of p-values to an
exponential distribution to roughly quantify the extent of p-hacking.
3.1. The cross-sectional distribution of p-values
We first plot a histogram using all p-values under or equal to 0.15. We choose a bin
width of 0.0025. The result is shown in Panel (A) of Figure 1. One finding stands out from the
distribution: there is an obvious bump in the frequency of interval of (0.0475, 0.05], which we
highlight using bold bar. This frequency (152) is even higher than the frequency for interval
(0.0375, 0.04] and (0.0275, 0.03], which have frequency of 123 and 133, respectively.
[Insert Figure 2 about here]
The data clearly shows that articles in our sample prefer reporting p-values with two
decimal places. Around 40% of these p-values are reported with two decimal places, and the
majority of the rest have three decimal places. This creates an indented p-curve in Figure 1. In
Panel (A) of Figure 2, we use only p-values reported with two decimal places to plot another
histogram. The resulting histogram shows that the unusual high frequency of p-values in interval

9
(0.0475, 0.05] in Figure 1 is entirely driven by p-value = 0.05, which was found 126 times in our
sample. In contrast, the frequency of p-values equal to 0.03 and 0.04 is 114 and 94, respectively.
Since 0.05 is the maximum p-value for an effect to be considered as statistically
significant in experimental accounting research, the graphs provide strong evidence that there are
too many results with “just significant” p-values, indicating target beating behavior.
In Panel (B), we round all p-values to two decimal places, count the frequency of the 16
p-values (0.00 to 0.15), and plot another p-curve. Similar pattern emerges, though the difference
in frequency between 0.05 and 0.04 is less salient. This is unsurprising because rounding
effectively sets the bin width to 0.01, thus muting the acuteness of the histogram to detect
marginal incentive of p-hacking at 0.05.
[Insert Figure 2 about here]
In sum, the evidence presented in this subsection provides evidence on the existence of p-
hacking among experimental accounting studies to inflate the significant results. The
irregularities in the distribution of p-values present challenges for any other potential
explanations.
3.2. Fitting the p-curve to an exponential distribution
In order to gauge the extent of p-hacking among our sample articles, in this subsection,
we follow Masicampo and Lalande (2012), and Harvey, Liu, and Zhu (2016) to fit the histogram
of p-values to an exponential distribution. The choice of an exponential curve is motivated by
the fact that observed distribution of p-value is highly right-skewed. In doing so, we are able to
roughly estimate the expected frequency of p-values, and statistically test the significance of the
irregularities.

10
Because p-values with two decimal places are more frequently reported, in order to have
a smooth histogram for fitting, we only use the two histograms in Figure 2 for this exercise. The
results are presented in Figure 3.
[Insert Figure 3 about here]
In Panel (a), the sample only includes p-values with two decimal places. An exponential
curve fits the histogram quite well except for two p-values: 0.05 and 0.06, the former lies well
above, and the latter well below the curve. Another less noticeable discontinuity appears in p-
value 0.11. The frequency of observing 0.11 is merely half the frequency of observing 0.10. We
posit that the reason for this discontinuity is that 0.10 is also a target to beat: p-values 𝜖 (0.05,
0.10] are deemed marginally significant, while p-values > 0.10 are insignificant. The importance
of this target, however, is subordinate to 0.05. We observe similar pattern at Panel (b), where all
p-values are rounded to two decimal places.
Motivated by the observed irregularities at 0.05 and 0.06, we conduct two post hoc
pairwise comparisons to determine if the residuals from fitting for this two p-values are
significantly different from the residuals for the rest 13 p-values in the two histograms. The
comparison is based on Dunnet’s Test (pairwise versus reference group). Specifically, we treat
residuals for p-values except 0.05 and 0.06 from exponential fitting as reference group, and
compare if the residuals for 0.05 and 0.06 is significantly different from the mean residual of this
reference group. The significance level obtained is adjusted by times of comparison. Results are
reported in Table 2.
Panel (1) and (2) of Table 2 are based on the fitting in Panel (a) and (b) in Figure 3,
respectively. Despite the small sample size (16 residuals), we find that in both (1) and (2), the
residuals at 0.05 are always significantly larger than the reference group, though the significance

11
is only marginal in (b). Residual at 0.06 is much smaller than the reference group in (a), though
it is statistically insignificant; in (b), residual at 0.06 is indistinguishable from reference group.
In terms of magnitude, the fitting shows that the expected frequency of 0.05 should be
24.88% to 26.72% lower than the observed frequency; for 0.06, the expected frequency should
be 13.16% to 38.46% higher than the observed.
As we stressed in subsection 3.1., histogram based on rounded p-values is not sharp
enough to detect the strongest incentive to engage in p-hacking at 0.05. Thus the results in Panel
(2) of Table 2 can be viewed as a lower bound for our results.
[Insert Table 2 about here]
Taken together, the results in this subsection establish the robustness of our finding that
p-hacking to inflate significance level is widespread in our sample articles.
4. What explain the extent of p-hacking?
In this section, we study the following question: ex ante, what help potential readers
(including referees and editors) of our sample articles to reasonably forecast the extent of p-
hacking? We hypothesize that when determining the extent of p-hacking, researchers weigh the
potential benefits of p-hacking against the costs of doing so. Main benefits include higher
chance of publication, more influence, and better career opportunities for authors; potential costs
include coordination costs among authors, availability of flexibility in data analyses, and
reputation costs. Based on this cost-benefit framework, we propose and test 7 factors10 using all
p-values rounded to two decimal places.
10 Subsample comparison based on tail choices of p-values and years since author graduation does not display
meaningful differences in extent of p-hacking between two subsamples, and thus are omitted for the sake of space.

12
4.1. Authors’ career concern: tenure
Researchers are highly rewarded for top journal publications, such rewards can be of
various forms. Tenure is perhaps the most important reward at the early stage of a researcher’s
career. By granting a permanent post for a researcher or lecturer, tenure greatly mitigates his or
her career concern.
We posit that p-hacking to increase the chance of publication should be most prevalent
among researchers that have not tenured yet. Hence the kink around 0.05 on the p-value
histogram will be sharper for articles written by researchers that do not obtain tenure yet. We
classify our sample articles into two groups. The first group include articles whose authors are
all non-tenured11, and the second group includes the rest.
Figure 4 displays the results. Histogram in Panel (a), based on a subsample of firms
without tenured authors, shows a dramatic increase in frequency from p-values of 0.03 to 0.05.
The frequency of 0.05 (54) is similar to that of 0.04 (53), both are much higher than the
frequency of 0.03 (41). We interpret this steep discontinuity as a result of high extent of p-
hacking.
Comparing Panel (a) with Panel (b), where the subsample includes the rest articles not in
Panel (a), we find a milder discontinuity: The frequency of 0.05 is slightly higher than that of
0.04, but is much lower than the frequency of 0.03. We interpret this result as evidence of
relatively lower extent of p-hacking.
[Insert Figure 4 About here]
11 We determine an author to be tenured only if he or she is tenured two years before the publication of the article of
interest.

13
We then formally test whether the discontinuities in (a) and (b) also differ in terms of
their respective statistical significance. Panel (1) of Table 3 shows that the residual of 0.05 is
significantly larger than the mean residuals of reference group in the subsample articles without
tenured authors, while the same result for the other subsample is insignificant.
4.2. Authors’ gender
Prior works document that males tend to exhibit stronger risk-taking incentive under
various scenarios (see, e.g., Byrnes, Miller, and Schafer, 1999; Charness and Gneezy, 2012, and
Faccio, Marchica, and Mura, 2016). It is thus reasonable to suspect that male researchers may
also be more aggressive when engage in p-hacking.
To empirically test this idea here, we separate our sample articles into two groups, the
first group includes articles with at least one female author, and the second group includes the
rest articles. The same subsample comparison is repeated.
We find evidence consistent with our conjecture. In Panel (a) of Figure 5, there is a large
jump in frequencies when we move from 0.03 and 0.04 to 0.05, similar pattern is not observed in
Panel (b), where the subsample is articles with female authors. Statistical test in Panel (2) of
Table 3 provide further supporting evidence.
[Insert Figure 5 About here]
4.3. Sole author
Various forms of p-hacking require coordination among co-authors. For example,
experimentalists co-authoring a paper may need to concur with each other on how to identify and
treat outliers, whether to collect more data, and whether to combine or transfer specific
measures. If one (undisclosed) decision is controversial but yields the most significant results,

14
the author who is in charge of data analysis might need to convince other authors why they
should make that choice. The costs of p-hacking thus increase with the need for coordination
and communication, which can be avoided by a sole author.
The above discussion leads to the following prediction: sole-authored articles will show
more aggressive p-hacking. We separate sole-authored articles and find consistent evidence. In
Panel (a) of Figure 6, we observe a monotonic increase in frequency for p-values from 0.03 to
0.05; furthermore, the curve fit shows that the residuals from curve fit is both economically more
important and statistically more significant (Panel (3) of Table 3).
[Insert Figure 6 About here]
[Insert Table 3 about here]
4.4. Authors’ school ranking
We are also interested in whether authors’ school ranking is related to their incentive to
engage in p-hacking. Ex ante, we do not have a clear prediction on how school ranking is related
to p-hacking. On one hand, it is possible that authors from top ranking school face higher tenure
requirements, and thus possess stronger incentive to publish, resulting in higher degree of p-
hacking. On the other hand, researchers affiliated with high ranking schools might be able to
come up better research questions that have larger true effects, and they may simply be more
rigorously trained, thus reducing the need and incentive to engage in p-hacking.
We resort to data to answer this question by collecting ranking information for both an
author’s employer appeared on the article of interest, and for her graduation school. Specifically,

15
if an article is published on year t, we collect its authors’ affiliated school ranking on year t-212,
which is determined by the number of Top 3 accounting journal publication on that year.
We create a variable that equals to the highest ranking of its author(s)’ affiliated school(s)
for each article, and then regroup our sample articles based on the median value of this variable.
Results are in Figure 7. Looking at the histograms suggests that articles in the second Panel
(higher ranking) exhibit stronger evidence of p-hacking: there is a large jump in frequency for
0.05 in Panel (b), and therefore the discontinuity at 0.05 is sharper. However, in Panel (a), we do
not observe a similar discontinuity at 0.05. One possible explanation for these results is that,
authors from high-ranking school face higher pressure to generate top publication, and thus
engage in more aggressive p-hacking.
We repeat the same analyses for ranking of graduation school, Figure 8 and Panel (5) in
Table 3 show articles with authors graduated from high-ranking schools are also associated with
higher degree of p-hacking. Overall, the evidence shows that authors in higher-ranking school
seem to engage in higher extent of p-hacking, hence, it is important to note that researchers are
not solely responsible for p-hacking. Journals and schools play important role in reinforcing the
incentive of p-hacking.
[Insert Figure 7 and Figure 8 About here]
4.5. Number of participants in experiments
Lastly, we study whether number of subjects in the experiments of behavioral accounting
studies is related to the extent of p-hacking. As mentioned before, researchers can decide
whether to conduct additional sessions after seeing their results, and they might stop collecting
12 If an author is affiliated with multiple universities or institutions, we take the one with the highest ranking. Many
authors got their PhD degree before 1990, when Dallas ranking start to exist. We use the ranking on 1990 instead.

16
data right after obtaining significant results. We presume that those behaviors will result in more
subjects participate in a studies’ experiment(s). Put differently, higher number of participants is
the consequence, rather than the cause of p-hacking.
Our evidence in Figure 9 is consistent with this reasoning. In Panel (b) with the
subsample of articles having higher than median number of participants in their experiments, the
relatively higher frequency of 0.05 is more obvious than that in Panel (a). Furthermore, results
in Panel (6) of Table 3 show that residuals at 0.05 are significant for both subsamples.
Taken together, we identify five factors that seem to be able to predict the extent of p-
hacking, they are, authors’ tenure, gender, number of author, authors’ affiliated school ranking,
and number of participants in the experiments of an articles.
[Insert Figure 9 About here]
However, our results in this section is purely based on univariate analysis, and the results
obtained can be relational instead of causal. It is possible that those factors are correlated with
each other or other omitted variables. Our results thus need to be interpreted with these
limitations in mind.
5. Additional tests
5.1. Extent of p-hacking for main results
If researchers use p-hacking to obtain the most significant results, then they should have
the strongest incentive to do so for their key results in the article. To test this conjecture, we slice
the p-values in our sample as follows. For an article, we rank its p-values by the sequence they
appeared in the text, and then group p-values appeared in the first half of the whole sequence as

17
p-values for the key results. The rationale is that generally speaking, the key results of an article
are likely to be mentioned earlier rather than later.
Results in Figure 10 demonstrate that the kink in the p-value histogram at 0.05 in our full
sample is almost entirely driven by the subsample of p-values mentioned in the earlier part of
each article. Moreover, the frequency of p-values at 0.01 is almost twice the frequency of p-
value = 0.02, which is lower than the frequency of 0.05. The potential explanation is that
researchers have higher standard of significance level for their main results: many p-values equal
to 0.02 are inflated to 0.01.
In contrast, in Panel (b), where the p-values are mentioned in the later part of each article,
we observe weak evidence of kink at 0.05. The results from this exercise thus provide strong
evidence of p-hacking.
5.2. P-hacking among archival accounting research
We have documented the existence of p-hacking among experimental accounting studies.
Potential readers of our paper will naturally concern that p-hacking also exists among archival
accounting research, given that archival accounting researchers also have flexibility over data
analyses and strong incentive to generate top journal publications.
To answer this question, we randomly select 260 articles from each of the top three
accounting journals TAR, JAR, and JAE (Journal of Accounting and Economics). Initially, we
attempt to collect p-values from the text of these 780 articles using the same Python script.
However, we are able to scrape only 232 p-values from 76 articles, because unlike experimental
studies, archival studies generally do not mention p-values within text. The sample is too small
to make meaningful inference about the existence of p-hacking among those articles.

18
We then expand the sample by manually collecting p-values from 42 articles (among the
76) that report p-values in tables of regression analyses. For a regression table, we record all of
its p-values below 0.15 except those for intercepts, this method yields 2,377 p-values.
The histogram for these p-values is presented in Figure 11. We find that the distribution
of p-values is extremely uneven and right-skewed: the proportion of p-values below or equal to
0.0025 accounts for 38.7% of the total number of p-values. Different from results based on
experimental studies, we do not observe a discontinuity at 0.05 here. The high frequency of p-
values near zero is probably due to the high statistical power from large sample size available to
archival studies. Alternatively, it is possible that the archival articles aim for the highest level of
significance when doing p-hacking.
In sum, though we do not observe a sharp discontinuity at 0.05 on the histogram of p-
values from archival accounting articles, we cannot rule out the possibility that those studies aim
for the highest statistical significance level (p-values near zero) while doing p-hacking.
6. Conclusion
We uncover a discontinuity at 0.05 in the pooled cross-sectional distribution of p-values
from experimental accounting studies, and we interpret the discontinuity as a result of accounting
experimentalists’ practice of p-hacking to generate significant results. The extent of p-hacking is
more pronounced when authors face pressure of tenure, among male researchers, and when a
researcher works alone. Furthermore, researchers graduated from higher-ranking schools seem
to be less aggressive in p-hacking.
The results in this paper may underestimate the true extent of p-hacking due to the
following reasons. First, our sample could be biased because we use p-values mentioned in the

19
text of articles by researchers, and the decision to mention a p-value in text is made by
researchers. Arguably, researchers would like to discuss the most significant results in the paper,
and are reluctant to emphasize a p-value that is just above the 0.05 water mark. Second, we only
use articles published from two of the most prestigious accounting journals, it is reasonable to
suspect that articles published on lower-tiered journals are also subject to similar, or even higher
extent of p-hacking than we documented here. Lastly, we focus only on discontinuity at 0.05, it
is not impossible that some researchers aim for higher p-value targets such as 0.04, 0.03 or even
0.01 to avoid being too close to the 0.05 red line. However, such practice is much harder to
detect because aiming for higher significance level will cause a more right-skewed p-value
distribution, which can also be explained by publication bias.
Our results have implications for the experimental accounting research community.
Though academic fraud is very rare, our finding of a robust discontinuity at p-value = 0.05 is
indicative of widespread controversial practices that inflate the influence and significance level
of accounting results. In addition, because undisclosed flexibility in data collection and analyses
greatly facilitate p-hacking, our results highlight the importance of creating and maintaining
transparent research environment. Studies like Simmons, Nelson, and Simonsohn (2011), Head
et al. (2015), and Harvey (2017) have seriously discussed ways to mitigate the extent of p-
hacking. Many solutions from these works are disclosure-based. For example, authors should
provide transparent descriptions of their methods and data sets to help reviewers and readers
make informed decisions; if a research is pre-specified, then authors need to detail their
experimental design, methods of analyses before data collection, etc. We believe much of these
disclosure-based solutions are also relevant for experimental accounting research. To implement
them, however, will require coordination among researchers, journal editors, and referees.
20
References Bollen, N.P., Pool, V.K., 2009. Do hedge fund managers misreport returns? Evidence from the pooled
distribution. The Journal of Finance 64, 2257-2288
Burgstahler, D., Dichev, I., 1997. Earnings management to avoid earnings decreases and losses. Journal
of accounting and economics 24, 99-126
Byrnes, J.P., Miller, D.C., Schafer, W.D., 1999. Gender differences in risk taking: A meta-analysis.
American Psychological Association
Charness, G., Gneezy, U., 2012. Strong evidence for gender differences in risk taking. Journal of
Economic Behavior & Organization 83, 50-58
Dyckman, T.R., Zeff, S.A., 2014. Some methodological deficiencies in empirical research articles in
accounting. Accounting Horizons 28, 695-712
Faccio, M., Marchica, M.-T., Mura, R., 2016. CEO gender, corporate risk-taking, and the efficiency of
capital allocation. Journal of Corporate Finance 39, 193-209
Harvey, C.R., 2017. Presidential Address: The Scientific Outlook in Financial Economics. The Journal of
Finance 72, 1399-1440
Harvey, C.R., Liu, Y., Zhu, H., 2016. … and the cross-section of expected returns. The Review of
Financial Studies 29, 5-68
Head, M.L., Holman, L., Lanfear, R., Kahn, A.T., Jennions, M.D., 2015. The extent and consequences of
p-hacking in science. PLoS biology 13, e1002106
Krawczyk, M., 2015. The search for significance: a few peculiarities in the distribution of P values in
experimental psychology literature. PloS one 10, e0127872
Masicampo, E., Lalande, D.R., 2012. A peculiar prevalence of p values just below. 05. The Quarterly
Journal of Experimental Psychology 65, 2271-2279
Simmons, J.P., Nelson, L.D., Simonsohn, U., 2011. False-positive psychology: Undisclosed flexibility in
data collection and analysis allows presenting anything as significant. Psychological science 22,
1359-1366
Simonsohn, U., Nelson, L.D., Simmons, J.P., 2014. P-curve: a key to the file-drawer. Journal of
Experimental Psychology: General 143, 534

21
Figure 1. Empirical distribution of all p-values from 1990 to 2016.
Bin width is 0.0025. The distribution interval widths are 0.0025 and the bold bar indicate
frequency of p-values ϵ (0.0475, 0.05].

22
(a) Only including p-values reported with two decimal places
(b) Rounding all p-values to two decimal places
Figure 2. Isolating p-values reported with two decimal places.
In (a), we use only p-values reported with two decimal places; in (b) we round all p-values
and use the rounded values to generate the histogram.

23
(a) Only including p-values reported with two decimal places
(b) Rounding all p-values to two decimal places
Figure 3. Fitting histogram of p-values to exponential distribution
Red line represents the fitted exponential curve that minimize the squared fitting errors;
grey triangular represents the frequency of each observed p-value on x-axis. The
exponential function in (a) and (b) are 𝑦 = 205.49𝑒−17.65𝑥 and 𝑦 = 458.464𝑒−21.96𝑥 ,
respectively.

24
(a) Articles without tenured authors
(b) Articles with tenured authors
Figure 4. Does tenure reward incentivize p-hacking?
This figure reports the results of fitting p-value histograms to exponential distribution for two
subsamples. The subsample in Panel (a) includes only articles without tenured authors; the
subsample in Panel (b) includes the rest.

25
(a) Papers that do not have female authors
(b) Papers that have female author(s)
Figure 5. Are authors’ gender related to the extent of p-hacking?
The subsample in Panel (a) includes articles without female author(s); the subsample in
Panel (b) includes the rest.

26
(a) Papers that are sole works
(b) Papers that are not sole works
Figure 6. Do sole works exhibit higher extent of p-hacking?
We isolate sole work to examine how the extent of p-hacking varies depending on number of
authors. (a) contains papers that have more than one authors, and (b) contains sole works.

27
(a) Low affiliated school ranking
(b) High affiliated school ranking
Figure 7. Are rankings of authors’ affiliated school related to the extent of p-hacking?
We create a variable that records the highest ranking among the author(s)’ affiliated school
for each article, and then obtain the sample median of this variable. (a) contains papers that
have above median value of this variable, and (b) contains the rest.

28
(a) Low graduation school ranking
(b) High graduation school ranking
Figure 8. Are rankings of authors’ graduation school related to the extent of p-
hacking?
We create a variable that records the highest ranking among the author(s)’ graduation school(s)
for each article, and then obtain the sample median of this variable. (a) contains papers that
have below median value of this variable, and (b) contains the rest.

29
(a) Papers with number of participants below sample median
(b) Papers with number of participants above sample median
Figure 9. Is number of participants related the extent of p-hacking?
We classify all papers into two groups based on sample median of participants in their
experiments. (a) contains papers that have below median number of participants, and (b)
contains the rest.

30
(a) P-values appeared in the earlier part of an article
(b) P-values appeared in the later part of an article
Figure 10. Do main results of an article show higher degree of p-hacking?
For each article, we sort all of its p-values by the sequences they appear in that article, then
we identify the median value of the sequential number. (a) contains those p-values that appear
before each articles’ respective median sequential number, (b) contains the rest.

31
Figure 11. Histogram of p-values from archival accounting studies.
The figure presents the histogram of 2,377 p-values manually collected from 42 archival
accounting studies. The bin width is 0.0025, and the bold bar near zero represents frequency
of p-values below 0.0025.
32
Table 1. Summary statistics at the article-level.
This table displays summary statistics for author and paper characteristics. “Number of author(s)” is the
number of listed author(s) for a paper, “Contain female author(s)” is a dummy variable that equals to one
if the listed author(s) contain at least one female, and zero otherwise, “Participants” is the number of
subjects participated in a paper’s experiments, “Number of p-values” is the total number of p-values scraped
from a paper, “Sole paper” is a dummy variable that equals to one if a paper contain only one author, and
zero otherwise; “Proportion of tenured authors” is the fraction of authors that are tenured among all authors
of a paper. “Mean (ranking)” is the average ranking of the affiliated schools of all authors for a paper;
“Mean (year since graduation)” is the average number of years since graduation for all authors of a paper.
N mean p25 p50 p75
Full sample
Number of authors 219 2.178 1.000 2.000 3.000
Contain female authors 219 0.511 0.000 1.000 1.000
Participants 213 120.178 70.000 100.000 142.000
Number of p-values 219 10.205 4.000 8.000 14.000
Two-tailed p-value? 219 0.342 0.000 0.000 1.000
Sole 219 0.292 0.000 0.000 1.000
Proportion of tenured authors 214 0.516 0.000 0.500 1.000
Mean(ranking) 219 45.563 19.000 39.000 67.667
Mean(graduation school ranking) 208 29.396 14.583 22.125 37.000
JAR
Number of author(s) 72 2.208 2.000 2.000 3.000
Contain female author(s) 72 0.500 0.000 0.500 1.000
Participants 70 119.186 78.000 106.000 144.000
Number of p-values 72 11.472 4.500 11.000 15.000
Two-tailed p-value? 72 0.431 0.000 0.000 1.000
Sole paper 72 0.236 0.000 0.000 0.000
Proportion of tenured authors 70 0.529 0.333 0.500 1.000
Mean(ranking) 72 38.277 17.250 33.250 49.000
Mean(graduation school ranking) 70 24.895 12.000 18.000 31.333
TAR
Number of authors 147 2.163 1.000 2.000 3.000
Contain female authors 147 0.517 0.000 1.000 1.000
Participants 143 120.664 64.000 95.000 135.000
Number of p-values 147 9.585 4.000 8.000 13.000
Two-tailed p-value? 147 0.299 0.000 0.000 1.000
Sole paper 147 0.320 0.000 0.000 1.000
Proportion of tenured authors 144 0.510 0.000 0.500 1.000
Mean(ranking) 147 49.132 20.000 48.500 75.000
Mean(graduation school ranking) 138 31.679 16.000 25.000 43.000

33
Table 2. The magnitude and statistical significance of p-hacking.
This table reports the results of post hoc pairwise comparison for the residuals from curve fit in Figure 3. We compare
the residuals at 0.05 and 0.06 to the residuals of the rest p-values. (1) is the observed frequencies for 0.05 and 0.06,
(2) is the forecasted frequency from the fitted exponential function. P-value in the last column is the p-value of mean
difference between the residual of focal p-value (0.05 or 0.06) and the reference group, and is adjusted for multiple
comparison.
p-value (1)
Freq.
(2)
Residual of curve fit
(Observed-predicted)
(2)/(1)
p-value of post hoc
pairwise comparison
(1): Only including p-values reported with two decimal places
0.05 116 31 26.72% 0.010 **
0.06 52 30 -38.46% 0.134
(2): Rounding all p-values to two decimal places
0.05 213 53 24.88% 0.044 **
0.06 114 -15 -13.16% 0.779

34
Table 3. Comparing the extent of p-hacking across various subsamples.
This table provides results of post hoc pairwise comparison for each histogram in each pair of subsamples
in Section 4. For each histogram in pair of subsamples, we derive the residuals of exponential fit for every
p-value, and then compare the residual at 0.05 and 0.06 with the mean residuals of the rest 14 p-values.
Results for 0.06 are all insignificant and thus omitted. (1) is the observed frequencies for 0.05, (2) is the
forecasted frequency from the fitted exponential function. The last column is the p-value of difference between the
residual at 0.05 and the mean residuals for p-values in the reference group.
Subsamples (1)
Freq. of 0.05
(2)
Residual from curve fit
(Observed-predicted)
(2)/(1) p-value of post hoc
pairwise comparison
(1): Authors’ career concern: at least one tenured authors
YES 109 16 14.68% 0.134
NO 54 26 48.15% 0.070 *
(2): Authors gender: contain female authors?
YES 100 16 16.00% 0.135
NO 100 32 32.00% 0.068 *
(3): Is an article sole authored?
YES 60 28 46.67% 0.056 *
NO 140 23 16.43% 0.131
(4): Highest ranking of author-affiliated schools for an article
Low 90 10 11.11% 0.527
High 110 37 33.64% 0.011 **
(5): Highest ranking of authors’ graduation schools for an article
Low 76 10 13.16% 0.461
High 75 27 36.00% 0.078 *
(6): Number of participants in an article’s experiment(s)
Low 98 19 19.39% 0.068 *
High 100 28 28.00% 0.082 *
(7): Sequences of p-values appeared in an article
Earlier part 104 40 38.46% 0.035 **
Latter part 96 8 8.33% 0.621