p- and -wave detection thresholds, pn velocity estimate ...del/d_pubs/bssa04.pdf · 665 bulletin of...
TRANSCRIPT

665
Bulletin of the Seismological Society of America, Vol. 94, No. 2, pp. 665–677, April 2004
P- and T-Wave Detection Thresholds, Pn Velocity Estimate, and Detection
of Lower Mantle and Core P-Waves on Ocean Sound-Channel
Hydrophones at the Mid-Atlantic Ridge
by R. P. Dziak, D. R. Bohnenstiehl, H. Matsumoto, C. G. Fox, D. K. Smith, M. Tolstoy,T-K Lau, J. H. Haxel, and M. J. Fowler
Abstract Since 1999 six Sound Fixing and Ranging (SOFAR) hydrophones havebeen moored along the Mid-Atlantic Ridge (MAR) (15�–35� N). These hydrophones(8-bit data resolution) are designed for long-term monitoring of MAR seismicity usingthe acoustic T waves of seafloor earthquakes. The completeness level of the MAR T-wave earthquake catalog estimated from size–frequency constraints is mb � 3.0, asignificant improvement in detection compared to the mb 4.6 completeness levelestimated from National Earthquake Information Center magnitude–frequency data.The hydrophones also detect the acoustic phase of converted upper mantle P arrivalsfrom regional earthquakes at epicentral distances of 374–1771 km and from eventsas small as mb 3.6. These regional P waves are used to estimate a Pn velocity of 8.0� 0.1 km sec�1 along the east and west MAR flanks. An unexpected result was theidentification of P arrivals from earthquakes outside the Atlantic Ocean basin. Thehydrophones detected P waves from global earthquakes with magnitudes of 5.8–8.3at epicentral distances ranging from 29.6� to 167.2�. Examination of travel timessuggests these teleseismic P waves constitute the suite of body-wave arrivals fromdirect mantle P to outer- and inner-core reflected/refracted phases. The amplitudesof the teleseismic P waves also exhibit the typical solid-earth wave field phenomenaof a P shadow zone and caustic at D � 144�. These instruments offer a long-term,relatively low-cost alternative to ocean-bottom seismometers that allows for obser-vation of Pn velocities and mantle/core phases arriving at normally inaccessible deep-sea locations.
Introduction
In February 1999, a consortium of U.S. investigators(National Science Foundation and National Oceanic and At-mospheric Administration) began long-term monitoring ofMid-Atlantic Ridge (MAR) seismicity between 15� N and35� N. The experiment uses six autonomous hydrophonesmoored within the Sound Fixing and Ranging (SOFAR)channel on the MAR flanks. The hydrophones were designedto record the hydroacoustic tertiary phase or T wave of oce-anic earthquakes and estimate the acoustic location of theseearthquakes from throughout the Atlantic Ocean basin(Smith et al., 2002, 2003). Since acoustic T waves obeycylindrical spreading (r�1) energy loss as opposed to thespherical spreading (r�2) of solid-earth seismic P waves,sound-channel hydrophones can often detect smaller andtherefore more numerous earthquakes than land-based seis-mic networks (Johnson et al., 1968; Fox et al., 1994). Thushydroacoustic techniques can be invaluable for global seis-mic monitoring efforts because of their potential to reduce
earthquake detection thresholds and because hydrophone ar-rays are easier to install on the seafloor than geophones.Seismic coverage in the Atlantic and other ocean basins issparse because permanent installations are restricted largelyto islands, thereby limiting our understanding of seismicityin the deep ocean and significant portions of the Earth (Kan-amori, 1988).
In addition to T waves, ocean hydrophones commonlydetect solid-earth P waves from regional (Dziak et al., 1997;Sohn and Hildebrand, 2001) and teleseismic earthquakes(Pulli and Upton, 2002). Dziak et al. (1997) and Sohn andHildebrand (2001) used U.S. Navy hydrophones mountedon the seafloor to detect regional P waves at the crust–oceaninterface in the northeast Pacific and Arctic Oceans, respec-tively. These studies used the P and T waves of oceanicearthquakes to estimate locations and detection thresholdsand to develop seismic and acoustic magnitude scaling re-lationships. Walker et al. (1983) and Slack et al. (1999) have

666 R. P. Dziak, D. R. Bohnenstiehl, H. Matsumoto, C. G. Fox, D. K. Smith, M. Tolstoy, T-K Lau, J. H. Haxel, and M. J. Fowler
demonstrated that seafloor-mounted hydrophones can alsobe used to measure Pn velocities of oceanic lithosphere byrecording the arrival time of P waves from regional earth-quakes in the west and northeast Pacific Ocean. Quality Pnestimates are rare in the deep-ocean basins owing to the dif-ficulty in placing seismometers on the ocean floor for ex-tended periods of time. Pulli and Upton (2002) showed thathydrophones anchored to the seafloor and suspended viafloats (moored) within the sound channel in the Indian Oceanalso were effective at detecting direct upper mantle P wavesfrom a large (Mw 7.8) teleseismic earthquake (D � 30�). Themantle P waves from this event were converted to an acous-tic wave at the crust–ocean interface beneath the hydro-phones, and at the time this was the largest epicentral dis-tance over which P waves had been recorded on SOFARhydrophones.
This article presents an assessment of the waveform de-tection capability of the MAR moored hydrophones by ex-amining the P- and T-wave records of 84 regional MAR andteleseismic earthquakes (Fig. 1). The regional P-wave arrivaltimes on the hydrophone array are used to estimate Pn ve-locity along the east and west flanks of the MAR and toexamine the detection capabilities (magnitude of complete-ness) of the T-wave earthquake catalog for the MAR. More-over we will show evidence that hydrophones suspended inthe SOFAR channel are capable of recording P waves withray paths through the outer and inner core as well as theupper mantle.
Hydrophone and Mooring Specifications
A schematic diagram of the autonomous hydrophoneinstrument and mooring is shown in Figure 2. The hydro-phone instrument package includes a single ceramic hydro-phone, a filter/amplifier stage, accurate clock, and processormodified from off-the-shelf hardware. During the 1999–2003 MAR deployments, the instrument was set to record 8-bit data resolution at 110 Hz (1 to 55-Hz bandpass), allowingdata to be recorded for 400 days. The instrument is nowcapable of recording 16-bit resolution data at 250 Hz (1 to110-Hz bandpass) for periods of up to 2.5 yr. The hydro-phone and preamplifier together have a flat frequency re-sponse over the passband, but the low-end frequency beginsto rolloff at 0.6 Hz.
The digital section is based on an off-the-shelf loggingcomputer (CF1 from Persistor Inc.) with an additional circuitcard developed to allow writing to a maximum of five 2.5�hard-disk drives through an Intelligent Drive Electronics(IDE) interface. Current disk technology allows for five 8-Gb-capacity drives, or a total of 40 Gb total storage. Accu-rate timing is provided by a temperature-correcting crystaloscillator with an average drift of 400 msec during a typicalyear-long deployment. The analog filter/amplifier section isdesigned to prewhiten the ocean ambient noise spectrum.The analog section is isolated from the digital section by thebattery pack. The electronics are powered by 168 standard
alkaline D-cell batteries, which are replaced on the researchvessel during redeployments.
The field package includes a custom pressure case man-ufactured from aircraft titanium tubing that can be deployedto depths of 1200 m. The titanium construction minimizescorrosion and allows repeated deployments without onshorerefurbishment. The instrument case is attached to a standardoceanographic mooring (Fig. 2) with anchor, acoustic re-lease, and mooring line premeasured to place the sensor atthe proper water depth within the ocean sound channel(�900–1000 m in the Atlantic). A syntactic foam float sus-pends the mooring above the seafloor. A small pressure andtemperature recorder is attached to the mooring line belowthe float to record the depth should dramatic hydrophonedepth changes occur in response to stronger-than-normalcurrents.
Hydroacoustic Phases
Hydrophones moored in the ocean sound channel recordnot only the hydroacoustic T waves of regional oceanicearthquakes, but also the acoustic-converted P waves fromregional and teleseismic events. The likely propagation pathsfor the T, regional P, and teleseismic P arrivals are shownschematically in Figure 2. The regional P wave has anoblique incidence angle and propagates laterally toward thehydrophones along the Moho as evidenced by the relativelylarge arrival time differences (2–3 min) across the hydro-phone array. In contrast, the teleseismic P waves have rela-tively small (�20 sec) arrival time differences across thehydrophone array, suggesting they have a near vertical in-cidence angle at the seafloor. The vertical incidence likelyresults in a large transfer of seismic to acoustic energy at theseafloor–ocean interface since particle motion for the seis-mic wave should be near maximum. Examples of these ar-rivals recorded on the hydrophones are presented and dis-cussed in the following sections.
Regional Atlantic Ocean Earthquakes
The time series and frequency spectra of regional P- andT-wave arrivals from an mb 4.6 regional MAR earthquakeare shown in Figure 3. The seismic location of the earth-quake (National Earthquake Information Center [NEIC], on-line catalog) was between 3.7� and 14.9� epicentral distancefrom the hydrophones. The P arrivals are relatively broad-band (1–20 Hz) and have reasonable signal-to-noise (S/N)ratios and clear delay times across the hydrophone array re-flecting lateral propagation along the Moho discontinuity.The T waves, on the other hand, are broadband to the peakof the bandpass (1–55 Hz), have high S/N ratios, and arrivefrom 2.5 to 15 min after the P wave reflecting the slowerpropagation speed (mean of 1.49 km sec�1) of the acousticwaves through the sound channel. Figure 4 shows the P ar-rivals (Pn) of three other regional MAR earthquakes (mb 3.6,4.6, 5.8). The mb 3.6 earthquake is the smallest MAR eventdetected by the hydrophones (and closest with D � 374.3

P- and T-Wave Detection Thresholds, Pn Velocity Estimate, and Detection of Lower Mantle and Core P-Waves 667
Figure 1. Global map of 43 earthquakes (red circles) that produced P waves de-tected on the MAR hydrophone array. Blue stars show the hydrophone mooring loca-tions. Red circles within the hydrophone array show the 41 MAR earthquakes that alsoproduced detectable P waves, with magnitudes that range from mb 3.6 to Ms 6.3. Anmb of 3.6 is the MAR earthquake detection limit of land-based seismic networks for thenorth Atlantic Ocean (Bohnestiehl et al., 2003). Yellow circles show global mb �5.8earthquakes whose P waves were not detected on the MAR hydrophone array. Thesmallest teleseismic earthquakes to reliably produce detectable P waves had mb’s of5.8 and were located relatively close to the MAR (D � 65.8�) along the Middle Americaand Chile Trenches. White circles show earthquakes located by the MAR hydrophonesusing T waves, minimum of five hydrophones used for location solutions. Acousticshadowing caused by shallows associated with the Azores hotspot may influence de-tection and locations of MAR earthquakes north of the hydrophone array (�45� N).
km) that was also recorded by the NEIC. The dashed lineson each waveform show the Pn predicted arrival time fromIASPEI91 (Kennet and Engdahl, 1991) with the acousticpropagation time from the seafloor to the hydrophone added.The delay time expected in P arrival times from acousticconversion of the seismic phases at the seafloor interface andpropagation to the hydrophone through the water columnwas estimated using the distance from the seafloor to thehydrophone and dividing by the ocean sound velocity at eachhydrophone location available from the generalized digitalenvironmental model (GDEM) (Davis et al., 1986). Thesedelay times range from 1.9 to 2.7 sec due to differences inlength of the hydrophone moorings (3000–4200 m). In eachcase, the predicted Pn arrival times are 7–9 sec before thefirst high-amplitude phase above ambient noise observed onthe hydrophones. This difference in observed and predictedPn arrival time is probably caused by a combination of ve-
locity model and earthquake location error, and therefore weinterpret the high-amplitude phases as Pn arrivals. The insetof Figure 4c further illustrates the quality and good S/N ratioof the seismoacoustic Pn arrivals recorded on the hydro-phones. The large-amplitude arrival �40–44 sec after thePn seems likely to be a converted Sn arrival, where anoblique angle of incidence for the Sn arrival at the crust–ocean interface might result in significant vertical particlemotion and create a large-amplitude acoustic phase in thewater column. The onset of this phase is also �7–9 sec afterthe predicted International Association of Seismology andPhysics of the Earth’s Interior (IASPEI) 91 arrival time foran Sn. These differences in observed and predicted Sn arrivaltimes are also consistent with velocity and location error,and therefore it seems likely these phases are indeed Sn.
Pn velocities of the oceanic upper mantle have not beenmeasured often due to the difficulty in placing seismometers

668 R. P. Dziak, D. R. Bohnenstiehl, H. Matsumoto, C. G. Fox, D. K. Smith, M. Tolstoy, T-K Lau, J. H. Haxel, and M. J. Fowler
Figure 2. Diagram showing (a) hydrophone schematics and (b) mooring design andprobable seismic/acoustic propagation paths detected on the hydrophones. Preamplifier,digital logging section, and hard drives are contained within a titanium pressure casepowered by 150 D-cell batteries. The hydrophone instrument package is anchored tothe seafloor, then suspended in the SOFAR channel using a single large syntactic float.A ridge-crest earthquake produces seismic waves that propagate vertically through thecrust and convert to an acoustic phase at the seafloor–ocean interface. This acousticphase will then propagate into the sound-channel wave guide, becoming a T wave (Parkand Odom, 2001). Seismic phases from this earthquake also propagate along the Mohodiscontinuity (Pn) and convert to an acoustic phase near the hydrophone. Deep-mantleand core P arrivals from teleseismic events propagate vertically toward the seafloor–ocean interface and convert to an acoustic phase directly beneath the hydrophone.
on the ocean floor for extended periods of time. The regionalP-wave arrival times were used to estimate the Pn velocityof the uppermost mantle within the autonomous hydrophonearray, representing 48 individual ray paths traversing the eastand west flanks of the MAR (Fig. 5). To estimate Pn velocity,we minimized the error of the following summation solvingsimultaneously for velocity and earthquake origin time:
n2(P � (O � D /V)) , (1)� i i
i�0
where Pi is the seismic P-wave arrival time at n � 2–6hydrophones, Di is the geodesic distance from the earth-quake epicenter to the hydrophone, V is Pn velocity, and Ois the earthquake origin time. The hydroacoustic locations

P- and T-Wave Detection Thresholds, Pn Velocity Estimate, and Detection of Lower Mantle and Core P-Waves 669
Figure 3. Hydrophone time series and spectrograms showing Pn and T arrivals froman mb 4.6 MAR earthquake. Time series amplitude is in digital units. The spectrogramis unfiltered, has a frequency range of 1–55 Hz, and was produced using 1-sec timewindows of the hydrophone data. The earthquake occurred on 26 April 2000 and was10 km deep. The hydrophones ranged from 3.7� to 14.9� in epicentral distance, althoughthe Pn arrival is not clear on the south–west (bottom) hydrophone. The T waves fromearthquakes occurring at other portions of the MAR can also be seen in the time seriesand spectrograms, arriving within a few minutes before and after the T wave of the 26April event. Dashed line was added to highlight Pn arrivals on the hydrophones. AllMAR earthquakes available from NEIC during 1999–2001 have depths of 10 km. NEICdepths of 10 and 33 km represent fixed event depths, meaning in these cases there isgenerally little depth control for teleseismically located earthquakes.
of the MAR earthquakes were used in the Pn velocity cal-culation because they are often better constrained than theseismically derived locations. This is due to the relativelyslow acoustic speeds (�1475 m sec�1), the availability ofaccurate sound speed models based on decades of oceanicmeasurements, and the good azimuthal distribution of thehydrophones relative to deep-ocean plate boundaries like theMAR (Slack et al., 1999; Bohnenstiehl et al., 2003). Nev-ertheless, we solved for origin time because the hydro-acoustic origin time of the earthquake represents when the
T wave enters the ocean sound channel, which can be severaltens of seconds later than the actual seismic origin time(Slack et al., 1999; Dziak et al., 2000). The delay in the P-wave arrival time due to the acoustic propagation of com-pressional waves from the seafloor to the hydrophone wasagain removed from each P-wave arrival time before thevelocity and origin-time estimates were made. For the situ-ation when only two P arrival times were detected from anearthquake, equation (1) has a simple algebraic solution.Even for earthquakes with three or more P arrival times, the

670 R. P. Dziak, D. R. Bohnenstiehl, H. Matsumoto, C. G. Fox, D. K. Smith, M. Tolstoy, T-K Lau, J. H. Haxel, and M. J. Fowler
Figure 4. Examples of upper mantle Pwaves recorded on the SOFAR channel hydro-phones. The dashed lines show the predictedPn and Sn arrival times using the IASPEI91(Kennet and Engdahl, 1991) travel-time table.The arrival times were adjusted to account foracoustic propagation time from the seafloor toeach hydrophone using ocean-sound speedsavailable from GDEM (Davis et al., 1986) anddistances from the seafloor to the hydrophonesof 2700–3200 m. The time t � 0 on the dia-grams were selected to best display the arrivalphases and are not relative to event origin time.The IASPEI Pn arrival time is earlier than ob-served by (a) 7.5 sec, (b) 9.1 sec, and (c) 8.8sec. All time series have had a 3-Hz low-passfilter and cosine taper applied. Inset on panel(c) further illustrates the good quality and S/Nratio of Pn arrivals on the hydrophones. Thelater arriving high-amplitude phase within eachcoda is consistent with the arrival time of anacoustically converted Sn phase.
small number of instruments (six) in the array means thedegrees of freedom are low and statistical uncertainty is notparticularly well constrained. Once a solution for velocitywas obtained for an earthquake, the final Pn velocity wascalculated by finding the mean velocity of all events (eachweighted by the number of P arrivals recorded for a givenearthquake) resulting in a Pn velocity estimate of 8.0 � 0.1km sec�1. Similarly, the uncertainties from the nonlinearleast-squares method employed here were used to estimatethe mean Pn velocity uncertainty.
The Pn velocity estimated in this study is consistent(within error) with Pn velocity estimates of 8.0 km sec�1
measured by Purdy and Detrick (1986) along the MAR atthe Kane Fracture Zone (24� N), and the standard prelimi-nary reference earth model (PREM) value of 8.1 km sec�1
for lower oceanic crust/upper mantle (Dziewonski and An-derson, 1981). Young (�10 Ma) oceanic lithosphere haslower Pn velocities than older oceanic lithosphere (Purdyand Ewing, 1986), and therefore the slightly lower values ascompared to the PREM model may be due to the P wavessampling young ocean crust. In contrast, our MAR Pn ve-locity is higher than more recent Pn velocity estimates of7.5–7.9 km sec�1 along the MAR flanks at 35� N (Canaleset al., 2000) and 7.4 km sec�1 along the ridge axis from33.5� to 35� N (Hooft et al., 2000). The shot and receiverlocations for these two refraction experiments were within50 km of the MAR ridge axis, and therefore the lower Pnestimates are probably due to the younger and thinner oceanlithosphere being sampled.

P- and T-Wave Detection Thresholds, Pn Velocity Estimate, and Detection of Lower Mantle and Core P-Waves 671
Figure 5. Ray paths of Pn arrivals from the hy-droacoustic earthquake locations (circles) to the hy-drophones (stars) used to estimate Pn velocity alongthe east and west flanks of the MAR. A nonlinearleast-squares method was employed to derive the Pnvelocity estimate shown.
Global Earthquakes
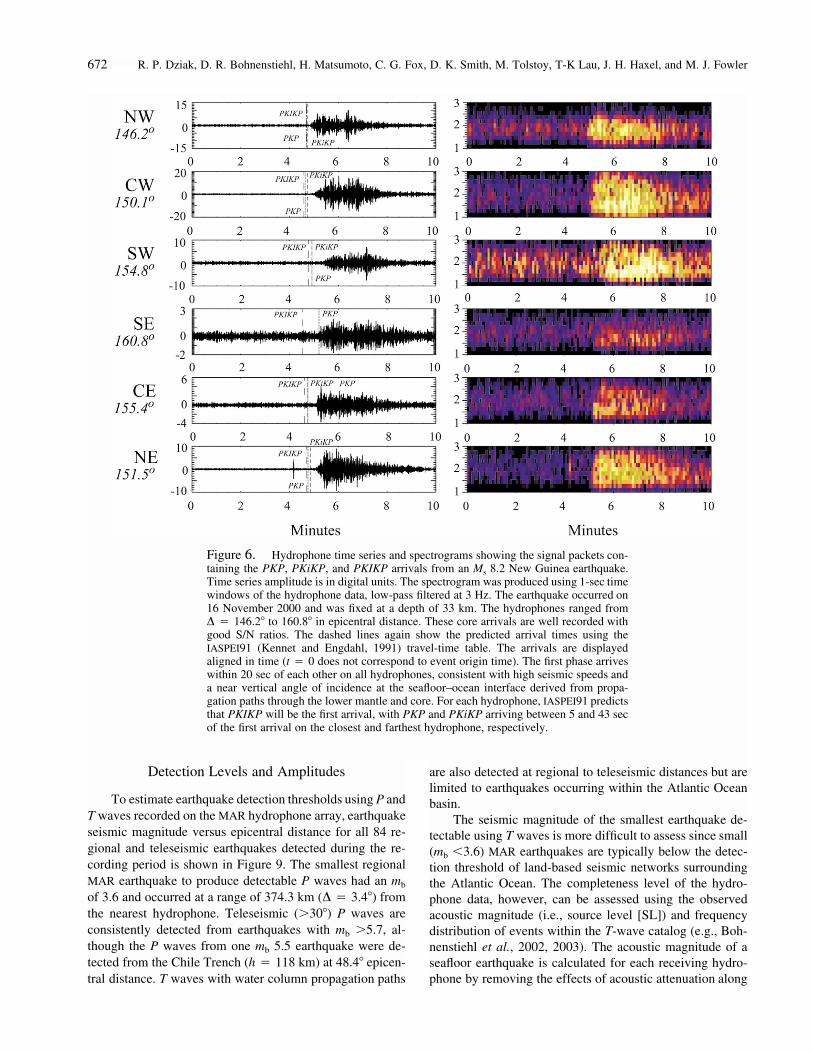
Searching the MAR hydrophone records for Pn arrivalsof regional Atlantic Ocean earthquakes resulted in the un-expected identification of teleseismic P-wave arrivals fromglobal earthquakes. For example, Figure 6 shows the timeseries and frequency spectra of the signal packets that shouldcontain outer- and inner-core arrivals from an Ms 8.2 earth-quake that occurred along the subduction zone near NewGuinea in the western Pacific Ocean. The earthquake oc-curred at epicentral distances between 146.2� and 160.8�from the hydrophones, and for earthquakes at large distances(D � 140�), IASPEI91 predicts that PKIKP, PKP, and PKiKPshould constitute the first arriving phases. These inner- andouter-core reflected/refracted arrivals are relatively narrow-band (1–3 Hz) but have reasonably good S/N ratios. Thephases arrive within 20 sec on all hydrophones in the arrayconsistent with high seismic speeds and a near vertical angleof incidence at the seafloor–ocean interface derived frompropagation paths through the lower mantle and core. Foreach hydrophone, IASPEI91 predicts that PKIKP will be the
first arrival, with PKP and PKiKP arriving from within 5–43 sec of the first arrival on the closest (northwest; D �146.2�) to the farthest (southeast; D � 160.8�) hydrophone.The long duration of the signal packet suggests these corephases are all likely recorded on each hydrophone, however,due to the complex nature of the time series, individualphases are not easily identifiable within the arrival coda. Theexception to this may be on the most distant (southeast) hy-drophone where only two phases, PKIKP and PKP, are ex-pected, and they arrive 43 sec apart. It appears from Figure6, despite the low S/N ratio of the time series and spectra,that there are two distinct arrival phases present on the south-east hydrophone.
Figures 7 and 8 show more detailed examples of thehydrophone records of the PKIKP, PKP, and PKiKP arrivalsfrom an Mw 8.3 Java Trench earthquake (D � 143.7�–149.4�; h � 33 km) and a direct mantle P arrival from anMw 7.0 Chile Trench earthquake (D � 47.7�–65.8�; h �608 km). All of these phases were recorded with good S/Nratios. As with the regional Pn arrivals, the dashed lines inFigures 7 and 8 show the expected arrival times of the lowermantle and core phases estimated using the IASPEI91 traveltimes (Kennet and Engdahl, 1991). The expected phase ar-rival times were again adjusted for the acoustic propagationfrom the seafloor to the hydrophones. The direct P and theinner-core refracted PKIKP are the predicted first arrivals(for the Chile and Java Trench earthquakes, respectively),and their estimated arrival times are �15 and 18–23 secearlier than the first high-amplitude arrival above ambientnoise observed on the hydrophones. This difference in ob-served and predicted arrival times is again consistent witherror in the velocity model and earthquake location, andtherefore it seems likely these phases are direct P andPKIKP. Indeed, the Harvard moment tensor catalog indi-cates the centroid origin times for the Chile and Java earth-quakes are 6.1 and 20.3 sec later than the hypocenter origintimes. This difference in origin time alone accounts for asignificant portion of the delay in the observed arrival times.In addition, the PKiKP (reflection off the surface of the innercore) and PKP (refraction through the outer core) phasesfrom the Java Trench earthquake should arrive 2–5 and5–10 sec, respectively, after PKIKP and may be the high-amplitude phases apparent within the coda of the arrival on-set (Fig. 7). In our hydrophone records, however, we foundthat PKP and PKiKP could not be easily distinguished fromthe PKIKP arrival. It may be that these arrivals are not clearon hydrophone records (i.e., the long duration of the coda)due to reverberation at the seafloor/ocean interface at a verylarge circular area beneath the hydrophone. Unlike the re-gional Pn phases, the lower mantle and core phases shouldbe a planar wavefront when intersecting the seafloor sincethey are arriving at a nearly vertical incidence angle, mean-ing a much larger area of the seafloor is ensonified (andhence there are more point sources for acoustic scattering),complicating the acoustic arrivals.
672 R. P. Dziak, D. R. Bohnenstiehl, H. Matsumoto, C. G. Fox, D. K. Smith, M. Tolstoy, T-K Lau, J. H. Haxel, and M. J. Fowler
Figure 6. Hydrophone time series and spectrograms showing the signal packets con-taining the PKP, PKiKP, and PKIKP arrivals from an Ms 8.2 New Guinea earthquake.Time series amplitude is in digital units. The spectrogram was produced using 1-sec timewindows of the hydrophone data, low-pass filtered at 3 Hz. The earthquake occurred on16 November 2000 and was fixed at a depth of 33 km. The hydrophones ranged fromD � 146.2� to 160.8� in epicentral distance. These core arrivals are well recorded withgood S/N ratios. The dashed lines again show the predicted arrival times using theIASPEI91 (Kennet and Engdahl, 1991) travel-time table. The arrivals are displayedaligned in time (t � 0 does not correspond to event origin time). The first phase arriveswithin 20 sec of each other on all hydrophones, consistent with high seismic speeds anda near vertical angle of incidence at the seafloor–ocean interface derived from propa-gation paths through the lower mantle and core. For each hydrophone, IASPEI91 predictsthat PKIKP will be the first arrival, with PKP and PKiKP arriving between 5 and 43 secof the first arrival on the closest and farthest hydrophone, respectively.
Detection Levels and Amplitudes
To estimate earthquake detection thresholds using P andT waves recorded on the MAR hydrophone array, earthquakeseismic magnitude versus epicentral distance for all 84 re-gional and teleseismic earthquakes detected during the re-cording period is shown in Figure 9. The smallest regionalMAR earthquake to produce detectable P waves had an mb
of 3.6 and occurred at a range of 374.3 km (D � 3.4�) fromthe nearest hydrophone. Teleseismic (�30�) P waves areconsistently detected from earthquakes with mb �5.7, al-though the P waves from one mb 5.5 earthquake were de-tected from the Chile Trench (h � 118 km) at 48.4� epicen-tral distance. T waves with water column propagation paths
are also detected at regional to teleseismic distances but arelimited to earthquakes occurring within the Atlantic Oceanbasin.
The seismic magnitude of the smallest earthquake de-tectable using T waves is more difficult to assess since small(mb �3.6) MAR earthquakes are typically below the detec-tion threshold of land-based seismic networks surroundingthe Atlantic Ocean. The completeness level of the hydro-phone data, however, can be assessed using the observedacoustic magnitude (i.e., source level [SL]) and frequencydistribution of events within the T-wave catalog (e.g., Boh-nenstiehl et al., 2002, 2003). The acoustic magnitude of aseafloor earthquake is calculated for each receiving hydro-phone by removing the effects of acoustic attenuation along

P- and T-Wave Detection Thresholds, Pn Velocity Estimate, and Detection of Lower Mantle and Core P-Waves 673
Figure 7. Time series of three MAR hydrophones that recorded core P arrivals fromthe 4 June 2000 Mw 8.3 Java Trench earthquake (h � 33 km). The time t � 0 on thediagrams were selected to best display the arrival phases and are not relative to eventorigin time. Dashed lines show the PKIKP, PKP, and PKiKP arrival times predictedusing the IASPEI91 travel-time table. The arrival times were adjusted to account foracoustic propagation time from the seafloor to each hydrophone. The IASPEI91 pre-dicted PKIKP arrival time is earlier than the observed first arrival times on the hydro-phones by (a) �18 sec, (b) 20 sec, and (c) 23 sec. PKP and PKiKP arrival times forthis event are between 2–5 and 5–10 sec, respectively, after the PKIKP arrival, sug-gesting these core phases are also part of the onset of the wave train.
the propagation path from source to receiver (sphericalspreading from seafloor to sound channel; cylindricalspreading along the sound-channel path) and the hydrophoneinstrument response from the T-wave signal packet (Dziak,2001). Source levels are measured in decibels relative tomicro-Pascals at 1 m and are the mean of all hydrophonesthat recorded the earthquake.
As shown in Figure 10a, the cumulative SL–frequencydistribution of the T-wave data is described by
log N(SL) � A � b SL, (2)t
where N is the number of T-wave events having source level�SL. The empirical constants A and bt reflect the total num-ber of earthquakes and distribution of the data, respectively.Since SL is a logarithmic measure of earthquake size, thisrelationship is consistent with a power-law moment–fre-quency distribution and bt is analogous to the b-value in thewell-known Gutenberg–Richter relationship. T-wave earth-quakes within the array, and at a distance �5� of the ridgeaxis between 15� and 35� N, exhibit a bt of �0.0678, andthe data depart from the scaling relationship given earlier forearthquakes with SL � 210 dB. This rolloff in the SL–
frequency distribution indicates a failure to consistently de-tect smaller events.
By extrapolating the Gutenberg–Richter relationshipobserved in land-based seismic catalogs, SL–frequency in-formation can be used to constrain the seismic magnitudeof completeness for the T-wave data. NEIC magnitude–frequency data from the area within the array are shownin Figure 10b (1973–2002, normalized per year). The dataexhibit a b-value of 1.29 and completeness level of mb 4.6.Projecting this relationship to lower magnitude scales sug-gests that an SL of 210 dB is equivalent to an mb �3.0earthquake, with an SL–magnitude relationship of SL �18.95M � 151.91. It can be seen in Figure 10a,b that thecompleteness level calculations from the frequency–magnitude data are subject to interpretation, thereby intro-ducing ambiguity to the completeness level estimates. It ap-pears, however, that T-wave data represent an improvementin detection of �1.5 magnitude units relative to land-basedseismic data.
Previous studies have used a linear regression betweenSL and magnitude to derive similar relationships. For thisAtlantic hydrophone data, a linear regression of the SL andNEIC magnitude data yields the relationship SL � 6.93M

674 R. P. Dziak, D. R. Bohnenstiehl, H. Matsumoto, C. G. Fox, D. K. Smith, M. Tolstoy, T-K Lau, J. H. Haxel, and M. J. Fowler
Figure 8. Time series of the direct mantle P-wave arrival from 23 April 2000 Mw
7.0 Chile Trench earthquake (h � 608 km) recorded on three MAR hydrophones. Thetime t � 0 on the diagrams were selected to best display the arrival phases and are notrelative to event origin time. The IASPEI predicted P arrival time (dashed line) is earlierthan the observed by �15.1 sec on all hydrophones. The arrivals from this earthquakewere exceptionally high amplitude compared to other equivalent-sized earthquakes atsimilar epicentral distances but from different source regions (see Fig. 11). This sug-gests the source orientation of the earthquake may have contributed to the high-am-plitude arrivals. No clear depth phase pP wave was observed later in the P-wave coda.
� 199.65. This is similar to the SL–magnitude relationshipderived for an equivalent hydrophone array along the equa-torial East Pacific Rise, where magnitude data in the rangemb 3.5–4.7 were fit linearly versus SL (Fox et al., 2001). Forthese 8-bit instruments, however, many of the large-magni-tude events have clipped T-wave arrivals on some or all ofthe hydrophones (as discussed later). Consequently, the SLscale is expected to saturate, and SL and magnitude are onlyweakly correlated with an R2 of 0.43 (Fig. 10c). Extrapolat-ing the relationship derived from this regression to smallerevents implies that the 210 dB is equivalent to an mb �1.5earthquake in the Atlantic. However, if the array consistentlywere locating mb �1.5 earthquakes, we would expect on theorder of 105 detectable events each year. This is significantlymore than observed, and consequently we favor the com-pleteness level estimate of mb �3.0 (210 dB), as constrainedby the SL–frequency data.
To assess further the detection capability and dynamic
range of the hydrophones for recording P and T arrivals, thewaveform amplitudes (in digital units at 8-bit resolution) areshown as a function of epicentral distance in Figure 11. Toreduce spurious amplitude records, each P and T amplitudevalue shown represents the mean of the five maximum am-plitudes from the waveform packet. As expected, the P andT waves of earthquakes within the Atlantic Ocean basin (D� 30�) have the highest amplitude records and in many casesare clipped (122–128 digital units [D.U.]) by the recordingpackage. P-wave records on the hydrophones are clippedfrom Atlantic Ocean earthquakes up to an epicentral distanceof 20�, whereas T waves are clipped when Atlantic earth-quakes have body-wave magnitudes �4.8 or are within400 km (D � 3.6�) epicentral distance.
As discussed earlier, teleseismic P waves are also de-tected on the MAR hydrophone array from earthquakes oc-curring throughout the globe (D � 180�). The amplitudes ofthese global P waves exhibit the typical solid-earth wave

P- and T-Wave Detection Thresholds, Pn Velocity Estimate, and Detection of Lower Mantle and Core P-Waves 675
Figure 9. Magnitude versus epicentral dis-tance for regional and teleseismic earthquakesrecorded on the MAR hydrophone array. Body-wave magnitude is used for earthquakes �4.9;moment magnitude is used for earthquakes�5.0. A square indicates a P- and T-wave ar-rival were detected from an earthquake; a dia-mond indicates a P arrival only was detected.The sound-channel hydrophones consistentlyrecord the P and T arrivals of Atlantic Oceanbasin earthquakes with mb �3.5 and the Pwaves of teleseismic earthquakes with mb
�5.7.
field phenomena of a direct P shadow zone and a high-amplitude caustic at D � 144� due to the increase in P-wavespeed in the outer core (Kennett, 2001). Effects due to theouter-core caustic likely account for the high-amplitude ar-rivals from Philippine and Java Trench earthquakes. Deepearthquakes (h � 100 km) from the Middle America andChile Trenches produced the highest amplitude P waves re-corded on the hydrophones (47.7� � D � 65.8�) when com-pared to equivalent-sized earthquakes at similar epicentraldistances from other source regions. The cause of this is notperfectly understood, but it may be that deep earthquakesfrom Central and South American subduction zones have P-wave radiation patterns with the highest wave amplitude ori-ented toward the MAR hydrophone array. The Mw 7.0 ChileTrench earthquake has a northwest-striking, high-angle nor-mal fault moment tensor solution (NEIC, online catalog) con-sistent with this interpretation.
Summary
It has been well established that autonomous hydro-phones moored to the seafloor and suspended in the oceansound channel are capable of providing insights into seafloortectonovolcanic activity by detecting earthquakes below thethreshold of land-based seismic networks using hydroacous-tic phase propagation in the oceans. The improved detectioncapability afforded by sound-channel hydrophones has beenfurther demonstrated and quantified here, with T-wave dataproviding a lowering in earthquake detection threshold alongthe central MAR of �1.5 magnitude units relative to land-based seismic data. In addition, detection on the MAR hy-drophones of P waves from regional earthquakes providesan opportunity to make rare, deep-ocean measurements ofupper mantle velocity in ocean crust. A mean Pn velocity of
8.0 � 0.1 km sec�1 was estimated using 48 rays along theeast and west flanks of the MAR. The unexpected result pre-sented in this study was the first-time identification of deep-mantle and outer- and inner-core P-wave reflected/refractedphases recorded on SOFAR hydrophones. These instrumentsmay be of significant interest to the body-wave seismologyand seismic tomography communities since they offer along-term, relatively low-cost alternative to ocean-bottomseismometers that allows for observation of Pn velocitiesand mantle/core phases arriving at normally inaccessibledeep-sea locations. Although ocean-bottom seismometers(depending on epicentral distances and gain settings) shouldbe more effective at detecting seismic phases at the seafloor–ocean interface, one goal of our study has been to show thathydrophones can record useful information about seismicphases using an instrument that is in many cases cheaper tobuild and easier to deploy.
Acknowledgments
This research was supported by the National Science Foundation(OCE-0137164, OCE-0226444) and NOAA’s Vents Program (PMEL Con-tribution Number 2571). The Mid-Atlantic Ridge hydrophone time-seriesdata and T-wave earthquake catalog discussed in this study (as well as datafrom other global ocean experiments) are now available at www.pmel.noaa.gov/vents/acoustics/seismicity/seismicity.html.
References
Bohnenstiehl, D. R., M. Tolstoy, R. P. Dziak, C. G. Fox, and D. K. Smith(2002). Aftershocks in the mid-ocean ridge environment: an analysisusing hydroacoustic data, Tectonophysics 354, 49–70.
Bohnenstiehl, D. R., M. Tolstoy, D. K. Smith, C. G. Fox, and R. P. Dziak(2003). Time clustering behavior of earthquakes along the Mid-Atlantic Ridge 15�–35�N: observations from hydroacoustic monitor-ing, Phys. Earth Planet. Interiors 138, no. 2, 147–161.

676 R. P. Dziak, D. R. Bohnenstiehl, H. Matsumoto, C. G. Fox, D. K. Smith, M. Tolstoy, T-K Lau, J. H. Haxel, and M. J. Fowler
Figure 10. (a) SL–frequency distribution of the full anddeclustered T-wave catalog in 1-dB bins. Data include epi-centers located within 5� of the MAR axis between 15� and35� N, February 1999 through February 2001. The catalogwas declusted using a single-link algorithm with a combinedspace-time metric. T-wave size–frequency distribution is de-scribed by log N(SL) � A � btSL (see text). The parametersA and bt are determined based on the fit of the data relativeto a set of synthetic SL–frequency distributions calculatedwith a range a minimum SL thresholds. The completenesslevel is selected as the minimum SL threshold for which themisfit falls below some critical value (cf. Wiemer and Wyss,2000). Data with SL � 223 dB are excluded due to pro-gressive clipping of the hydrophone sensors. Both the fulland declustered catalogs display nearly identical bt valuesand a completeness level of 210 dB. (b) Magnitude–frequency data from the Preliminary Determination of Epi-centers catalog. Events within the hydrophone array are av-eraged for the period 1973–2002, with the y axis showingthe number of earthquakes per year. Maximum likelihood fitof these data indicates a b-value of 1.29 � 0.11. Extrapo-lating this relationship, the 210-dB completeness level of theT-wave data set is estimated to be mb �3.0, an improvementof �1.5 magnitude units relative to land-based seismic cat-alogs. (c) NEIC preferred magnitude (M) versus acoustic SL,with one standard deviation error bars. Black line indicatesa least-squares fit of these data. Gray line shows the SL–Mrelationship obtained from the size–frequency constraints inpanel (b).
Canales, J. P., R. S. Detrick, J. Lin, and J. A. Collins (2000). Crustal struc-ture and upper mantle seismic structure beneath the rift mountainsand across a nontransform offset at the Mid-Atlantic Ridge (35�N),J. Geophys. Res. 105, 2699–2719.
Centroid Moment Tensor Catalog, www.seismology.harvard.edu/CMTsearch.html (last accessed June 2003).
Davis, T. M., K. A. Countryman, and M. J. Carron (1986). Tailored acousticproducts untilizing the NAVOCEANO GDEM (a generalized digitalenvironmental model), in Proc. 36th Naval Symposium on Under-water Acoustics, Naval Ocean Systems Center, San Diego, California,March 27–29.
Dziak, R. P. (2001). Empirical relationship of T-wave energy and faultparameters of northeast Pacific Ocean earthquakes, Geophys. Res.Lett. 28, 2537–2540.
Dziak, R. P., C. G. Fox, H. Matsumoto, and A. E. Schreiner (1997). TheApril 1992 Cape Mendocino earthquake sequence: seismoacousticanalysis utilizing fixed hydrophone arrays, Mar. Geophys. Res. 19,137–162.
Dziak, R. P., C. G. Fox, R. W. Embley, J. L. Nabelek, J. Braunmiller, andR. A. Koski (2000). Recent tectonics of the Blanco Ridge, EasternBlanco Transform Fault Zone, Mar. Geophys. Res. 21, no. 5, 423–450.

P- and T-Wave Detection Thresholds, Pn Velocity Estimate, and Detection of Lower Mantle and Core P-Waves 677
Figure 11. Digital amplitude versus epi-central distance for regional and teleseismicearthquakes recorded on the MAR hydrophonearray. Black circles and open squares indicateP- and T-wave amplitudes, respectively.Dashed line shows mean ambient-noise levelduring recording period. P and T arrivals arerecorded with good S/N levels. Atlantic Oceanearthquakes produce clipped (122–128 D.U.amplitude) P waves up to 20� epicentral dis-tance and clipped T waves for earthquakes�400 km (D � 3.6�) distant or mb �4.8. Tele-seismic P-wave arrivals are recorded fromearthquakes throughout the globe (D � 180�).The P-wave shadow zone (95�–140�) is evidentas is the caustic (at D � 144�) due to the dropin P-wave speed in the outer core. Exception-ally high P-wave amplitudes (e.g., Mw 7.0Chile Trench earthquake) may be due to radi-ation pattern effects. No clear evidence of aninner-core refracted wave has been recordedyet. Abbreviations are M.A.T., Middle Amer-ica Trench; J.T., Java Trench; Phil, PhilippineTrench; C.T., Chile Trench.
Dziewonski, A. M., and D. L. Anderson (1981). Preliminary reference Earthmodel, Phys. Earth Planet. Interiors 25, 297–356.
Fox, C. G., R. P. Dziak, H. Matsumoto, and A. E. Schreiner (1994). Po-tential for monitoring low-level seismicity on the Juan de Fuca Ridgeusing military hydrophone arrays, Marine Tech. Soc. 27, 22–30.
Fox, C. G., H. Matsumoto, and T. K. A. Lau (2001). Monitoring PacificOcean seismicity from an autonomous hydrophone array, J. Geophys.Res. 106, 4183–4206.
Hooft, E. E. E., R. S. Detrick, D. R. Toomey, J. A. Collins, and J. Lin(2000). Crustal thickness and structure along three contrasting spread-ing segments of the Mid-Atlantic Ridge, 33.5�–35�N, J. Geophys. Res.105, 8205–8226.
Johnson, R. H., R. A. Norris, and F. K. Duennebier (1968). Abyssallygenerated T-phases, in The Crust and Upper Mantle of the PacificArea, C. L. Drake and P. J. Hart (Editors), American GeophysicalMonograph 12, 70–78.
Kanamori, H. (1988). Ocean-floor seismic stations and source mechanismstudies: broad-band downhole seismometers in the deep-ocean,Woods Hole Oceanographic Institution, 82–83.
Kennet, B. L. N. (2001). Introduction and Theoretical Development, in TheSeismic Wavefield, Vol. 1, Cambridge U Press, New York, 370 pp.
Kennet, B. L. N., and E. R. Engdahl (1991). Travel times for global earth-quake location and phase association, Geophys. J. Int. 105, 429–465.
Park, M.-K., and R. Odom (2001). Modal scattering: a key to understandingoceanic T-waves, Geophys. Res. Lett. 28, no. 17, 3401–3404.
Pulli, J. J., and Z. M. Upton (2002). Hydroacoustic observations of Indianearthquake provide new data on T-waves, EOS 83, no. 13, 145–150.
Purdy, G. M., and R. S. Detrick (1986). Crustal structure of the Mid-Atlantic Ridge at 23�N from seismic refraction studies, J. Geophys.Res. 3739–3762.
Purdy, G. M., and J. Ewing (1986). Seismic structure of the ocean crust, inThe Western North Atlantic Region, in The Geology of North America,P. R. Vogt and B. E. Tucholke (Editors), Vol. M, Geological Societyof America, Boulder, Colorado.
Slack, P. D., C. G. Fox, and R. P. Dziak (1999). P-wave detection thresh-olds, Pn velocity estimates, and T-wave location uncertainty fromoceanic hydrophone arrays, J. Geophy. Res. 104, 13,061–13,072.
Sohn, R. A., and J. A. Hildebrand (2001). Hydroacoustic earthquake de-
tection in the Arctic Basin with the Spinnaker Array, Bull. Seism. Soc.Am. 91, 572–579.
Smith, D. K., M. Tolstoy, C. G. Fox, D. R. Bohnenstiehl, H. Matsumoto,and M. J. Fowler (2002). Hydroacoustic monitoring of seismicity atthe slow-spreading Mid-Atlantic Ridge, Geophys. Res. Lett. 29,no. 12, 10.1029/2001GL013912.
Smith, D. K., J. Escartin, M. Cannat, M. Tolstoy, C. G. Fox, D. R. Boh-nenstiehl, and S. Bazin (2003). Spatial and temporal distribution ofseismicity along the northern Mid-Atlantic Ridge (15–35�N), J. Geo-phys. Res. 108, no. B3, 2167, 10.1029/2002JB001964.
Walker, D. A., C. S. McCreery, and G. H. Sutton (1983). Spectral char-acteristics of high frequency Pn and Sn phases in the western Pacific,J. Geophys. Res. 88, 4289–4298.
Wiemer, S., and M. Wyss (2000). Minimum magnitude of completeness inearthquake catalogs: examples from Alaska, the western UnitedStates, and Japan, Bull. Seism. Soc. Am. 90, 859–869.
Oregon State University/NOAAHatfield Marine Science CenterNewport, Oregon 97365
(R.P.D., H.M., T-K L., J.H.H., M.J.F.)
Lamont–Doherty Earth ObservatoryColumbia UniversityPalisades, New York 10964
(D.R.B., M.T.)
NOAA/Pacific Marine Environmental LaboratoryHatfield Marine Science CenterNewport, Oregon 97365
(C.G.F.)
Woods Hole Oceanographic InstitutionWoods Hole, Massachusetts 02540
(D.K.S.)
Manuscript received 30 July 2003.