ozone-fev1 dose-response analysis · 1 ozone-fev 1 dose-response analysis introduction.clinical...
TRANSCRIPT
1
Ozone-FEV1 Dose-Response Analysis
Introduction. Clinical studies of human responses to ozone have been conducted for decades. These studies have investigated many health endpoints, including spirometric responses (i.e., lung function), symptoms, inflammation, airway hyper-responsiveness and changes in epithelial permeability (US EPA 2013, Chapter 5). The most studied endpoint has been forced expiratory volume in 1 second (FEV1). FEV1 is a measure of lung function that has been consistently and reliably measured in many ozone human clinical studies, and it shows a dose-response relationship with ozone. There is an expansive literature of human clinical exposures studies and ozone dose-response modeling, particular for ozone-FEV1 dose-response. The following analysis goes beyond previous dose-response models and applies the results to real-world exposures. This allows decision makers to apply the exposures used in human clinical experiments to exposures expected in the general population. This document was written to inform the experts and participants in the Independent Workshop on Ozone NAAQS Science and Policy (April 7-9, 2015), and we will present a summary of this analysis at the workshop in the scientific discussion about human clinical studies.
The analysis conducted herein produces a dose-response model that fits both healthy young adults and other populations, such as children and asthmatics. We calculated ozone thresholds at which specific group mean FEV1 decrements would be expected to occur, and also determined the number of people in the clinical experiments that experienced a greater-than-mean response to ozone at these thresholds. We compared these thresholds to the doses of ozone a person would be expected to attain during known exposure scenarios, given eight-hour maximum ambient ozone concentrations of 75, 70, or 65 parts per billion (ppb).
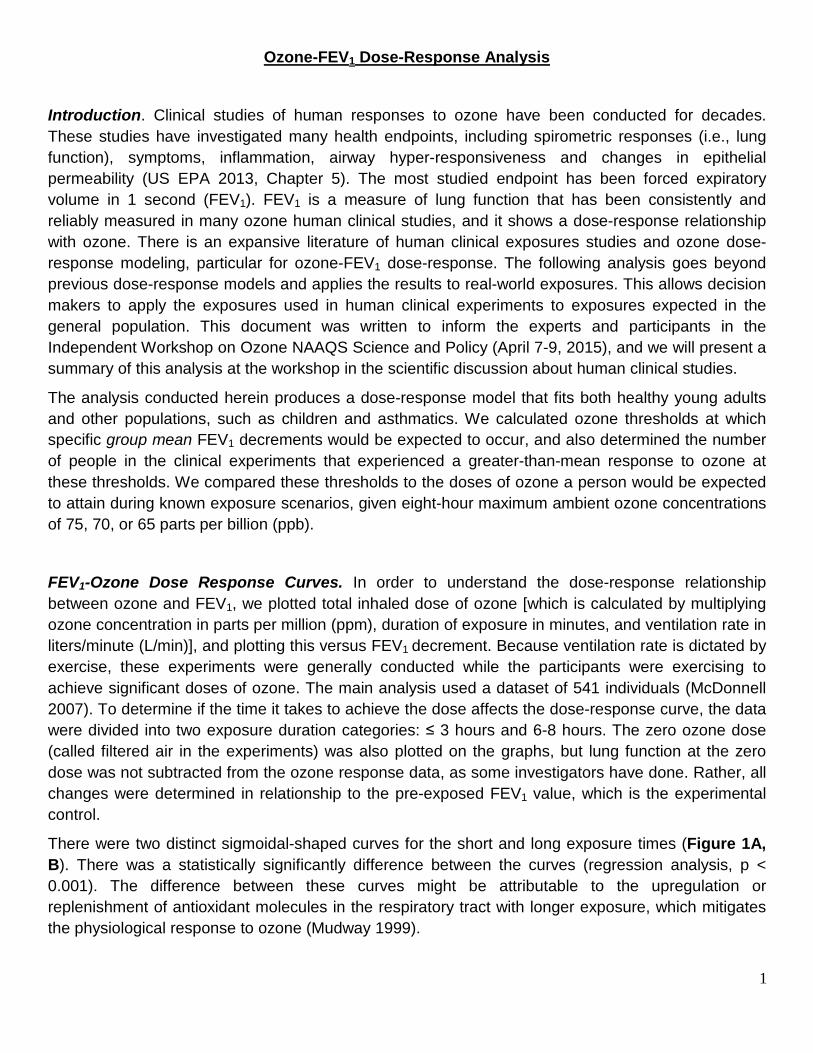
FEV1-Ozone Dose Response Curves. In order to understand the dose-response relationship between ozone and FEV1, we plotted total inhaled dose of ozone [which is calculated by multiplying ozone concentration in parts per million (ppm), duration of exposure in minutes, and ventilation rate in liters/minute (L/min)], and plotting this versus FEV1 decrement. Because ventilation rate is dictated by exercise, these experiments were generally conducted while the participants were exercising to achieve significant doses of ozone. The main analysis used a dataset of 541 individuals (McDonnell 2007). To determine if the time it takes to achieve the dose affects the dose-response curve, the data were divided into two exposure duration categories: ≤ 3 hours and 6-8 hours. The zero ozone dose (called filtered air in the experiments) was also plotted on the graphs, but lung function at the zero dose was not subtracted from the ozone response data, as some investigators have done. Rather, all changes were determined in relationship to the pre-exposed FEV1 value, which is the experimental control.
There were two distinct sigmoidal-shaped curves for the short and long exposure times (Figure 1A, B). There was a statistically significantly difference between the curves (regression analysis, p < 0.001). The difference between these curves might be attributable to the upregulation or replenishment of antioxidant molecules in the respiratory tract with longer exposure, which mitigates the physiological response to ozone (Mudway 1999).
2
A B
Figure 1. Ozone-FEV1 dose-response curves. (A) Plot of total inhaled dose (in ppm x L) versus mean percent change in FEV1 of healthy young adults exposed to ozone for ≤ 3 hours (short exposure, red diamonds and red trend line) or 6-8 hours (long exposure, blue diamonds and blue trend line) while exercising, with the equations associated with each curve below the graph; (B) The trend lines from A with 95% confidence intervals (dashed lines).
Ozone Threshold Doses. Using the best-fitting dose-response curves from Figure 1B, we calculated the doses at which 4 different mean FEV1 decrements (5%, 10%, 15% and 20%) would be expected to occur, and the results are summarized in Table 1. We evaluated these specific decrements in part because the EPA considers the range of 10-20% FEV1 decrements to be moderate (US EPA 1989), and has stated that a decrement of 10% might be adverse in a person with a pre-existing lung disease (US EPA 2014). Note that doses were not derived for a 15% or 20% FEV1 decrement from the long-exposure curve, because the curve plateaued at a smaller decrement. Similarly, no 20% FEV1 decrement dose was derived for the short-exposure curve, because that curve was never at or below 20%. Figure 1B also shows the presence of threshold doses at which no FEV1 response would be expected to occur (the 0% FEV1 threshold), at doses somewhere below 500 ppm x L. Such a threshold is consistent with the known ozone mode of action, in which antioxidants scavenge ozone in the epithelial lining fluid and prevent it from reacting and causing damage in the respiratory tract (see Chapter 5, US EPA 2013). Other groups that have modeled ozone-FEV1 dose-response curves have also shown evidence of thresholds or doses of onset (McDonnell 2012, Schelegle 2012).
Table 1: Total ozone doses that produce a mean FEV1 response
Mean % ΔFEV1 Long Exposure Dose (ppm x L) Short Exposure Dose (ppm x L)
- 5 953.5 740.2
- 10 1553.8 926.7
- 15 N/A 1467.4
- 20 N/A N/A
We also estimated the percentage of individuals exposed to a given dose interval (the intervals were 250 ppm x L wide) who experienced an FEV1 decrement ≥ 10% (Figure 2). For short exposures (≤ 3

3
hours), doses of 750-1000 ppm x L caused a more than five-fold increase in the number of people experiencing a 10% FEV1 decrement, compared to doses of 500-750 ppm x L. For long exposures, a dose in the range of 1250-1500 ppm x L caused ~33% of people to experience an FEV1 decrement of > 10%, whereas the range of 750-1000 ppm x L led to ~17% of people responding with an FEV1 decrement of > 10%. The 5% FEV1 thresholds (740 ppm x L for short exposure; 954 ppm x L for long exposure) correspond to the dose ranges that provide more protection against individuals experiencing 10% FEV1 decrements (500-750 ppm x L for short exposures; 750-1000 ppm x L for long exposures). This shows that using 5% FEV1 decrement thresholds would prevent not only group mean decrements of ≥10%, but would also prevent a significant number of more responsive individuals from experiencing a ≥10% FEV1 decrement.
Figure 2. Percent of individuals experiencing >10% FEV1 decrements in response to ozone exposure. Plot of percent of individuals who experienced FEV1 decrements greater than 10% at ozone dose increments of 250 ppm x L during short (≤ 3 hour; red squares) and long (6-8 hour; blue diamonds) exposures to ozone.
Fitting other subpopulations to the FEV1-ozone dose response curves. Our initial ozone-FEV1 dose-response analyses were conducted using individual data from healthy young adults (18-35 years old). We conducted an additional analysis to compare the responses of healthy young adults to the responses of healthy children (aged 8-11), asthmatic adolescents, and asthmatic adults (these are potential at-risk populations for ozone exposure). To do this analysis, we used group mean data, not individual data, because only group mean data were available for most studies (see reference list for studies used for group mean dose-response).
We plotted the adult asthmatic group mean FEV1 response with the short- and long-exposure curves for healthy adults and found that for both exposures, the asthmatic responses were similar to those of healthy young adults (Figure 3 A, B). Overall, this suggests that adult asthmatics do not demonstrate
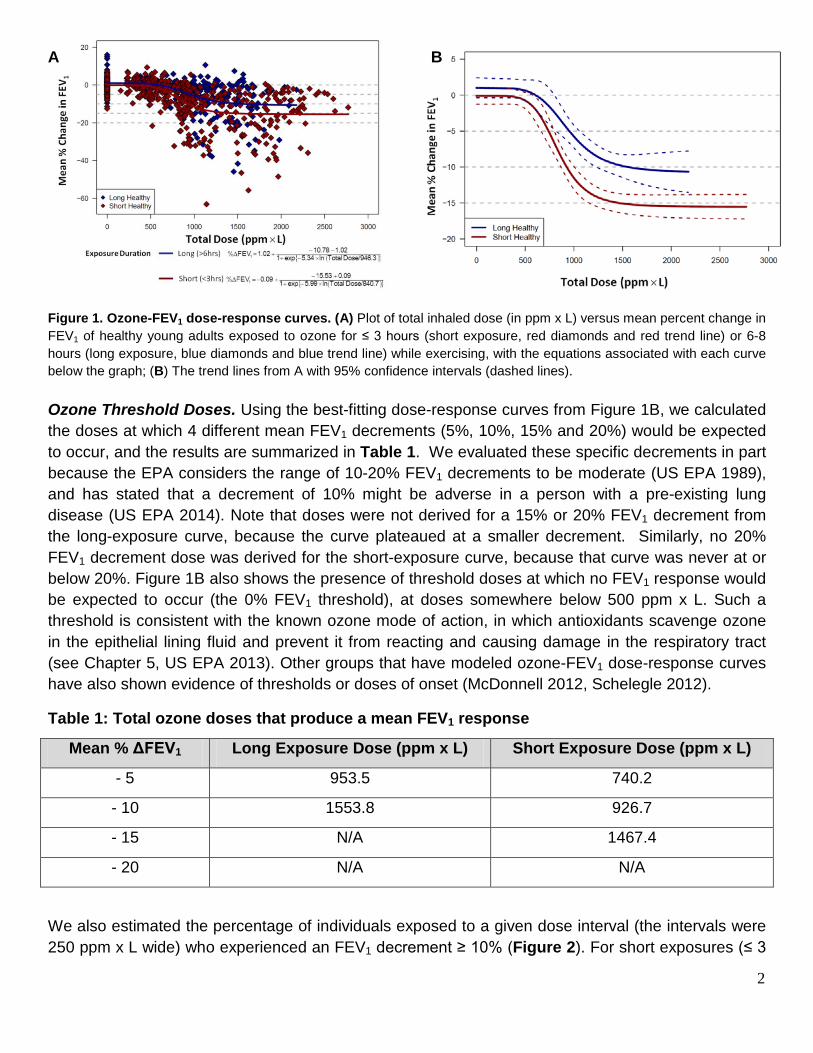
4
increased spirometric responses to ozone, which is consistent with the conclusions reported from many studies (Linn 1994, Balmes 1997, Koenig 1985, Koenig 1987, Stenfors 2002, Nightingale 1999, Basha 1994). There are also data investigating the effects of short-term ozone exposure on healthy and asthmatic adolescents (aged 11 to 18 years old). These studies were conducted with quite low doses, making it difficult to derive a dose-response relationship. Generally, the responses between the healthy and asthmatic adolescents were similar (Figure 3A). The group mean response for healthy children (aged 8-11) was also consistent with the dose-response plotted for the healthy adult group mean (Figure 3A). These data all show that healthy children and asthmatics have similar FEV1 responses to ozone as healthy young adults.
A B
Figure 3. Ozone-FEV1 dose-response curves that include subpopulations. (A) Total inhaled ozone dose versus group mean percent change in FEV1 of healthy young adults (dark red diamonds and trend line) exposed for ≤ 3 hours to ozone, and also the group mean responses of healthy children aged 8-11 exposed to ozone (grey circles), adult asthmatics (grey squares), healthy adolescents (grey upward triangles), and asthmatic adolescents (grey downward triangles); (B) Total inhaled ozone dose versus mean percent change in FEV1 of healthy young adults (blue diamonds and trend lines) exposed for six to eight-hours to ozone and adult asthmatics (yellow diamonds).
Application of ozone-FEV1 dose-response curves to real-world exposures. The threshold doses in Table 1 are a combination of exposure duration, ventilation rate, and ozone concentration. In contrast, the EPA’s ozone National Ambient Air Quality Standard (NAAQS) level is only a concentration. Differences in exposure duration also require consideration of replenishment of detoxifying antioxidants, as evidenced by the different dose-response curves for ≤ 3 hour and 6-8 hour exposures. Incorporating the production of antioxidants into the model at longer exposure durations would raise the values of the FEV1 decrement thresholds. We considered reasonable, real-world exposure durations and ventilation rates, and combined them with actual ozone concentrations to determine whether the resultant doses would be expected to cause significant FEV1 decrements.
Guidance documents as well as published information exist about the duration and ventilation rates of people exercising in the general population. Because a person has to be exercising at moderate to vigorous intensity to achieve a significant dose of ozone at current US ambient concentrations (Schelegle 2009, Adams 2006a, etc.), we used information about the exercising population in this analysis. While we did not include exposure location in our analysis, we note that ozone is primarily

5
an outdoor pollutant (Sarnat et al. 2001, 2005), so these exposure scenarios assume that the person is exercising outdoors. We combined the information about exercise duration and ventilation rate with actual ambient ozone concentrations to calculate the ozone doses that people are expected to receive while exercising outdoors. These doses were compared to the dose thresholds from Table 1 to determine whether these exposure scenarios are likely to cause the designated FEV1 decrements.
To determine exposure times and ventilation rates, we used several different EPA guidance documents (US EPA 1994, US EPA 2009), as well as experimental observations made by Samet (1993) and Zuurbier (2003). These values are shown in Table 2. For ozone concentrations, we used the Texas Commission on Environmental Quality (TCEQ) Texas Air Monitoring Information System (TAMIS) to determine what would be expected on days that just meet the current NAAQS standard level (75 ppb maximum eight-hour average), or the potential alternative NAAQS standard levels (70 and 65 ppb maximum eight-hour averages). This was done using monitoring data from 10 days where the maximum eight-hour average was 75, 70 or 65 ppb. We used this data to evaluate other maximum averaging times (for 1-14 hours or the 24-hour average; Table 3).
Table 2. Real-world exercise duration and ventilation rates
Source Population Exercise Intensity Ventilation Rate (L/min)*
Duration (hours)*
US EPA 2009 Children (6 - < 11 years old) Sedentary 4.8 (3.7-6) 13.7 (13-15)
Light 11.3 (9.2-14) 7.4 (5.5-9.6)
Moderate 21.6 (17-26.8) 2.6 (0.9-4.1)
High 41.5 (31.4-53.5) 0.3 (0.02-0.9)
Adult (21 - < 31 years old) Sedentary 5.3 (3.6-5.9) 12.5 (11.2-13.8)
Light 11.8 (9.2-14.9) 6.3 (3.8-9.7)
Moderate 26.1 (18.8-34.4) 5 (1.8-7.6)
High 49.8 (34.6-67.2) 0.3 (0.05-0.6)
US EPA 1994 Non-occupational 24 hr Ventilation with 8 hrs Manual labor 14 24
Occupational Manual labor 22 8
Zuurbier 2003 Adult Bicycle commute 23.5 (11-47.7) 2
Samet 1993 Child Outdoor play 16 (12.1-17.4) 1.9
Child Bicycling 27.1 (16.7-34.8) 2.1
Adult Vigorous bicycling 65 (40.8-87.8) 0.8
* Mean ventilations and times, and where available, the 10th and 90th percentiles in parentheses.

6
Table 3. Ozone concentrations on days with maximum eight-hr concentrations of 75, 70 or 65 ppb.
Concentration Metric 75 ppb Days (ppb)
mean (SD) 70 ppb Days (ppb)
mean (SD) 65 ppb Days (ppb)
mean (SD)
1-hr max 85.8 (3.5) 77.4 (5.7) 72.4 (4.7) 2-hr max average 84.2 (3.2) 76.2 (5.2) 71.3 (4.1) 3-hr max average 82.8 (2.7) 75.3 (4.8) 70.3 (3.7) 4-hr max average 80.8 (2.2) 74.3 (4.2) 69.6 (3.4) 5-hr max average 79.4 (1.7) 73.3 (3.2) 68.6 (2.6) 6-hr max average 78.2 (1.3) 72.4 (2.1) 67.6 (1.9) 7-hr max average 76.8 (0.9) 71.4 (1.4) 66.6 (1.1) 8-hr max average 75.4 (0.6) 70.2 (0.7) 65.6 (0.8) 9-hr max average 72.6 (4.5) 69 (0.7) 64.5 (1.2) 10-hr max average 71.5 (3.2) 97.6 (1.6) 63.2 (2.0) 11-hr max average 70.4 (2.2) 66.2 (2.4) 61.9 (2.9) 12-hr max average 69.2 (1.8) 64.9 (3.2) 60.6 (3.5) 13-hr max average 68 (1.8) 63.8 (4.0) 59.2 (4.2) 14-hr max average 66.9 (2.1) 62.7 (4.7) 57.9 (4.8)
24-hr average 52.2 (5.5) 51.4 (8.5) 46.2 (6.5) Note: provided are the mean maximum averages using different time metrics from 10 days with eight-hour maximum averages of 75, 70 or 65 ppb (standard deviation in parentheses). Shaded is the measured eight-hour maximum average.
The exposure ventilation for a certain activity, the time spent at that activity, and the appropriate ozone concentration for that duration and standard level were combined to produce an expected dose (in ppm x L). The following is an example of how that was calculated:
From Table 2: Sedentary child ventilation rate = 4.8 L/min; duration = 13.7 hrs
From Table 3: 14 hr max average (matching the 13.7 hr duration) = 64.7 ppb (at a 75 ppb level)
Total Inhaled Dose at 75 ppb = 4.8 L/min x 13.7 hrs x 60 min/hr x 0.0647 ppm = 255 ppm x L
We plotted the ozone doses associated with each activity as well as the 5%, 10% and 15% group mean FEV1 decrement thresholds (Figure 4). We found that all of these activities are associated with doses below any of the thresholds, regardless of which NAAQS level was used. Changing the standard level made very little difference in expected dose. Only the 24-hour non-occupational exposure at the 75 and 70 ppb standard levels was over even the 5% threshold (but was still well below the 10% FEV1 threshold that the EPA considers is needed to protect sensitive individuals). This non-occupational scenario assumes a 24-hour outdoor exposure, eight hours of which are spent doing manual labor (US EPA 1994). We also demonstrated that longer exposure times cause smaller decrements at the same total dose (Figure 1, Figure 2), and therefore, using the 6-8-hour experimental exposure threshold over-estimates the response to a 24-hour exposure.

7
A
B
Figure 3. Modeled ozone doses compared to ozone dose-response thresholds. Plotted is the total mean (± SD) ozone dose associated with different exposure scenarios, calculated by multiplying the exposure duration and ventilation rate for each activity (from Table 2), with the ozone concentration for the appropriate duration that would occur if the ambient 8-hour maximum average ozone concentration were 75, 70 or 65 ppb (from Table 3). These are separated into short (≤ 4 hour; A) and longer (> 4 hour; B) exposure times. The threshold ozone dose at which group mean FEV1 decrements of 5%, 10% or 15% (15% threshold available for short exposure only) would be expected to occur is also plotted. Standard deviation based on variability in ozone concentrations, not on variability in exposure duration or ventilation rates.
Threshold O3 dose for 10% FEV1 mean response
Threshold O3 dose for 5% FEV1 mean response
Threshold O3 dose for 10% FEV1 mean response
Threshold O3 dose for 5% FEV1 mean response
Threshold O3 dose for 15% FEV1 mean response

8
Discussion. A number of papers have been published that describe the relationship between ozone dose and different health endpoints, particularly the FEV1 response (e.g. McDonnell 2007, Schelegle 2012, McDonnell 2012). The McDonnell (2012) analysis was used to derive the McDonnell-Stewart-Smith (MSS) model on which the EPA relies to model FEV1 decrements in the Health Risk and Exposure Assessment (US EPA 2014). Our work differs from these papers and from the MSS model in several important ways.
• One way is that we do not subtract the individuals’ filtered air response, but rather include it as a zero dose in the dose-response curve. Including a zero-dose is a common practice in modeling dose-response and allows the direct observation of any inter-individual variability that occurs just in response to the study protocol.
• Another difference is that we consider both the mean response, which includes the entire dataset, as well as the number of individuals that have a greater-than-mean response. This allows us to make decisions about protective levels of ozone based on both of these criteria.
• We also consider the data from different subpopulations that have been experimentally exposed to ozone, to determine whether or not the healthy young adult dose-response also adequately represents these populations.
• Finally, unlike the other papers that have published dose-response models, we use real-world ventilation rates and exposure times to allow this information to be applied to the general population, which may aid policy makers in making decisions.
In conclusion, this is a unique analysis that incorporates ozone exposures with group mean and individual FEV1 responses, and considers other subpopulations, to produce dose-response curves. We compared different threshold doses at which a given mean FEV1 decrement would be expected to occur to real-world expected exposures incorporating duration, ventilation rate and ozone concentrations. This provides a tool that translates ozone human clinical data into a format that can be used by policy makers to decide on a protective level for the ozone NAAQS. The results shown here demonstrate that the current ozone NAAQS level of 75 ppb is adequate to protect sensitive members of the population when using group mean FEV1 decrements of 5% or above.

9
References Balmes, JR; Aris, RM; Chen, LL; Scannell, C; Tager, IB; Finkbeiner, W; Christian, D; Kelly, T; Hearne, PQ; Ferrando, R; Welch, B. 1997. “Effects of ozone on normal and potentially sensitive human subjects. Part I: Airway inflammation and responsiveness to ozone in normal and asthmatic subjects”. Res Rep Health Eff Inst. 78: 1-37.
Basha, MA; Gross, KB; Gwizdala, CJ; Haidar, AH; Popovich, J Jr. 1994. “Bronchoalveolar lavage neutrophilia in asthmatic and healthy volunteers after controlled exposure to ozone and filtered purified air”. Chest. 106(6): 1757-65.
McDonnell, WF; Stewart, PW; Smith, MV. 2007. “The temporal dynamics of ozone-induced FEV1 changes in humans: An exposure-response model”. Inhal Toxicol 19: 483-494.
McDonnell, WF; Stewart, PW; Smith, MV; Kim, CS; Schelegle, ES. 2012. "Prediction of lung function response for populations exposed to a wide range of ozone conditions." Inhal. Toxicol. 24(10):619-633.
Mudway, IS; Blomberg, A; Frew, AJ; Holgate, ST; Sandstrom, T; Kelly, FJ. 1999. "Antioxidant consumption and repletion kinetics in nasal lavage fluid following exposure of healthy human volunteers to ozone." Eur. Respir. J. 13:1429-1438.
Nightingale, JA; Rogers, DF; Barnes, PJ. 1999. “Effect of inhaled ozone on exhaled nitric oxide, pulmonary function, and induced sputum in normal and asthmatic subjects”. Thorax. 54(12): 1061-9.
Samet, JM; Lamber, WE; James, DS; Mermier, CM; Chick, TW. 1993. “Assessment of heart rates as a predictor of ventilation.” Res Rep Health Eff Inst. 59: 19-55.
Sarnat, JA; Schwartz, J; Catalano, PJ; Suh, HH. 2001. "Gaseous pollutants in particulate matter epidemiology: Confounders or surrogates?" Environ. Health Perspect. 109(10):1053-1061.
Sarnat, JA; Brown, KW; Schwartz, J; Coull, BA; Koutrakis, P. 2005. "Ambient gas concentrations and personal particulate matter exposures: Implications for studying the health effects of particles." Epidemiology 16(3):385-395.
Schelegle, ES; Adams, WC; Walby, WF; Marion, MS. 2012. “Modelling of individual subject ozone exposure response kinetics”. Inhal Toxicol 24: 401-415.
Stenfors, N; Pourazar, J; Blomberg, A; Krishna, MT; Mudway, I; Helleday, R; Kelly, FJ; Frew, AJ; Sandstrom, T. 2002. “Effect of ozone on bronchial mucosal inflammation in asthmatic and healthy subjects”. Respir Med. 96(5): 352-8.
US EPA. 1989. “Review of the National Ambient Air Quality Standard for Ozone. Assessment of Scientific and Technical Information.” EPA. Research Triangle Park, NC. EPA-450/2-92
US EPA. 1994. “Methods for derivation of inhalation reference concentrations and application of inhalation dosimetry.” (EPA/600/8-90/066F). Washington DC.
US EPA. 2009. “Metabolically derived human ventilation rates: a revised approach based upon oxygen consumption rates.” National Center for Environmental Assessment (NCEA). EPA/600/R-06/129F. May.

10
US EPA. 2013. "Integrated Science Assessment for Ozone and Related Photochemical Oxidants (Final)." National Center for Environmental Assessment (NCEA). EPA/600/R–10/076F. 1251p., February.
US EPA. 2014. "Health Risk and Exposure Assessment for Ozone (Final Report)." EPA-452/R-14-004a-e. August.
Zuurbier, M; Hoek, G; van den Hazel, P; Brunekreef, B. 2009. “Minute ventilation of cyclists, car and bus passengers: an experimental study.” Environ Health. doi: 10.1186/1476-069X-8-48.
Studies used for group-mean dose response analysis
Healthy young adult studies
Adams, WC. 2000. “Ozone dose-response effects of varied equivalent minute ventilation rates”. J Expo Anal Environ Epidemiol. 10: 217-226.
Adams, WC. 2002. “Comparison of chamber and face-mask 6.6-hour exposures to ozone on pulmonary function and symptoms responses”. Inhal. Toxicol. 14: 745-764.
Adams, WC. 2003a. "Comparison of chamber and face mask 6.6-hour exposure to 0.08 ppm ozone via square-wave and triangular profiles on pulmonary responses." Inhal. Toxicol. 15(3):265-281.
Adams, WC. 2003b. “Relation of pulmonary responses induced by 6.6-h exposures to 0.08 ppm ozone and 2-h exposures to 0.30 ppm ozone via chamber and face-mask inhalation”. Inhal Toxicol. 15: 745-759.
Adams, WC. 2006a. "Comparison of chamber 6.6-h exposures to 0.04-0.08 ppm ozone via square-wave and triangular profiles on pulmonary responses." Inhal. Toxicol. 18(2):127-136.
Adams, WC. 2006b. “Human pulmonary responses with 30-minute time intervals of exercise and rest when exposed for 8 hours to 0.12 ppm ozone via square-wave and acute triangular profiles on pulmonary responses”. Inhal Toxicol. 18: 413-422.
Adams, WC; Ollison, WM. 1997. “Effects of prolonged simulated ambient ozone dosing patterns on human pulmonary function and symptomatology”. June 8-13, 97-MP9.02, pp.1-16.
Folinsbee, LJ; Drinkwater, BL; Bedi, JF, Horvath, SM. 1978. “The influence of exercise on the pulmonary function changes due to low concentrations of ozone”. In: Environmental Stress, edited by L.J. Folinsbee, J.A. Wagner, J.F. Borgia, B.L. Drinkwater, J.A. Gliner, J.F. Bedi. New York: Academic, p 125-145.
Folinsbee, LJ; McDonnell, WF; Horstman, DH. 1988. “Pulmonary function and symptom responses after 6.6-hour exposure to 0.12 ppm ozone with moderate exercise”. JAPCA. 38: 28-35.
Hazucha, MJ; Folinsbee, LJ; Seal, E, Jr. 1992. “Effects of steady-state and variable ozone concentration profiles on pulmonary function”. Am J Respir Crit Care Med 146: 1487-1493.

11
Horstman, DH; Folinsbee, LJ; Ives, PJ; Abdul-Salaam, S; McDonnell, WF. 1990. “Ozone concentration and pulmonary response relationships for 6.6-hour exposures with five hours of moderate exercise to 0.08, 0.10, and 0.12 ppm”. Am Rev Respir Dis. 142: 1158-1163.
Kim, CS; Alexis, NE; Rappold, AG; Kehrl, H; Hazucha, MJ; Lay, JC; Schmitt, MT; Case, M; Devlin, RB; Peden, DB; Diaz-Sanchez, D. 2011. "Lung function and inflammatory responses in healthy young adults exposed to 0.06 ppm ozone for 6.6 hours." Am. J. Respir. Crit. Care Med. 183:1215-1221.
McDonnell, WF; Horstman, DH; Hazucha, MJ; Seal, E, Jr; Haak, ED; Salaam, SA; House, DE. 1983. “Pulmonary effects of ozone exposure during exercise: Dose-response characteristics”. J Appl Physiol 54:1345-1352.
McDonnell, WF; Kehrl, HR; Abdul-Salaam, S; Ives, PJ; Folinsbee, LK; Devlin, RB; O’Neil, JJ; Horstman, DH. 1991. "Respiratory response of humans exposed to low levels of ozone for 6.6 hours." Arch Environ Health. 46:145-50.
Schelegle, ES; Morales, CA; Walby, WF; Marion, S; Allen, RP. 2009. “6.6-hour inhalation of ozone concentrations from 60 to 87 parts per billion in healthy humans”. Am J Respir Crit Care Med. 180: 265-272.
Seal, E Jr; McDonnell, WF; House, DE; Salaam, SA; Dewitt, PJ; Butler, SQ; Green, J; Raggio, L. 1993. “The pulmonary response of white and black adults to six concentrations of ozone.” Am Rev Respir Dis 147:804-810.
Subpopulation studies
Holz, O; Jorres, RA; Timm, P; Mucke, M; Richter, K; Koschyk, S; Magnussen, H. 1999. “Ozone-induced airway inflammatory changes differ between individuals and are reproducible”. Am J Respir Crit Care Med 159: 776-784.
Horstman, DH; Ball, BH; Brown, J; Gerrity, T; Folinsbee, LJ. 1995. “Comparison of pulmonary responses of asthmatic and nonasthmatic subjects performing light exercise while exposed to a low level of ozone”. Toxicol Ind Health. 11: 369-385.
Jenkins, HS; Devalia, JL; Mister, RL; Bevan, AM; Rusznak, C; Davies, RJ. 1999. “The effect of exposure to ozone and nitrogen dioxide on the airway response of atopic asthmatics to inhaled allergen: dose- and time-dependent effects.” Am J Respir Crit Care Med. 160:33-9.
Kehrl, HR; Peden, DB; Ball, BA; Folinsbee, LJ; Horstman, DH. 1999. “Increased specific airway reactivity of persons with mild allergic asthma after 7.6 hours of exposure to 0.16 ppm ozone”. J Allergy Clin Immunol 104: 1198-1204.
Koenig, JQ; Covert, DS; Morgan, MS; Horike, M; Horike, N; Marshall, SG; Pierson, WE. 1985. “Acute effects of 0.12 ppm ozone or 0.12 ppm nitrogen dioxide on pulmonary function in healthy and asthmatic adolescents”. Am Rev Respir Dis. 132(3): 648-51.
Koenig, JQ; Covert, DS; Marshall, SG; Van Belle, G; Pierson, WE. 1987. “The effects of ozone and nitrogen dioxide on pulmonary function in healthy and asthmatic adolescents”. Am Rev Respir Dis. 136(5): 1152-7.

12
Koenig, JQ; Covert, DS; Smith, MS; Van Belle, G; Pierson, WE. 1988. “The pulmonary effects of ozone and nitrogen dioxide alone and combined in healthy and asthmatic adolescent subjects”. Toxicol Ind Health. 4: 521-32.
Koenig, JQ; Covert, DS; Hanley, QS; Van Belle, G; Pierson, WE. 1990. “Prior exposure to ozone potentiates subsequent response to sulfur dioxide in adolescent asthmatic subjects”. Am Rev Respir Dis. 141: 377-80.
Linn, WS; Shamoo, DA; Anderson, KR; Peng, RC; Avol, EL; Hackney, JD. 1994. “Effects of prolonged, repeated exposure to ozone, sulfuric acid, and their combination in healthy and asthmatic volunteers.” Am J Respir Crit Care Med. 150:431-40.
McDonnell, WF; Chapman, RS; Leigh, MW; Strope, GL; Collier, AM. 1985. "Respiratory responses of vigorously exercising children to 0.12 ppm ozone exposure." Am. Rev. Respir. Dis. 132:875-879.
Peden, DB; Boehlecke, B; Horstman, D; Devlin, R. 1997. “Prolonged acute exposure to 0.16 ppm ozone induces eosinophilic airway inflammation in asthmatic subjects with allergies.” J Allergy Clin Immunol. 100:802-8.
Weymer, AR; Gong, H Jr; Lyness, A; Linn, WS. 1994. “Pre-exposure to ozone does not enhance or produce exercise-induced asthma.” Am J Respir Crit Care Med. 149: 1413-9.