oxytherm system operations manual
TRANSCRIPT
Operations ManualSetup, Installation &
Maintenance
Oxytherm System
2nd March 2006Version 2.1
© Copyright Hansatech Instruments Ltd. All rights reserved.
Hansatech Instruments LtdNarborough Road, Pentney, King’s Lynn,
Norfolk PE32 1JL England.
Tel: +44 (0)1760 338877 Fax: +44 (0)1760 337303Email: [email protected]
Web site: http://www.hansatech-instruments.com
ContentsPreface .......................................................................... 4 • Document Conventions ...................................... 4 • Notice .................................................................. 4
Chapter 1: Electrode Preparation & ................. 5Maintenance
Introduction to the OXYT/ED Oxygen Electrode ...... 6 • Electrode Disc Theory ......................................... 6 • Operational Principles ......................................... 6
Electrode Preparation ................................................. 7 • Testing the Response of the Prepared ............... 9 Electrode
Electrode Disc Cleaning & Maintenance .................. 10 • Electrode Maintenance ....................................... 10 • Cleaning Procedure ............................................ 10 • Rinsing & Drying ................................................. 11 • Storage ............................................................... 11
The Importance of Good Electrode Maintenance ..... 12 • Failure to Maintain the Disc ................................ 12 • Disc is Left to Dry Out After Use ......................... 13 • Cleaning with Unsuitable Materials ..................... 13
Chapter 2: Oxytherm Electrode Control .......... 14Unit
Introduction to Oxytherm .............................................. 15 Setting Up Oxytherm ..................................................... 15 • Connections to the Oxytherm ............................... 15 • Multi-Channel Systems ......................................... 16 • What Additional Hardware is Required? ........... 16 • Linking Control Units Together ......................... 17 • Pitfalls!! ............................................................. 17 • Clearing a Control Unit ID ................................. 18 • Using Multi-Channel Systems .............................. 18 • Channel Calibration & Configuration ................ 18 • Stirring .............................................................. 18 • Signal Display ................................................... 19 • Disable Boxes ................................................... 19 System Calibration ........................................................ 20 • Liquid-Phase Calibration ....................................... 20 • Air Line .............................................................. 20 • Zero Oxygen Line .............................................. 21 • Performing a Liquid-Phase Calibration .............. 22 • Viewing Calibration Details ................................... 25
Oxytherm Operation .................................................. 27 • Oxygraph Plus ................................................... 27 • Overview ........................................................ 27 • Running Oxygraph Plus .................................... 27 • Graph Functions ............................................... 28 • Recording a Signal ........................................... 29 • Setting the Measurement Axes ........................ 29 • Trace Settings .................................................. 30 • The Data Bar .................................................... 31 • The Menu Bar ................................................... 32 • Files Menu .................................................... 32 • Hardware Menu ............................................ 33 • Calibrate Menu ............................................. 33 • View Menu .................................................... 33 • Graph Menu .................................................. 33 • Data Bar Menu .............................................. 34 • Tools Menu ................................................... 34 • Rate Menu .................................................... 34 • Help Menu .................................................... 34 • The Toolbar ..................................................... 34 • System Configuration ...................................... 35 • Overview ...................................................... 35 • Data Acquisition Rate .................................. 40 • Temperature Control ....................................... 42 • Overview ...................................................... 42 • Temperature Effects on Liquid-Phase ......... 42 Samples . • Temperature Effects on the Electrode Disc . 43 • Setting Up Temperature Control .................. 43 • The Magnetic Stirrer ........................................ 44 • Operating the Magnetic Stirrer ..................... 45 • Recording an Auxiliary Signal .......................... 46 • System Diagnostics ......................................... 47 • Control Unit Diagnostics ............................... 47 • Electrode Disc Diagnostics ........................... 49 • Testing the Electrode Connection Cable ...... 50 for Short Circuits or Breaks
Data Handling .............................................................. 51 • Event Marking ...................................................... 51 • Editing and Deleting Event Marks .................... 52 • File Information .................................................... 53 • Rate Measurements ............................................ 54 • Tabulated Data .................................................... 57 • Data Export .......................................................... 57 • Printing Data ........................................................ 59 • Viewing Previously Saved Files ........................... 59 • Options ................................................................. 60
Accessories ................................................................... 60 • OXY/PHA - Ph / Ion-Selective Electrode ............. 60 Amplifier
Support Information ..................................................... 61 • Upgrading Oxygraph Plus Software .................... 61
Appendix A - Sample Printout of Data File ............... 62

PrefaceThis manual is designed to highlight the key features, setup procedures and general maintenance of the Oxytherm electrode control unit and Peltier electrode chamber.
Document ConventionsIf viewed electronically, blue highlighted text can be clicked in order to link to other parts of this document or to other documents and Internet locations. In order for the external links to be completed, an Internet connection must be established either via a standard or broadband dial-up modem or via a LAN (local area network) connection.
NoticeThis instrument must not be used in situations where its failure could result in injury or death. For applications where failure of this instrument to function correctly would lead to consequential damage, the analyser must be checked for correct operation and calibration at intervals appropriate to the criticality of the situation. This manual is provided to help you install and operate the equipment. Every effort has been made to ensure that the information contained in this manual is accurate and complete. Hansatech Instruments Ltd does not accept any liability for losses or damages resulting from the use of this information. Hansatech Instruments Ltd equipment warranty is limited to replacement of defective components, and does not cover injury to persons or property or other consequential damage. This manual, and the information contained in it, is copyright to Hansatech Instruments Ltd. No part of the manual may be copied, stored, transmitted or reproduced in any way or by any means including, but not limited to, photocopying, photography, magnetic or other mechanical or electrical means, without the prior written consent of Hansatech Instruments Ltd. Oxytherm is covered under warranty for one complete year, parts and labour included. This, of course, is provided that the equipment is properly installed, operated and maintained in accordance with written instructions contained within this manual. The warranty excludes all defects in equipment caused by incorrect installation, operation or maintenance, misuse, alteration, and/or accident. If for some reason, a fault is covered under warranty, it is the responsibility of the customer to return the goods to Hansatech Instruments Ltd or an authorised agent for repair or replacement of the defective part(s). For service, please contact us at the address at the back of this manual.
4

Chapter 1Electrode Preparation
& Maintenance
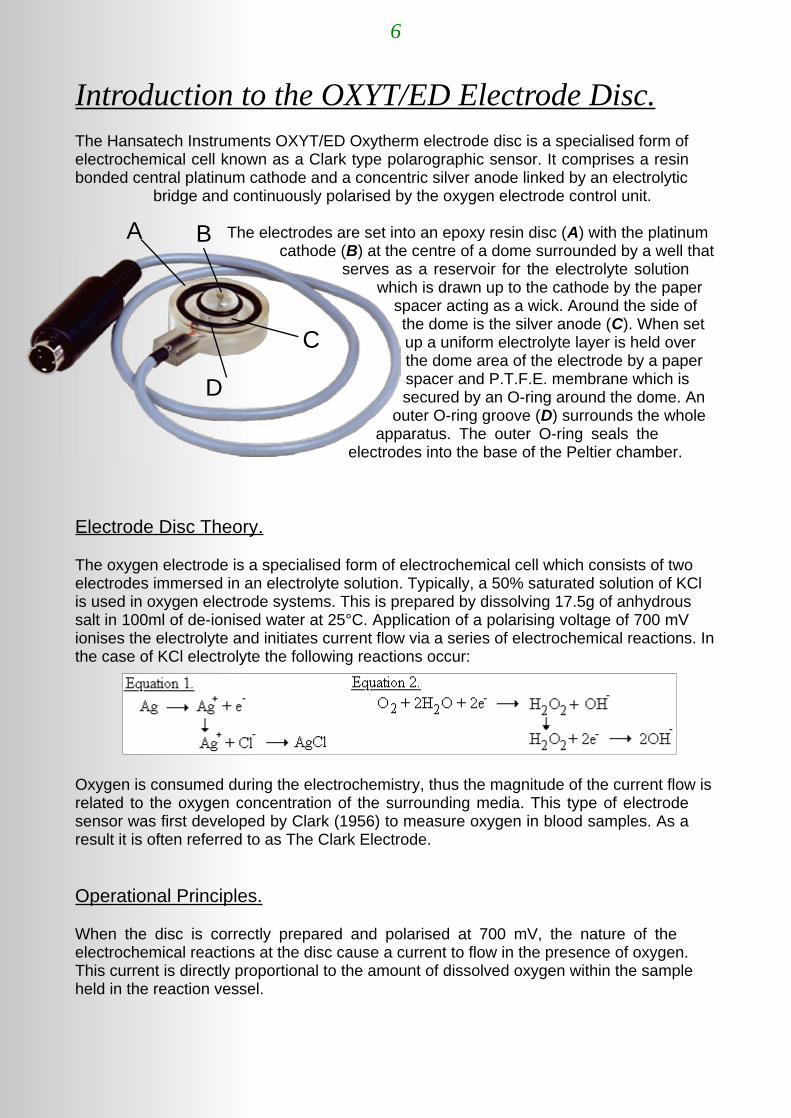
Introduction to the OXYT/ED Electrode Disc.The Hansatech Instruments OXYT/ED Oxytherm electrode disc is a specialised form of electrochemical cell known as a Clark type polarographic sensor. It comprises a resin bonded central platinum cathode and a concentric silver anode linked by an electrolytic
bridge and continuously polarised by the oxygen electrode control unit.
The electrodes are set into an epoxy resin disc (A) with the platinum cathode (B) at the centre of a dome surrounded by a well that
serves as a reservoir for the electrolyte solution which is drawn up to the cathode by the paper
spacer acting as a wick. Around the side of the dome is the silver anode (C). When set up a uniform electrolyte layer is held over the dome area of the electrode by a paper spacer and P.T.F.E. membrane which is secured by an O-ring around the dome. An
outer O-ring groove (D) surrounds the whole apparatus. The outer O-ring seals the
electrodes into the base of the Peltier chamber.
Electrode Disc Theory.
The oxygen electrode is a specialised form of electrochemical cell which consists of two electrodes immersed in an electrolyte solution. Typically, a 50% saturated solution of KCl is used in oxygen electrode systems. This is prepared by dissolving 17.5g of anhydrous salt in 100ml of de-ionised water at 25°C. Application of a polarising voltage of 700 mV ionises the electrolyte and initiates current flow via a series of electrochemical reactions. In the case of KCl electrolyte the following reactions occur:
Oxygen is consumed during the electrochemistry, thus the magnitude of the current flow is related to the oxygen concentration of the surrounding media. This type of electrode sensor was first developed by Clark (1956) to measure oxygen in blood samples. As a result it is often referred to as The Clark Electrode.
Operational Principles.
When the disc is correctly prepared and polarised at 700 mV, the nature of the electrochemical reactions at the disc cause a current to flow in the presence of oxygen. This current is directly proportional to the amount of dissolved oxygen within the sample held in the reaction vessel.
6
C
BA
D
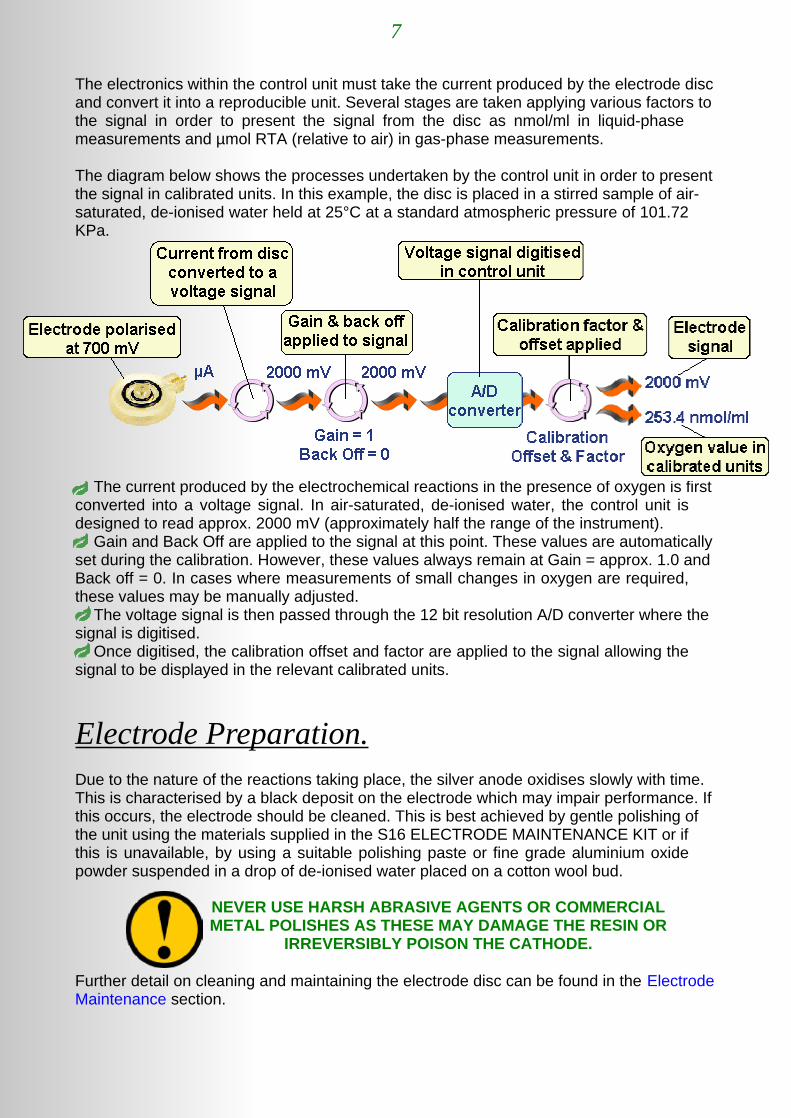
The electronics within the control unit must take the current produced by the electrode disc and convert it into a reproducible unit. Several stages are taken applying various factors to the signal in order to present the signal from the disc as nmol/ml in liquid-phase measurements and µmol RTA (relative to air) in gas-phase measurements.
The diagram below shows the processes undertaken by the control unit in order to present the signal in calibrated units. In this example, the disc is placed in a stirred sample of air-saturated, de-ionised water held at 25°C at a standard atmospheric pressure of 101.72 KPa.
The current produced by the electrochemical reactions in the presence of oxygen is first converted into a voltage signal. In air-saturated, de-ionised water, the control unit is designed to read approx. 2000 mV (approximately half the range of the instrument). Gain and Back Off are applied to the signal at this point. These values are automatically set during the calibration. However, these values always remain at Gain = approx. 1.0 and Back off = 0. In cases where measurements of small changes in oxygen are required, these values may be manually adjusted. The voltage signal is then passed through the 12 bit resolution A/D converter where the signal is digitised. Once digitised, the calibration offset and factor are applied to the signal allowing the signal to be displayed in the relevant calibrated units.
Electrode Preparation.Due to the nature of the reactions taking place, the silver anode oxidises slowly with time. This is characterised by a black deposit on the electrode which may impair performance. If this occurs, the electrode should be cleaned. This is best achieved by gentle polishing of the unit using the materials supplied in the S16 ELECTRODE MAINTENANCE KIT or if this is unavailable, by using a suitable polishing paste or fine grade aluminium oxide powder suspended in a drop of de-ionised water placed on a cotton wool bud.
Further detail on cleaning and maintaining the electrode disc can be found in the Electrode Maintenance section.
NEVER USE HARSH ABRASIVE AGENTS OR COMMERCIAL METAL POLISHES AS THESE MAY DAMAGE THE RESIN OR
IRREVERSIBLY POISON THE CATHODE.
7
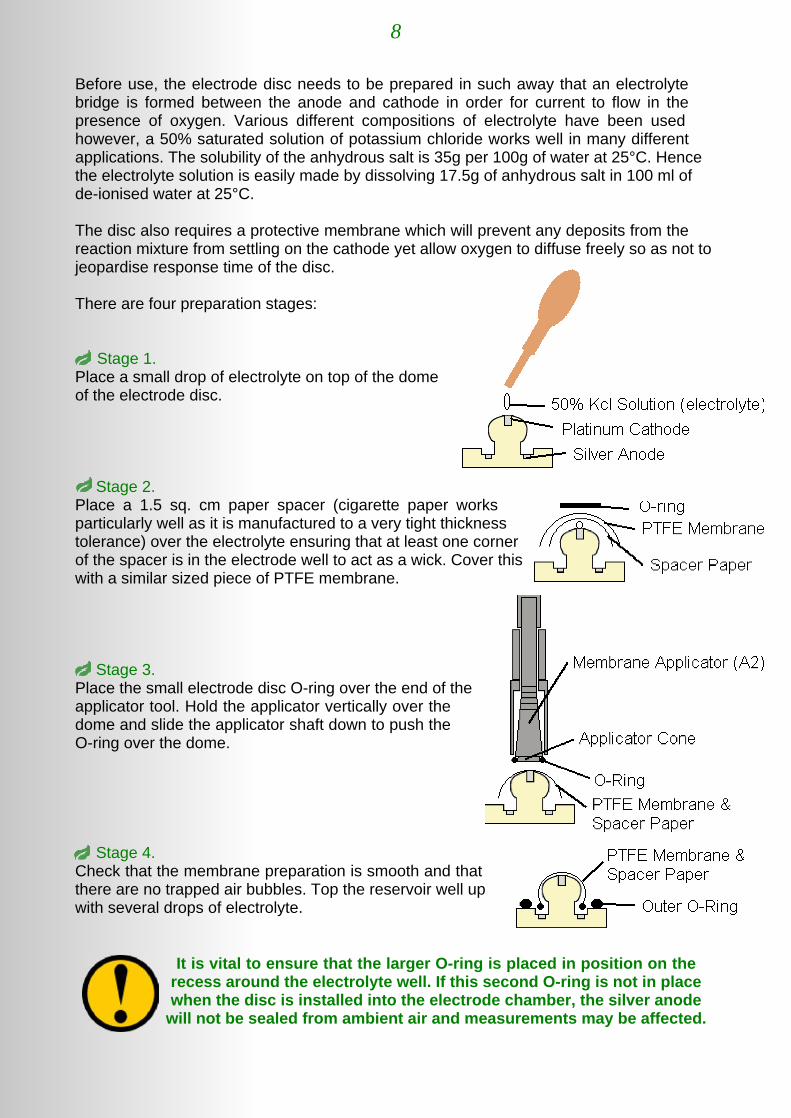
Before use, the electrode disc needs to be prepared in such away that an electrolyte bridge is formed between the anode and cathode in order for current to flow in the presence of oxygen. Various different compositions of electrolyte have been used however, a 50% saturated solution of potassium chloride works well in many different applications. The solubility of the anhydrous salt is 35g per 100g of water at 25°C. Hence the electrolyte solution is easily made by dissolving 17.5g of anhydrous salt in 100 ml of de-ionised water at 25°C.
The disc also requires a protective membrane which will prevent any deposits from the reaction mixture from settling on the cathode yet allow oxygen to diffuse freely so as not to jeopardise response time of the disc.
There are four preparation stages:
Stage 1. Place a small drop of electrolyte on top of the dome of the electrode disc.
Stage 2. Place a 1.5 sq. cm paper spacer (cigarette paper works particularly well as it is manufactured to a very tight thickness tolerance) over the electrolyte ensuring that at least one corner of the spacer is in the electrode well to act as a wick. Cover this with a similar sized piece of PTFE membrane.
Stage 3. Place the small electrode disc O-ring over the end of the applicator tool. Hold the applicator vertically over the dome and slide the applicator shaft down to push the O-ring over the dome.
Stage 4. Check that the membrane preparation is smooth and that there are no trapped air bubbles. Top the reservoir well up with several drops of electrolyte.
It is vital to ensure that the larger O-ring is placed in position on the recess around the electrolyte well. If this second O-ring is not in place when the disc is installed into the electrode chamber, the silver anode
will not be sealed from ambient air and measurements may be affected.
8
Testing the Response of the Prepared Electrode.
The following section uses Oxygraph Plus software in order to demonstrate the tests for electrode responsiveness. In other systems, the controls may be slightly different, however, the principles of the tests are identical.
Once the electrode disc has been successfully prepared, it is advisable to check the response of the disc prior to mounting the disc within the electrode chamber.
To check the response, connect the electrode disc to the rear of the control unit at the electrode input. Open the recording software and start a recording. The signal will take a few minutes to stabilise. A new or well maintained disc should read approx. 2000 mV in air.
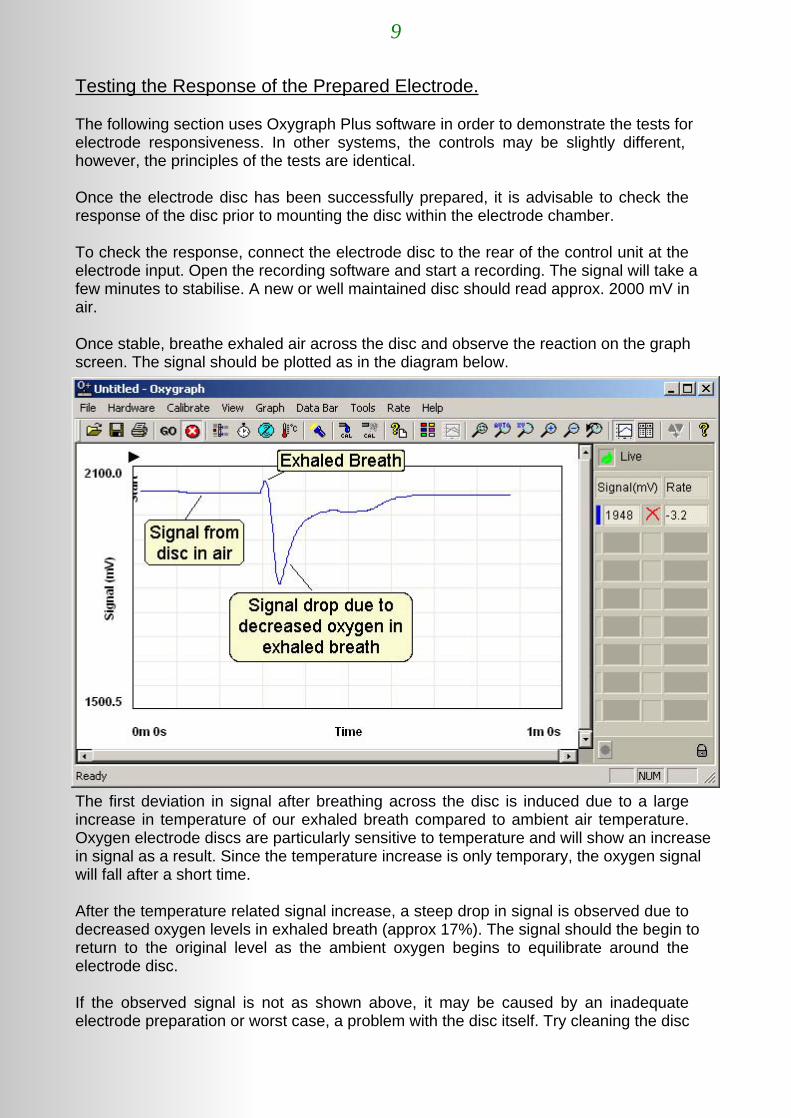
Once stable, breathe exhaled air across the disc and observe the reaction on the graph screen. The signal should be plotted as in the diagram below.
The first deviation in signal after breathing across the disc is induced due to a large increase in temperature of our exhaled breath compared to ambient air temperature. Oxygen electrode discs are particularly sensitive to temperature and will show an increase in signal as a result. Since the temperature increase is only temporary, the oxygen signal will fall after a short time.
After the temperature related signal increase, a steep drop in signal is observed due to decreased oxygen levels in exhaled breath (approx 17%). The signal should the begin to return to the original level as the ambient oxygen begins to equilibrate around the electrode disc.
If the observed signal is not as shown above, it may be caused by an inadequate electrode preparation or worst case, a problem with the disc itself. Try cleaning the disc
9
and re-preparing before repeating the test described above. If problems still occur, please contact Hansatech Instruments.
Once this test has been completed satisfactorily, mount the disc into the base of the electrode chamber. An additional test may be carried out in order to test the response of the disc in situ. Please refer to the Operating the Magnetic Stirrer section for further details.
Electrode Disc Cleaning and Maintenance.Electrode Maintenance. Periodic maintenance is required if you are to maintain your electrode in good condition. It should be cleaned after use and before prolonged storage. It is particularly important that the electrode is never left to dry out with electrolyte in place, as crystallisation of electrolyte may cause the platinum/epoxy resin seal to be breached and crystalline electrolyte to be deposited around the cathode. If this occurs, the electrode will become rapidly unserviceable and will require replacement. Cleaning is best achieved by following the procedure outlined below. (An electrode maintenance kit -ordering code S16- containing the items described is available. Please contact Hansatech Instruments for further details).
Cleaning Procedure.
Silver Anode. The silver electrode (anode) is subject to electrochemical deposition of chloride and oxide salts during use. This typically manifests as a brown/black deposit which forms on the surface of the Silver. Whilst deposition of small amounts of brown Silver Chloride is normal and desirable, excessive deposits or deposits of black oxides will cause a rapid deterioration in electrode performance and may result in lower signal levels, signal drift and increased signal noise.
Select a small cotton bud from the maintenance kit. Cotton buds vary a little in size, so check to see that the diameter of the cotton bud will allow it to be fully inserted into the well of the electrode, thus allowing contact with the silver electrode in the base of the well. If the bud is a little large, carefully reduce the size of the cotton bud by removing a layer of cotton wool from the tip until the bud will fit the well. Moisten the bud with a little distilled water.
Apply a small amount of either the Rapid Hansatech Polishing paste (revised cleaning kits supplied from 01/10/01) or the No. 1 Coarse Hansatech Polishing paste (supplied in earlier cleaning kits with Coarse and Fine pastes) to the tip of the bud.
It is important to use the correct polishing agent as harsh abrasive substances will damage the resin in which the electrodes are set. It should also be noted that many commercial metal polishes contain ammonia or solvents which may cause irreversible poisoning of the platinum
cathode.
10
Insert the bud into the well of the electrode and gripping the bud just above the tip, apply moderate pressure and gently rotate the bud around the electrode well in a circular motion 6 - 10 times. Observe the Silver anode. Continue to gently polish the silver electrode until all brown or black deposits on the surface of the silver are removed and the surface of the silver is highly polished.
Platinum Cathode. The platinum cathode is not subject to such deposition and all that is necessary is to maintain a scratch-free highly polished finish using the procedure outlined below.
Apply a small amount of the Rapid Hansatech Polishing paste (revised cleaning kits supplied from 01/10/01) or the No. 2 Fine Hansatech Polishing paste (earlier 2 part cleaning kits with Coarse and Fine pastes) to the unused end of the cotton bud moistened with a little distilled water , or if preferred to a small piece of moist cotton wool. Now, using a circular motion, gently polish the platinum cathode located in the centre of the electrode dome.
It is important to restrict the polishing motion to the platinum and avoid as much as possible contact with the epoxy resin surrounding the platinum.
Excessive polishing of the cathode area is to be avoided as this will eventually lead to a change of curvature of the electrode dome, which will result in deterioration of electrode performance. When finished, the platinum cathode should have a “mirror finish”.
If the surface of the platinum has become scratched, repeat the above procedure using the Rapid Hansatech Polishing paste (revised cleaning kits supplied from 01/10/01) or first using the No. 1 Coarse Hansatech Polishing paste, followed by the No. 2 Fine Polishing paste (earlier 2 part cleaning kits with Coarse and Fine pastes).
Rinsing and Drying. Once the electrodes have been satisfactorily cleaned, it is important to remove all traces of the polishing paste from the electrode surfaces by rinsing the electrode with a small volume of distilled water whilst gently scrubbing these areas with a soft bristled brush. (A toothbrush is ideal). Avoid wetting the electrical connector of the disc during this procedure. Dry the electrode thoroughly using paper towel.
Storage.
Store the electrode, when not in use, in an air-tight vessel containing a desiccant such as Silica gel. Periodically replace or rejuvenate the desiccant.
11
The Importance of Good Electrode Maintenance.
A significant proportion of technical support requests received by Hansatech Instruments Ltd relate to oxygen electrode disc performance. Of these requests, the vast majority are the result of failure to comply with recommended working practices and maintenance procedures. Some of the more common abuses of electrode discs include:
Failure to Maintain Electrode Disc.
If the electrode disc is not maintained, deposits of silver chloride (soft brown deposit) and/or silver oxide (hard black deposit) will build up on the silver ring (anode) of the disc. The formation of silver chloride is normal and desirable in small quantities as it improves the stability of the sensor. It is easily removed by cleaning and will reform when the electrode is next polarised. By contrast, deposits of black silver oxide are to be avoided. Silver oxide is an electrical insulator and its formation will reduce the available surface area of the silver anode and result in a dramatic reduction or complete loss of electrode signal. The electrode disc should be maintained in accordance with our recommended procedure. Please refer to the Cleaning and Maintenance section.
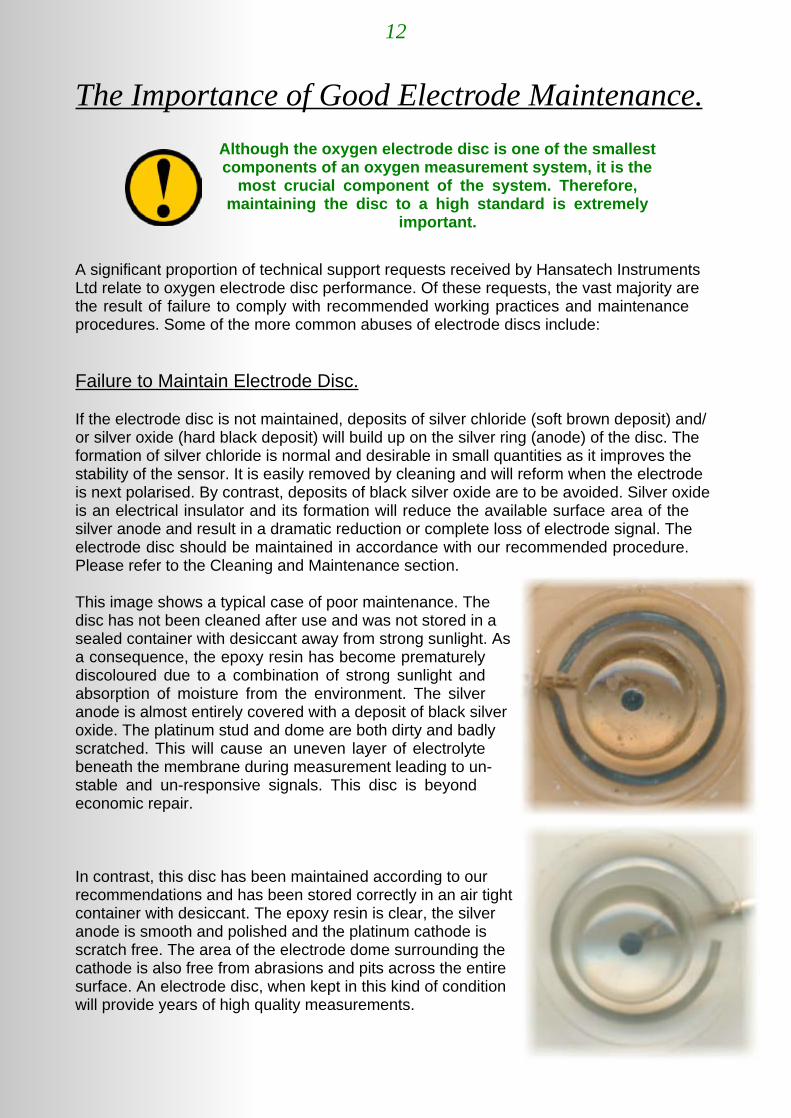
This image shows a typical case of poor maintenance. The disc has not been cleaned after use and was not stored in a sealed container with desiccant away from strong sunlight. As a consequence, the epoxy resin has become prematurely discoloured due to a combination of strong sunlight and absorption of moisture from the environment. The silver anode is almost entirely covered with a deposit of black silver oxide. The platinum stud and dome are both dirty and badly scratched. This will cause an uneven layer of electrolyte beneath the membrane during measurement leading to un-stable and un-responsive signals. This disc is beyond economic repair.
In contrast, this disc has been maintained according to our recommendations and has been stored correctly in an air tight container with desiccant. The epoxy resin is clear, the silver anode is smooth and polished and the platinum cathode is scratch free. The area of the electrode dome surrounding the cathode is also free from abrasions and pits across the entire surface. An electrode disc, when kept in this kind of condition will provide years of high quality measurements.
12
Although the oxygen electrode disc is one of the smallest components of an oxygen measurement system, it is the
most crucial component of the system. Therefore, maintaining the disc to a high standard is extremely
important.
Disc is Left to Dry Out After Use.
After use, the electrode disc should be stripped down, cleaned carefully and stored in a dry, air-tight container. If the disc is simply left, electrolyte will crystallise under the membrane and may cause irreversible damage to the electrode. The length of time that an electrode can be left prepared will depend upon local circumstances such as temperature and air flow through the laboratory. In general terms, we would recommend leaving a prepared electrode disc in a liquid-phase measurement system with stirred air-saturated water in the chamber overnight. The electrode disc can be kept polarised or switched off and re-polarised the next day dependant upon local working practices and user experience. In gas-phase measurements, the electrode is likely to dry out more rapidly and we would recommend stripping down and cleaning the electrode after each measurement day.
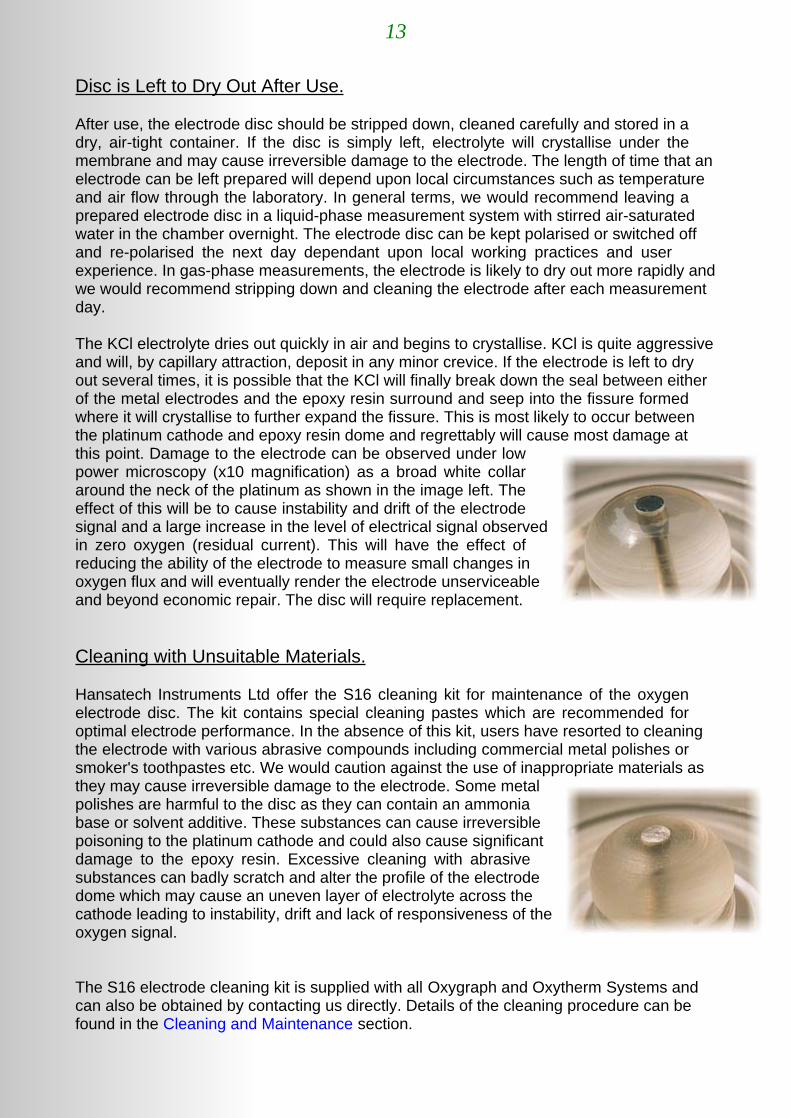
The KCl electrolyte dries out quickly in air and begins to crystallise. KCl is quite aggressive and will, by capillary attraction, deposit in any minor crevice. If the electrode is left to dry out several times, it is possible that the KCl will finally break down the seal between either of the metal electrodes and the epoxy resin surround and seep into the fissure formed where it will crystallise to further expand the fissure. This is most likely to occur between the platinum cathode and epoxy resin dome and regrettably will cause most damage at this point. Damage to the electrode can be observed under low power microscopy (x10 magnification) as a broad white collar around the neck of the platinum as shown in the image left. The effect of this will be to cause instability and drift of the electrode signal and a large increase in the level of electrical signal observed in zero oxygen (residual current). This will have the effect of reducing the ability of the electrode to measure small changes in oxygen flux and will eventually render the electrode unserviceable and beyond economic repair. The disc will require replacement.
Cleaning with Unsuitable Materials.
Hansatech Instruments Ltd offer the S16 cleaning kit for maintenance of the oxygen electrode disc. The kit contains special cleaning pastes which are recommended for optimal electrode performance. In the absence of this kit, users have resorted to cleaning the electrode with various abrasive compounds including commercial metal polishes or smoker's toothpastes etc. We would caution against the use of inappropriate materials as they may cause irreversible damage to the electrode. Some metal polishes are harmful to the disc as they can contain an ammonia base or solvent additive. These substances can cause irreversible poisoning to the platinum cathode and could also cause significant damage to the epoxy resin. Excessive cleaning with abrasive substances can badly scratch and alter the profile of the electrode dome which may cause an uneven layer of electrolyte across the cathode leading to instability, drift and lack of responsiveness of the oxygen signal.
The S16 electrode cleaning kit is supplied with all Oxygraph and Oxytherm Systems and can also be obtained by contacting us directly. Details of the cleaning procedure can be found in the Cleaning and Maintenance section.
13

Chapter 2Oxytherm Electrode
Control Unit

Introduction to Oxytherm.The Oxytherm respirometer is designed to provide computer control of Oxygen uptake or evolution measurements across a broad range of applications from studies of cellular and mitochondrial respiration to photosynthesis of isolated chloroplast suspensions. The system may be configured as a single or multi-channel system in order to make measurements of oxygen in liquid-phase. Simultaneous recording of an optional auxiliary input signal (e.g. temperature, pH, fluorescence, TPP+ or other specific ion electrodes etc) is also possible using the appropriate apparatus coupled via the Auxiliary input.
A system comprises a minimum of one (maximum of eight) control units linked together in a chain to the serial port of an IBM® compatible Windows® computer. Each control unit features a built-in magnetic stirrer, custom Peltier temperature controlled electrode chamber and all the electronics required to control and measure the signal from the oxygen electrode. Oxytherm control units may be freely mixed with Oxygraph electrode control units within a multi-channel system.
A custom Windows® software package, Oxygraph Plus, permits independent control over the gain and back-off applied to each electrode unit with simple calibration routines for both liquid and gas-phase measurements. Data from each of the electrodes is plotted as a chart-recorder emulation in "real-time". Completed experiments are saved to a *.CSV (Comma Separated Values) which then may be opened in other Windows® applications.
Setting Up Oxytherm.Connections to the Oxytherm.
Before making any measurements, it is important that the system is set up correctly. The diagram on the following page shows the various connections that must be made to the control units.
Ensure that the 12V power supply is connected to the 12V input socket on the control unit. Confirmation that this connection has been made is shown by an illuminated green LED on the front panel of the control unit. Connect the RS232 serial cable to an available serial port on the PC. Connect the other end of the RS232 cable to the INPUT RS232 connection on the rear of the control unit. If more than 1 control unit is to be used, connect a second serial cable from the OUTPUT connection of the first channel control unit to the INPUT connection on the second channel unit. More details of multi-channel systems can be found in the Multi-channel systems section. Connect the prepared electrode disc to the control unit via the electrode connection cable. If an auxiliary signal is to be recorded, connect the cable to the auxiliary input next to the electrode disc input on the rear of the control unit.
15

Multi-Channel Systems.
Oxytherm control units are capable of operating either as stand alone systems or in complex multi-channel systems consisting of up to 8 control units. These control units may consist of a mixture of Oxygraph and Oxytherm units linked together via an RS232 serial chain, all connected to and operated by a single PC.
Each of the control units in the serial chain must be calibrated independently to allow for differences in electrode performance. As a result the Oxygraph Plus software must identify each of the units in the chain in order to apply the correct calibration factor to each of the acquired data sets.
This is achieved by referencing a unique serial number that is written to a memory device inside each control unit at the factory and a box identification number (ID) that is assigned by the software and stored to memory within the control unit. The first step during hardware configuration is to assign box ID numbers to each of the control units within the chain. New control units are supplied with a box ID setting of zero to indicate that they are UNASSIGNED. The following guidelines should be used in order to set up a system for multi-channel measurements.
What Additional Hardware is Required?
It is perfectly possible to link 2 Oxytherm control units together in a multi-channel setup without purchasing any additional hardware. However, there are options available which will cut the cost of multi-channel systems.
Connections to the Oxytherm
When running a multi-channel system, all units must be calibrated. Oxygraph Plus software will not allow a
recording from a system with calibrated and uncalibrated control units present.
16
It would not be necessary to purchase a full set of spares and accessories with every control unit. Hansatech Instruments Ltd recommend the purchase of 1 spares and accessories kit for every 4 control units.
The most cost effective method of purchasing, for example, a system comprising 4 control units would include the following items:
1 x Oxytherm System complete Consists of control unit, Peltier electrode chamber, OXYT/ED electrode disc, RS232 serial cable, A2 membrane applicator, S2/P magnetic followers, S3 spare reaction vessels, S4 reel of membrane, S7B spare o-rings, S16 electrode cleaning kit, 12V power supply, mains cable and Oxygraph Plus software on mini CD ROM. 3 x OXYT1 additional channel Oxytherm control units including 3 x Peltier chamber, 3 x 12V power supply & mains cable, 3 x OXYT/ED electrode discs & RS232 serial cables.
For further information, please contact Hansatech Instruments Ltd at the address listed at the rear of this manual.
Linking Control Units Together.
Multiple control units are simply linked together via standard RS232 serial cables. Please follow the procedure below to configure a multi-channel system:
Connect the INPUT socket of the first channel control unit to the PC using an RS232 serial cable. Run the Oxygraph Plus software. A message will be displayed indicating that the control unit has been found and information regarding control unit type (Oxygraph or Oxytherm), serial number and calibration data is shown. As mentioned above, the control unit is assigned a unique identification number so that the software can distinguish between multiple control units. Select OK on the BOX ID INFORMATION window to proceed to the main screen. To attach the next channel control unit, connect the OUTPUT socket of the first channel control unit to the INPUT of the second channel control unit via an RS232 serial cable. Ensure that the second channel unit is powered. On the toolbar, select the icon to initiate a scan for new control units. When the new channels is found, a message is displayed indicating that a new control unit has been found with an ID number of 0. Oxygraph Plus assigns the next available number as the new ID. In this case, the ID is 2. Repeat this process with all remaining control units, adding one unit at a time.
Pitfalls!!
In a multi-channel system, it is crucial that all the control unit ID numbers are set to 0 before building the system. When leaving the factory, an ID of 0 is written to the unit memory by default. However, once the system has been used and new ID numbers have been assigned, it is important to be aware of which control unit is used as which channel.
If 2 units with identical ID numbers (other than 0) are connected to a serial chain, neither of these units will be recognised by the software. In this case, the following procedure should be followed.
17
Clearing a control unit ID.
Connect the control unit to be reset only to the PC serial port. Click the icon to recognise the attached control unit. Once confirmation has been accepted, select HARDWARE > BOX ID - CLEAR from the menu options. The software will present a message with the details of the connected control unit to be reset. Once cleared, the ID number of the control unit will be reset to 0. This unit may then be re-connected to the serial chain and is recognised by the software by following the procedure described above. Repeat this procedure for any other control units with conflicting ID numbers.
Using Multi-Channel Systems.
Channel Calibration and Configuration.
All control units within the serial chain must be treated as individual control units and may not be simultaneously calibrated or configured. Any function which requires individual control mechanisms have in place the ability to select the required channel number for which actions are to be performed.
Stirring.
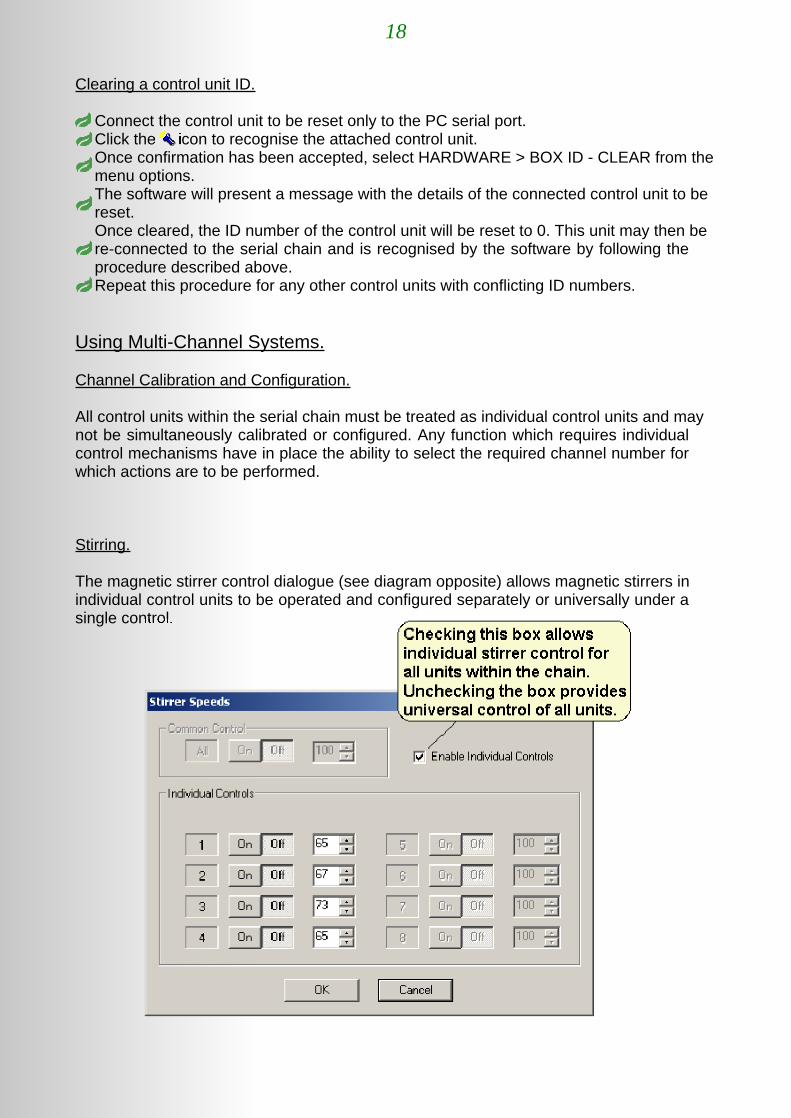
The magnetic stirrer control dialogue (see diagram opposite) allows magnetic stirrers in individual control units to be operated and configured separately or universally under a single control.
18
Signal Display.
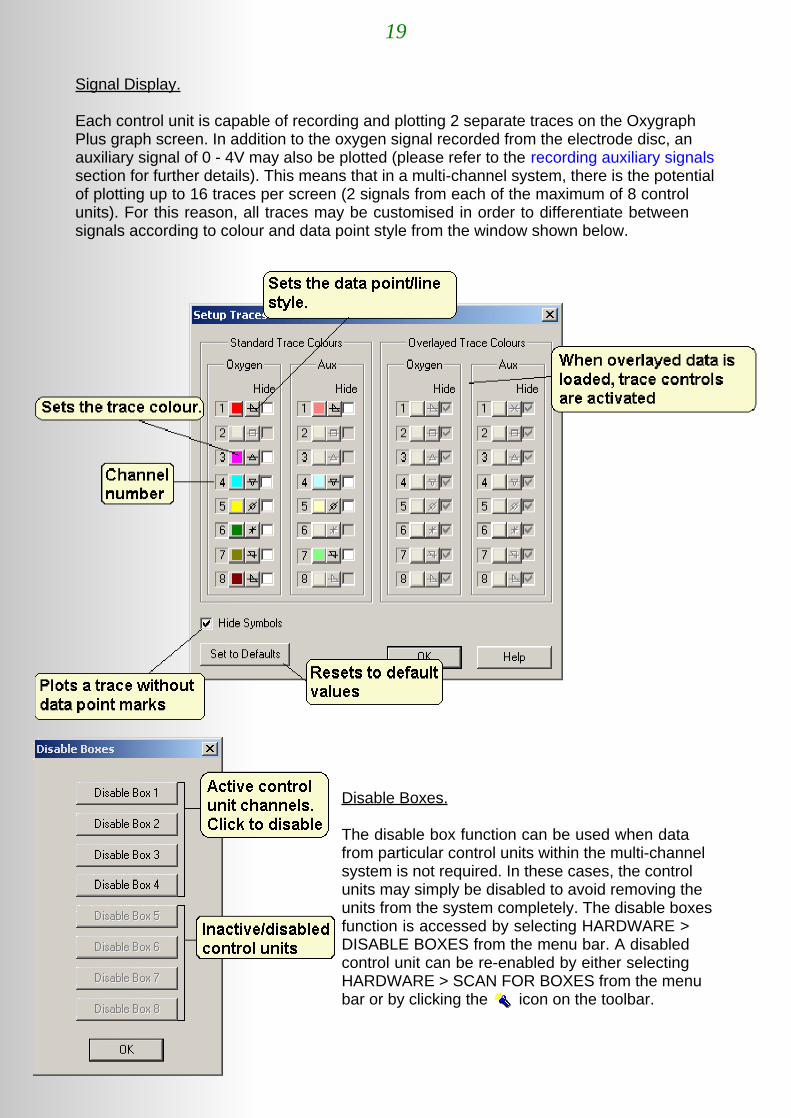
Each control unit is capable of recording and plotting 2 separate traces on the Oxygraph Plus graph screen. In addition to the oxygen signal recorded from the electrode disc, an auxiliary signal of 0 - 4V may also be plotted (please refer to the recording auxiliary signals section for further details). This means that in a multi-channel system, there is the potential of plotting up to 16 traces per screen (2 signals from each of the maximum of 8 control units). For this reason, all traces may be customised in order to differentiate between signals according to colour and data point style from the window shown below.
Disable Boxes.
The disable box function can be used when data from particular control units within the multi-channel system is not required. In these cases, the control units may simply be disabled to avoid removing the units from the system completely. The disable boxes function is accessed by selecting HARDWARE > DISABLE BOXES from the menu bar. A disabled control unit can be re-enabled by either selecting HARDWARE > SCAN FOR BOXES from the menu bar or by clicking the icon on the toolbar.
19

20
System Calibration.Liquid-Phase Calibration.
Before any measurements can take place, the electrode disc must be calibrated so that the electrical signal received from the disc can be presented as actual calibrated units (nmol/ml). Calibrating the disc for liquid-phase measurements involves a two step procedure in which the signal from the oxygen electrode is referenced to 2 known oxygen concentrations in order to derive an Offset and Calibration Factor.
The 2 calibration steps are:
Air Line.
According to the studies of G.A. Truesdale and A.L. Downing (The solubility of oxygen in water, 1954, Nature 173: 1236), at any given temperature and atmospheric pressure, air saturated, deionised water contains a known concentration of dissolved oxygen which may be calculated mathematically. The following information is used by the Oxygraph Plus software in order to accurately reference the electrical signal from the electrode for the air line stage of calibration:
This data is based on measurements of dissolved oxygen in water at the given temperature and standard atmospheric pressure published by Truesdale & Downing (Nature 173:1236, 1954).
The formula used in calculating the oxygen values in the table is as follows:
Cs=14.16 - (0.394 * T) + (0.007714 * T^2) - (0.0000646 * T^3)
{Where Cs is the oxygen saturated concentration in ppm and T is temperature in °C}
1 ppm is equivalent to 1µg/ml or (1µg/32g/mol)=
Temperature (°C) Oxygen (PPM) Oxygen (nmol/ml)
0 14.16 442.5
5 12.37 386.6
10 10.92 341.3
15 9.76 305
20 8.84 276.3
25 8.11 253.4
30 7.52 235
35 7.02 219.4
0.03125 µmol/ml or
31.25 nmol/ml
21
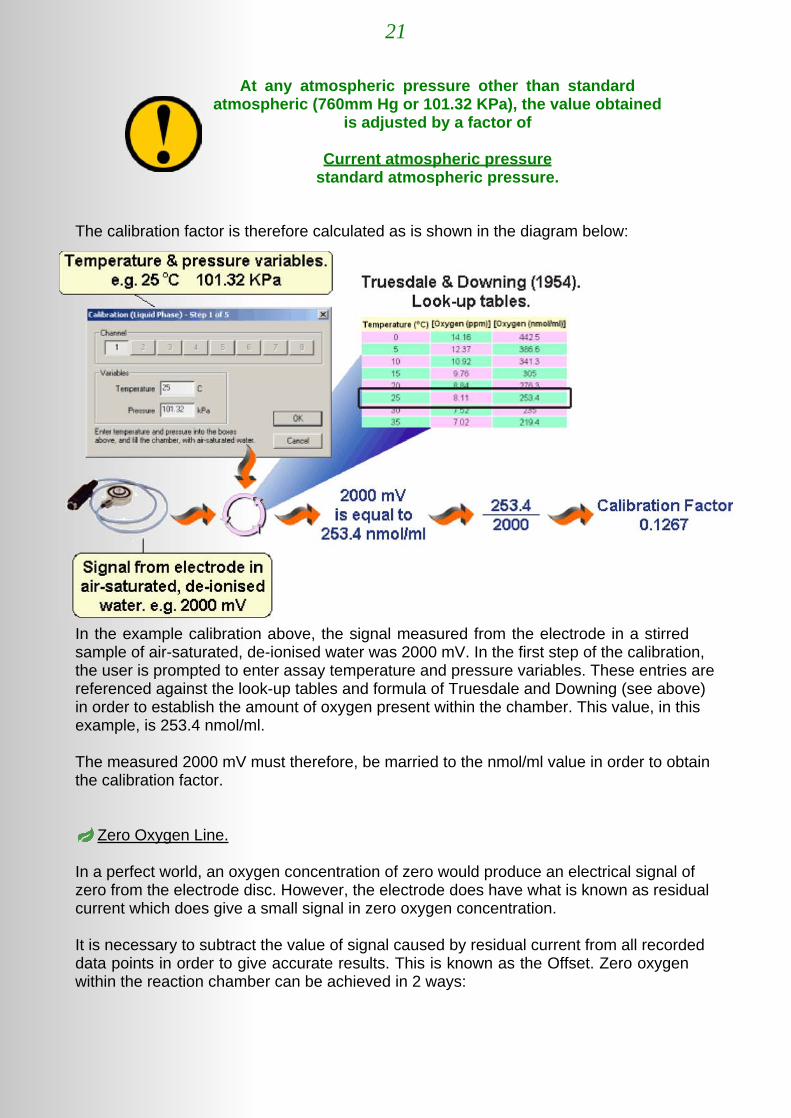
The calibration factor is therefore calculated as is shown in the diagram below:
In the example calibration above, the signal measured from the electrode in a stirred sample of air-saturated, de-ionised water was 2000 mV. In the first step of the calibration, the user is prompted to enter assay temperature and pressure variables. These entries are referenced against the look-up tables and formula of Truesdale and Downing (see above) in order to establish the amount of oxygen present within the chamber. This value, in this example, is 253.4 nmol/ml.
The measured 2000 mV must therefore, be married to the nmol/ml value in order to obtain the calibration factor.
Zero Oxygen Line.
In a perfect world, an oxygen concentration of zero would produce an electrical signal of zero from the electrode disc. However, the electrode does have what is known as residual current which does give a small signal in zero oxygen concentration.
It is necessary to subtract the value of signal caused by residual current from all recorded data points in order to give accurate results. This is known as the Offset. Zero oxygen within the reaction chamber can be achieved in 2 ways:
At any atmospheric pressure other than standard atmospheric (760mm Hg or 101.32 KPa), the value obtained
is adjusted by a factor of
Current atmospheric pressurestandard atmospheric pressure.

22
Sodium Dithionite. - The addition of a strong oxygen reducing agent such as sodium dithionite provides a good method of achieving zero oxygen. However, great care must be taken to remove all traces of the dithionite before commencing measurement as even a minute amount of remaining dithionite will have a serious effect on the oxygen concentration of the sample. Once removed, the chamber should be thoroughly rinsed with distilled water several times.
Nitrogen. - A more convenient method of achieving zero oxygen is to bubble nitrogen gas through the liquid in the reaction vessel in order to displace all the oxygen. This method is in some ways safer than the use of sodium dithionite as there is no risk of contaminating the actual sample during the measurement and there is less risk of damaging the membrane of the disc. However, the use of nitrogen is a slower process and to achieve zero line is more difficult than dithionite.
Performing a Liquid-Phase Calibration.
Please follow the guidelines below for the liquid-phase calibration sequence:
Prepare the disc as described in the Electrode Preparation and Maintenance section and install into the base of the electrode chamber. Connect the electrode disc to the rear of the control unit . Place approx. 2ml of air saturated, deionised water into the reaction vessel. Air saturated water is obtained by vigorously shaking a small quantity of deionised water (approx. 50ml) in a large conical flask (approx. 1L). Connect the Peltier electrode chamber to the rear of the Oxytherm control unit and ensure that the sample and electrode disc equilibrate to the temperature required by the assay before commencing calibration (Please refer to the Setting Up Temperature Control section).
The liquid-phase calibration sequence is activated either from the CALIBRATE > LIQUID PHASE CALIBRATION menu option or directly from the icon on the toolbar. Once activated, the following window is generated.
It is crucial that care is taken, when removing the sodium dithionite and water from the reaction vessel, that the membrane of the electrode is not damaged. The ideal method of removing liquid from the chamber is to use an aspirator with a soft, rubber tip (mind the flea!!!). If an
aspirator is not available, carefully use a Pasteur pipette to remove the liquid.
It is important to remember that the sample of air saturated water should be equilibrated to the assay temperature before the calibration procedure begins. It can be pre-equilibrated in a water bath or simply allowed sufficient time to reach temperature once added to the reaction
vessel.
23
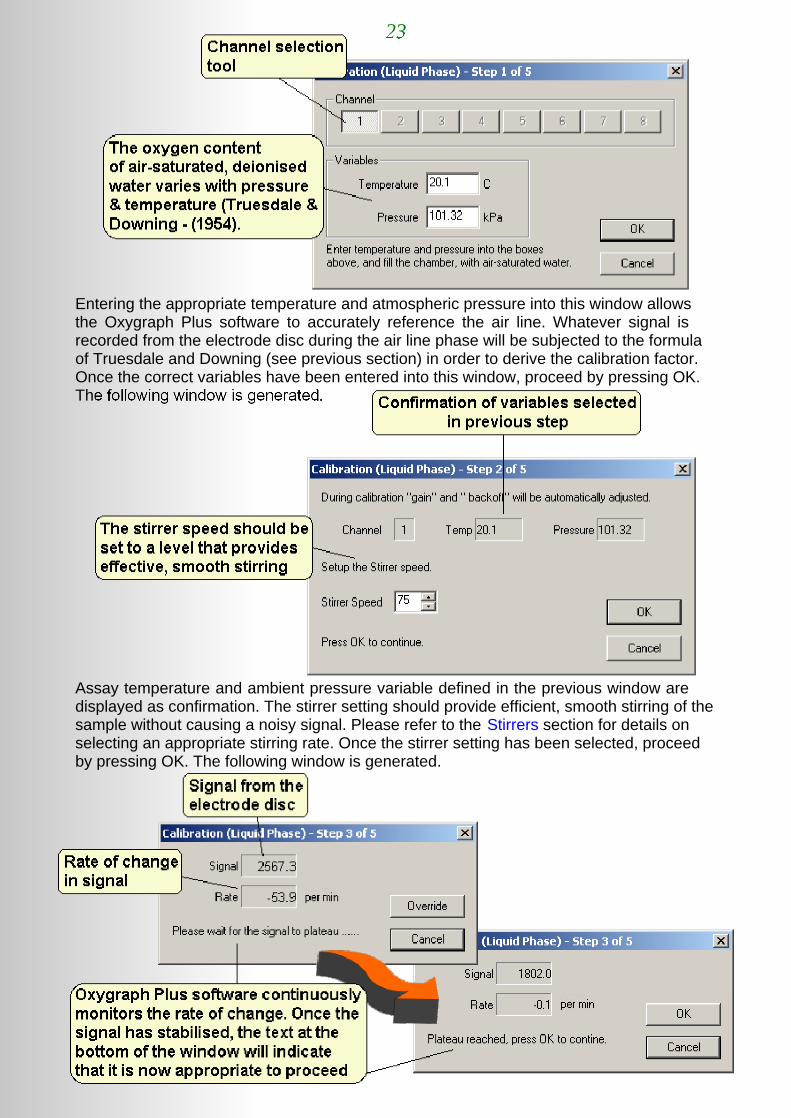
Entering the appropriate temperature and atmospheric pressure into this window allows the Oxygraph Plus software to accurately reference the air line. Whatever signal is recorded from the electrode disc during the air line phase will be subjected to the formula of Truesdale and Downing (see previous section) in order to derive the calibration factor. Once the correct variables have been entered into this window, proceed by pressing OK. The following window is generated.
Assay temperature and ambient pressure variable defined in the previous window are displayed as confirmation. The stirrer setting should provide efficient, smooth stirring of the sample without causing a noisy signal. Please refer to the Stirrers section for details on selecting an appropriate stirring rate. Once the stirrer setting has been selected, proceed by pressing OK. The following window is generated.

24
Observe the mV signal in the window above and wait until the prompt that a plateau has been reached. Once the signal is deemed to be stable, the OK button should be pressed in order to proceed.
If the signal from the electrode disc does not become stable after several minutes, this could be indicative of either one or a combination of several problems. For details on how to isolate the fault to either the electrode disc, the control unit or the electrode connection cable, please refer to the System Diagnostics section.
The second stage of the calibration procedure is to establish the zero oxygen line in order to determine the Offset (see previous section). To perform this stage, use either of the following methods:
Nitrogen gas. Bubble nitrogen gas into the reaction vessel in order to displace all the oxygen in the sample. Sodium Dithionite. A few crystals of this strong reducing agent is sufficient to reduce all the oxygen dissolved in the sample.
In the case of a new or well maintained electrode disc, you would normally expect to see a signal of approx. 1800mV
when measuring air line in air saturated water.
In the case of a new or well maintained electrode disc, you would normally expect to see a signal of less than 1% of the signal observed during the air line stage. For example, if the air line signal was 1802 mV, you would expect the zero line
to measure less than 18.02 mV.
25
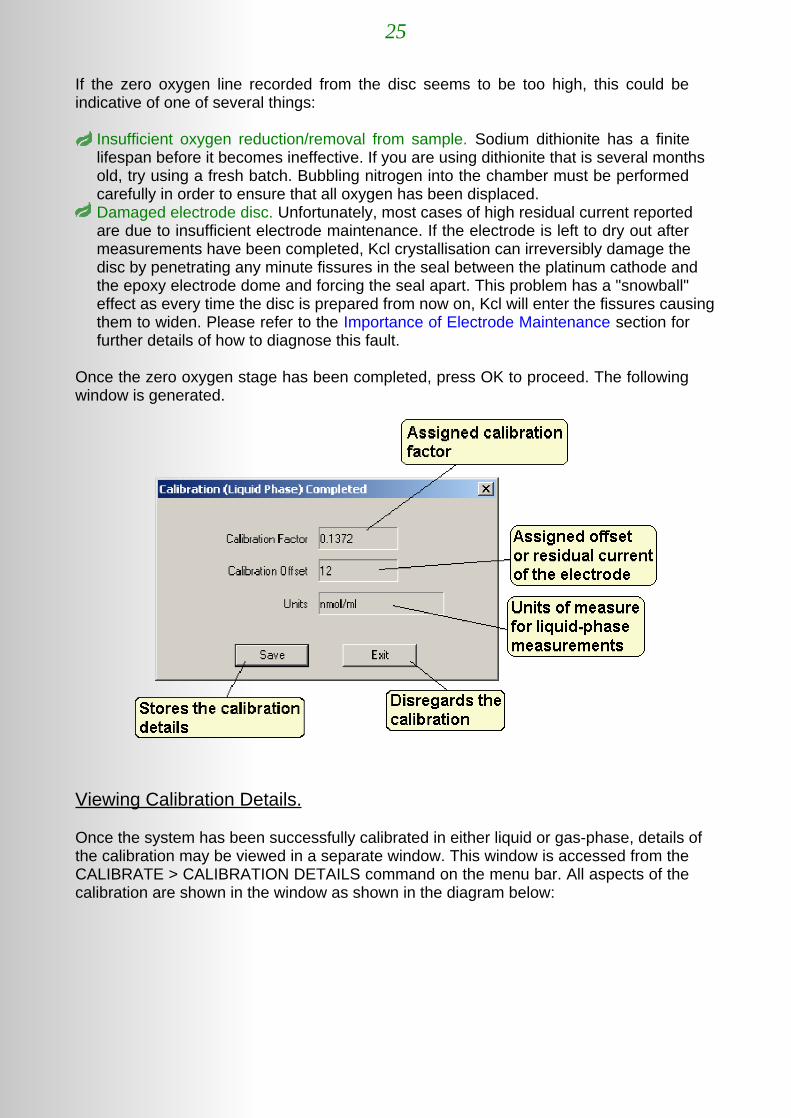
If the zero oxygen line recorded from the disc seems to be too high, this could be indicative of one of several things:
Insufficient oxygen reduction/removal from sample. Sodium dithionite has a finite lifespan before it becomes ineffective. If you are using dithionite that is several months old, try using a fresh batch. Bubbling nitrogen into the chamber must be performed carefully in order to ensure that all oxygen has been displaced. Damaged electrode disc. Unfortunately, most cases of high residual current reported are due to insufficient electrode maintenance. If the electrode is left to dry out after measurements have been completed, Kcl crystallisation can irreversibly damage the disc by penetrating any minute fissures in the seal between the platinum cathode and the epoxy electrode dome and forcing the seal apart. This problem has a "snowball" effect as every time the disc is prepared from now on, Kcl will enter the fissures causing them to widen. Please refer to the Importance of Electrode Maintenance section for further details of how to diagnose this fault.
Once the zero oxygen stage has been completed, press OK to proceed. The following window is generated.
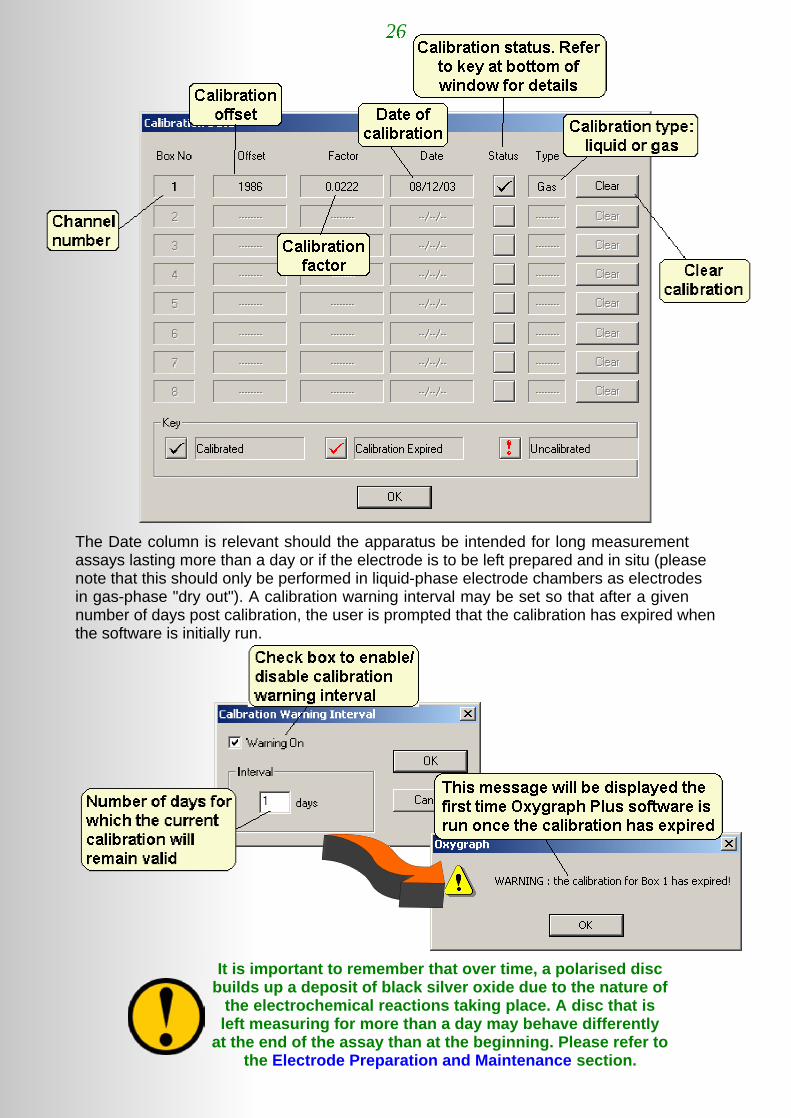
Viewing Calibration Details.
Once the system has been successfully calibrated in either liquid or gas-phase, details of the calibration may be viewed in a separate window. This window is accessed from the CALIBRATE > CALIBRATION DETAILS command on the menu bar. All aspects of the calibration are shown in the window as shown in the diagram below:
26
The Date column is relevant should the apparatus be intended for long measurement assays lasting more than a day or if the electrode is to be left prepared and in situ (please note that this should only be performed in liquid-phase electrode chambers as electrodes in gas-phase "dry out"). A calibration warning interval may be set so that after a given number of days post calibration, the user is prompted that the calibration has expired when the software is initially run.
It is important to remember that over time, a polarised disc builds up a deposit of black silver oxide due to the nature of
the electrochemical reactions taking place. A disc that is left measuring for more than a day may behave differently
at the end of the assay than at the beginning. Please refer to the Electrode Preparation and Maintenance section.
27
Oxytherm Operation.Oxygraph Plus.
Overview.
Oxygraph Plus software has been designed to allow the maximum flexibility possible for the Oxytherm control unit. These systems are in use world wide for a broad range of different applications in liquid-phase photosynthesis & respiration measurement environments. The software must therefore encompass a range of features that may be adapted to the needs of many different users.
Oxygraph Plus provides a powerful instrument control and data acquisition / analysis tool for students and researchers alike with the ability to save recorded data as CSV (Comma Separated Values) file which may be opened directly into Microsoft Excel for advanced statistical analysis and the comprehensive Print feature which provides printed information on all aspects of the experiment from calibration and gain settings to marked events during the course of the experiment in addition to the recorded oxygen trace.
Running Oxygraph Plus.
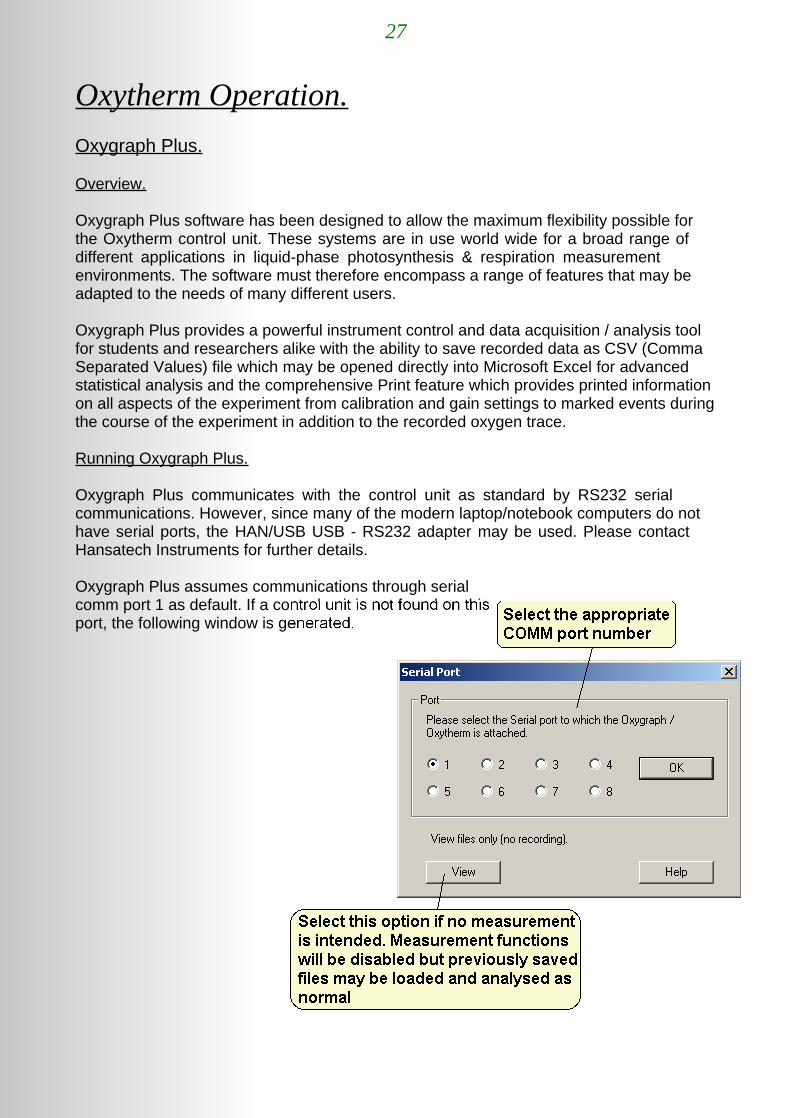
Oxygraph Plus communicates with the control unit as standard by RS232 serial communications. However, since many of the modern laptop/notebook computers do not have serial ports, the HAN/USB USB - RS232 adapter may be used. Please contact Hansatech Instruments for further details.
Oxygraph Plus assumes communications through serial comm port 1 as default. If a control unit is not found on this port, the following window is generated.

28
If an incorrect port is selected, the window will be further displayed until communications are established. If communications cannot be established, check that the serial cable is properly connected both at the control unit and the PC and if necessary, try a different RS232 cable. Ensure that the control unit is powered.
Accessory hardware within the computer may already occupy the COMM port even though there is no apparent connection at the COMM socket. This is often the case with internal modem cards which typically use one of the serial ports for data transfer. Such devices are usually configured to load device drivers during computer boot-up. These must be removed to permit normal serial port operation. Check the System Properties on the PC for further information.
If communications still cannot be established, please contact Hansatech Instruments for further advice.
The screenshot below shows the main features of the Oxygraph Plus software.
The different features of the software are explained in the following sections of this document.
Graph Functions.
The graph area of the Oxygraph Plus software allows the signal from the electrode disc (and optional auxiliary input) to be plotted on the PC screen as a real-time chart recorder emulation. Various controls and functions exist to facilitate the way in which part or all of an experiment is displayed on screen.
29
Recording a Signal.
Recording is activated either by selecting HARDWARE > START RECORDING from the menu bar or by pressing the icon found on the toolbar. Any unsaved data onscreen will cause the following warning to appear:
Selecting Overwrite will delete any information currently displayed before creating a new trace. Append begins the new recording after the final data point of the displayed trace. A Restart event mark is entered to signify the beginning of the new trace.
The recorded signal is plotted to the graph at the pre-defined data acquisition rate. Once the trace reaches to right side of the graph, the screen begins to scroll. Data recorded that is not in view may be easily reviewed by moving the horizontal scroll bar at the bottom of the graph. This does not affect normal measurement.
During recording, most of the functions of the software may still be used. Any function used that may have a baring on the displayed data (such as gain/back off adjustment, stirrer speed alteration) is event marked automatically by the software.
The recording is stopped either by selecting HARDWARE > STOP RECORDING from the menu bar or by pressing the icon.
Setting the Measurement Axes.
Oxygraph Plus features a comprehensive range of zoom controls in order that the recorded data may be presented most efficiently on screen. They can be accessed either by selecting one of the options in the GRAPH menu bar option or by clicking one of the following icons:
Zoom Window ( ). - Clicking this icon allows a selected portion of the trace to be enlarged. Clicking this icon changes the mouse cursor to cross hairs. Clicking on the graph activates the selection window. Drag the window to highlight the required section and click the mouse again to zoom.
Auto Zoom ( ). - Clicking this icon automatically re-sizes the axes to efficiently present all recorded data.
Zoom XY ( ). - Clicking this icon opens the manual Set Axes window.
30
Axes are adjusted by entering in the required from and to values for oxygen, time and optional auxiliary axes. The gridlines on the graph can also be modified in this screen.
Increase Zoom ( ). - Clicking this function zooms in on the center section of the screen.
Decrease Zoom ( ). - Clicking this function zooms out of the screen.
Undo Zoom ( ). - Click this icon to undo the previous zoom command.
Trace Settings. Each control unit is capable of recording and plotting 2 separate traces on the Oxygraph Plus graph screen. In addition to the oxygen signal recorded from the electrode disc, an auxiliary signal of 0 - 4V may also be plotted (refer to the recording auxiliary signals section for further details). This means that in a multi-channel system, there is the potential of plotting up to 16 traces per screen (2 signals from each of the maximum of 8 control units). For this reason, all traces may be customised in order to facilitate differentiation between signals according to colour and data point style from the window shown below.
31
The Data Bar.The Oxygraph Plus data bar presents a digital read out of the signals from the control unit. Data from multi-channel systems will be displayed on individual lines. The information displayed is as follows:
Trace colours. Both oxygen and auxiliary trace colours are represented in the data bar so that information can easily be matched to traces on screen in multi channel systems. Oxygen electrode signal. Presented in mV when uncalibrated and nmols/ml (liquid-phase) or µmol/RTA (gas-phase) when calibrated. Calibration indicator. Indicates whether the channel is:
= Calibrated = Calibration has expired (see Calibration Details section). = Uncalibrated.
Live rate. Displays the Live Rate according to the options selected (please refer to the Rate section for further details). Auxiliary signal. Displays the signal from an auxiliary input in arbitrary units if enabled (please see Recording Auxiliary Signals for further details). Set and actual chamber temperature (Please refer to the Setting Up Temperature Control section).
The data bar is positioned by default on the right hand side of the Oxygraph Plus screen but can however, be move to either top, bottom or left side of the screen. The bar can be moved by right clicking and selecting MOVE. The data bar will then follow the mouse cursor around the screen. Clicking the mouse at the required position will place the data bar.

32
Clicking the right mouse button on the data bar brings up a separate window of options as shown in the diagram above. This window allows any of the columns (except for the oxygen signal, this is always visible) to be hidden or shown simply by clicking the appropriate column heading. The default setting shows the live rate along with the oxygen signal, trace colour and calibration status which are displayed as standard and are not selectable.
The data bar also has an autohide (Lock) feature which can be switched on or off either from the right click menu or by using the small padlock icon in the bottom right corner of the data bar. This allows the data bar to collapse showing only the oxygen signal. Hovering the mouse over the data bar expands to reveal any other columns which are currently selected.
Other features of the data bar are selectable font size (either small or large fonts) and a flashing recording indicator in the bottom left corner of the data bar.
The Menu Bar.
The Oxygraph Plus menu bar provides access to all the functions and features of the software. The functions and commands are organised into several distinct menu bar categories.
Files Menu.
New Creates a new document.Open Opens a previously save document.Overlay Opens a previously saved document and overlays on to a file already displayed on screen.Save File save functions. Save As ----------Print Printing functions.Print Preview Please refer to the PrintPrint Setup Files section for further information.----------(Recently viewed /recorded files. Clickon the relevant titleto open)----------Exit Quit the application. Prompts to save the active file.
33
Hardware Menu.Start Recording Recording controls. PleaseStop Recording refer to the Recording Data section for further information.----------Channel Configuration Setup the gain and back-off for each channel. Refer to the Channel Configuration section for further information.Auxiliary Channels Auxiliary channel controls. Refer to the Recording Auxiliary Data section for further information.Stirrer Speed Sets the stirrer speed. Refer to the Stirrers section for further information.Temperature Control Oxytherm only.----------Scan for Boxes Scans for control units currently connected to the PC. Once found, serial number, type (Oxygraph or Oxytherm) and calibration status are displayed.Disable Boxes Allows active control units to be disabled. Refer to the Disable Control Units section for further information.Box ID - Clear Clears the unique identification number of a control unit. Refer to the Clearing a Control Unit ID section for further information.Box Test Performs a range of manual and automatic diagnostic tests on the control unit. Refer to the System Diagnostics section for further information.
Calibrate Menu.Liquid Phase Calibration Launches the liquid-phase calibration routine. Refer to the Liquid-Phase Calibration section for further information.Gas Phase Calibration Launches the gas-phase calibration routine. ----------Calibration Details Displays details of current calibration settings including expiry Set Warning Interval warning details. Refer to the View Calibration Details section for further information.
View Menu.File Information View full details of the active file including filename and path, date, start time, acquisition rate, version, comment and information. Refer to the File Information section for further information.Toolbar Toggles toolbar on and off.Status Bar Toggles status bar on and off.
Graph Menu.Setup Trace Colours Allows trace colour and data point marker to be customised. Refer to the Trace Settings section for further information.Display Overlayed Traces Hides any overlayed traces when unchecked.----------Zoom WindowZoom AutoZoom XY Axes zoom controls. Refer to the Set Measurement Axes Zoom Plus section for further information.Zoom MinusZoom Undo
Data Bar Menu.Rate DataAux DataSet Temperature Data bar controls. Refer to the Data Bar section for further Actual Temperature information.----------Small FontMoveLocked
Tools Menu.Graph Data Toggles between the graph screen and the tabulated data Tabulate Data screen. Refer to the Tabulated Data section for further information.----------Add Event Mark Edit Event Marks Event mark controls. Refer to the Event Marking section for Delete Event Marks further information.----------Options Displays options for printing format and rate label display. Refer to the Options section for further information
Rate Menu.Setup Live Rate Display Allows the number of data points over which the live rate is calculated to be amended. Refer to the Setup Live Rate section for further information.----------Rate CursorsEnter Rate Cursor TimesDisplay Rate Table Rate measurement analysis controls. Refer to the Rate Add Rate to Table Measurements section for further information.Select ChannelsSetup ‘Line of Best Fit’
Help Menu.Help Launches the Oxygraph Plus HTML help files.About Oxygraph Displays Oxygraph Plus version and copyright information.
The Toolbar.
The Oxygraph Plus tool bar provides access to the main functions and features of the software.
Opens previously saved data files.
Save active data file. Refer to Data Export section for further information.
Opens the printer dialogue. Refer to the Printing Data section for further information.
Recording controls (Start / Stop). Refer to the Recording a Signal section for further information.
34
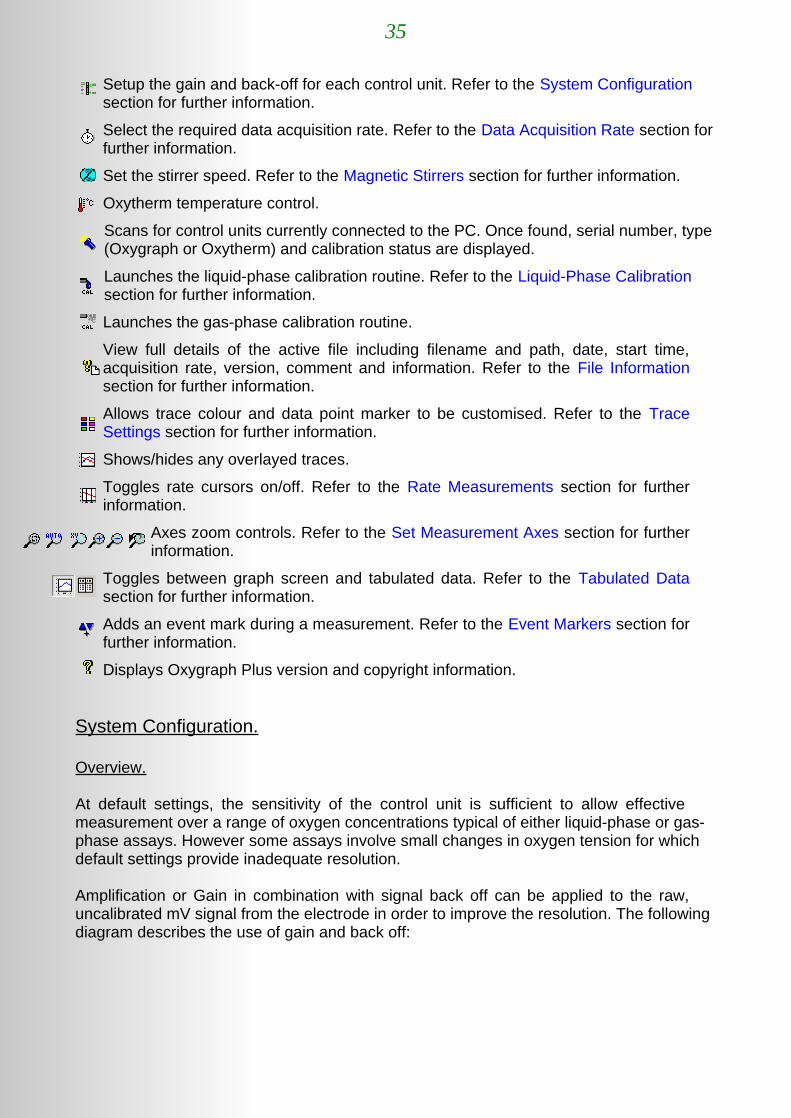
Setup the gain and back-off for each control unit. Refer to the System Configuration section for further information.
Select the required data acquisition rate. Refer to the Data Acquisition Rate section for further information.
Set the stirrer speed. Refer to the Magnetic Stirrers section for further information.
Oxytherm temperature control.
Scans for control units currently connected to the PC. Once found, serial number, type (Oxygraph or Oxytherm) and calibration status are displayed.
Launches the liquid-phase calibration routine. Refer to the Liquid-Phase Calibration section for further information.
Launches the gas-phase calibration routine.
View full details of the active file including filename and path, date, start time, acquisition rate, version, comment and information. Refer to the File Information section for further information.
Allows trace colour and data point marker to be customised. Refer to the Trace Settings section for further information.
Shows/hides any overlayed traces.
Toggles rate cursors on/off. Refer to the Rate Measurements section for further information.
Axes zoom controls. Refer to the Set Measurement Axes section for further information.
Toggles between graph screen and tabulated data. Refer to the Tabulated Data section for further information.
Adds an event mark during a measurement. Refer to the Event Markers section for further information.
Displays Oxygraph Plus version and copyright information.
System Configuration.
Overview.
At default settings, the sensitivity of the control unit is sufficient to allow effective measurement over a range of oxygen concentrations typical of either liquid-phase or gas-phase assays. However some assays involve small changes in oxygen tension for which default settings provide inadequate resolution.
Amplification or Gain in combination with signal back off can be applied to the raw, uncalibrated mV signal from the electrode in order to improve the resolution. The following diagram describes the use of gain and back off:
35
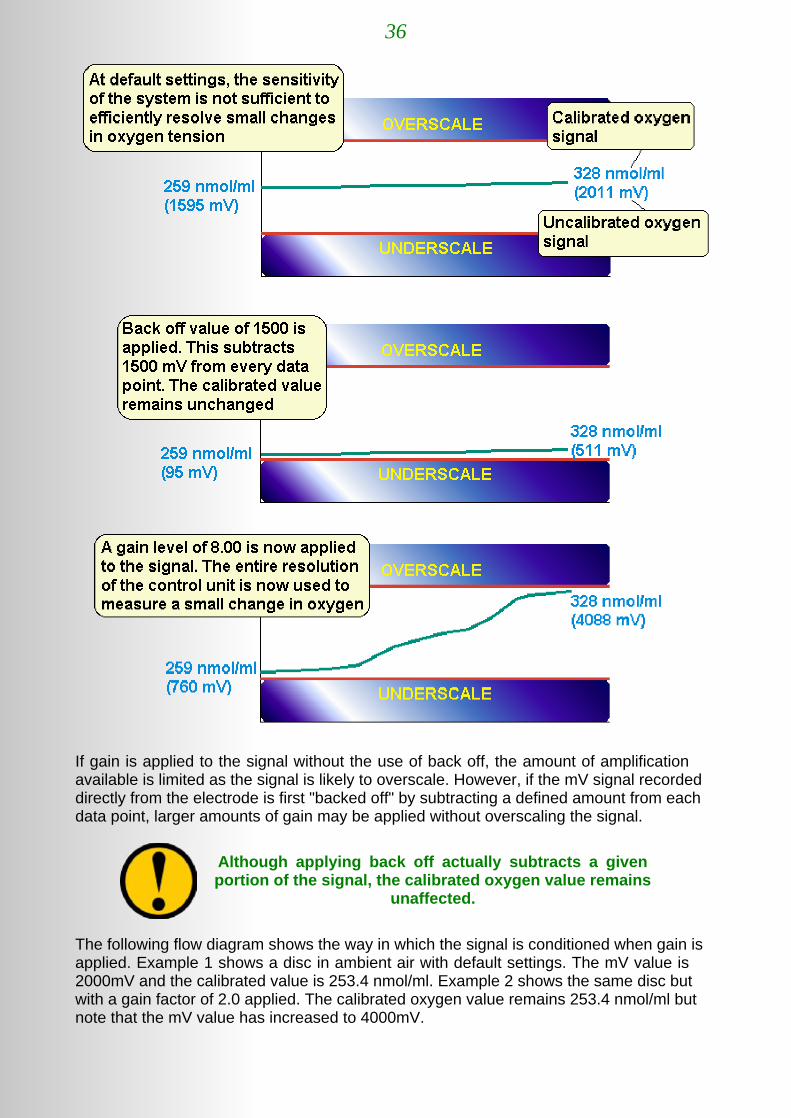
If gain is applied to the signal without the use of back off, the amount of amplification available is limited as the signal is likely to overscale. However, if the mV signal recorded directly from the electrode is first "backed off" by subtracting a defined amount from each data point, larger amounts of gain may be applied without overscaling the signal.
The following flow diagram shows the way in which the signal is conditioned when gain is applied. Example 1 shows a disc in ambient air with default settings. The mV value is 2000mV and the calibrated value is 253.4 nmol/ml. Example 2 shows the same disc but with a gain factor of 2.0 applied. The calibrated oxygen value remains 253.4 nmol/ml but note that the mV value has increased to 4000mV.
36
Although applying back off actually subtracts a given portion of the signal, the calibrated oxygen value remains
unaffected.
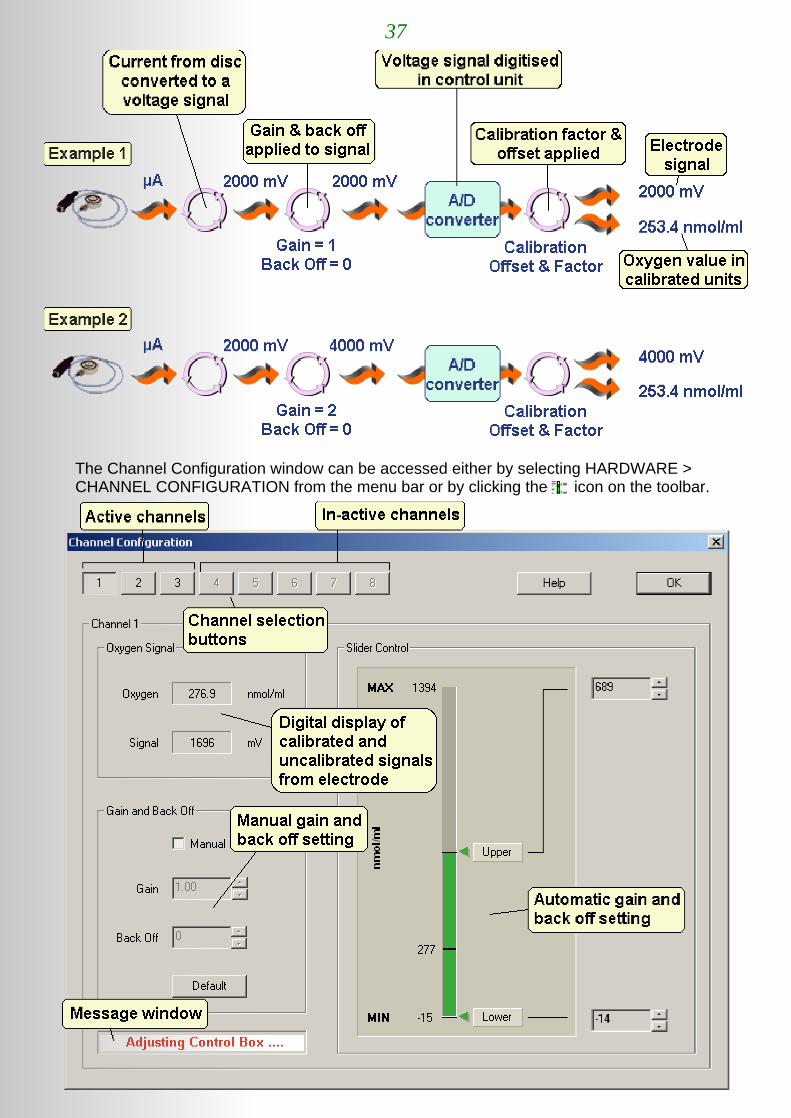
The Channel Configuration window can be accessed either by selecting HARDWARE > CHANNEL CONFIGURATION from the menu bar or by clicking the icon on the toolbar.
37

The window is divided into separate areas:
Channel selection.The buttons at the top of the window correspond to the possible 8 channels of a multi-channel system. Channels which are actively connected to the system are clickable whereas inactive channels are grayed out.
Digital display of calibrated and uncalibrated electrode signal. These 2 panel meters show the readout from the electrode disc as a digital value. The calibrated units are displayed in nmol/ml for liquid-phase calibrations. When alterations are made to gain and back off settings either manually or automatically, the changes will be clearly displayed in this section of the Configuration window. The uncalibrated signal will be affected by any changes whereas the calibrated value will always remain constant.
Manual gain and back off setting.
Gain and back off can be adjusted manually by checking the checkbox in this section of the window. The required level of back off should be applied first before the gain is increased. Any changes in gain and back off will be reflected in the digital display panel meters. Adjusting the gain and back off will also generate an Adjusting Control Box .... message in the message window below. Default values can be restored by clicking the Default button in this section of the window.
38
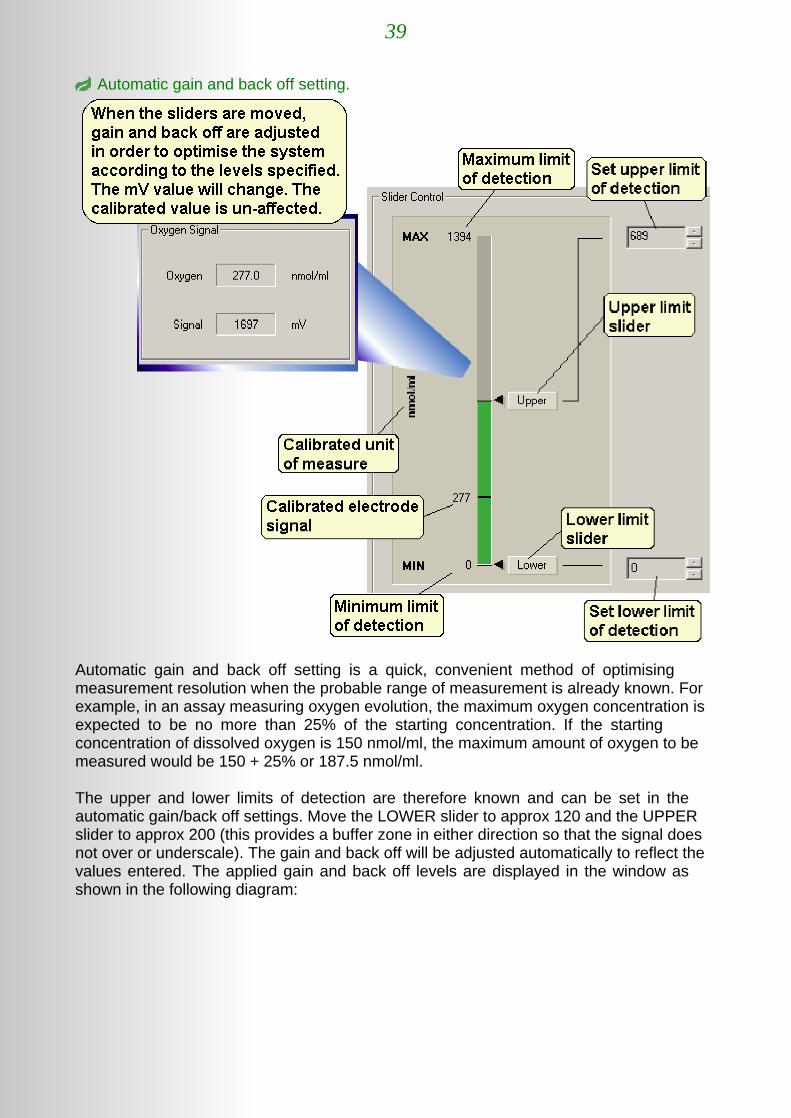
Automatic gain and back off setting.
Automatic gain and back off setting is a quick, convenient method of optimising measurement resolution when the probable range of measurement is already known. For example, in an assay measuring oxygen evolution, the maximum oxygen concentration is expected to be no more than 25% of the starting concentration. If the starting concentration of dissolved oxygen is 150 nmol/ml, the maximum amount of oxygen to be measured would be 150 + 25% or 187.5 nmol/ml.
The upper and lower limits of detection are therefore known and can be set in the automatic gain/back off settings. Move the LOWER slider to approx 120 and the UPPER slider to approx 200 (this provides a buffer zone in either direction so that the signal does not over or underscale). The gain and back off will be adjusted automatically to reflect the values entered. The applied gain and back off levels are displayed in the window as shown in the following diagram:
39
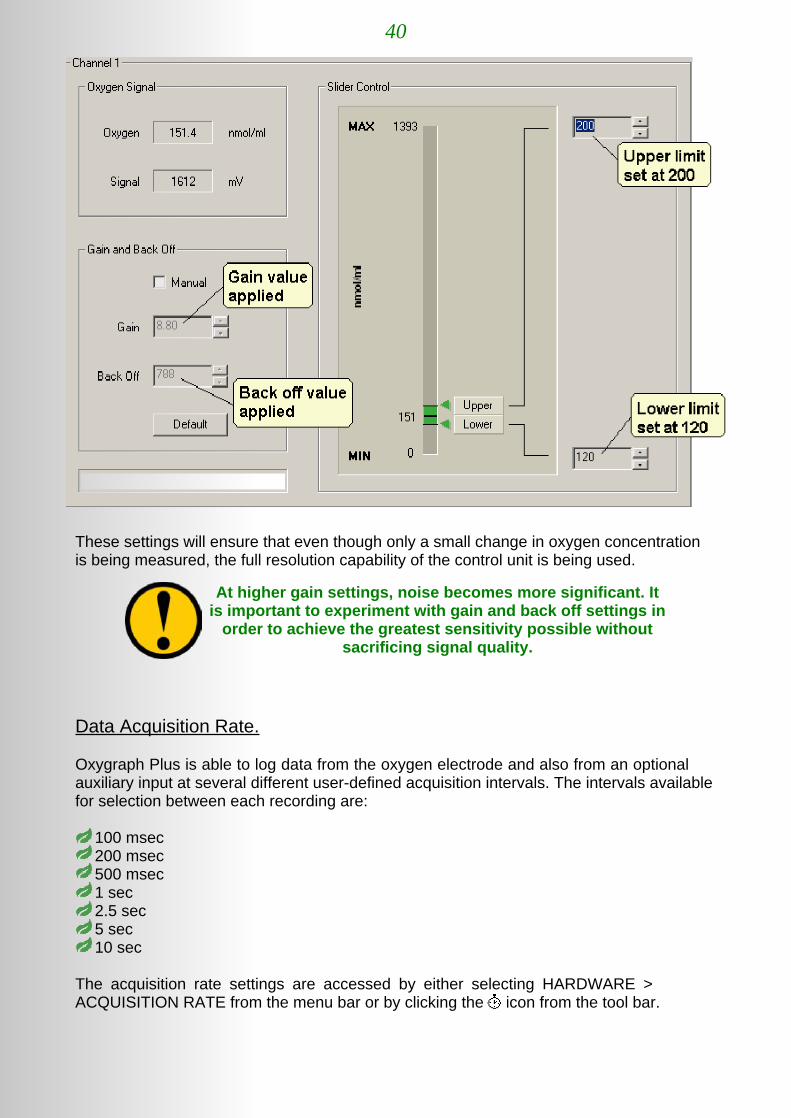
These settings will ensure that even though only a small change in oxygen concentration is being measured, the full resolution capability of the control unit is being used.
Data Acquisition Rate.
Oxygraph Plus is able to log data from the oxygen electrode and also from an optional auxiliary input at several different user-defined acquisition intervals. The intervals available for selection between each recording are:
100 msec 200 msec 500 msec 1 sec 2.5 sec 5 sec 10 sec
The acquisition rate settings are accessed by either selecting HARDWARE > ACQUISITION RATE from the menu bar or by clicking the icon from the tool bar.
40
At higher gain settings, noise becomes more significant. It is important to experiment with gain and back off settings in
order to achieve the greatest sensitivity possible without sacrificing signal quality.
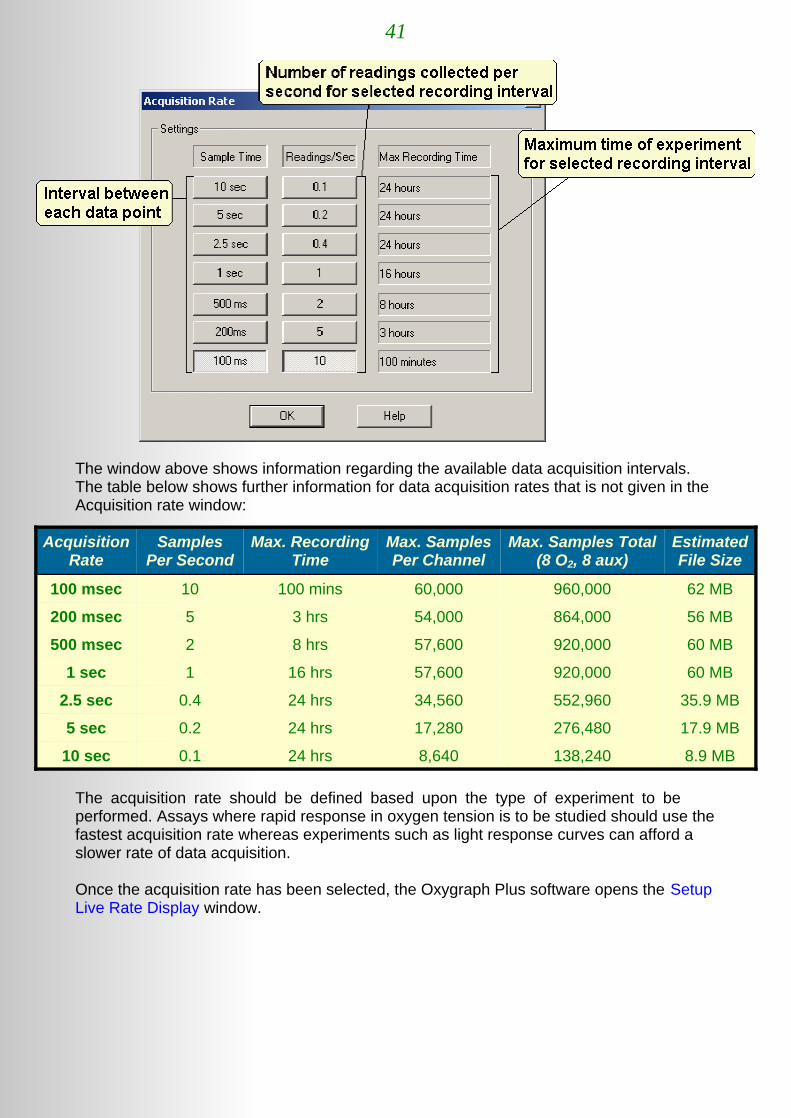
The window above shows information regarding the available data acquisition intervals. The table below shows further information for data acquisition rates that is not given in the Acquisition rate window:
The acquisition rate should be defined based upon the type of experiment to be performed. Assays where rapid response in oxygen tension is to be studied should use the fastest acquisition rate whereas experiments such as light response curves can afford a slower rate of data acquisition.
Once the acquisition rate has been selected, the Oxygraph Plus software opens the Setup Live Rate Display window.
41
AcquisitionRate
Samples Per Second
Max. Recording Time
Max. Samples Per Channel
Max. Samples Total(8 O2, 8 aux)
Estimated File Size
100 msec 10 100 mins 60,000 960,000 62 MB
200 msec 5 3 hrs 54,000 864,000 56 MB
500 msec 2 8 hrs 57,600 920,000 60 MB
1 sec 1 16 hrs 57,600 920,000 60 MB
2.5 sec 0.4 24 hrs 34,560 552,960 35.9 MB
5 sec 0.2 24 hrs 17,280 276,480 17.9 MB
10 sec 0.1 24 hrs 8,640 138,240 8.9 MB

Temperature Control.
Overview.
Oxytherm control units are designed to perform measurements of oxygen across a broad spectrum of applications from the biomedical field through to plant physiology. All experimental assays will have an optimum temperature at which the sample will be most efficient in either evolving or consuming oxygen and it is important that this experimental temperature is maintained at all times throughout the duration of the experiment. This includes ensuring that any additions to be made to the reaction vessel during the experiment are pre-equilibrated to the assay temperature before being added.
The assay temperature needs to be decided as one of the initial considerations of the experiment as the apparatus is calibrated based on a specified temperature.
Temperature Effects on Liquid-Phase Samples.
According to the studies of G.A. Truesdale and A.L. Downing (The solubility of oxygen in water, 1954, Nature 173: 1236), at any given temperature and atmospheric pressure, air saturated, de-ionised water contains a known concentration of dissolved oxygen which may be calculated mathematically.
This data is based on measurements of dissolved oxygen in water at the given temperature and standard atmospheric pressure published by Truesdale & Downing (Nature 173:1236, 1954).
The formula used in calculating the oxygen values in the table is as follows:
Cs=14.16 - (0.394 * T) + (0.007714 * T^2) - (0.0000646 * T^3)
{Where Cs is the oxygen saturated concentration in ppm and T is temperature in °C}
0.03125 µmol/ml 1 ppm is equivalent to 1µg/ml or (1µg/32g/mol)= or 31.25 nmol/ml
42
Temperature (°C) Oxygen (PPM) Oxygen (nmol/ml)
0 14.16 442.5
5 12.37 386.6
10 10.92 341.3
15 9.76 305
20 8.84 276.3
25 8.11 253.4
30 7.52 235
35 7.02 219.4
Temperature Effects on the Electrode Disc.
From the information above, we can say that oxygen concentration decreases as temperature increases. However, in addition to this effect, the oxygen electrode disc itself is also sensitive to temperature.
The electrode disc signal increases with an increase in temperature. Therefore, the response from the disc opposes that of the oxygen signal at different temperatures. In assays where higher temperatures are used (such as mitochondrial respiration studies), it is recommended that the disc is fully equilibrated to the assay temperature before any calibration or measurement takes place. This can take up to 15 minutes and can be observed as follows:
Prepare the electrode disc and mount correctly into the base of the electrode chamber. Add a 1ml, stirred sample of air-saturated, de-ionised water that is pre-equilibrated to the experimental temperature to the chamber. Ensure the Peltier chamber is connected correctly to the rear of the control unit and set the required assay temperature from the Oxygraph Plus software (Refer to Setting Up Temperature Control section for more information). Begin a recording from the electrode disc and observe the oxygen signal. If the experimental temperature is high (e.g. 37°C), the signal from the electrode disc will initially rise due to the temperature sensitivity of the disc. Once the disc begins to equilibrate to the temperature, the signal will begin to decline as the higher temperature effect on the sample is opposite. Once the signal from the disc has re-stabilised, the disc is equilibrated to the assay temperature and calibration may be performed.
Setting Up Temperature Control.
The Peltier electrode chamber consists of a precision bore borosilicate glass tube encased within a peltier block leaving a small section at the front of the vessel open for sample visualisation purposes. The chamber uses a resistive element to warm the reaction vessel and a Peltier element for cooling purposes.
Reaction vessel temperature is maintained by the Oxytherm via signals from an internal thermistor mounted against the outer wall of the vessel. These signals are continuously monitored and the chamber automatically switches between heating and cooling in order to maintain the sample at a constant temperature to a high degree of accuracy.
Temperature controls for the chamber are accessed from the HARDWARE > TEMPERATURE CONTROL option from the menu bar or by clicking the icon on the toolbar.
The following dialog is generated by the software:
43

Sample temperatures may be selected from the Oxygraph Plus software at 0.1oC intervals between 3 and 40oC by either clicking and dragging the slider control bar or by using the spin box to select the required assay temperature. Whichever method is used, the selected temperature is displayed adjacent to the spin box control.
The current temperature of the reaction vessel is also displayed in this view.
In multi-channel systems, temperatures of the Peltier chambers are individually controlled. The relevant channel is selected from the channel number buttons at the top of this view and the temperature set in the same method as described above.
Once the Temperature Control dialog has been closed, the temperature of the chamber is displayed in the Data Bar (please refer to the Data Bar section for further details).
The Magnetic Stirrer.
Electrochemical reactions taking place at the cathode of the electrode disc require the consumption of oxygen in order to produce an electric current. This current is then digitised and presented as a chart recorder emulation in the Oxygraph Plus software. The nature of this process means that as oxygen is continuously consumed at the cathode, an oxygen depleted layer is left.
As the rate of consumption by the disc is faster than the rate of oxygen diffusion through liquid, the measured signal from the electrode disc would continuously decrease in response to the oxygen depleted layer.
This problem is overcome by continuously stirring the sample in order to replenish the depleted layer at the cathode and to ensure that the dissolved oxygen within the sample is kept evenly distributed throughout the reaction vessel.
The magnetic stirrer is an integral feature of the control unit and is located on the top of the box as shown in the below diagram. The Peltier chamber, mounts directly on to the black stirrer cap.
44
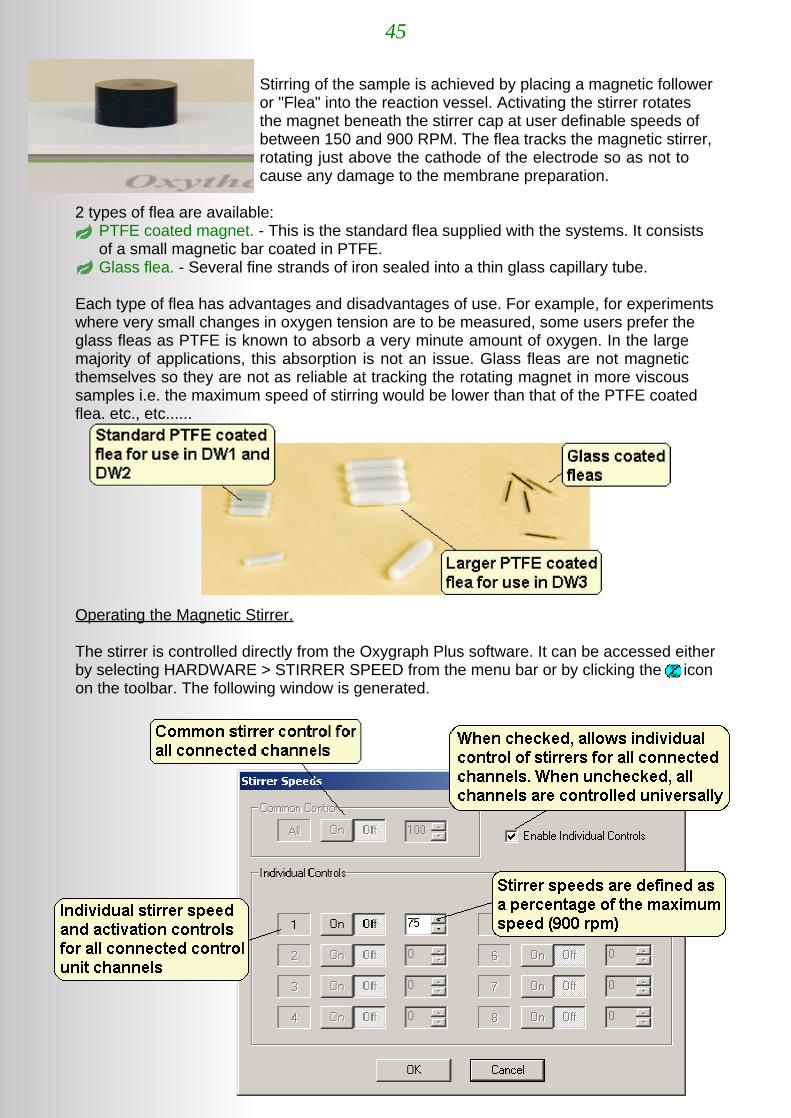
Stirring of the sample is achieved by placing a magnetic follower or "Flea" into the reaction vessel. Activating the stirrer rotates the magnet beneath the stirrer cap at user definable speeds of between 150 and 900 RPM. The flea tracks the magnetic stirrer, rotating just above the cathode of the electrode so as not to cause any damage to the membrane preparation.
2 types of flea are available: PTFE coated magnet. - This is the standard flea supplied with the systems. It consists of a small magnetic bar coated in PTFE. Glass flea. - Several fine strands of iron sealed into a thin glass capillary tube.
Each type of flea has advantages and disadvantages of use. For example, for experiments where very small changes in oxygen tension are to be measured, some users prefer the glass fleas as PTFE is known to absorb a very minute amount of oxygen. In the large majority of applications, this absorption is not an issue. Glass fleas are not magnetic themselves so they are not as reliable at tracking the rotating magnet in more viscous samples i.e. the maximum speed of stirring would be lower than that of the PTFE coated flea. etc., etc......
Operating the Magnetic Stirrer.
The stirrer is controlled directly from the Oxygraph Plus software. It can be accessed either by selecting HARDWARE > STIRRER SPEED from the menu bar or by clicking the icon on the toolbar. The following window is generated.
45

The effects of the oxygen depleted layer mentioned above can be clearly seen by performing a short experiment:
Prepare the electrode disc and mount it into the base of the electrode chamber. Place the chamber on top of the magnetic stirrer. Add 2ml of air-saturated, de-ionised water into the chamber & drop a flea into the sample. Open the stirrer control window as described above & set the stirrer to a speed of 75%. Start a recording and allow the trace to stabilise. Once the trace has stabilised, stop the stirrer. The signal will start to decline steadily. Re-start the stirrer. The signal will return to it's original level.
The following screenshot shows how the trace should respond to the procedure outlined above.
Recording an Auxiliary Signal.
Oxytherm control units are able to record the signal from an optional auxiliary input. This signal could be from a range of different devices provided the device output is analogue between 0 - 4V. Example devices are:
Thermometer pH electrode TPP+ electrode (or other ion selective electrode) Output from fluorimeter PAR
The auxiliary device connects to the Auxiliary Input on the rear of the Oxytherm and must be fitted with an 8 pin Mini-DIN plug.
Oxygraph Plus software is configured to accept an auxiliary input device from a window accessed by selecting HARDWARE > AUXILIARY CHANNELS.
46
Auxiliary inputs for each active channel are enabled by checking the appropriate check box in the window shown in the diagram above. An auxiliary axis is added on the right side of the graph screen and the signal itself is plotted in the graph area as a real time chart recorder emulation. The signal is displayed in numerical format in the Data Bar (if enabled) along with the corresponding trace colour. All individual data points can be reviewed in tabulated format once the measurement has completed.
System Diagnostics.In the event of problems with the electrode system such as drifting or unstable signal, system overscale or lack of response to changes in oxygen tension, it is necessary to isolate the area of the system that is causing the fault. By checking system elements individually on a step by step basis, faults may be relatively easily diagnosed.
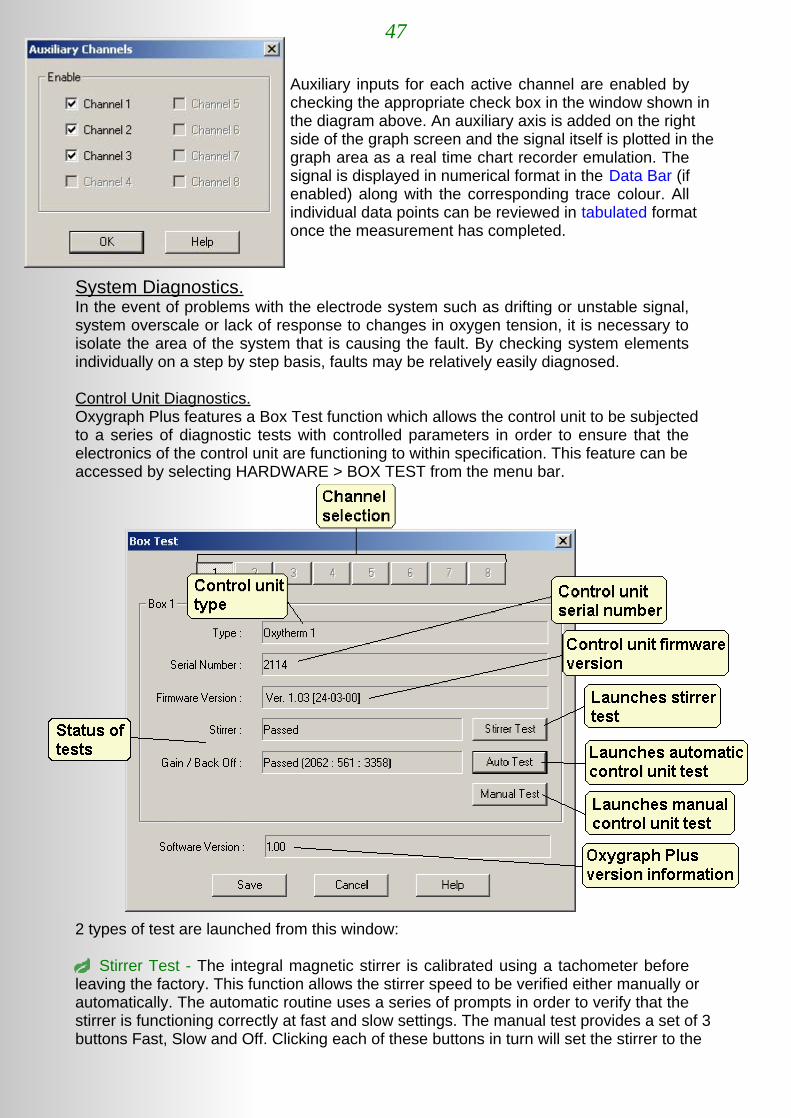
Control Unit Diagnostics.Oxygraph Plus features a Box Test function which allows the control unit to be subjected to a series of diagnostic tests with controlled parameters in order to ensure that the electronics of the control unit are functioning to within specification. This feature can be accessed by selecting HARDWARE > BOX TEST from the menu bar.
2 types of test are launched from this window:
Stirrer Test - The integral magnetic stirrer is calibrated using a tachometer before leaving the factory. This function allows the stirrer speed to be verified either manually or automatically. The automatic routine uses a series of prompts in order to verify that the stirrer is functioning correctly at fast and slow settings. The manual test provides a set of 3 buttons Fast, Slow and Off. Clicking each of these buttons in turn will set the stirrer to the
47
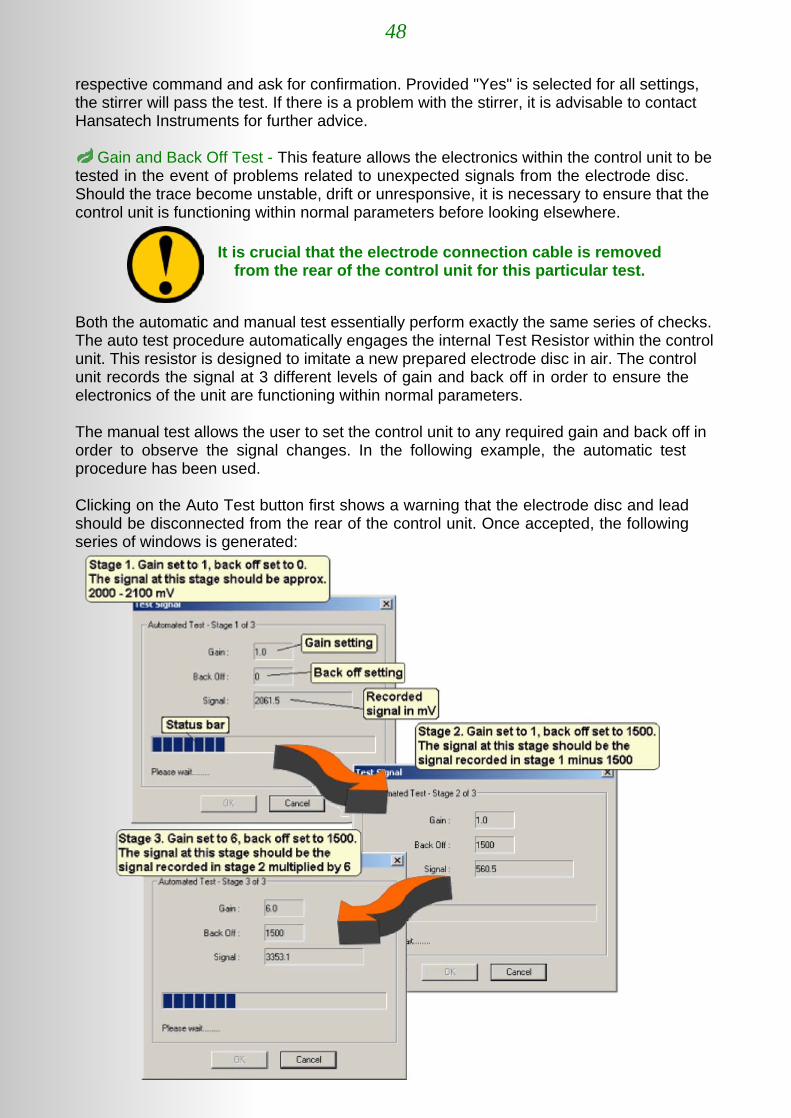
respective command and ask for confirmation. Provided "Yes" is selected for all settings, the stirrer will pass the test. If there is a problem with the stirrer, it is advisable to contact Hansatech Instruments for further advice.
Gain and Back Off Test - This feature allows the electronics within the control unit to be tested in the event of problems related to unexpected signals from the electrode disc. Should the trace become unstable, drift or unresponsive, it is necessary to ensure that the control unit is functioning within normal parameters before looking elsewhere.
Both the automatic and manual test essentially perform exactly the same series of checks. The auto test procedure automatically engages the internal Test Resistor within the control unit. This resistor is designed to imitate a new prepared electrode disc in air. The control unit records the signal at 3 different levels of gain and back off in order to ensure the electronics of the unit are functioning within normal parameters.
The manual test allows the user to set the control unit to any required gain and back off in order to observe the signal changes. In the following example, the automatic test procedure has been used.
Clicking on the Auto Test button first shows a warning that the electrode disc and lead should be disconnected from the rear of the control unit. Once accepted, the following series of windows is generated:
48
It is crucial that the electrode connection cable is removed from the rear of the control unit for this particular test.
Once the test is completed, the results of the test will be displayed in the main Box Test window in the test status section. If the control unit has passed the test, the following message will be displayed in the window.
This indicates the control unit is operating within expected parameters and that any fault that is being investigated does not lie with the control unit electronics. In this case, the electrode disc and lead should now be tested for faults.
If the control unit is not functioning within expected parameters, the following message will be displayed
In this case, please contact Hansatech Instruments for advice as the control unit will most likely need to be returned for repair.
Electrode Disc Diagnostics.
Possible Causes of Signal Drift.
Inadequate electrode preparation. If the membrane and space paper have not been applied properly, i.e. the membrane layer of the electrode dome is particularly uneven, this could result in an unstable signal as the barrier of electrolyte trapped between the membrane and the cathode is inconsistent. In areas where the electrolyte layer is thicker, oxygen would take longer to diffuse through to the platinum cathode than in areas where the electrolyte layer is normal. Please refer to the Electrode Preparation section for details on correct preparation of the electrode. Improper electrode mounting. When the electrode is mounted into the base of the electrode chamber, if the base ring is screwed on too tightly, the membrane will become stretched over the top of the dome. This will result in a higher oxygen diffusion potential through the membrane to he cathode due to the pores in the PTFE becoming stretched/enlarged. As the membrane begins to relax, the speed at which oxygen can diffuse through the membrane to the platinum cathode decreases resulting in a downwards signal drift. Temperature control. If the chamber is not correctly temperature controlled or the sample of air saturated water has not been pre-equilibrated to the correct assay temperature, a signal drift will occur. Disc condition. If the disc has not been cleaned, there may be deposits on the silver anode which are bi-products of the electrochemical reactions taking place on the electrode disc when polarised. In the first instance, a brown deposit of silver chloride may be present. This deposit may, in some cases, be desirable as it is an electrical conductor and may improve the sensitivity of the electrode disc. However, in time, black deposits of silver oxide may build up. This deposit is an electrical insulator and will therefore decrease the surface area of silver available for electrochemistry to occur. The response time of the disc will be greatly affected in worst cases. Please refer to the Electrode Maintenance section for full details on the cleaning procedures for electrode discs. Damaged electrode disc. If the disc has not been maintained correctly or there is a genuine fault with the disc, a drifting signal may indicate a problem more permanent than those described above.
If the signal still drifts, please contact Hansatech Instruments for further advice.
49

Possible Causes of Excessive Signal Noise. Noisy signals can be caused by the same issues described in the section above. However, they can also be caused by a problem with the gain settings of the control unit as described below.
Even in a good condition, an electrode disc will have a small amount of electrical noise (±2 mV). If the signal appears very noisy with large positive and negative deviations in signal as shown in the diagram below, first check that the gain setting has not been altered to a high value. A high gain setting will amplify any noise recorded by the disc.
If the gain settings are at a sensible value, it is necessary to check the electrode disc according to the guidelines listed above. If the signal is still noisy, please contact Hansatech Instruments for further advice.
Testing the Electrode Connection Cable for Short Circuits or Breaks. If the connection cable has an intermittent short circuit, this will be seen on the trace as a sudden rise to a maximum signal followed by a plateau. Checking the mV signal from the electrode disc in the Configuration window should show that the signal is overscaled at 4095 mV when plateaued. If the signal remains at his level, and a problem with the electrode disc and control unit have been ruled out, it may be a dead short in the connection cable. If the signal only remains at this level temporarily and manipulating the cable restores the signal, the problem may be an intermittent short caused by a cable break.
The connection cable may also be "buzzed out" using a multimeter between the pins in the plug and the anode and cathode on the disc itself.
50
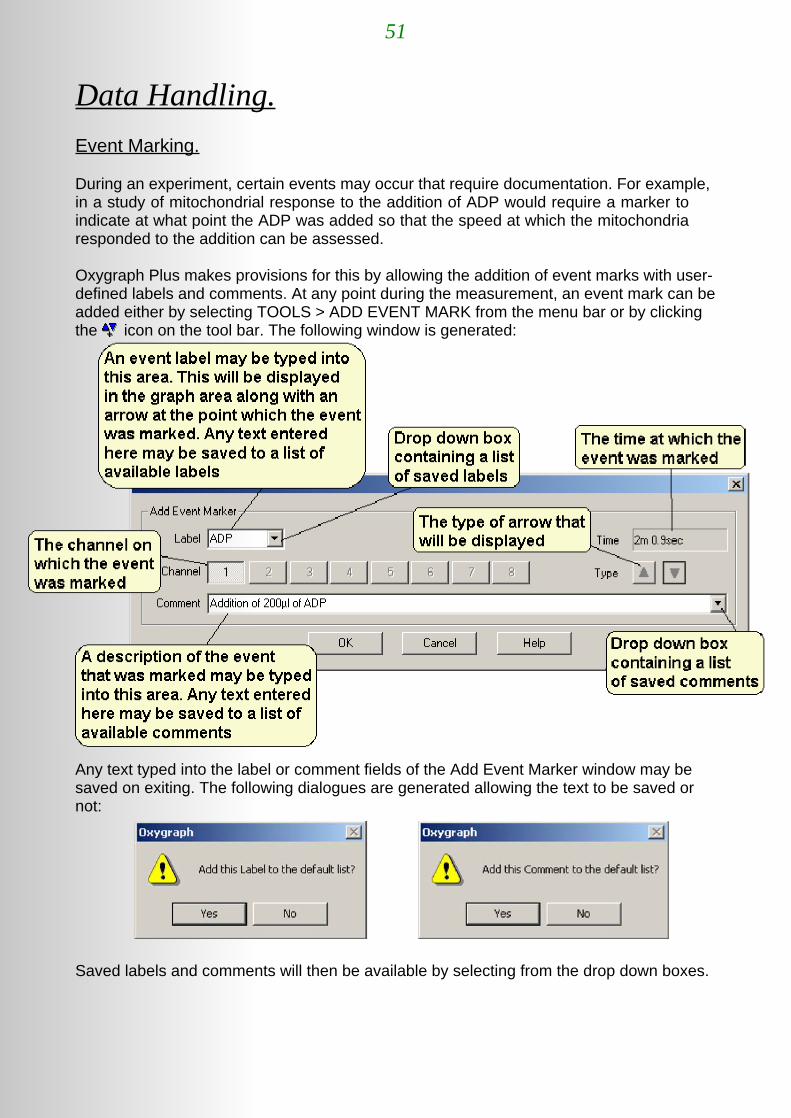
Data Handling.Event Marking.
During an experiment, certain events may occur that require documentation. For example, in a study of mitochondrial response to the addition of ADP would require a marker to indicate at what point the ADP was added so that the speed at which the mitochondria responded to the addition can be assessed.
Oxygraph Plus makes provisions for this by allowing the addition of event marks with user-defined labels and comments. At any point during the measurement, an event mark can be added either by selecting TOOLS > ADD EVENT MARK from the menu bar or by clicking the icon on the tool bar. The following window is generated:
Any text typed into the label or comment fields of the Add Event Marker window may be saved on exiting. The following dialogues are generated allowing the text to be saved or not:
Saved labels and comments will then be available by selecting from the drop down boxes.
51

Event markers are displayed at the top of the graph area along with any label that has been assigned. Any comment that has been added to the event mark is displayed when the mouse cursor is hovered over the event mark on the graph as shown opposite. Event markers may be reviewed and edited or deleted at any point during and after the measurement. Events are also saved with the experiment and are printed.
For some functions of the software, event markers are automatically added to the graph and cannot be edited or deleted. These features include:
Start recording - Indicated by a right-facing arrow and the label "Start" Stop recording - Indicated by a left-facing arrow and the label "Stop" Stirrer speed adjustment - Indicated by 2 downwards arrows with the label "Stirrers". The first mark is added when the stirrer window is first opened, the second when the stirrer window is closed. This indicates that between these 2 points, stirrer settings were being adjusted. Gain adjustment - When the gain is altered during a recording, 2 marks are added to the graph. The first mark is added when a change is made and is labelled "Event", the second mark is added once the control unit has been adjusted and is labelled "Gain". New gain settings are displayed in the comments field of this event marker. Back off adjustment - When the back off is altered during a recording, 2 marks are added to the graph. The first mark is added when a change is made and is labelled "Event", the second mark is added once the control unit has been adjusted and is labelled "Back Off". New back off settings are displayed in the comments field of this event marker.
Editing and Deleting Event Marks.
Event marks can be reviewed and edited or deleted at any point during and after the experiment. Selecting TOOLS > EDIT EVENT MARKS from the menu bar opens the following window.
52
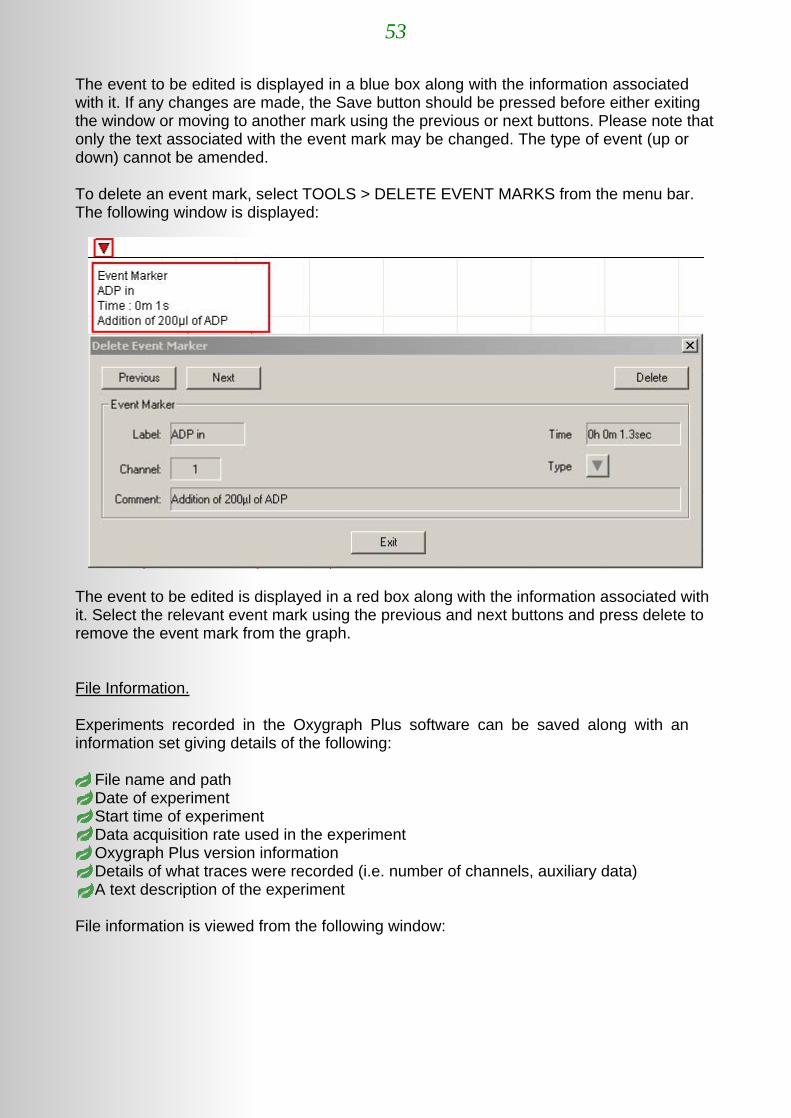
The event to be edited is displayed in a blue box along with the information associated with it. If any changes are made, the Save button should be pressed before either exiting the window or moving to another mark using the previous or next buttons. Please note that only the text associated with the event mark may be changed. The type of event (up or down) cannot be amended.
To delete an event mark, select TOOLS > DELETE EVENT MARKS from the menu bar. The following window is displayed:
The event to be edited is displayed in a red box along with the information associated with it. Select the relevant event mark using the previous and next buttons and press delete to remove the event mark from the graph.
File Information.
Experiments recorded in the Oxygraph Plus software can be saved along with an information set giving details of the following:
File name and path Date of experiment Start time of experiment Data acquisition rate used in the experiment Oxygraph Plus version information Details of what traces were recorded (i.e. number of channels, auxiliary data) A text description of the experiment
File information is viewed from the following window:
53
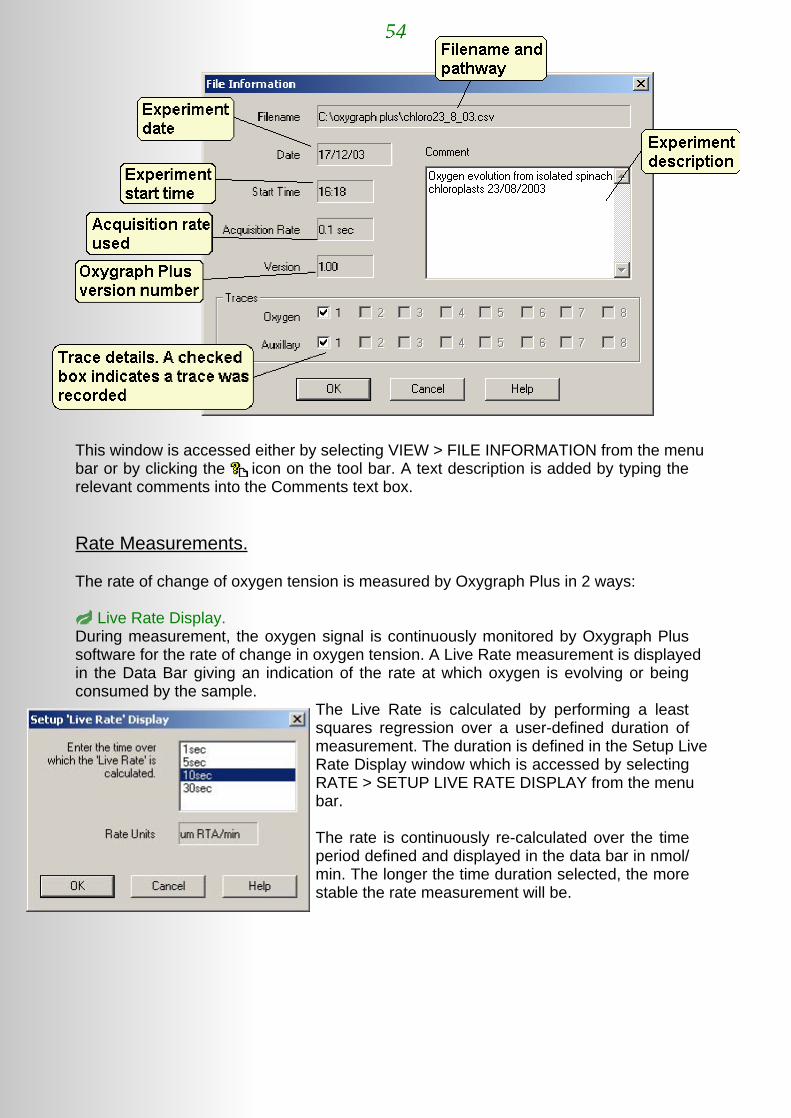
This window is accessed either by selecting VIEW > FILE INFORMATION from the menu bar or by clicking the icon on the tool bar. A text description is added by typing the relevant comments into the Comments text box.
Rate Measurements.
The rate of change of oxygen tension is measured by Oxygraph Plus in 2 ways:
Live Rate Display. During measurement, the oxygen signal is continuously monitored by Oxygraph Plus software for the rate of change in oxygen tension. A Live Rate measurement is displayed in the Data Bar giving an indication of the rate at which oxygen is evolving or being consumed by the sample.
The Live Rate is calculated by performing a least squares regression over a user-defined duration of measurement. The duration is defined in the Setup Live Rate Display window which is accessed by selecting RATE > SETUP LIVE RATE DISPLAY from the menu bar.
The rate is continuously re-calculated over the time period defined and displayed in the data bar in nmol/min. The longer the time duration selected, the more stable the rate measurement will be.
54
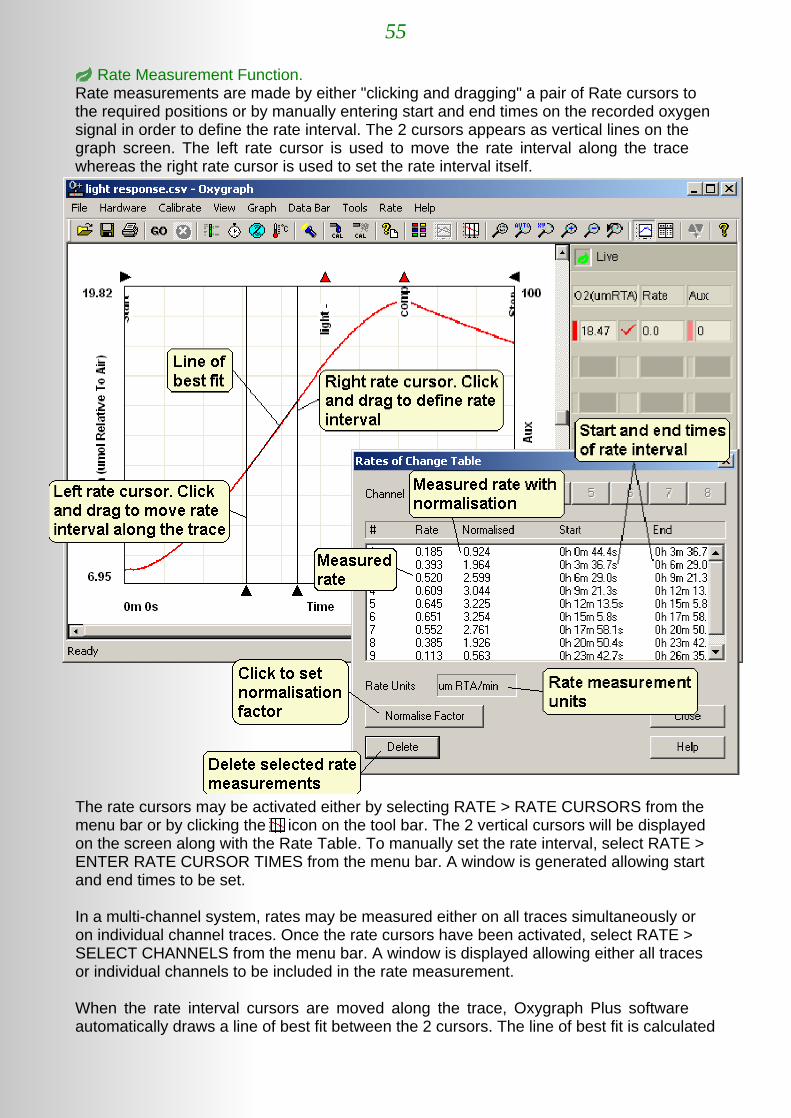
Rate Measurement Function. Rate measurements are made by either "clicking and dragging" a pair of Rate cursors to the required positions or by manually entering start and end times on the recorded oxygen signal in order to define the rate interval. The 2 cursors appears as vertical lines on the graph screen. The left rate cursor is used to move the rate interval along the trace whereas the right rate cursor is used to set the rate interval itself.
The rate cursors may be activated either by selecting RATE > RATE CURSORS from the menu bar or by clicking the icon on the tool bar. The 2 vertical cursors will be displayed on the screen along with the Rate Table. To manually set the rate interval, select RATE > ENTER RATE CURSOR TIMES from the menu bar. A window is generated allowing start and end times to be set.
In a multi-channel system, rates may be measured either on all traces simultaneously or on individual channel traces. Once the rate cursors have been activated, select RATE > SELECT CHANNELS from the menu bar. A window is displayed allowing either all traces or individual channels to be included in the rate measurement.
When the rate interval cursors are moved along the trace, Oxygraph Plus software automatically draws a line of best fit between the 2 cursors. The line of best fit is calculated
55
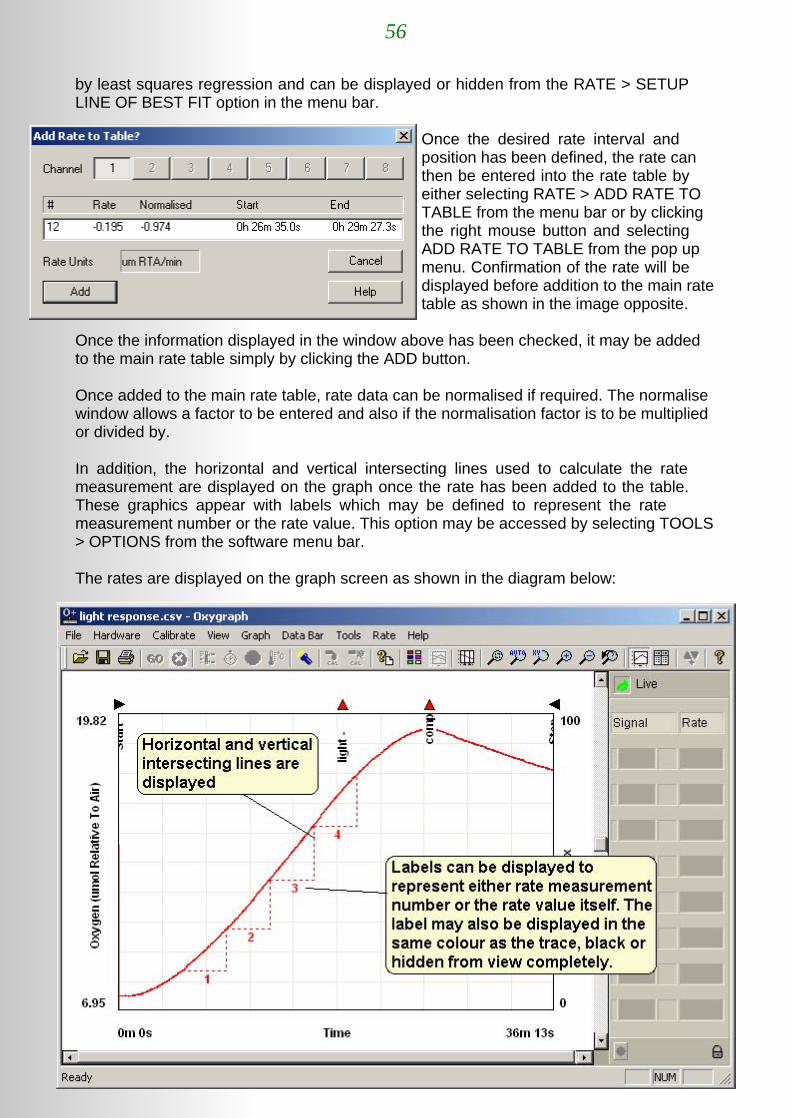
by least squares regression and can be displayed or hidden from the RATE > SETUP LINE OF BEST FIT option in the menu bar.
Once the desired rate interval and position has been defined, the rate can then be entered into the rate table by either selecting RATE > ADD RATE TO TABLE from the menu bar or by clicking the right mouse button and selecting ADD RATE TO TABLE from the pop up menu. Confirmation of the rate will be displayed before addition to the main rate table as shown in the image opposite.
Once the information displayed in the window above has been checked, it may be added to the main rate table simply by clicking the ADD button.
Once added to the main rate table, rate data can be normalised if required. The normalise window allows a factor to be entered and also if the normalisation factor is to be multiplied or divided by.
In addition, the horizontal and vertical intersecting lines used to calculate the rate measurement are displayed on the graph once the rate has been added to the table. These graphics appear with labels which may be defined to represent the rate measurement number or the rate value. This option may be accessed by selecting TOOLS > OPTIONS from the software menu bar.
The rates are displayed on the graph screen as shown in the diagram below:
56
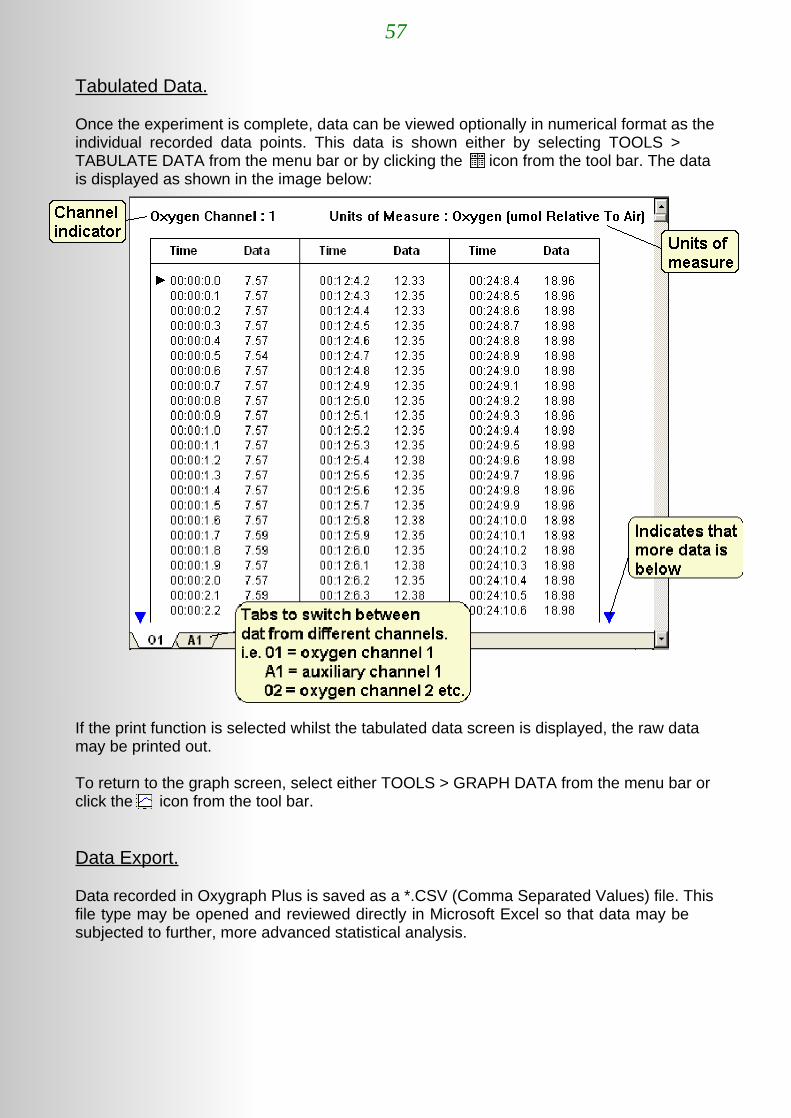
Tabulated Data.
Once the experiment is complete, data can be viewed optionally in numerical format as the individual recorded data points. This data is shown either by selecting TOOLS > TABULATE DATA from the menu bar or by clicking the icon from the tool bar. The data is displayed as shown in the image below:
If the print function is selected whilst the tabulated data screen is displayed, the raw data may be printed out.
To return to the graph screen, select either TOOLS > GRAPH DATA from the menu bar or click the icon from the tool bar.
Data Export.
Data recorded in Oxygraph Plus is saved as a *.CSV (Comma Separated Values) file. This file type may be opened and reviewed directly in Microsoft Excel so that data may be subjected to further, more advanced statistical analysis.
57
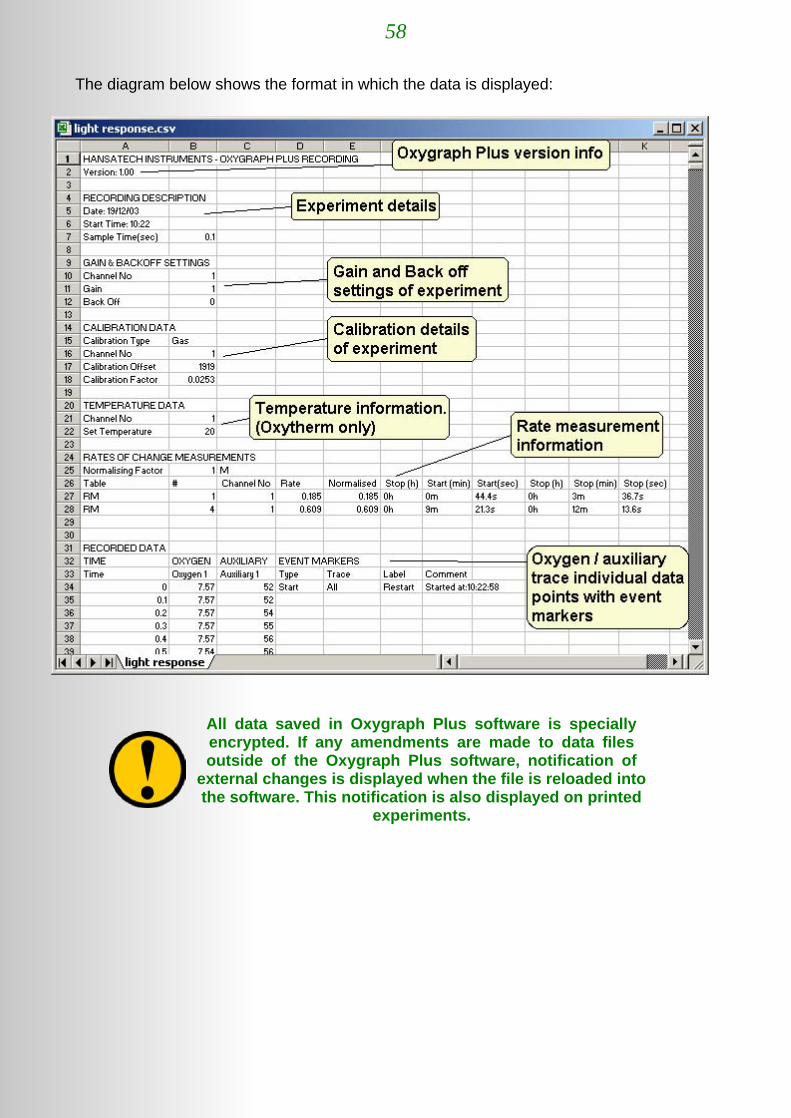
The diagram below shows the format in which the data is displayed:
58
All data saved in Oxygraph Plus software is specially encrypted. If any amendments are made to data files outside of the Oxygraph Plus software, notification of
external changes is displayed when the file is reloaded into the software. This notification is also displayed on printed
experiments.

Printing Data.
Oxygraph Plus allows a comprehensive print out of completed experiments. Information including data acquisition rates, gain and back off settings and calibration information are included in the print out along with a printed graph, event marker and rate measurement details. If the data has been modified outside of the Oxygraph Plus software, a warning message will be printed at the top of each page as notification. If raw numeric data is required, change the view to the tabulated data screen and select FILE > PRINT from the menu bar. A sample print out can be found at Appendix A.
Viewing Previously Saved Files.
Previously saved data files may be easily loaded into the Oxygraph Plus software for review and / or further analysis. The software will function as a stand alone operation when a control unit is not detected however, some operational functions will be disabled.
To operate Oxygraph Plus in view mode when a control unit is not present, simply run the software as normal. The software initially scans for connected control units and when none are found, the following window is displayed.
Pressing the VIEW button opens Oxygraph Plus allowing data files to be loaded and analysed using the integral Data Analysis functions. Obsolete commands and functions are disabled during view mode. These functions include:
Recording controls Stirrer controls Gain / Back off settings
Normal function of the software may be re-established by reconnecting a powered control unit to the PC via the RS232 serial cable and pressing the icon from the toolbar or by selecting HARDWARE > SCAN FOR BOXES from the menu bar. This function looks for control units currently connected to the PC. Once found, the serial number, type (Oxygraph or Oxytherm) and calibration status are displayed.
59
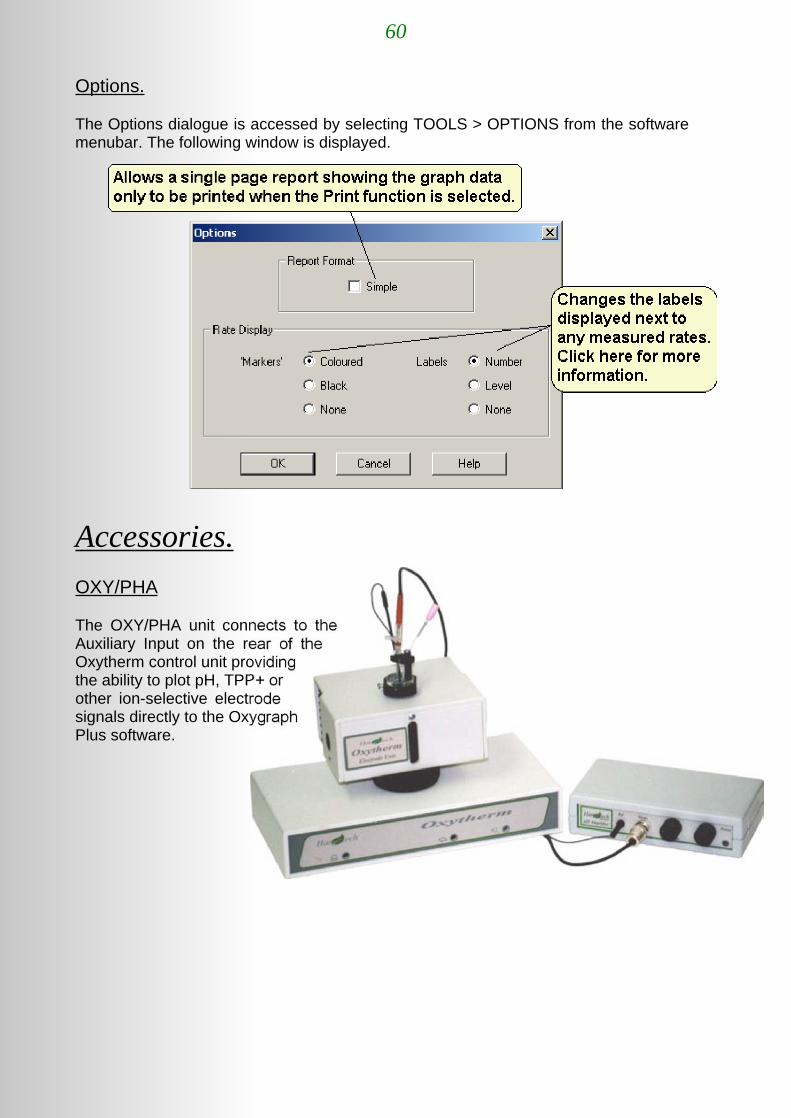
Options.
The Options dialogue is accessed by selecting TOOLS > OPTIONS from the software menubar. The following window is displayed.
Accessories.OXY/PHA
The OXY/PHA unit connects to the Auxiliary Input on the rear of the Oxytherm control unit providing the ability to plot pH, TPP+ or other ion-selective electrode signals directly to the Oxygraph Plus software.
60
Support Information.Purchasers of Hansatech Instruments Ltd products can be assured of ongoing support and prompt and efficient attention to enquiries at all times.
All products supplied by Hansatech Instruments are guaranteed for 12 months from the time of despatch against manufacturing faults or defective materials. The guarantee does not cover damage caused by misuse or unauthorised attempts to repair.
If difficulties are experienced with the equipment, please contact Hansatech Instruments for advice. If necessary, equipment may be returned for repair/replacement during the warranty period. No charge will be made for parts/labour under warranty but we reserve the right to charge for customs clearance and return carriage if appropriate.
For repairs outside of the warranty period, please contact us at the address below for an estimate of cost and instructions regarding the return of equipment.
If the product was purchased via a distributor, please contact them for advice in the first instance.
Upgrading Oxygraph Plus Software.
Updates for the Oxygraph Plus software can be found in the Technical Support section of the Hansatech Instruments web site. Users will be required to complete a short registration form in order to apply for a password to the Software Upgrades page.
Narborough Road, Pentney, King’s Lynn,Norfolk PE32 1JL England.
Tel: +44 (0)1760 338877 Fax: +44 (0)1760 337303Email: [email protected]
Web site: http://www.hansatech-instruments.com
61
Star
t
light
- com
p
Stop
Star
t
Stop
Star
t
Stop
Star
t
Stop
Star
t
Stop
Star
t
Stop
Star
t
Stop
Star
t
Stop
Oxygraph / Oxytherm Results
C:\oxygraph plus\light response.csv
Page 1 of 3
DateAcquistion Rate
Experiment Start TimeDurationCurrent View
19/12/030.1 sec
10:2236m 12s0m 0s to 36m 13s
11
SignalAux
0m 0s 36m 13sTime
Oxy
gen
(um
ol R
elat
ive
To A
ir)
Aux
19.82
6.95
100
0
10
20
30
40
50
60
70
80
90
8.24
9.52
10.81
12.10
13.39
14.67
15.96
17.25
18.53
Oxygraph / Oxytherm Results Cont.
C:\oxygraph plus\light response.csv
Page 2 of 3
Event Markers
Label TypeTrace Comment
Start RestartAll Started at:10:22:58
light - Up Arrow1 adjust light
comp Up Arrow1
Stop PauseAll Stopped at:10:59:11
Rates Of Change Table
# (Index) Channel Rate Normalised Start Time End Time
1 1 0.2 0.2 0m 44.4s 3m 36.7s4 1 0.6 0.6 9m 21.3s 12m 13.6s5 1 0.6 0.6 12m 13.5s 15m 5.8s6 1 0.7 0.7 15m 5.8s 17m 58.1s7 1 0.6 0.6 17m 58.1s 20m 50.4s8 1 0.4 0.4 20m 50.4s 23m 42.7s9 1 0.1 0.1 23m 42.7s 26m 35.0s10 1 -0.2 -0.2 26m 35.0s 29m 27.3s11 1 -0.2 -0.2 26m 35.0s 29m 27.3s
Oxygraph / Oxytherm Results Cont.
C:\oxygraph plus\light response.csv
Page 3 of 3
Gain, Back Off, Calibration and Temperature Data
Channel Gain Back Off Cal. Offset Cal. Factor Set Temp.1 1.00 0 1919 0.0253 20.00