oxyflurofen (pe) + 2 4- d (poe) january to december 2013 ...dwr.org.in/aicrp-wm document/2013-annual...
TRANSCRIPT

1
For official use only
DR. BALASAHEB SAWANT KONKAN KRISHI VIDYAPEETH,DAPOLI
DAPOLI. DIST. RATNAGIRI, (MAHARASHTRA).
DEPARTMENT OF AGRONOMY,
SEVENTEETH ANNUAL PROGRESS REPORT
DAPOLI CENTRE
Genral view of experiment Fenoxaprop – p ethyl (PoE)
Oxyflurofen (PE) + 2 4- D (PoE) Fenoxaprop-p ethyl + Ethoxysulfuron (PoE)
(January to December 2013)
Submitted to
Dr. A.R.Sharma Director
Dr. R.P. Dubey
I/C, DWSRC
DIRECTORATE OF WEED SCIENCE RESEARCH, Adhartal, Jabalpur- 482 004, (M.P.)
by
Prof.M.J.Mane
Agronomist &PI All India Co-ordinated Research Project on Weed Control, Dapoli Centre

2
SEVENTEETH ANNUAL PROGRESS REPORT FOR THE YEAR 2013
: ADDRESS :
Prof.M.J.Mane Agronomist &PI
All India Co-ordinated Research Project on Weed Control, Dapoli Centre
Department of Agronomy Dr. B. S. Konkan Krishi Vidyapeeth, Dapoli - 415 712 ,
Dist - Ratnagiri (Maharashtra).
Gram: ‘KONKANAGIRI’ Telephone: 02358-283588
Fax: 02358-282417 Email : [email protected]

3
CONTENTS Sr. No. Description Page No.
I Introduction of the centre
4 - 5
General information
Project objectives
Background information of the project
Location
II Weather conditions during the year and deviation from the normal 5
III Staff position and expenditure statement 5
Approved technical programme for the year – 2012-13& 2013-14 6
IV Executive Summary (English) 7
V Results of practical utility 7 - 8
VI Recommendations passed on to state package of practices 9 - 20
VII Research Achievements
A) Network Trials
WS.1. Weed survey, surveillance and ecological parameters 21 - 30
WS.3.2 Herbicides combinations for control of complex weed flora in direct seeded rice
31 - 34
WS 3.6 Weed management in conservation agriculture systems 35 - 39
WS.M Microbiological Study 39 - 47
WS 3.7 Long term herbicide trial in different cropping system. 48 - 58
WS.M Microbiological Study 59 - 71
WS B Weed seed bank studies
WS.M Microbiological Study
WS 4.2
Biological weed management WS 4.2a Biological control of Parthenium by Zygogramma bicolorata WS 4.2b:Biological control of Parthenium by competitive replacement
through Cassia tora
72
WS 6.1
On-Farm Trial (OFT)
72
WS 6.2 Front Line Demonstration (FLD)
72
B) Station Trials
S.T.1 Effect of time of sowing and weed control methods in direct seeded dibbled rice var. Sahyadri-2.
73 - 77
S.T.2 Efficacy of herbicides for controlling weeds in direct seeded rice. 78 - 93
VIII TSP programme 94 - 95
IX List of publications(research,abstract of seminar/symposia/conference,technical/extension bulletin,popular articles,books/books chapter,radio/TV talks etc.
96
X List of trainings/awareness campaign 92 - 98
XI Awards/recognitions/students guided 99
XII Linkages and collaboration 99
XIII Meteorological data -2013 99 - 100

4
AICRP on weed control, DAPOLI centre
1. GENERAL INFORMATION:
1. Project title : All India Co-ordinated Research Project on Weed Control, Dapoli Centre
2. Name of location : Department of Agronomy, College of Agriculture, Dapoli, Dist. Ratnagiri.
3. Name of University : Dr. B. S. Konkan Krishi Vidyapeeth, Dapoli, Dist. Ratnagiri.
4. Name of the Principal Investigator of the centre
: Prof M.J.Mane
5. Report period : January to December, 2013
6. Technical personnel’s employed during the report period
: Five (Table 1)
7. Total sanctioned outlay for the year 2013–2014
: Rs. lakhs (Table 2)
i. PROJECT OBJECTIVES:
1. Survey of weed flora in different agro-ecological zones of Konkan region
2. Studies on critical crop weed competition period.
3. Evaluation of different weed control measures and development of integrated weed management practices for different crops and cropping systems.
4. Studies on weed biology and weed ecology.
5. On Farm Trials (OFT’s) in the farmers field to assess and refine developed technology.
6. To evolve integrated approaches for weed management including cultural method of weed control under irrigated condition.
7. Training for extension personnels and farmers.
8. Studies on the management of perennial and problem weeds in cropped and non-cropped area.
BACKGROUND OF THE PROJECT AND LOCATION:
The Directorate of Weed Science Research Centre on Weed Control sponsored by the Indian
Council of Agricultural Research was started at Dr. B. S. Konkan Krishi Vidyapeeth, Dapoli in its
Department of Agronomy with effect from May, 1996. The main objective of this programme was to
develop integrated weed management practices for optimum weed control for different crops and
cropping systems with minimum hazards to the crops and environment.
The scheme scientists are of the discipline of Agronomy and Microbiology. The technical
programme and research achievements are discussed in the annual workshop and the technical
programmes are finalized for implementation aiming towards achieving the broad objectives of the
project.The annual technical programme is approved by the Director, Directorate of Weed Science
Research, Jabalpur.
The technologies developed are discussed in the state level scientific workers conference and
are included in the crop production guide published by the Department of Agriculture, Govt. of
Maharashtra for the benefits of extension personnels and farmers of the region.

5
iii. LOCATION:
DWSR centre is located at Dapoli in the agroclimatic zone viz. ‘Very High Rainfall with Lateritic
Soils’ in Maharashtra State. The experimental farm is located at 170 19' to 170 40' N latitudes, 730 16' to
730 19' E longitudes and 167 to 234 m above mean sea level (MSL). The topography of the region is
uneven and can be described as rolling with mound and hillocks and gently slopping valleys in the
middle having flat rice fields and the hills with slopes ranging from 1 to more than 30 per cent.
II. Weather conditions during the year and deviation from the normal
The weekly weather data for the 2013 is attached on last page of the report.The deviation from
the normal is given below.
Dapoli location Maximum temp Maximum temp Rainfall
Normal 30.84 oc 19.81 oc 3649.92 mm
Increase/decrease (+) 0.01 oc (+) 1.01 oc (+) 31.10 %
III. Staff position and Expenditure statement.
Table 1: Technical personnel employed up to 2012.
Sr. No.
Name Designation Date of Joining in the
project Scale of pay
Present basic pay Remark
1. Prof.M.J.Mane Agronomist & PI
01/08/2011 to 22/11/2012 (Additional Charge)
23/11/2012 Onwards
37,400-67,000-
58,830
-
2. Shri. Y. R. Govekar Jr. Res.Scientist
(Microbiology)
7/04/2010 Onwards
15,600-39,100
23,610 -
3. Shri. S.V. Nikumbh. Technical Assistant
6/07/2010 onwards
9,300-34,800
19,090 -
4. Mrs. S.K. Khanolkar Jr. steno typist 7/07/2010 onwards
5,220-20,200
10,840 -
5. Mrs. A.N. Desai Messanger 8/07/2010 onwards
4,470-7,440
9,270 -
Table 2 : Total sanctioned outlay for 2013-2014 (Rs. in lakhs)
Head of Account
Sanctioned grants Total Expenditure upto
31.12.2013
Balance
ICAR share
State share
1. Pay and Allowance 10.18 3.39 13.57 18,78,822 -5,21,822
2. Traveling Allowance 0.30 0.10 0.40 7,429 32,571
3. Recurring contingencies 1.58 0.53 2.11 1,68,898 42,102
4. Tribal Sub Plan 2.20 - 2.20 1,44,544 75,456
Total 14.26 4.02 18.28 21,99,693 6,71,951

6
Approved technical programme for the year 2012-13 & 2013-14
WS.1. Weed survey, surveillance and ecological parameters
WS 1.1: Monitoring of weed shift / appearance of new weeds due to weed
management practices, changes in cropping systems and climatic parameters
WS 1.2: Monitoring of herbicide resistance / escapes in weeds of the dominant cropping system
WS.3.2 Herbicides combinations for control of complex weed flora in direct seeded rice
WS.3.6 Weed management in conservation agriculture systems
WSM Microbiological study
WS 3.7 Long-term herbicide trial in different cropping systems
WSM Microbiological Study
WS 4.2 Biologial weed management
WS 4.2a Biological control of Parthenium by Zygogramma bicolorata
WS 4.2b:Biological control of Parthenium by competitive replacement through Cassia tora
WS 5. Herbicide residues and environmental quality
WS 5.1: Herbicide residues in long-term herbicide trial
WS 6.1 On-Farm Trial (OFT)
The technology developed for weed management at research farm should be tested at farmer’s field as OFT.
WS 6.2 Front Line Demonstration (FLD)
The weed management technology tested in OFT should be taken to FLD.
STATION TRIALS:
S.T.1 Effect of time of sowing and weed control methods in direct seeded dibbled rice var. Sahyadri-2.
S.T.2 Efficacy of herbicides for controlling weeds in direct seeded rice.
WSM Effect of recommended herbicides of rice crop on soil microflora in rice-cowpea cropping system.

7
III. Executive Summary (English)
IV. RESULTS OF PRACTICAL UTILITY: WS.3.2 Herbicides combinations for control of complex weed flora in direct seeded rice
The weed density & weed growth of monocots was significantly reduced due to the application of Pendimethalin fb manual weeding (T6).The total growth of monocot & BLWs was also found to be suppressed by the pre-emergence application of Pendimethalin fb manual weeding exihibiting highest WCE 95.7 and 97.8% respectively. The highest grain & straw yield of rice was recorded due to weed free check followed by application of Pendimethalin fb manual weeding and thus, it is observed that, the per cent reduction in grain yield (WI) was found to be the least due to application of Pendimethalin fb manual weeding (0.59%) followed by Pendimethalin fb Bispyribac-Na (4.20%). W S 3.6 Weed management in conservation agriculture systems
The effect of tillage and residue management did not influenced significantly in reducing the weed growth at 30 and 60 DAS as well as at harvest pertaining to monocots and BLWs.The weed growth of monocots at 60 DAS and at harvest was significantly least due to use of weed control measures W1 and W2 over weedy check. All tillage and residue management treatments were statistically identical in respect of grain & straw yield of Kharif rice. Application of Oxadiargyl @ 0.100 Kg/ha alone and integration of Oxadiargyl + 1 HW reduced significantly weed growth of monocots integration of resulting into increase in yield attributes and yield of rice. 2) To find out combined effects of tillage and residue management and herbicides on soil
microflora and their associated parameters
The total bacterial population,fungi, free living nitrogen fixers and total phosphate solubilisers,microbial biomass carbon dehydrogenase enzyme and phosphatase enzyme in soil didn’t influenced by all four tillage systems at all the above three mention stages of the rice crop. The total bacterial population,microbial biomass carbon and basal soil respiration in soil were significantly found less in recommended herbicide and integrated weed management treatment at 30DAS/30DAT as compared to the weedy check treatement.The same were found non-significant at 60DAS and at harvesting stage of the crop.The total fungal population,free living nitrogen fixers, dehydrogenase enzyme and phosphatase enzyme didnt significantly influenced by weed control measures at 30DAS/30DAT,60DAS/DAT and harvesting stage of rice crop. The interaction effects of tillage systems and weed control measures were found to be non significant.
WS.3.7: Long term herbicide trial in different cropping system
Rabi Groundnut:
Green manuring to kharif rice did not influenced in weed density and growth of monocots and BLWs. Various weed control measures significantly influenced weed density and growth at 30, 50 DAS and at harvest.The fixed and rotational herbicide reduced weed density and weed growth resulted in increase dry pod yield of G’nut over weedy check. As compared to best treatment of weed free check the per cent reduction in dry pod yield was least in fixed herbicide (8.58 %) followed by rotational herbicide (10.71%).
Kharif Rice:
Green manuring with dhaincha did not influence weed density and weed growth except monocot
weed at 50 DAS under study. The weed control measures not influcnce weed density and growth at 30,
50 DAS and at harvest. Green manuring not influence yield attributes rice. However, grain
and straw yield of rice higher with green maniuring than without green manuring treatment. The grain
yield of rice produced significantly highest in rotational herbicide schedule and weed free check
treatments.
2) To find out combined effects of green manuring and herbicides on soil microflora and their
associated parameters
1.The soil microflora such as bacteria, fungi, free living nitrogen fixers and phosphate
solubilisers and their associated parameters such as microbial biomass carbon, basal soil
respiration dehydrogenase enzyme and phosphatase enzyme activity (In case of rice crop)
were found significantly higher in green manuring treatment as compared to the without-
green manuring treatment in rabi groundnut crop and kharif rice crop at all the above mention
stages of the crops.

8
2 The bacterial population,fungi,free living nitrogen fixers ,phosphate solubilsers,microbial biomass
carbon,basal soil respiration in soil were significantly influenced by weed control measures at 30DAT.
They were found significantly less in fixed herbicide, rotational herbicide as compared to the weed free
treatment at 30DAT. The weed control measures was found to be non-significant at 50DAT and
harvesting stage of the groundnut crop.
2 The total bacterial population, free living nitrogen fixers, phosphate solubilisers, microbial
biomass carbon ,basal soil respiration and phosphatase enzyme activity was significantly
found less in both fixed herbicide, rotational herbicide and weedy check treatment
as compared to the weed free treatment in case Kharif rice crop at 30DAS and 50DAS.
3 The total bacterial population, free living nitrogen fixers, phosphate solubilisers, microbial
biomass carbon and basal soil respiration were significantly found less in both fixed herbicide
and rotational herbicide as compared to the weedy check treatment at 30DAT and at par
with weedycheck treatment at 50DAT during kharif season.
4.The total fungal population and dehydrogenase activity in soil was not significantly influenced
by weed control measure at all the above mention stage of the groundnut and rice crop.
5.The number of nodule and their dry weight was found to be non-significant in the main
treatment(green manuring)and the sub-treatment(weed control measures) during rabi season.
S T.1.: Effect of time of sowing and weed control methods in direct seeded rice
var.Sahyadri-2.
The weed density and growth of grasses & sedges significantly more than BLWs. The
weed density & weed growth of monocots at 60 DAS significantly least due to use of butachlor
+ HW over other treatments except fenoxaprop-p-ethyl. The weed growth of BLWs at 60 DAS
reduced significantly in weed free check, Cyhalofop butyl & Pretilachlor-s over other remaining
treatments.
Amongst these herbicidal treatments use of Butachlor + H.W recorded significantly
higher number of tillers/hill, number of panicles/hill and grain yield of rice. However, it was at
par with weed free check and Cyhalofop butyl. Thus compared to weed free check the grain
yield of rice produced higher in use of butachlor + HW.
S T 2: Efficacy of herbicides for controlling weeds in direct seeded rice.
At 60 DAS hand weeding twice 20 & 40 DAS recorded least weed density of monocots exhibiting highest weed control efficiency 90.98% and it was at par with Fenoxaprop + Ethoxysulfuron (T9) followed by oxyfluorfen+2,4-D (T10).while the least weed density of BLWs was observed due to combined use of Oxyflurofen and 2-4-D,Bispyribac –Na and Azimsulfuron (PoE). Similarly at 90 DAS, the least weed density of monocots was observed due to combined use of Fenoxaprop p ethyl and Ethoxysulfuon, while the least weed density of BLWs was observed due to use of Oxyflurofen and 2-4-D, Bispyribac –Na and Azimsulfuron (PoE). The application of Fenoxaprop p ethyl was combined with Ethoxysulfuron recorded least weed growth of monocots at 60 DAS. While the weed growth of BLWs was conspicuously less in almost all treatment combinational as compared to the treatment where Fenoxaprop p ethyl was combined with Ethoxysulfuron probably because latter controlled monocots but not BLWs. Hand weeding twice recorded highest grain yield (43.45 q/ha) which was at par with the combined application of Oxyflurofen and 2-4-D (42.67 q/ha). Thus the latter growth of treatments effectively controlled both monocots and BLWs and lead to significantly increase in grain yield.
WSM ;Effect of recommended herbicides of rice crop on soil microflora in rice-cowpea cropping system The estimated microflora such as total bacterial population,total fungal
population,actinomycetes,free-living nitrogen fixers and phosphate solubilisers adversly affected due to
the application of all mention recommended herbicides at 30DAS and herbicide oxidiargyl at 60DAS, of
rice crop.The adverse effect of oxidiargyl traetment on microbial population till 60DAS may be due to the
additional dose of herbicide oxidiargyl at 45DAS.However the population in the recommended
herbicides maintain their status at later stage of the crop.

9
VI. Recommendations passed on to state package of practices
For official use only
DR. B.S. KONKAN KRISHI VIDYAPEETH,
DAPOLI, DIST. RATNAGIRI – 415 712
RECOMMENDATION PROPOSAL, 2013
Long term trial on tillage in Kharif Rice-Rabi Lablab bean cropping system.
Submitted by
Agronomist & PI,
The All India Coordinated Research Project on Weed Control, Department of Agronomy, Dapoli, Dist. Ratnagiri.
C-Z tillage
Hand weeding
C-Z tillage
Oxadiargyl
C-Z tillage
Weedy check
C-Z tillage
Oxadiargyl
C-Z tillage
Weedy check
C-Z tillage
Hand weeding

10
RECOMMENDATION PROPOSAL, 2013 AICRP on Weed Control, Dapoli Centre. Title: Long term trial on tillage in Kharif Rice-Rabi Lablab bean cropping system.
Objectives
: 1) To study performance of Kharif rice and Rabi Lablab
bean under various tillage systems & weed control
measures.
2) To quantify weed flora in terms weed growth.
Year of commencement : Kharif, 2003
Location : Agronomy Farm, College of Agriculture, Dapoli.
Names of Scientists associated
Dr L.G.Pawar, Shri M.J.Mane, Dr V.B.Nevase, Shri S.P.Gosavi, Shri A.V.Dahiphale, Shri Y.R..Govekar, Dr S.A.Chavan and Dr.U.V.Mahadkar
Treatments details : Main plot treatments: Tillage Systems
I crop Kharif Rice II crop Rabi Lablab bean Symbol
T1- Zero tillage Zero tillage (Z - Z tillage)
T2- Zero tillage Conventional tillage (Z - C tillage)
T3- Conventional tillage Zero tillage (C - Z tillage)
T4- Conventional tillage Conventional tillage (C - C tillage)
Sub plot treatments: Weed control measures
W1 – Hand weeding twice at 20 & 40 DAS
W2 – Oxadiargyl @ 0.12 kg ha-1 (pre-em.)
W3 – Weedy check
Design : Split plot design
Replications : Three
Plot size : Gross : 10 m x 10 m (Main plot)
Net : 3.30 m x 10 m (Sub plot)
Kharif Rice Rabi Lablab bean
Spacing : 20 cm Dibbled: 45 cm X 15 cm
Cultivars : Ratnagiri-1 Kelshi Wal
Fertilizers (NPK kg ha–1) : 100:50:50 25:50:0
Preamble: Puddled transplanted rice during Kharif followed by pulses during Rabi season is predominant cropping sequence in Konkan region especially where soils are water retentative.Puddling operation is known to destroy weeds and separate individual soil particles by destruction of natural structure of soil, thus enhancing soil erosion in heavy rainfall areas where intense rainfall events are common. The concept of zero tillage has been being popularised from the point view of reducing cost of cultivation, improving soil physical condition besides improvement in microbial activities in soil. However, zero tillage concept is known to increase incidence of weeds. It was therefore, thought essential to study the performance of

11
kharif rice and rabi Lablab bean under different tillage systems and weed control measures including effects on weed flora and microbial activities in soil.
Details of tillage: I] Conventional tillage i) Kharif 2002 and 2003 : Ploughing twice, stubble removal and puddling before
transplanting.
ii) Rabi 2003 onwards : Ploughing twice and sowing field bean by opening bands for fertilizers placement and direct seeding.
iii) Kharif 2004 onwards : Summer ploughing twice, removal of weeds, stubbles and direct seeding with onset of regular monsoon along with basal fertilizer dose.
I] ZERO Tillage i) Kharif 2002 and 2003 : Application of glyphosate @ 1 kg ha-1 15 days before
transplanting followed by use of paraquat @ 0.5 kg ha–1 2-3 days before transplanting for killing weeds and stubbles of the previous crop by spot transplanting at 15 cm X 20 cm.
ii) Rabi 2003 onwards : Application of glyphosate @ 1 kg ha-1 15 days before sowing followed by paraquat use @ 0.5 kg ha-1 for killing weeds and stubbles of previous crop.
Direct seeding of field bean (Lablab bean) in narrow bands with pre-plant placement of fertilizers.
iii) Kharif 2004 onwards : Application of glyphosate @ 1.0 kg ha-1 15-20 days before sowing followed by use of paraquat @ 0.5 kg ha-1 2-3 days before direct seeding of rice with onset of regular monsoon.
Note: A common irrigation given to rabi lablab bean at flowering stage during every year
A) Pooled results Kharif Rice: I) Dominant monocots observed in Kharif rice
Kharif,2004
Kharif,2005
Kharif,2006
Kharif,2007
Kharif,2008
Kharif,2009
Kharif,2010
Kharif,2011
E.colona E.colona E.colona E.colona E.colona E.colona E.colona E.colona
C.iria C.iria C.iria C.iria C.iria C.iria C.iria C.iria
I.globossa I.globossa I.globossa I.globossa I.globossa I.globossa I.globosa I.globossa
A.metzii A.metzii - - - - - -
C.bengha C.bengha C.bengha C.bengha C.bengha C.bengha
- - - - D.ciliaris - - -
- - - - - - L.chinesis L.chinesis
- - - - - - E.Indica E.Indica
II) Prominent BLWs observed in Kharif rice Kharif,2004
Kharif,2005
Kharif,2006
Kharif,2007
Kharif,2008
Kharif,2009
Kharif,2010
Kharif,2011
L.octovalvis L.octovalvi
s L.octovalvi
s L.octovalvi
s L.octovalvis L.octovalvi
s
L.octovalvis -
A.conyzoides
A.conyzoides
A.conyzoides
A.conyzoides
A.conyzoides
A.conyzoides
A.conyzoides
A.conyzoides
- A.sessilis A.sessilis A.sessilis A.sessilis A.sessilis A.sessilis A.sessilis
C.argentea - C.argentea
a C.argente
a - C.argente
a - -
- - C.viscosa - C.viscosa - -
- - - - - C.halicaca
-bum - -

12
E.hexangularis S.sesitiva - - - P.minima S.sensitiva
S.sensitiva
- - - - - - M.pentaphyl
a M.pentaphyl
a
- - - - - - G.medispatan
a -
- - - - - - - C.auriculat
a
Table:1 Weed growth of monocots and BLWs at 60 and 90 DAS (g 0.25m-2) and grain yield of rice of Kharif rice. (Pooled mean Kh 2004 to Kh2011)
Treatments
Weed growth 60 DAS (g 0.25m-2)
Weed growth 90 DAS (g 0.25m-2)
Grain yield of Kharif rice
(q/ha)
WCI%
G&S
WCE
%
BLWs
WCE
%
G&S
WCE
%
BLWs
WCE
%
Main plots
T1 : Z-Z 25.48 (4.63)
- 11.82 (2.87)
- 19.13 (3.41)
- 32.52 (4.49)
- 17.01 -
T2 : Z-C 21.81 (3.72)
- 9.71 (2.75)
- 24.54 (4.01)
- 18.43 (3.33)
- 17.82 -
T3 : C-Z 16.76 (3.11)
- 13.62 (2.83)
- 21.82 (3.74)
- 19.72 (3.53)
- 19.74 -
T4 :C-C 25.50 (3.92)
- 13.71 (2.54)
- 24.83 (4.22)
- 13.06 (3.02)
- 18.84 -
S. Em. + (0.45) - (0.22) - (0.26) - (0.36) - 0.71 -
C.D. at 5% (1.32) - (N.S) - (N.S) - (1.07) - 2.08 -
Sub Plots W1 : HW at 20 & 40 DAS
1.73 (1. 40)
95.71 2.67 (1.52)
87.14 4.49 (1.90)
89.09 3.32 (1.72)
90.44 25.65 -
W2 : Oxadiargyl @ 0.12 kg/ ha (PE)
25.10 (4.51)
37.56 13.23 (2.79)
36.14 22.09 (4.05)
46.32 24.73 (4.14)
28.81 20.54 20.41
W3 : Weedy Check
40.33 (5.17)
- 20.76 (3.94)
- 41.15 (5.56)
- 34.74 (5.28)
- 8.87 65.16
S .Em + (0.56) - (0.35) - (0.53) - (0.44) - 2.47 -
C.D. at 5% (2.18) - (1.37) - (2.07) - (1.73) - 9.59 -
Interaction effects
S .Em. + 0.54 - (0.28) - (0.42) - (0.36) - 0.72 -
C.D. at 5% (N.S) - (N.S) - (N.S) - (N.S) - N.S. -
I) Effects on weed growth:-
a) Effects of tillage systems:- Based on pooled results over eight years, the weed growth of monocots at 90 DAS did
not differ significantly due to tillage systems. The weed growth of monocots at 60 DAS in case
of C-Z tillage system was significantly less over Z-Z tillage system. But the former treatment
was at par with Z-C and C-C tillage systems. The least weed growth of BLWs at 90 DAS was
due to C-C tillage system and which was at par with Z-C & C-Z tillage systems
b) Effects of weed control measures: -

13
The pooled results over eight years revealed that hand weeding twice was found to be the
most efficient weed control measure in reducing weed growth and thus showing maximum
weed control efficiency. However, other treatments viz weedy check and use of oxadiargyl @
0.12 kg/ha were found to be statistically identical.
c) Interaction effects:
The interaction between tillage systems and weed control measures did not
influence weed growth of monocots & BLWs at 60 & 90 DAS.
II) Effects on grain yield:-
a) Effects of tillage systems:- The pooled results over eight years revealed that the grain yield of Kharif rice was found
to be highest (19.74 q/ha) due to C-Z tillage system and which was significantly superior to Z-Z
tillage system and at par with Z-C and C-C tillage systems.
b) Effects of weed control measures: -
The pooled results over eight years revealed that hand weeding twice produced
significantly higher grain yield of Kharif rice (25.65 q/ha) which was significantly superior to
weedy check and at par with PE application of oxadiargyl @ 0.12 kg/ha.
c) Interaction effects:
The effects between tillage systems and weed control measures on grain yield of
Kharif rice were found to be non significant.
Conclusion: kharif Rice Grain yield of Kharif rice was significantly superior due to C-Z tillage system (19.74q/ha)
when compared with Z-Z tillage system because of the fact that, the former treatment
exhibited significantly least weed growth of competitive monocot weeds at 60 DAS as
against maximum weed growth in case of the latter treatment.
However, tillage systems viz C-Z, Z-C & C-C were statistically identical in respect
of their growth of competitive monocot weeds at 60 DAS as also their effects on grain
yield of rice.
BLWs were found to be more competitive at 90 DAS. Their least weed growth was noted
due to C-C tillage system and which was at par with Z-C & C-Z tillage systems.
Amongst weed control measures, hand weeding twice & pre emergence application of
oxadiargyl @ 0.12 Kg/ha were found effective & significantly superior in checking weed
growth & thus increasing grain yield of Kharif rice over weedy check.
B) Pooled results of Rabi Lablab bean: I) Prominent monocot weeds observed in Rabi Lablab bean: Rabi 2004-
05
Rabi 2005-06
Rabi 2006-07
Rabi 2007-08
Rabi 2008-09
Rabi 2009-10
Rabi 2010-11
Rabi 2011-12 E.colona E.colona E.colona E.colona E.colona E.colona - -
E.indica - - - E.indica E.indica E.indica E.indica
C.rotundus C.rotundus - - - - - C.rotundus
O.sativa - - - O.sativa - - -
- - - D.ciliaris - - - -
- - - C.bengha - - - -
- - - - - L.chinensis L.chinensis -

14
II) Dominant BLWs observed in Rabi Lablab bean: Rabi 2004-
05
Rabi 2005-06
Rabi 2006-07
Rabi 2007-08
Rabi 2008-09
Rabi 2009-10
Rabi 2010-11
Rabi 2011-12 L.aspera L.aspera L.aspera L.aspera L.aspera L.aspera L.aspera L.aspera
- L.octovalvis L.octoval L.octoval - - - L.octovalwis
A.sessilis A.sessilis A.sessilis A.sessilis A.sessilis A.sessilis A.sessilis A.sessilis
C.argentea C.argentea C.argentea C.argentea C.argentea C.argentea C.argentea C.argentea
C.viscosa C.viscosa C.viscosa C.viscosa C.viscosa C.viscosa C.viscosa A.conyzoides - A.conyzoides A.conyzoid A.conyzoide A.conyzoide A.conyzoide A.conyzoide
- - C.halicacabum C.halicaca C.halicaca C.halicaca C.halicaca C.halicaca P.minima - - - - P.minima P.minima P.minima
- E.hirta - E.hirta E.hirta E.hirta E.hirta -
- P.oleracea - - - - U.lobata -
- E.alba E.alba - - - - C.arvensis
Table:2 Weed growth of monocots and BLWs at 60 and 90 DAS (g 0.25m-2)and grain yield of Rabi Lablab bean (Pooled mean Rabi 2004-05 to 2011-12).
Treatments
Weed growth 60 DAS
(g 0.25m-2) Weed growth 90 DAS
(g 0.25m-2)
Grain yield of
Rabi Lablab
bean(q/ha)
WCI
(%)
G&S WCE% BLWs WCE% G&S WCE% BLWs WCE%
Main plots
T1 : Z-Z 0.70
(0.88) - 14.33
(3.25) - 0.72
(1.00) - 17.06
(3.60) - 3.61 -
T2 : Z-C 0.19
(0.80) - 14.52
(3.16) - 0.33
(0.85) - 15.08
(3.34) - 3.53 -
T3 : C-Z 0.85
(0.93) - 11.26
(2.87) - 0.47
(0.88) - 15.06
(3.41) - 3.74 -
T4 :C-C 0.14
(0.77) - 12.03
(2.99) - 0.28
(0.81) - 13.98
(3.47) - 3.21 -
S. Em. + (0.05) - (0.12) - (0.04) - (0.12) - 0.25 -
C.D. at 5% (N.S) - (N.S) - (N.S) - (N.S) - N.S -
Sub Plots W1 : HW at 20 & 40 DAS
0.12 (0.75)
85.88 0.88 (1.09)
96.41 0.13 (0.75)
83.12 2.63 (1.65)
89.54 4.50 -
W2 : Oxadiargyl @ 0.12 kg/ ha (PE)
0.44 (0.91)
48.24 14.70 (3.57)
40.17 0.44 (0.87)
42.86 18.10 (4.00)
28.03 3.69 18.00
W3 : Weedy Check
0.85 (0.94)
- 24.57 (4.51)
- 0.77 (1.00)
- 25.15 (4.71)
- 2.38 47.11
S .Em + (0.04) - (0.27) - (0.06) - (0.26) - 0.29 -
C.D. at 5% (N.S) - (1.04) - (0.24) - (1.01) - 0.91 -
Interaction effects
S .Em. + (0.07) - (0.18) - (0.08) - (0.18) - 0.22 -
C.D. at 5% (N.S) - (N.S) - (N.S) - (N.S) - N.S -
II) Effects on weed growth:-
a) Effects of tillage Systems:- The weed growth of monocots and BLWs as pooled means due to different tillage systems under
study at 60 & 90 DAS was found to be statistically identical.
b) Effects of weed control measures: -
Pooled results revealed that though WCMs under study did not influence growth of monocots at
60 DAS, their growth at 90 DAS was significantly reduced due to treatment of hand weeding twice.

15
However, the treatment viz hand weeding twice and PE application of oxadiargyl were statistically
identical. Regarding weed growth of BLWs at 60 and 90 DAS, it was observed that as compared to
weedy check, the treatment of hand weeding twice was significantly superior in suppressing weed
growth over other WCMs. However, the latter two treatments were at par with each other.
c) Interaction effects:-
The interaction effects between tillage systems and weed control measures in pooled data on
weed growth were found to be non-significant.
III) Effects on grain yield:-
a) Effects of tillage systems:- In pooled results the grain yield of Lablab bean was statistically identical due to
different tillage systems. However, C-Z tillage system produced highest grain yield followed by Z-Z
tillage system.
b) Effects of weed control measures: - The pooled results indicated that compared to weedy check, the treatment of hand
weeding twice and PE application of oxadiargyl caused significant increase in grain yield of Lablab bean.
The latter two treatments were at par with each other.
c) Interaction effects: The interaction effects between tillage systems and weed control measures on grain yield of
Rabi Lablab bean were found to be non-significant
Conclusions: During Rabi season different tillage systems did not significantly affect growth of monocots and
BLWs leading to non significant differences in grain yield of Lablab bean. However, the grain
yield due to C-Z tillage system was highest followed by Z-Z tillage system indicating positive
effects of zero tillage to Rabi Lablab bean
Pooled results revealed that as compared to weedy check, weed growth of monocots at 90 DAS
was significantly reduced due to treatment of hand weeding twice. However; treatments viz.,
weedy check and PE application of oxadiargyl were at par with each other. Similar were the
effects of weed control measures on weed growth of BLWs both at 60 & 90 DAS.
As a result hand weeding twice was most effective treatment for weed control in Lablab bean
followed by PE application of oxadiargyl and both of these treatments caused significant increase
in grain yield of Lablab bean as compared weedy check.

16
C) Microbiological Studies:
Table 3:- Effects of tillage systems and weed control measures on total population of soil bacteria, fungi, free living nitrogen fixers and phosphate solubilisers during Kharif season. (Pooled mean Kharif 2010 & Kharif 2011)
Treatments
Crop:-Rice
Bacteria CFU x 106/g of soil
Fungi CFU x 104/g of soil
Free living nitrogen fixers CFU x 103/g of
soil
Phosphate solubilisers CFU x
103/g of soil 30
DAS 50
DAS At
Harv-est
30 DAS
50 DAS
At Harv-est
30 DAS
50 DAS
At Harv-est
30 DAS
50 DAS
At Harv-
est Main plots: Tillage systems(TS) systems(TS)
T1 : Z-Z 32.32 32.18 31.51 16.91 17.35 16.49 16.95 13.31 12.01 13.20 12.94 13.76
T2 : Z-C 32.90 32.89 32.63 17.40 17.93 17.39 17.44 13.85 12.30 13.62 13.94 14.75
T3 : C-Z 33.04 33.18 33.92 17.91 18.76 19.81 18.47 15.28 13.44 15.39 14.93 15.23
T4 :C-C 34.08 34.83 35.46 18.97 20.44 20.47 19.45 16.98 14.24 16.22 15.44 15.90
S. Em + 0.68 0.80 1.02 0.97 1.42 1.49 1.61 1.06 0.82 0.80 0.95 0.94
CD at 5% NS NS NS NS NS NS NS NS NS NS NS NS
Sub-Plots:- Weed control measures (WCM). W1 : HW at 20 & 40 DAS
35.28 36.08 37.40 19.07 20.55 20.43 20.39 17.28 14.51 17.02 16.65 17.13
W2 : Oxadiargyl @ 0.12 kg/ ha (PE)
30.98 30.72 29.86 15.89 17.11 16.05 15.57 12.43 11.40 12.39 12.30 13.13
W3 : Weedy Check
32.99 33.00 32.86 18.42 18.19 19.15 18.27 14.85 13.09 14.42 13.99 14.48
S. Em + 0.50 0.90 0.84 0.88 0.84 1.11 0.98 0.94 0.90 0.59 0.71 0.79
C.D. at 5% 1.49 2.71 2.53 2.64 2.52 3.31 2.93 2.82 NS 1.77 2.14 2.37
Interaction effect
S Em. + 1.00 1.81 1.69 1.76 1.68 2.21 1.96 1.88 1.80 1.18 1.43 1.58
C.D. at 5% NS NS NS NS NS NS NS NS NS NS NS NS
a) Effects of tillage systems:-
The tillage systems under study did not significantly influence total population of
bacteria, fungi, free living nitrogen fixers and phosphate solubilisers in soil at any of the stage
during Kharif season.
b) Effects of weed control measures: -
The treatment of hand weeding twice caused significant increase in population of all soil
microbes (viz total population of bacteria, fungi, free living nitrogen fixers at 30 DAS& 50 DAS
and phosphate solublisers) which were significantly superior over the treatment of PE
application of oxadiargyl at all the stages of the crop growth. The latter treatment exhibited
least microbial population which were almost at par with weedy check though there was
significant reduction due to use of oxadiargyl in case of total population of bacteria and
phosphate solublisers at initial stage of 30 DAS

17
c) Interaction effects:-The interaction effects between tillage systems and weed control
measures on total population of soil bacteria, fungi, free living nitrogen fixers and phosphate
solubilisers were found to be non significant.
Table 4:- Effects of tillage systems and weed control measures on total population bacteria, fungi, free living nitrogen fixers and phosphate solubilisers in soil during Rabi season. (Mean over 2 years Rabi 2010 & 2011).
Treatments
Crop:-Rice
Bacteria CFU x 106/g of soil
Fungi CFU x 104/g of soil
Free living nitrogen fixers CFU x 103/g of
soil
Phosphate solubilisers CFU x
103/g of soil 30
DAS 50
DAS At
Harvest
30 DAS
50 DAS
At Harvest
30 DAS
50 DAS
At Harve
st
30 DAS
50 DAS
At Harve
st
Main plots: Tillage systems(TS) systems(TS)
T1 : Z-Z 40.83 42.98 44.43 21.73 24.88 25.70 25.77 27.76 30.22 23.62 25.07 27.14
T2 : Z-C 41.14 43.14 46.09 22.99 27.58 27.13 26.63 28.77 31.18 23.78 26.25 28.49
T3 : C-Z 41.90 43.90 46.53 23.97 27.88 28.96 27.11 29.64 31.57 25.05 26.95 28.84
T4 :C-C 42.18 44.39 47.33 26.68 29.89 30.56 27.87 30.42 32.12 26.23 27.82 29.74
S. Em + 0.79 0.95 0.91 1.14 1.52 1.06 0.42 1.12 0.76 0.85 0.69 0.83
CD at5%
NS NS NS NS NS NS NS NS NS NS NS NS
Sub-Plots:- Weed control measures (WCM). W1 : HW at 20 & 40 DAS
44.67 46.90 49.52 25.39 29.81 30.71 29.74 32.66 34.21 27.05 28.71 31.05
W2 : Oxadiargyl @ 0.12 kg/ ha (PE)
38.42 41.15 42.90 22.29 25.14 25.74 24.78 25.99 28.91 22.13 24.49 26.06
W3 : Weedy Check
41.44 42.75 45.86 23.84 27.73 27.81 26.02 28.80 30.69 24.83 26.37 28.55
S. Em + 0.67 0.78 0.75 0.65 0.81 1.01 0.85 0.71 0.69 0.98 0.65 0.88
C.D. at 5%
1.99 2.34 2.24 1.96 2.43 3.02 2.56 2.14 2.07 2.95 1.94 2.64
Interaction effect S Em. + 1.33 1.56 1.49 1.31 1.62 2.02 1.71 1.43 1.38 1.97 1.29 1.76 C.D. at 5%
NS NS NS NS NS NS NS NS NS NS NS NS
a) Effects of tillage systems:- The tillage systems under study did not significantly influence total population
of bacteria, fungi, free living nitrogen fixers and phosphate solubilisers at any of the stage.
b) Effects of weed control measures: -
Of the various weed control measures under study, the treatment of hand
weeding twice recorded maximum microbial population which was significantly superior over
the treatment where oxadiargyl was used @ 0.12 kg ha-1. Similarly, weedy check treatment
exhibited significant reduction in total population of bacteria, free living nitrogen fixers at all
stages of observation as compared to the hand weeding treatment and phosphate
solubilisers at 50 DAS. The free-living nitrogen fixers in weedy check treatment was at par

18
with use of oxadiargyl at 30 DAS and harvesting stage of the crop growth and phosphate
solubilisers at all the stages of crop growth.
c) Interaction effects:-
The interaction effects of tillage systems and weed control measures were found to be
non significant.
Conclusion:
1)There was no effect of tillage systems on soil microflora such as total bacteria, fungi, free
living nitrogen fixers and phosphate solubilisers during both kharif and rabi seasons.
2)The micro flora was found significantly higher due to the treatment of hand weeding twice
as compared to the use of oxadiargyl @ 0.12 kg/ha.
3) Compared with weedy check, continuous application of oxadiargyl @ 0.12 kg/ha did not
affect the population status of benificial microflora such as free living nitrogen fixers and
phosphate solubilisers in rice-Lablab bean cropping system.
D) Pooled results of the system: Table.5: Grain yield of kharif rice, rabi Lablab bean, rice equivalent yield and total REY
of the system as influenced by different treatments.
Treatment
combinations
Kharif Rabi System
Monocots* weed
growth at 60 DAS
(g/0.25m2)
WCE %
Kharif Rice Yield (q/ha)
BLWs** weed
growth at 60 DAS
(g/0.25m2)
WCE (%)
Rabi lablab bean Yield (q/ha)
REY of lablab bean (q/ha)
Total REY of
the system (q/ha)
Main plot :
T1 : Z-Z *25.48
- 17.01 **14.33
- 3.61 16.67 33.68
T2 : Z-C 21.81
14.40 17.82 14.52
-1.32 3.53 16.75 34.57
T3 : C-Z 16.76
34.22 19.74 11.26
21.42 3.74 17.64 37.37
T4 :C-C 25.50
-0.08 18.84 12.03
16.05 3.21 15.27 34.12
SEm + - - 0.71 - - 0.25 0.75 1.10
C.D.at 5% - - 2.08 - - N.S 2.20 3.23
Sub plot :
W1: hand weeding twice
1.73
95.71 25.65 0.88
96.41 4.50 20.98 46.63
W2:Oxadiargyl (PE)
25.10
37.76 20.54 14.70
40.17 3.69 17.66 38.20
W3:Weedy check
40.33
- 8.87 23.52
- 2.38 11.11 19.58
S Em+ - - 2.47 - - 0.29 1.14 3.00
C.D.at 5% - - 9.59 - - 0.91 4.43 11.66
Interaction effects
S Em+ - - 0.72 - - 0.22 0.90 1.18
C.D.at 5% - - N.S. - - N.S N.S N.S
*Weed growth of dominant monocots at 60DAS in Kharif rice **Weed growth of dominant BLWs at 60DAS in Rabi Lablab bean

19
a) Effects of tillage systems:- Compared to Z-Z tillage system, growth of dominant monocot weeds in kharif rice was
conspicuously reduced due to C-Z tillage system exhibiting weed control efficiency of (34.22%). As a
result, this treatment (C-Z) caused significant increase in grain yield of kharif rice compared to Z-Z
tillage system.
Similar to kharif rice, weed growth of dominant BLWs in Rabi Lablab bean was found to be least
due to C-Z tillage system exhibiting 21.42 % higher WCE as compared to Z-Z tillage system. Thus,
the former treatment produced maximum grain yield of rabi Lablab bean with its REY being 17.64
q/ha. The total REY of the cropping system as a whole was also found to be significantly highest due
to C-Z tillage system when compared to Z-Z and C-C tillage systems. The C-Z tillage system was at
par with Z-C tillage system in respect of total REY.
b) Effect of weed control measures:- In case of kharif rice and also rabi Lablab bean, the treatment of hand weeding twice at 20 &
40 DAS recorded maximum weed control efficiency of 95.71 & 96.41% respectively followed by the
treatment of PE application of oxadiargyl (WCE 37.8 & 40.2% respectively).
As a result, both of these weed control measures produced significantly higher grain yield
of kharif rice and also rabi Lablab bean. The total REY of kharif rice & rabi Lablab bean together
considering system as a whole, also followed the similar trend as that of crop yield during individual
season. The treatment of hand weeding twice recorded the total REY of 46.63 q/ha while PE
application of oxadiargyl @ 0.12 kg/ha recorded the total REY of 38.20 q/ha as against the treatment
of weedy check (19.6 q/ha).
c) Interaction effects:- The interaction effects between tillage systems and weed control measures on weed growth and grain yield of individual crops and system as a whole were found to be non- significant. Table.6 : Economics of different treatment combinations.
Treatment combinations
Total REY of the system (q/ha)
Gross returns (Rs ha-1)
Cost of cultivation (Rs ha-1)
Net returns (Rs ha-1)
B.C. ratio
ZZ-HW 48.19 60238 47727 12511 1.26
ZZ-HB 35.28 44100 41363 2738 1.07
ZZ-WC 17.57 21963 34357 -12365 0.64
ZC-HW 45.70 57125 53554 3572 1.07
ZC-HB 38.32 47900 48342 - 442 0.99
ZC-WC 19.68 24600 41143 -16543 0.60
CZ-HW 48.52 60650 47442 13208 1.28
CZ-HB 41.79 52238 42366 9872 1.23
CZ-WC 21.81 27263 34888 -7625 0.78
CC-HW 44.11 55138 55374 -237 1.00
CC-HB 37.40 46750 50302 -3552 0.92
CC-WC 20.84 26050 43536 -17486 0.60

20
Economics:
The data regarding economics of different combinations are presented in Table.4
which reveal that the treatment where C-Z tillage system was integrated with hand weeding
twice recorded highest net returns (Rs.13, 208 ha-1) and B:C ratio (1.28).
Conclusion:
Conventional tillage for kharif rice and zero tillage for rabi lablab bean combined with
hand weeding twice at 20 & 40 DAS to each of the crop separately recorded least weed
growth, more population of beneficial microflora and in turn maximum yield, net returns and
B:C ratio.
Purpose of Recommendation:
The recommendation of tillage and weed control in Rice –Lablab bean cropping
system will be helpful to development agencies, line departments, NGO’s and farmers use.
Recommendation:
In Konkan region, for obtaining higher yield and net returns, it is recommended to
follow conventional tillage to direct seeded Kharif rice and zero tillage be adopted for
succeeding rabi Lablab bean in combination with two hand weedings to each crop at 20 & 40
DAS. If hand weeding is not possible, pre- emergence application of oxadiargyl @ 0.12 kg/ha
for both the crops is recommended.
f’kQkjl
dksd.k foHkkxkr [kjhi isjHkkrkiklwu vf/kd mRiknu vkf.k uQk feG.;klkBh ikjaikfjd e’kkxr i/nr okijkoh vkf.k R;kuarj jCch oky fidklkBh fouke’kkxr i/nrhpk voyac d#u nksUgh fidkae/;s isj.khuarj 20 vkf.k 40 fnolkauha cs.k.kh dj.;kph f’kQkjl dj.;kr ;sr vkgs- rFkkih cs.k.kh ‘kD; ulY;kl r.k fu;a=.kklkBh izR;sd fidke/;s vkWD>WMk;kthZy r.kuk’kdkph mxo.kiwoZ Qokj.kh gsDVjh 0-12 fd-xzW- izek.kkr djkoh-

21
VII. RESEARCH ACHIEVEMENTS: Network Programme
WS.1. Weed survey, surveillance and ecological parameters
Weed survey of Ratnagiri district (Kharif Season)
Survey Route:- Dapoli(Umbarle) N. – 17,45,32.1” E. – 73,12,22.5” MSL – 181m.
Guhagar N. – 17,28,30.3” E. – 73,16,26.1” MSL - 119m.
Agave N. – 17,9,54.3” E. – 73,25,19.8” MSL - 218m.
Abloli N. – 17,21,10.1” E. – 72,20,2.6” MSL - 132m.
Vilye N. – 17,15,33.1” E. – 73,23,22.9” MSL - 250m.
Jakadevi N. – 17,9,3.7” E. – 73,23,53.2” MSL - 222m.
Nivendi N. 17,8,17” E. – 73,17,20.9” MSL - 125m.
Shirgaon N. – 17,8,19.7” E. – 773,17,19.6” MSL - 17m.
Bhatye N. – 17,119,19.9” E. – 73.18,4.3” MSL - 1m.
Golap N. – 16,55,17.7” E. – 73,18,58” MSL - 62m.
Purngad N. – 16,48,50.8” E. – 73,19,15.1” MSL - 74m.
Kondsar N. – 16,48,50.4” E. – 73,19,15,” MSL - 102m.
Adivare N. – 16,42,34.9” E. – 73,22,15.7” MSL - 118m.
Solgaon N. – 16,42,35.6” E. – 73,22,17.7” MSL - 186m.
Barasu N. – 16,40,22.9” E. – 73,28,17.9” MSL - 128m.
Rajapur N. – 16,40,12.7” E. – 73,31,55.7” MSL - 90m.
Lanja N. – 16,50,42.3” E. – 73,30,51.7” MSL - 135m.
Asage N. – 16,50,42.3” E. – 73,30,51.7” MSL - 140m.
Dabhole N. – 16,57,45.3” E. – 73,3745.8” MSL - 79m.
Sadvali N. – 17,3,10.1” E. – 73,38,18.4” MSL – 155 m.
Arwali N. – 17,18,59.5” E. – 73,31,20.50” MSL - 32m.
Mandki N. – 17,18,59.5” E. – 73,31,21.5,” MSL - 178m.
Pendanbhe N. – 17,29,24.1” E. – 73,29,4.4” MSL – 60 m.
Susere N. – 17,44,27” E. – 73,21,55.8” MSL - 21m.
Wakawali N. – 17,45,7.8” E. – 73,17,54.5” MSL - 175m.
Palgad N. – 17,45,50.9” E. – 73,20,55.3” MSL – 57.9m.
Khumbhale N. – 17,56,32.6” E. – 73,17,50.5” MSL - 93m.
Dhutroli N. – 17,59,10.3” E. – 73,17,7.2” MSL - 244m.
Mahu N. – 17,58,13.5” E. – 73,13,30.8” MSL - 65m.

22
1 Dapoli (Umbarle) Rice
Sr No.
Species Density/m2 Relative density
%
Relative frequency
%
Relative dominance
%
IVI (%)
1 Eriocaulon hexangularis 120.00 49.18 25.00 9.84 84.02
2 Ludwigia actovalvis 60.00 24.59 25.00 5.46 55.05
3 Blumea lacera 60.00 24.59 25.00 5.46 55.05
4 Ischaemum rugosum 4.00 1.64 25.00 0.58 27.22
Eriocuolon hexangularis was most dominant weed in puddle transplanted rice area followed by Ludwigia actovalvis and Ischaemum rugosum
2 Guhagar (Rice)
Sr No.
Species Density/m2 Relative density
%
Relative frequency
%
Relative dominance
%
IVI (%)
1 Isachne globosa 60.00 83.33 33.33 34.88 151.55
2 E. hexangularis 8.00 11.11 33.33 2.58 47.03
3 Leptochloa chinensis 4.00 5.56 33.33 1.94 40.83
Isachne globosa was most dominant weed in puddled transplanted rice area followed by E. hexangularis and Leptochloa chinensis
3. Golap (Rice)
Sr No.
Species Density/m2 Relative density
%
Relative frequency
%
Relative dominance
%
IVI (%)
1 Blumea lacera 38.00 43.18 16.67 7.92 67.77
2 Eriocuolon hexangularis 56.00 31.82 16.67 9.72 58.21
3 Cyperus iria 4.00 4.55 16.67 0.33 21.55
4 Ludwigia actovalvis 12.00 6.82 16.67 1.08 24.57
5 E.colona 10.00 11.36 16.67 1.25 29.28
6 Isachaemum rugosum 2.00 2.27 16.67 0.28 19.22
Blumea lacera was most dominant weed in puddled transplanted rice area followed by E. hexangularis and E.colona
4 Salgaon (Rice)
Sr No.
Species Density/m2 Relative density
%
Relative frequency
%
Relative dominance
%
IVI (%)
1 Leptochloa chinensis 152.00 90.48 16.67 54.50 161.65
2 Ageratum conyzoides 8.00 4.76 16.67 1.03 22.46
3 Cyperus iria 8.00 4.76 16.67 0.86 22.29
Leptochloa chinensis was most dominant weed in puddled transplanted rice area followed by Ageratum conyzoides and Cyperus iria
5 Kurtumb (Rice)
Sr No.
Species Density/m2 Relative density
%
Relative frequency
%
Relative dominance
%
IVI (%)
1 Blumea lacera 48.00 60.00 20.00 24.32 104.32
2 Ludwigla octovalvis 12.00 15.00 20.00 3.04 38.04
3 Oplismenus spp 8.00 10.00 20.00 1.35 31.35
4 Leptochloa chinensis 4.00 5.00 20.00 0.47 25.47

23 Blumea lacera was most dominant weed in puddled transplanted rice area followed by
Ludwigla octovalvis
6 Sakharapa medhe (Rice)
Sr No.
Species Density/m2 Relative density
%
Relative frequency
%
Relative dominance
%
IVI (%)
1 Isachne globosa 184.00 77.97 25.00 65.31 168.27
2 Eriocuolon hexangularis 40.00 16.95 25.00 3.55 45.50
3 L.octovaluis 8.00 3.39 25.00 0.35 28.74
4 Ischaemum rugosum 4.00 1.69 25.00 0.09 26.78
Isachne globosa was most dominant weed in puddled transplanted rice area followed by Eriocuolon hexangularis and L.octovaluis
7 Sadvali (Rice)
Sr No.
Species Density/m2 Relative density
%
Relative frequency
%
Relative dominance
%
IVI (%)
1 Eriocuolon hexangularis 184.00 65.71 33.33 42.97 142.01
2 Wild niger 56.00 20.00 33.33 3.85 57.18
3 Blumea lacera 40.00 14.29 33.33 2.20 49.82
Eriocuolon hexangularis was most dominant weed in puddled rice area followed by Wild niger and Blumea lacera
8 Burambi(Rice)
Sr No.
Species Density/m2 Relative density
%
Relative frequency
%
Relative dominance
%
IVI (%)
1 Isachne globosa 340.00 96.59 50.00 84.64 231.23
2 Ischaemum rugosum 12.00 3.41 50.00 0.42 53.83
Isachne globosa was most dominant weed in puddled transplanted rice area followed by
Ischaemum rugosum
9 Mandiki (Rice) Sr No.
Species Density/m2 Relative density
%
Relative frequency
%
Relative dominance
%
IVI (%)
1 Ludwigia octovalvis 48.00 30.77 25.00 7.89 63.66
2 Cyperus iria 48.00 30.77 25.00 7.89 63.66
3 Oplismenus spp 44.00 28.21 25.00 7.23 60.44
4 Blumea lacera 16.00 10.26 25.00 2.37 37.62
Ludwigla octovalvis and Cyperus irria was most dominant weed in puddled transplanted rice area followed by Karpel and Blumea lacera
10 Kamathe (Chiplun) (Rice) Sr No.
Species Density/m2 Relative density
%
Relative frequency
%
Relative dominance
%
IVI (%)
1 Commelina benhalensis 44.00 57.89 33.33 23.47 114.70
2 Blumea lacera 16.00 21.05 33.33 5.69 60.08
3 Oplismenus spp 16.00 21.05 33.33 6.83 4.00
Commelina benhalensis was most dominant weed in puddled transplanted rice area followed by Blumea lacera and Karpel
11 Talsure (Rice) Sr No.
Species Density/m2 Relative density
%
Relative frequency
%
Relative dominance
%
IVI (%)
1 Blumea lacera 80.00 74.07 25.00 27.51 126.59
2 Leptochloa chinensis 12.00 11.11 25.00 3.17 39.29

24
3 Ischaemum rugosum 12.00 11.11 25.00 3.02 39.13
4 Ludwigia octovalvis 4.00 3.70 25.00 0.26 28.97
Blumea lacera was most dominant weed in puddled transplanted rice area followed by Leptochloa chinensis and Ludwigia octovalvis
12 Wakavali (Rice) Sr
No. Species Density/m2 Relative
density %
Relative frequency
%
Relative dominance
%
IVI (%)
1 Isachne globosa 60.00 53.57 25.00 12.69 91.26
2 Cyperus iria 28.00 25.00 25.00 3.95 53.95
3 Smithia sensitiva 12.00 10.71 25.00 3.67 39.38
4 Ludwigia octovalvis 12.00 10.71 25.00 2.82 38.53
Isachne globosa was most dominant weed in puddled transplanted rice area followed by Cyperus iria and Smithia sensitiva
13 Suseri (Rice) Sr
No. Species Density/m2
Relative density
%
Relative frequency
%
Relative dominance
%
IVI (%)
1 Blumea lacera 36.00 56.25 20.00 8.57 84.82
2 Ludwigia octovalvis 4.00 18.75 60.00 0.48 79.23
3 Celosia argentea 8.00 12.50 20.00 1.90 34.40
4 Coix lacryma jobi 4.00 6.25 20.00 3.17 29.42
5 Leptochloa chinensis 4.00 6.25 20.00 1.59 27.84
Blumea lacera was most dominant weed in puddled transplanted rice area followed by Ludwigia octovalvis and Celosia argentea
14 Palgad (Rice) Sr
No. Species
Density/m2
Relative density %
Relative frequency
%
Relative dominance
%
IVI (%)
1 Blumea lacera 16.00 40.00 33.33 12.31 85.6
4
2 Mollugo spp 16.00 40.00 33.33 9.23 82.5
6
3 Ischaemum rugosum 8.00 20.00 33.33 9.23 62.5
6
Blumea lacera was most dominant weed in puddled rice area followed by Mollugo spp and Ischaemum rugosum
15 Kumbhale (Rice)
Sr No.
Species Density/
m2 Relative
density %
Relative frequency
%
Relative dominanc
e %
IVI (%)
1 Cyperus sp 24.00 54.55 40.00 18.18 112.73
2 Ludwigia octovalvis 8.00 18.18 60.00 4.36 82.55
3 Mollugo spp 6.67 15.15 20.00 2.42 37.58
4 Ischaemum rugosum 2.67 6.06 20.00 0.81 26.87
5 Eriocuolon hexangularis 2.67 6.06 20.00 0.81 26.87
Cyperus spwas most dominant weed in puddled transplanted rice area followed by Ludwigla octovalvis and Mollugo spp

25
16 Dhutroli (Rice) Sr
No. Species
Density/m2
Relative density %
Relative frequency
%
Relative dominanc
e %
IVI (%)
1 Isachne globosa 33.33 65.79 20.00 31.58 117.37
2 Eriocauolon hexangularis 5.33 10.53 20.00 1.68 32.21
3 Ludwigia octovalvis 5.33 10.53 20.00 1.68 32.21
4 Blumea lacera 4.00 7.89 20.00 0.63 28.53
5 Ischaemum rugosum 2.67 5.26 20.00 0.63 25.89
Isachne globosa most dominant weed in puddled rice transplanted area followed by Eriocauolon hexangularis and Ischaemum rugosum
17 Mahu (Rice)
Sr No.
Species Density/
m2
Relative density
%
Relative frequenc
y %
Relative dominanc
e %
IVI (%)
1 Isachne globosa 13.33 47.62 75.00 30.14 152.76
2 Ischaemum rugosum 5.33 19.05 50.00 2.41 71.46
3 Cyperus iria 5.33 19.05 25.00 2.41 46.46
4 Eriocuaolon hexangularis 4.00 14.29 25.00 1.63 40.91
Isachne globosa most dominant weed in puddled transplanted rice area followed by Ischaemum rugosum and Cyperus iria
18 Guhagar (Nagli ) Sr No.
Species Density/
m2
Relative density
%
Relative frequency
%
Relative dominanc
e %
IVI (%)
1 Ludwigia octovalvis 40.00 43.48 25.00 11.97 80.45
2 Cyperus iria 28.00 30.43 25.00 6.62 62.05
3 Eriocuolon hexangularis 16.00 17.39 25.00 3.02 45.42
4 L.Chinensis 8.00 8.70 25.00 2.90 36.59
Ludwigia octovalvis most dominant weed in nagli area followed by Cyperus iria and Eriocuolon hexangularis
19 Agave (Nagli)
Sr No.
Species Density/
m2
Relative density
%
Relative frequenc
y %
Relative dominanc
e %
IVI (%)
1 Cyperus spp 68.00 60.71 33.33 23.76 117.81
2 Eriocuolon hexangularis 40.00 35.71 33.33 17.42 86.47
3 Blumea lacera 4.00 3.57 33.33 0.70 37.60
Cyperus spp most dominant weed in nagli followed by Eriocuolon hexangularis and Blumea lacera
20 Mandki (Nagli)
Sr No.
Species Density/
m2
Relative density
%
Relative frequenc
y %
Relative dominanc
e %
IVI (%)
1 Oplismenus spp 168.00 89.36 33.33 54.99 177.69
2 Eragrostis minor 12.00 6.38 33.33 1.47 41.19
3 Digitaria sanguinalis 8.00 4.26 33.33 0.65 38.24
Oplismenus spp most dominant weed in nagli area followed by Eragrostis minor and Digitaria sanguinalis

26
21 Kumblale (Nagli)
Sr No.
Species Density/
m2
Relative density
%
Relative frequenc
y %
Relative dominanc
e %
IVI (%)
1 Cyperus iria 48.00 60.00 33.33 24.00 117.33
2 Blumea lacera 20.00 25.00 33.33 9.00 67.33
3 Eriocauolon hexangularis 12.00 15.00 33.33 3.60 51.93
Cyperus iria most dominant weed in nagli area followed by Eriocauolon hexangularis and Blumea lacera
22 Dhutroli (Nagli) Sr No.
Species Density/
m2
Relative density
%
Relative frequency
%
Relative dominanc
e %
IVI (%)
1 Mollugo spp 5.33 36.36 25.00 8.47 69.84
2 Cyperus iria 4.00 27.27 25.00 5.72 57.99
3 Themeda quadrivalvis 1.33 9.09 25.00 8.47 42.56
Mollugo spp most dominant weed in nagli area followed by Cyperus iria and Themeda quadrivalvis 23 Guhagar (Niger) Sr No.
Species Density/
m2
Relative density
%
Relative frequency
%
Relative dominanc
e %
IVI (%)
1 Ludwigia octovalvis 48.00 57.14 25.00 21.32 103.46
2 Ageratum conyzoides 16.00 19.05 25.00 5.69 49.73
3 Blumea lacera 12.00 14.29 25.00 2.13 41.42
4 Echinochloa colona 8.00 9.52 25.00 1.71 36.23
Ludwigia octovalvis most dominant weed in nagli area followed by Ageratum conyzoides and Blumea lacera
24 Mandiki (Niger)
Sr No.
Species Density/m2 Relative density
%
Relative frequency
%
Relative dominance
%
IVI (%)
1 Ludwigla octovalvis 144.00 70.59 33.33 39.41 143.33
2 Leptochloa chinensis 24.00 15.69 33.33 2.85 51.87
3 Blumea lacera 21.00 13.73 33.33 2.87 49.93
Ludwigla octovalvis most dominant weed in nagli area followed by Leptochloa chinensis and Blumea lacera
25 Mahu (Vari)
Sr No.
Species Density/m2 Relative density
%
Relative frequency
%
Relative dominance
%
IVI (%)
1 Cyperus iria 6.67 31.25 25.00 6.95 63.20
2 Leptochloa chinensis 5.33 25.00 25.00 8.33 58.33
3 Blumea lacera 5.33 25.00 25.00 5.56 55.56
4 Eriocaulon hexangularis 4.00 18.75 25.00 4.17 47.92
Cyperus iria most dominant weed in vari area followed by Leptochloa chinensis and Blumea lacera

27
26 Guhagar (Turmeric )
Sr No.
Species Density/
m2
Relative density
%
Relative frequency
%
Relative dominanc
e %
IVI (%)
1 Blumea lacera 48.00 57.14 33.33 21.16 111.64
2 Ludwigia octovalvis 28.00 33.33 33.33 12.96 79.63
3 Echnochloa colona 8.00 9.52 33.33 2.29 45.15
Blumea lacera most dominant weed in turmeric area followed by Ludwigia octovalvis and Echnochloa colona
27 Shirgaon (Groundnut) Sr No.
Species Density/m2 Relative density
%
Relative frequency
%
Relative dominance
%
IVI (%)
1 Ageratum conyzoides 20.00 23.81 14.29 6.44 44.53
2 Isachne globosa 24.00 28.57 14.29 3.86 46.72
3 Cyperus iria 20.00 23.81 14.29 2.15 40.24
4 Eclipta alba 4.00 4.76 14.29 0.43 19.48
5 Ludwigia octovalvis 8.00 9.52 14.29 1.12 24.92
6 Alternenthera sessilis 4.00 4.76 14.29 0.64 19.69
7 Eleusine indica 4.00 4.76 14.29 0.77 19.82
Isachne globosa most dominant weed in groundnut area followed by Ageratum conyzoides and Cyperus iria
28 Lanja (Groundnut) Sr No.
Species Density/
m2
Relative density
%
Relative frequenc
y %
Relative dominanc
e %
IVI (%)
1 Mimosa pudica 24.00 54.55 50.00 21.82 126.36
2 Ludwigia octovalvis 8.00 18.18 75.00 5.45 98.64
3 Blumea lacera 8.00 18.18 25.00 3.64 46.82
4 Echinochloa colona 4.00 9.09 25.00 0.91 35.00
Mimosa pudica most dominant weed in groundnut area followed by Ludwigia octovalvis and Blumea lacera
29 Vilye(Mango)
Sr No.
Species Density/m2 Relative density
%
Relative frequency
%
Relative dominance
%
IVI (%)
1 Themeda qnadrivaluis 100.00 89.29 33.33 64.70 187.32
2 Cassia tora 8.00 7.14 33.33 1.04 41.51
3 Wild urd 4.00 3.57 33.33 0.47 37.37
Themedaqnadrivaluis most dominant weed in mango area followed by Cassia tora and Wild urd
30 Purngad (Mango)
Sr No.
Species Density/m2 Relative density
%
Relative frequency
%
Relative dominance
%
IVI (%)
1 Themeda quadrivolvis 28.00 30.43 25.00 13.23 68.67
2 Celotia argentea 28.00 30.43 25.00 7.94 63.37
3 Urena lobata 20.00 21.74 25.00 3.78 50.52
4 Blumea lacera 16.00 17.39 25.00 2.27 44.66
Themeda quadrivolvis most dominant weed in mango area followed by Celotia argentea and Urena lobata

28
31 Adivare (Mango)
Sr No.
Species Density/m2 Relative density
%
Relative frequency
%
Relative dominance
%
IVI (%)
1 Themeda quadrivolvis 220.00 94.83 33.33 74.67 202.83
2 Urena lobata 8.00 3.45 33.33 0.41 37.19
3 Wild urd 4.00 1.72 33.33 0.16 35.22
Themeda quadrivolvis most dominant weed in mango area followed by Urena lobata and Wild urd
32 Adivare (Mango)
Sr No.
Species Density/m2 Relative density
%
Relative frequency
%
Relative dominance
%
IVI (%)
1 Themeda quadrivolvis 225.00 96.15 33.33 74.68 204.17
2 Blumea lacera 6.00 2.56 33.33 0.31 36.21
3 Wild Blackgram 3.00 1.28 33.33 0.08 34.70
Themeda quadrivolvis most dominant weed in mango area followed by Blumea lacera and Wild Blaclgram
33 Rajapur (Mango)
Sr No.
Species Density/m2 Relative density
%
Relative frequency
%
Relative dominance
%
IVI (%)
1 Oplisminus spp 388.00 80.17 25.00 35.95 141.11
2 Blumea lacera 28.00 5.79 25.00 0.91 31.69
3 Lagasca mollis 28.00 5.79 25.00 0.73 31.51
4 Urena lobata 40.00 8.26 25.00 2.22 35.49
Oplisminus spp most dominant weed in mango area followed by Urena lobata and Blumea lacera
34 Abaloli (Coconut)
Sr No.
Species Density/m2 Relative density
%
Relative frequency
%
Relative dominance
%
IVI (%)
1 Ludwigia octovalvis 108.00 44.26 33.33 15.14 92.74
2 Ageratum conyzoides 88.00 36.07 33.33 14.24 83.64
3 Cyperus Spp 48.00 19.67 33.33 5.18 58.18
Ludwigia octovalvis most dominant weed in coconut area followed by Ageratum conyzoides and Cyperus spp
35 Jakadevi (Coconut)
Sr No.
Species Density/m2 Relative density
%
Relative frequency
%
Relative dominance
%
IVI (%)
1 Oplisminus spp 800.00 95.69 33.33 79.74 208.77
2 Mimosa pudica 32.00 3.83 33.33 0.80 37.96
3 Cassia tora 4.00 0.48 33.33 0.04 33.85
Oplisminus spp most dominant weed in coconut area followed by Mimosa pudica and Cassia tora

29
36 Asage(Coconut) Sr No.
Species Density/m2
Relative density %
Relative frequenc
y %
Relative dominanc
e %
IVI (%)
1 Oplisminus spp 440.00 93.22 25.00 69.25 187.47
2 Ageradum conyzoides 8.00 1.69 25.00 0.10 26.79
3 Urena lobata 8.00 1.69 25.00 0.10 26.79
4 Mimosa pudica 16.00 3.39 25.00 0.48 28.87
Oplisminus spp most dominant weed in coconut area followed by Mimosa pundica and Ageradum conyzoides
37 Deorukh (Coconut) Sr No.
Species Density/m2
Relative density %
Relative frequenc
y %
Relative dominanc
e %
IVI (%)
1 Celotia argentea 88.00 39.29 50.00 11.22 100.51
2 Blumea lacera 68.00 30.36 75.00 4.34 109.69
3 Ageratum conyzoides 28.00 12.50 25.00 1.19 38.69
4 Themeda quadrivolus 40.00 17.86 25.00 8.50 51.36
Blumea lacera most dominant weed in coconut area followed by Ageratum celotia argentea and Themeda quadrivolus
38 Sangameshwar (Coconut)
Sr No.
Species Density/m2 Relative density
%
Relative frequency
%
Relative dominance
%
IVI (%)
1 Oplisminus spp 100.00 50.00 25.00 22.22 97.22
2 Sida spp 80.00 40.00 25.00 13.33 78.33
3 Ageradum conyzoides 16.00 8.00 25.00 1.33 34.33
4 Mimosa pdica 4.00 2.00 25.00 0.11 27.11
Oplisminus spp most dominant weed in coconut area followed by ida spp and Ageradum conyzoides
39 Burambi(coconunt)
Sr No.
Species Density/m2 Relative density
%
Relative frequency
%
Relative dominance
%
IVI (%)
1 E. hexangularis 52.00 27.66 20.00 4.61 52.27
2 Blumea lacera 40.00 21.28 20.00 5.32 46.60
3 Ludwigla octovalvis 40.00 21.28 20.00 6.21 47.48
4 Cyperus iria 44.00 23.40 20.00 4.29 47.70
5 Oplisminus spp 12.00 6.38 20.00 0.69 27.07
E. hexangularis most dominant weed in coconut area followed by Cyperus iria and Oplisminus spp
40 Pedambhe (chiplun) Banana
Sr No.
Species Density/m2 Relative density
%
Relative frequency
%
Relative dominance
%
IVI (%)
1 Oplisminus spp 220.00 62.50 25.00 32.68 120.18
2 Ludwigia octovalvis 76.00 21.59 25.00 3.53 50.12
3 A.ssesilis 48.00 13.64 25.00 2.50 41.13
4 Ageratum conyzoides 8.00 2.27 25.00 0.30 27.57

30 Oplisminus spp most dominant weed in banana area followed by Ludwigia octovalvis and A.ssesilis
41 Umbarle: (Non crop)
Sr No.
Species Density/
m2
Relative density
%
Relative frequency
%
Relative dominanc
e %
IVI (%)
1 Blumea lacera 100.00 73.53 50.00 32.68 156.21
2 Cassia tora 36.00 26.47 50.00 16.54 93.01
Blumea lacera most dominant weed in non crop area followed by Cassia tora
42 Palgad (Non crop )
Sr No.
Species Density/m2 Relative density
%
Relative frequency
%
Relative dominance
%
IVI (%)
1 Heptis suaveolens 24.00 60.00 33.33 15.57 108.90
2 Blumea lacera 20.00 50.00 33.33 2.60 85.93
3 Themeda quadrivolus 8.00 20.00 33.33 3.46 56.79
4 Urena lobeta 12.00 30.00 33.33 1.04 64.37
5 Cassia tora 4.00 10.00 33.33 0.69 44.03
Heptis suaveolens most dominant weed in non crop area followed by Blumea lacera and Urena lobeta
Summary:- Weed survey was conducted in different tahsil of Ratnagiri district Dapoli, Guhagar, Ratnagiri, Lanja, Sangmeshvar, Deorukh, Chiplun & Khed during Kharif season 2013. In Dapoli, Guhagar, Ratnagiri, lanja, Rajapur, Tahsil Isachanae globosa, Leptochloa chinensis, Ischaemum rugosum, Blumea lacera, Eriocaulon hexangularis, Ehinochloa colona were most dominant weeds in Kharif rice. While in groundnut Mimosa pundica, Ludwigia octovalvis, Blumea lacera, Ehinochloa colona, Ageratum conyzoides, Isachnae globosa, Alternenthera sessilis were dominant weeds. In orchard crops like Mango, Coconut Themeda quadrivolvis, Celotia argentea, Urena lobeta, Blumea lacera, Ludwigia octovalvis, Ageratum conyzoides were densly observed weeds. In non corpped area Themeda quadrivolvis, Blumea lacera, Impatiens balsamira, Urena lobeta, Cassia tora, crotolaria spp.
31
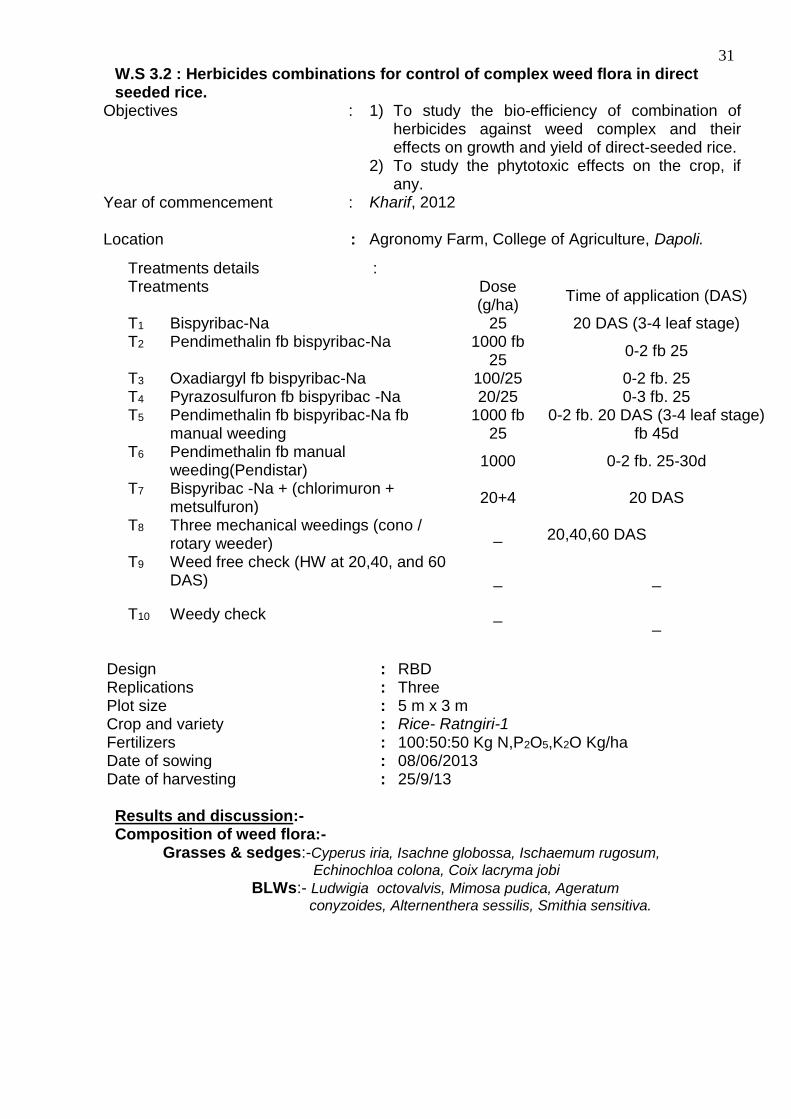
W.S 3.2 : Herbicides combinations for control of complex weed flora in direct seeded rice.
Objectives
: 1) To study the bio-efficiency of combination of herbicides against weed complex and their effects on growth and yield of direct-seeded rice.
2) To study the phytotoxic effects on the crop, if any.
Year of commencement : Kharif, 2012
Location : Agronomy Farm, College of Agriculture, Dapoli.
Treatments details : Treatments Dose
(g/ha) Time of application (DAS)
T1 Bispyribac-Na 25 20 DAS (3-4 leaf stage) T2 Pendimethalin fb bispyribac-Na 1000 fb
25 0-2 fb 25
T3 Oxadiargyl fb bispyribac-Na 100/25 0-2 fb. 25 T4 Pyrazosulfuron fb bispyribac -Na 20/25 0-3 fb. 25 T5 Pendimethalin fb bispyribac-Na fb
manual weeding 1000 fb
25 0-2 fb. 20 DAS (3-4 leaf stage)
fb 45d T6 Pendimethalin fb manual
weeding(Pendistar) 1000 0-2 fb. 25-30d
T7 Bispyribac -Na + (chlorimuron + metsulfuron)
20+4 20 DAS
T8 Three mechanical weedings (cono / rotary weeder)
_ 20,40,60 DAS
T9 Weed free check (HW at 20,40, and 60 DAS) _ _
T10 Weedy check _
_
Design : RBD Replications : Three Plot size : 5 m x 3 m Crop and variety : Rice- Ratngiri-1
Fertilizers : 100:50:50 Kg N,P2O5,K2O Kg/ha Date of sowing : 08/06/2013 Date of harvesting : 25/9/13 Results and discussion:- Composition of weed flora:-
Grasses & sedges:-Cyperus iria, Isachne globossa, Ischaemum rugosum,
Echinochloa colona, Coix lacryma jobi
BLWs:- Ludwigia octovalvis, Mimosa pudica, Ageratum
conyzoides, Alternenthera sessilis, Smithia sensitiva.

32
Phytotoxic symptoms:- No Phytotoxic symptoms were observed after the application of herbicide.
I) Effect of herbicide combinations on weed density:- All the weed control measures under study as compared to weedy check significantly reduced density of monocots both at 60 DAS and 90 DAS. The density of BLWs this way remained unaffected at both stages. Amongst these effective treatments, compared to the weed free check, the treatments Pendimethalin fb manual weeding (T6) reduced density of monocots followed by the treatment Pendimethalin fb Bispyribac-Na fb manual weeding (T5) both at 60 DAS and 90 DAS. However, the latter two treatments were statistically identical at 60 DAS and 90 DAS. The treatment T6 was significantly superior to T5 in reducing weed density exhibiting maximum WCE of 92.7 per cent as against weed free check (97.5 per cent). Table WS 3.2.1: Effects of herbicide combinations on weed density at 60 and 90 DAS
Treatments
Weed density 60 DAS (No./0.25 m2)
Weed density 90 DAS (No./0.25 m2)
G&S BLWs Total WCE %
G&S BLWs Total WCE %
T1:Bispyribac-Na 29.00 (5.16)
00.00 (0.71) 29.00 41.2
46.67 (6.81)
00.00 (0.71) 46.67 71.5
T2:Pendimethalin fb
Bispyribac-Na 21.33 (4.32)
3.00 (1.68)
24.33 50.7 19.33 (4.22)
3.67 (1.81)
23.00 85.9
T3:Oxadiargyl fb
Bispyribac-Na 23.33 (4.41)
00.00 (0.71)
23.33 52.7 26.00 (4.76)
0.33 (0.88)
26.33 83.9
T4:Pyrazosulfuron fb
Bispyribac-Na 34.67 (5.88)
0.00 (0.71)
34.67 29.7 76.33 (8.73)
0.67 (1.00)
77.00 53.0
T5: Pendimethalin fb
Bispyribac-Na fb manual weeding
2.67 (1.74)
1.00 (1.17) 3.67 92.6
32.33 (5.32)
4.00 (2.02) 36.33 77.8
T6:Pendimethalin fb
manual weeding
0.67 (1.00)
3.33 (1.79) 4.00 91.9
5.33 (2.06)
6.67 (2.58) 12.00 92.7
T7: Bispyribac-Na + (chlorimuron + metsulfuron)
26.00 (5.02)
0.0 (0.71)
26.00 47.3 39.33 (6.26)
1.00 (1.10)
40.33 75.4
T8: Three mechanical
weedings (cono/rotary weeder)
12.00 (2.88)
3.67 (1.85) 15.67 68.2
30.00 (5.31)
3.67 (1.55) 33.67 79.5
T9: Weed free check (HW at 20,40, & 60DAS)
3.00 (1.86)
0.0 (0.71) 3.00 93.9
3.00 (1.82)
1.00 (1.10) 4.00 97.5
T10: Weedy check 47.67 (6.71)
1.67 (1.39)
49.34 - 156.67 (12.03)
7.33 (2.17)
164.0- -
Sem ± -
(0.67) -
(0.50) - -
- (0.81)
- (0.81)
- -
LSD (P=0.05) -
(1.86) -
(N.S.) - -
- (2.25)
- (N.S.)
- -
Figures in parentheses indicate square root transformations √x + 0.5 for statistical comparison.

33 Table W S 3.2.2 Effects of herbicide combinations on weed growth at 60 and 90 DAS.
Treatments
Weed growth 90 DAS (g/0.25 m-2)
Weed growth 90 DAS (g/0.25 m-2)
G&S BLWs Total WCE %
G&S BLWs Total WCE %
T1:Bispyribac-Na 3.84
(1.97) 00.00 (0.71)
3.84 65.7 102.00 (9.87)
00.00 (0.71)
102.00 16.4
T2:Pendimethalin fb
Bispyribac-Na 2.75
(1.79) 0.27
(0.87) 3.02 73.0
23.67 (4.00)
1.00 (1.17)
24.67 79.8
T3: Oxadiargyl fb Bispyribac-
Na 3.53
(2.00) 0.00
(0.71) 3.53 68.5
86.33 (8.27)
0.33 (0.88)
86.66 28.9
T4:Pyrazosulfuron fb Bispyribac-Na
4.09 (2.13)
0.00 (0.71) 4.09 63.5
66.33 (7.98)
0.33 (0.71) 66.66 45.4
T5:Pendimethalin fb
Bispyribac-Na fb manual weeding
0.44 (0.96)
0.09 (0.77) 0.53 95.3
12.33 (3.22)
1.00 (1.22) 13.33 89.1
T6: Pendimethalin fb
manual weeding 0.12
(0.78) 0.36
(0.91) 0.48 95.7
1.33 (1.27)
1.33 (1.34)
2.66 97.8
T7: Bispyribac-Na +
(chlorimuron + metsulfuron)
2.42 (1.57)
0.00 (0.71) 2.42 78.4
112.67 (10.43)
0.33 (0.88) 113.0 7.4
T8: Three mechanical
weedings (cono / rotary weeder)
4.37 (2.00)
0.44 (0.96) 4.81 57.0
53.00 (6.51)
0.67 (1.05) 53.67 56.0
T9: Weed free check
(HW at 20,40, & 60DAS) 0.42
(1.03) 0.00
(0.71) 0.42 96.3
1.00 (1.22)
0.33 (0.88)
1.33 98.9
T10: Weedy check 10.80 (3.25)
0.40 (0.98) 11.20 -
116.67 (10.78)
5.33 (2.12) 122.00 -
Sem ± -
(0.38) -
(0.13) - -
- (0.91)
- (0.43)
- -
LSD (P=0.05) -
(1.05) -
(N.S.) - -
- (1.52)
- (1.19)
- -
Figures in parentheses indicate square root transformations √x + 0.5 II) Effects on weed growth:- Compared to weedy check treatment, all the weed control measures tried reduced growth of monocot weeds significantly at 60 DAS, while at 90 DAS similar trend was observed except the fact that growth of monocots due to use of Bispryribac-Na was statistically identical to weedy check. Amongst these effective weed control measures, Pendimethalin followed by manual weeding (T6) was the best treatment in reducing weed growth of monocots next to which treatment T5: Pendimethalin fb Bispyribac-Na fb manual weeding was superior at both stages of observation. At 90 DAS when BLWs growth was significantly influenced by various WCMs, the treatments with use of Bispyribac-Na remarkably reduced growth of BLWs equally well as that of weed free check signifying its importance for BLWs control. However, total weed growth of monocots and BLWs was conspicuously suppressed by the treatment where PE application of Pendimethalin was integrated with manual weeding exhibiting WCE of 95.7 and 97.88 per cent at 60 DAS and 90 DAS respectively.

34 Table W S 3.2.3: Effects of herbicide combinations on yield attributes & yield of rice.
Treatments
Height (cm)
Tiller number/m
Panicle number
/m
Panicle length (cm)
Wt. of grains
/panicle (g)
Yield (q/ha) WI (%) Grains Straw
T1: Bispyribac-Na 65.67 96.00 80.67 19.30 2.97 23.13 24.23 56.0
T2: Pendimethalin fb Bispy-Na 71.50 64.00 43.33 21.49 3.70 50.44 52.99 4.2
T3: Oxadiargyl fb Bispyribac-Na
63.53 72.67 60.00 20.29 4.18 40.56 43.00 22.9
T4: Pyrazosulfuron fb Bispyribac-Na
66.95 56.00 49.33 19.29 2.64 32.82 36.76 37.6
T5: Pendimethalin fb Bispyribac-Na fb manual weeding
72.63 62.67 52.67 19.57 3.38 46.38 50.09 11.9
T6: Pendimethalin fb manual weeding
69.70 87.33 70.67 20.47 3.35 52.33 56.49 0.59
T7: Bispyribac-Na +(chlorimuron + metsulfuron)
76.13 60.00 54.00 21.43 3.17 38.31 41.38 27.2
T8:Three mechanical weedings (cono / rotary weeder)
71.53 76.00 60.67 20.67 3.52 37.51 40.51 28.3
T9: Weed free check (HW at 20,40 & 60 DAS) 76.43 80.00 54.67 20.40 3.68 52.64 56.85 -
T10: Weedy check 61.19 66.00 52.00 18.68 2.23 10.89 11.85 79.3
Sem ± 0.72 2.09 2.25 0.27 0.32 0.75 0.78 -
LSD (P=0.05) N.S N.S N.S N.S 0.88 2.08 1.17 -
III) Effect of herbicide combinations on yield attributes and yield: Various herbicide combinations under study did not differ significantly in influencing different yield attributes except weight of grains/panicle which was significantly highest due to application of Oxadiargyl fb Bispyribac-Na over other treatments except Pendimethalin + Bispyribac-Na (T2), Pendimethalin fb manual weeding (T6) & three mechanical weedings (T8). All weed control measures under study recorded significant increase in grain & straw yield of rice as compared to weedy check.The weed free check treatment produced significantly highest grain & straw yield of 52.64 and 56.85 q/ha respectively over all other treatments which were at par with application of Pendimethalin (PE) fb manual weeding (T6). Thus, compared to the best treatment of weed free check (3 HWs), the per cent reduction in grain yield (WI) was found to be least due to the treatment viz application of Pendimethalin fb manual weeding (0.59%) followed by Pendimethalin fb Bispyribac-Na fb manual weeding (4.20%). Summary:- The weed density & weed growth of monocots was significantly reduced due to the application of Pendimethalin fb manual weeding (T6).The total growth of monocot & BLWs was also found to be suppressed by the pre-emergence application of Pendimethalin fb manual weeding exihibiting highest WCE 95.7 and 97.8% respectively. The highest grain & straw yield of rice was recorded due to weed free check followed by application of Pendimethalin fb manual weeding and thus, it is observed that, the per cent reduction in grain yield (WI) was found to be the least due to application of Pendimethalin fb manual weeding (0.59%) followed by Pendimethalin fb Bispyribac-Na (4.20%).
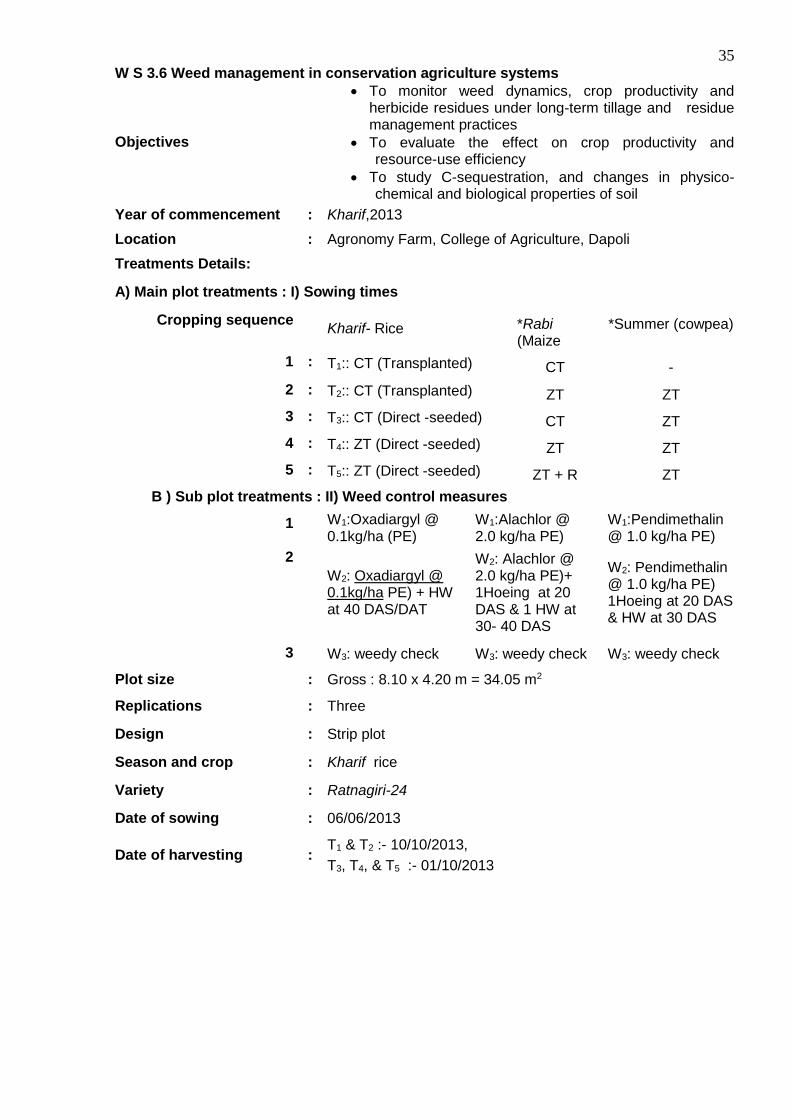
35 W S 3.6 Weed management in conservation agriculture systems
Objectives
To monitor weed dynamics, crop productivity and herbicide residues under long-term tillage and residue management practices
To evaluate the effect on crop productivity and resource-use efficiency
To study C-sequestration, and changes in physico-chemical and biological properties of soil
Year of commencement : Kharif,2013
Location : Agronomy Farm, College of Agriculture, Dapoli
Treatments Details:
A) Main plot treatments : I) Sowing times
Cropping sequence Kharif- Rice *Rabi
(Maize *Summer (cowpea)
1 : T1:: CT (Transplanted) CT -
2 : T2:: CT (Transplanted) ZT ZT
3 : T3:: CT (Direct -seeded) CT ZT
4 : T4:: ZT (Direct -seeded) ZT ZT
5 : T5:: ZT (Direct -seeded) ZT + R ZT
B ) Sub plot treatments : II) Weed control measures
1 W1:Oxadiargyl @ 0.1kg/ha (PE)
W1:Alachlor @ 2.0 kg/ha PE)
W1:Pendimethalin @ 1.0 kg/ha PE)
2
W2: Oxadiargyl @ 0.1kg/ha PE) + HW at 40 DAS/DAT
W2: Alachlor @ 2.0 kg/ha PE)+ 1Hoeing at 20 DAS & 1 HW at 30- 40 DAS
W2: Pendimethalin @ 1.0 kg/ha PE) 1Hoeing at 20 DAS & HW at 30 DAS
3 W3: weedy check W3: weedy check W3: weedy check
Plot size : Gross : 8.10 x 4.20 m = 34.05 m2
Replications : Three
Design : Strip plot
Season and crop : Kharif rice
Variety : Ratnagiri-24
Date of sowing : 06/06/2013
Date of harvesting : T1 & T2 :- 10/10/2013,
T3, T4, & T5 :- 01/10/2013
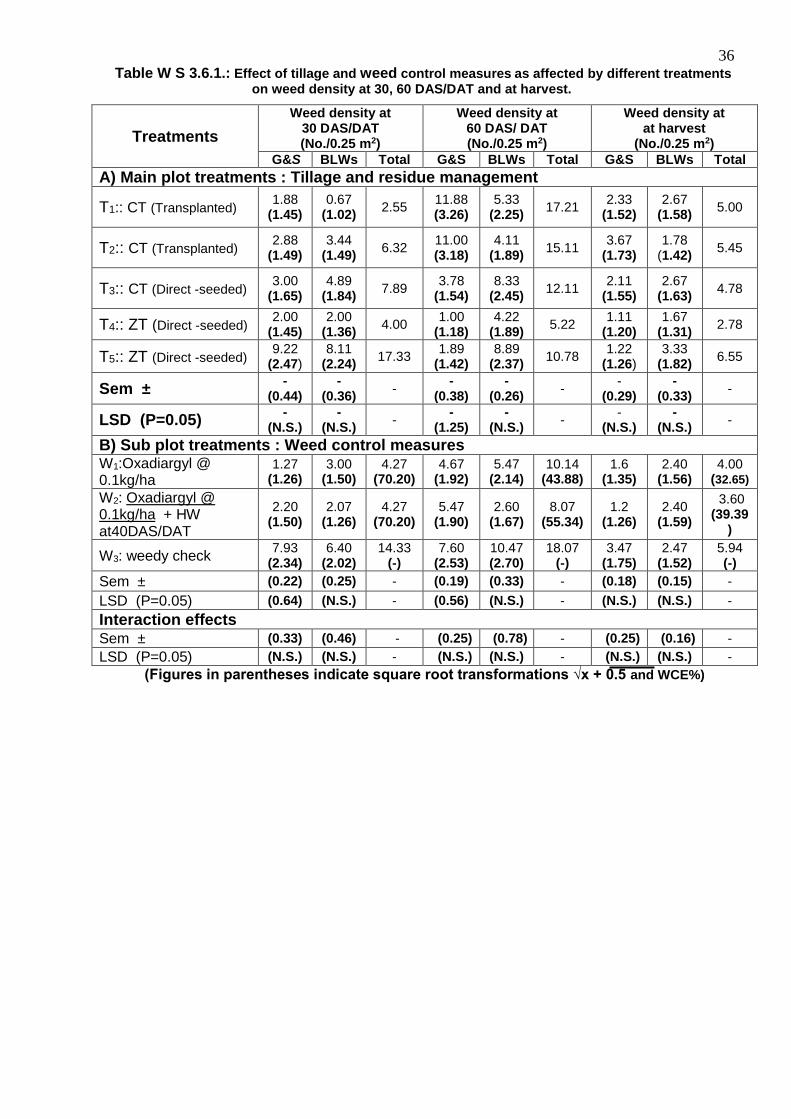
36 Table W S 3.6.1.: Effect of tillage and weed control measures as affected by different treatments
on weed density at 30, 60 DAS/DAT and at harvest.
Treatments
Weed density at 30 DAS/DAT (No./0.25 m2)
Weed density at 60 DAS/ DAT (No./0.25 m2)
Weed density at at harvest
(No./0.25 m2) G&S BLWs Total G&S BLWs Total G&S BLWs Total
A) Main plot treatments : Tillage and residue management
T1:: CT (Transplanted) 1.88
(1.45) 0.67
(1.02) 2.55
11.88 (3.26)
5.33 (2.25)
17.21 2.33
(1.52) 2.67
(1.58) 5.00
T2:: CT (Transplanted) 2.88
(1.49) 3.44
(1.49) 6.32
11.00 (3.18)
4.11 (1.89)
15.11 3.67
(1.73) 1.78
(1.42) 5.45
T3:: CT (Direct -seeded) 3.00
(1.65) 4.89
(1.84) 7.89
3.78 (1.54)
8.33 (2.45)
12.11 2.11
(1.55) 2.67
(1.63) 4.78
T4:: ZT (Direct -seeded) 2.00
(1.45) 2.00
(1.36) 4.00
1.00 (1.18)
4.22 (1.89)
5.22 1.11
(1.20) 1.67
(1.31) 2.78
T5:: ZT (Direct -seeded) 9.22
(2.47) 8.11
(2.24) 17.33
1.89 (1.42)
8.89 (2.37)
10.78 1.22
(1.26) 3.33
(1.82) 6.55
Sem ± -
(0.44) -
(0.36) -
- (0.38)
- (0.26)
- -
(0.29) -
(0.33) -
LSD (P=0.05) -
(N.S.) -
(N.S.) -
- (1.25)
- (N.S.)
- -
(N.S.) -
(N.S.) -
B) Sub plot treatments : Weed control measures W1:Oxadiargyl @ 0.1kg/ha
1.27 (1.26)
3.00 (1.50)
4.27 (70.20)
4.67 (1.92)
5.47 (2.14)
10.14 (43.88)
1.6 (1.35)
2.40 (1.56)
4.00 (32.65)
W2: Oxadiargyl @ 0.1kg/ha + HW at40DAS/DAT
2.20 (1.50)
2.07 (1.26)
4.27 (70.20)
5.47 (1.90)
2.60 (1.67)
8.07 (55.34)
1.2 (1.26)
2.40 (1.59)
3.60 (39.39
)
W3: weedy check 7.93
(2.34) 6.40
(2.02) 14.33
(-) 7.60
(2.53) 10.47 (2.70)
18.07 (-)
3.47 (1.75)
2.47 (1.52)
5.94 (-)
Sem ± (0.22) (0.25) - (0.19) (0.33) - (0.18) (0.15) -
LSD (P=0.05) (0.64) (N.S.) - (0.56) (N.S.) - (N.S.) (N.S.) -
Interaction effects Sem ± (0.33) (0.46) - (0.25) (0.78) - (0.25) (0.16) -
LSD (P=0.05) (N.S.) (N.S.) - (N.S.) (N.S.) - (N.S.) (N.S.) -
(Figures in parentheses indicate square root transformations √x + 0.5 and WCE%)

37 Table W S 3.6.2.: Effect of tillage and weed control measures as affected by different
treatments on weed growth at 30, 60 DAS/DAT and at harvest.
Treatments Weed growth at
30 DAS/DAT (g/0.25 m2) Weed growth at
60 DAS/DAT (g/0.25 m2) Weed growth at
at harvest (g/0.25 m2) G&S BLWs Total G&S BLWs Total G&S BLWs Total
A) Main plot treatments : Tillage and residue management
T1:: CT (Transplanted) 1.75
(1.33) 0.15
(0.79) 1.90
1.65 (1.40)
0.96 (1.10)
2.61 18.22 (2.59)
1.44 (1.23)
19.66
T2:: CT (Transplanted) 0.74
(1.03) 0.22
(0.82) 0.96
1.26 (1.28)
0.53 (0.96)
1.79 1.22
(1.21) 0.89
(1.14) 2.11
T3:: CT (Direct -seeded) 1.85
(1.41) 0.14
(0.80) 1.99
3.64 (1.62)
1.70 (1.20)
5.34 34.11 (4.21)
1.89 (1.40)
36.00
T4:: ZT (Direct -seeded) 1.28
(1.26) 0.10
(0.76) 1.38
2.75 (1.58)
0.66 (0.98)
3.41 60.11 (4.81)
6.11 (2.21)
66.22
T5:: ZT (Direct -seeded) 2.31
(1.55) 0.47
(0.90) 2.78
1.68 (1.34)
1.30 (1.19)
2.98 86.00 (5.32)
15.22 (2.57)
101.22
Sem ± -
(0.16) -
(0.06) -
- (0.32)
- (0.16)
- -
(1.40) -
(0.67) -
LSD (P=0.05) -
(N.S.) -
(N.S.) -
- (N.S.)
- (N.S.)
- -
(N.S.) -
(N.S.) -
B) Sub plot treatments : Weed control measures W1:Oxadiargyl @ 0.1kg/ha
0.94 (1.11)
0.13 (0.78)
1.07 (59.62)
2.11 (1.43)
0.80 (1.03)
2.91 (50.76)
3.67 (1.67)
3.33 (1.64)
7.00 (94.31)
W2: Oxadiargyl @ 0.1kg/ha + HW at40DAS/DAT
1.61 (1.37)
0.08 (0.76)
1.69 (36.22)
0.63 (1.01)
0.35 (0.89)
0.98 (83.42)
3.27 (1.54)
1.87 (1.36)
5.14 (95.82)
W3: weedy check 2.21
(1.47) 0.44
(0.91) 2.65 (-)
3.97 (1.90)
1.94 (1.34)
5.91 (-)
112.87 (7.68)
10.13 (2.12)
123.00 (-)
Sem ± (0.12) (0.05) - (0.14) (0.14) - (1.00) (0.31) -
LSD (P=0.05) (N.S.) (N.S.) - (0.42) (N.S.) - (2.96) (N.S.) -
Interaction effects
Sem ± (0.11) (0.02) - (0.14) (0.14) - (7.11) (0.67) -
LSD (P=0.05) (N.S.) (N.S.) - (N.S.) (N.S.) - (N.S.) (N.S.) -
Figures in parentheses indicate square root transformations √x + 0.5 and WCE%
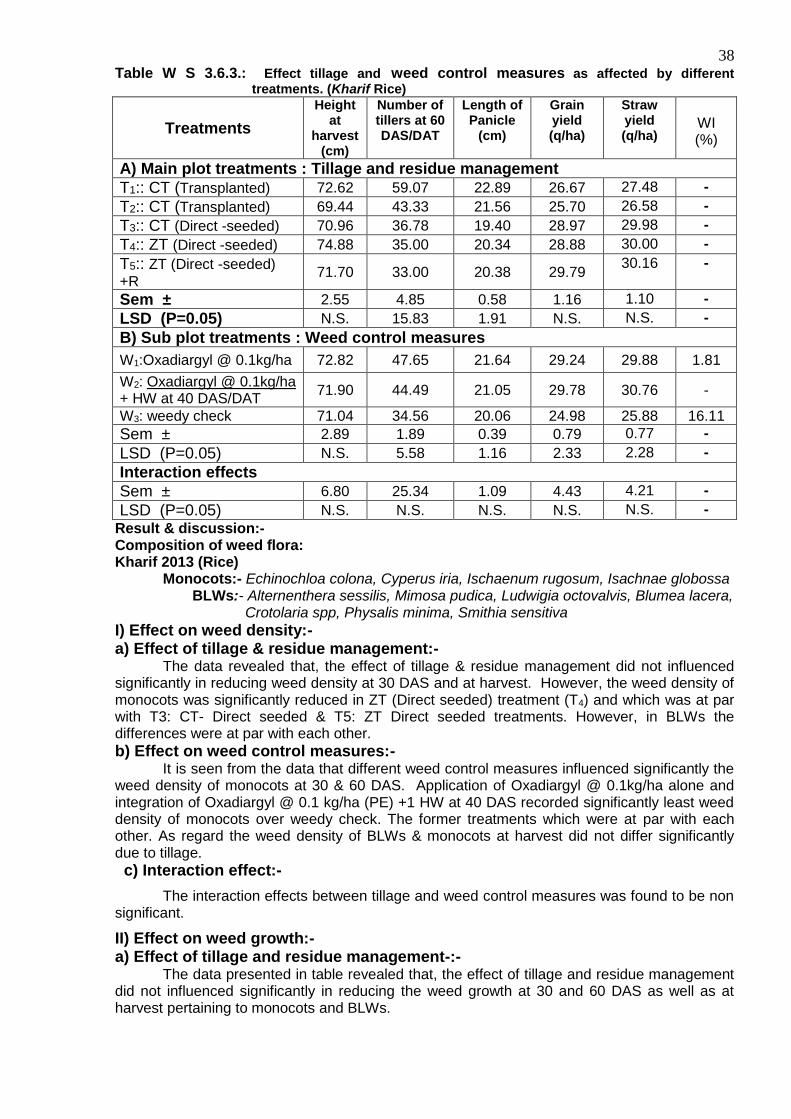
38 Table W S 3.6.3.: Effect tillage and weed control measures as affected by different
treatments. (Kharif Rice)
Treatments
Height at
harvest (cm)
Number of tillers at 60 DAS/DAT
Length of Panicle
(cm)
Grain yield (q/ha)
Straw yield (q/ha)
WI (%)
A) Main plot treatments : Tillage and residue management
T1:: CT (Transplanted) 72.62 59.07 22.89 26.67 27.48 -
T2:: CT (Transplanted) 69.44 43.33 21.56 25.70 26.58 -
T3:: CT (Direct -seeded) 70.96 36.78 19.40 28.97 29.98 -
T4:: ZT (Direct -seeded) 74.88 35.00 20.34 28.88 30.00 -
T5:: ZT (Direct -seeded)
+R 71.70 33.00 20.38 29.79
30.16 -
Sem ± 2.55 4.85 0.58 1.16 1.10 -
LSD (P=0.05) N.S. 15.83 1.91 N.S. N.S. -
B) Sub plot treatments : Weed control measures
W1:Oxadiargyl @ 0.1kg/ha 72.82 47.65 21.64 29.24 29.88 1.81
W2: Oxadiargyl @ 0.1kg/ha + HW at 40 DAS/DAT
71.90 44.49 21.05 29.78 30.76 -
W3: weedy check 71.04 34.56 20.06 24.98 25.88 16.11
Sem ± 2.89 1.89 0.39 0.79 0.77 -
LSD (P=0.05) N.S. 5.58 1.16 2.33 2.28 -
Interaction effects
Sem ± 6.80 25.34 1.09 4.43 4.21 -
LSD (P=0.05) N.S. N.S. N.S. N.S. N.S. -
Result & discussion:- Composition of weed flora: Kharif 2013 (Rice) Monocots:- Echinochloa colona, Cyperus iria, Ischaenum rugosum, Isachnae globossa BLWs:- Alternenthera sessilis, Mimosa pudica, Ludwigia octovalvis, Blumea lacera, Crotolaria spp, Physalis minima, Smithia sensitiva
I) Effect on weed density:- a) Effect of tillage & residue management:- The data revealed that, the effect of tillage & residue management did not influenced significantly in reducing weed density at 30 DAS and at harvest. However, the weed density of monocots was significantly reduced in ZT (Direct seeded) treatment (T4) and which was at par with T3: CT- Direct seeded & T5: ZT Direct seeded treatments. However, in BLWs the differences were at par with each other.
b) Effect on weed control measures:- It is seen from the data that different weed control measures influenced significantly the weed density of monocots at 30 & 60 DAS. Application of Oxadiargyl @ 0.1kg/ha alone and integration of Oxadiargyl @ 0.1 kg/ha (PE) +1 HW at 40 DAS recorded significantly least weed density of monocots over weedy check. The former treatments which were at par with each other. As regard the weed density of BLWs & monocots at harvest did not differ significantly due to tillage. c) Interaction effect:-
The interaction effects between tillage and weed control measures was found to be non significant.
II) Effect on weed growth:- a) Effect of tillage and residue management-:- The data presented in table revealed that, the effect of tillage and residue management did not influenced significantly in reducing the weed growth at 30 and 60 DAS as well as at harvest pertaining to monocots and BLWs.

39
b) Weed control measures:-
It is also seen that, the different weed control measures did not influenced significantly in reducing the weed growth at 30 DAS. However, the weed growth of monocots at 60 DAS and at harvest was significantly least due to use of weed control measures W1 and W2 over weedy check. However, W1 and W2 were at par with each other. While the weed control measures did not influenced significantly in reducing weed growth of BLWs at 30 and 60 DAS/ DAT and at harvest.
c) Interaction effect:- The interaction effects between tillage and residue management was found to be non significant.
III) Effect on yield attribute & yield of rice:- a) Effect of tillage and residue management:-
The growth parameter viz. Height of plant, grain yield and straw yield were not significantly influenced by any of tillage and residue management practices. However, number of tillers at 60 DAS/DAT length of panicle were significantly influenced various tillage & residue management practices. It is seen that, number of tillers at 60 DAT were significantly increased in T1 (transplanted) treatment over all other treatments of tillage & residue management except T2. However, the remaining treatments which were at par with each other. In case of length of panicle it was significantly superior in T1 treatment over all other treatments viz, T3, T4, & T5 but it was at par with T2 treatment.
b) Effect of weed control measures:- The growth parameter viz. number of tillers at 60 DAS/DAT, length of panicle grain yield and straw yield was significantly influenced by different weed control measures over weedy check. However, height at harvest was not significantly influenced due to weed control measures. Numbers of tillers at 60 DAS/DAT were observed more in W1 treatment which was significantly superior over weedy check. However, it was at par with W2 treatment. Similar trend also observed in case of length of panicle, grain yield and straw yield. However, the parameter viz. height at harvest did not showed significant difference for any of the weed control measures compared with weedy check.
c) Interaction effect:- The interaction effects between tillage and weed control measures was found to be non
significant. Summary :-
The weed growth of monocots at 60 DAS and at harvest was significantly least due to use of weed control measures W1 and W2 over weedy check. All tillage and residue management treatments were statistically identical in respect of grain & straw yield of Kharif rice. Application of Oxadiargyl @ 0.100 Kg/ha alone and integration of Oxadiargyl + 1 HW reduced significantly weed growth of monocots integration of resulting into increase in yield attributes and yield of rice.

40 Project :- Weed management in conservation agriculture system
Objective
:- To find out long term effects herbicides residues on soil
microflora and their associated parameters under term tillage
systems and residue management practices.
Year of commencement
Location
:-
:-
Agronomy work:- Kharif, 2013
Microbiology work:-Kharif,2013
Agronomy Farm, Collage of Agriculture ,Dapoli
Methodology :-
A field experiment was conducted on long term herbicide trial in kharif
Rice-rabi maize-summer legume cropping system. The soil samples were collected from
rhizo-sphere soil at 3 stages of plant growth, 30 DAS/30DAT, 60 DAS/DAT and at harvesting
stage of rice crop during during kharif season. (The soil adhered to the plant roots). It was
used for all the microbial analysis.
The soil sample was analyzed for following observation.
a) Total bacterial population
b) Total Fungal population
c) Free living nitrogen fixers.
d) Phosphate solubilisers.
e) Microbial biomass carbon.
f) Basal soil respiration
g) Dehydrogenase enzyme.
h)
Phosphatase enzyme
Table no WSM 1:- To find out long term effects herbicides residues on soil bacterial population
under term tillage systems and residue management practices during kharif 2013.
Treatment
Crop:-Rice
Bacteria CFU x 106/gm of soil
30 DAS 60 DAS/DAT At harvest
Main plots:- Tillage systems
T1 :- CT(Transplanted) 26.81 31.97 28.21
T2 :- CT(Transplanted) 27.23 31.84 29.24
T3:- CT(Direct seeded) 25.77 28.84 27.87
T4 :- ZT(Direct seeded) 23.86 27.69 25.40
T5 :- ZT(Direct seeded)+R 23.77 28.63 27.17
S. Em + 1.35 1.65 1.96
CD at 5% NS NS NS
Sub-Plots:- Weed control measures
W1:Oxadiargyl @ 0.1kg/ha 22.26 26.72 24.85
W2: Oxadiargyl @ 0.1kg/ha + HW at 40 DAS/DAT
23.85 30.50 28.47
W3: weedy check 30.36 32.15 29.41
S. Em + 0.73 1.59 2.07
C.D. at 5% 2.86 NS NS
Interaction effect
S Em. + 2.23 4.18 4.93
C.D. at 5% NS NS NS
1)Total Bacterial population:- The data of bacterial population is presented in table no.WSM1
a) Effect of tillage systems:- The total bacterial population in soil didn’t significantly influenced
at 30DAS/30DAT, 60DAS/DAT and at harvesting stage of the rice crop.
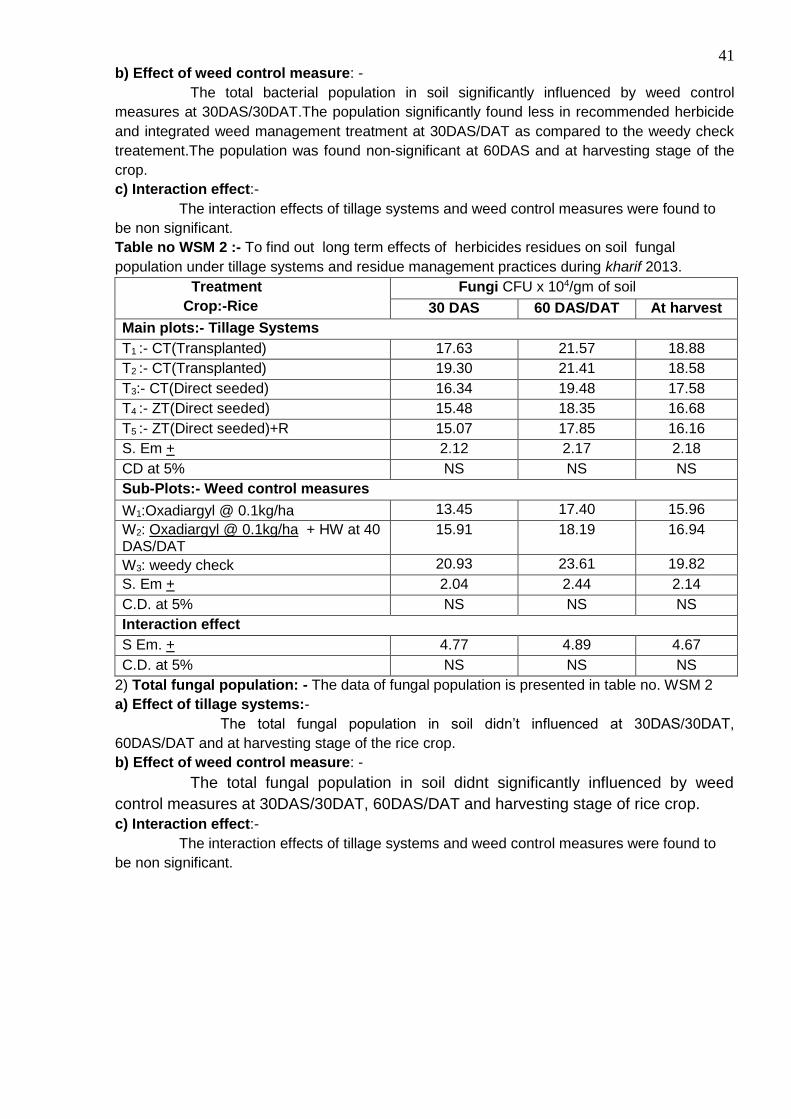
41 b) Effect of weed control measure: -
The total bacterial population in soil significantly influenced by weed control
measures at 30DAS/30DAT.The population significantly found less in recommended herbicide
and integrated weed management treatment at 30DAS/DAT as compared to the weedy check
treatement.The population was found non-significant at 60DAS and at harvesting stage of the
crop.
c) Interaction effect:-
The interaction effects of tillage systems and weed control measures were found to
be non significant.
Table no WSM 2 :- To find out long term effects of herbicides residues on soil fungal
population under tillage systems and residue management practices during kharif 2013.
Treatment
Crop:-Rice
Fungi CFU x 104/gm of soil
30 DAS 60 DAS/DAT At harvest
Main plots:- Tillage Systems
T1 :- CT(Transplanted) 17.63 21.57 18.88
T2 :- CT(Transplanted) 19.30 21.41 18.58
T3:- CT(Direct seeded) 16.34 19.48 17.58
T4 :- ZT(Direct seeded) 15.48 18.35 16.68
T5 :- ZT(Direct seeded)+R 15.07 17.85 16.16
S. Em + 2.12 2.17 2.18
CD at 5% NS NS NS
Sub-Plots:- Weed control measures
W1:Oxadiargyl @ 0.1kg/ha 13.45 17.40 15.96
W2: Oxadiargyl @ 0.1kg/ha + HW at 40 DAS/DAT
15.91 18.19 16.94
W3: weedy check 20.93 23.61 19.82
S. Em + 2.04 2.44 2.14
C.D. at 5% NS NS NS
Interaction effect
S Em. + 4.77 4.89 4.67
C.D. at 5% NS NS NS
2) Total fungal population: - The data of fungal population is presented in table no. WSM 2
a) Effect of tillage systems:-
The total fungal population in soil didn’t influenced at 30DAS/30DAT,
60DAS/DAT and at harvesting stage of the rice crop.
b) Effect of weed control measure: -
The total fungal population in soil didnt significantly influenced by weed
control measures at 30DAS/30DAT, 60DAS/DAT and harvesting stage of rice crop.
c) Interaction effect:-
The interaction effects of tillage systems and weed control measures were found to
be non significant.

42 Table WSM 3 :- To find out long effects herbicides residues on free living nitrogen fixers under
tillage systems and residue management practices during kharif 2013.
Treatment
Crop:-Rice
Free living nitrogen fixers CFU x 103/gm of soil
30 DAS 60 DAS/DAT At harvest
Main plots:- Tillage systems
T1 :- CT(Transplanted) 14.36 19.60 15.38
T2 :- CT(Transplanted) 13.17 19.06 13.96
T3:- CT(Direct seeded) 12.70 18.82 13.38
T4 :- ZT(Direct seeded) 11.11 15.09 12.06
T5 :- ZT(Direct seeded)+R 12.39 17.59 12.44
S. Em + 2.19 1.88 2.26
CD at 5% NS NS NS
Sub-Plots:- Weed control measures
W1:Oxadiargyl @ 0.1kg/ha 9.42 15.39 11.09
W2: Oxadiargyl @ 0.1kg/ha + HW at 40 DAS/DAT
11.31 18.34 13.60
W3: weedy check 17.50 20.37 15.64
S. Em + 2.17 1.57 1.81
C.D. at 5% NS NS NS
Interaction effect
S Em. + 5.42 3.20 4.60
C.D. at 5% NS NS NS
2) Total free living nitrogen fixers: - The data of free living nitrogen fixers is presented in
table no. WSM 3
a) Effect of tillage systems:-
The free living nitrogen fixers in soil didn’t influenced at 30DAS/30DAT,
60DAS/DAT and at harvesting stage of the rice crop.
b) Effect of weed control measure: -
The population of free living nitrogen fixers in soil didnt significantly influenced by
weed control measures at 30DAS/30DAT,60DAS/DAT and harvesting stage of rice crop.
c) Interaction effect:-
The interaction effects of tillage systems and weed control measures were found to
be non significant.

43 Table no WSM 4 :- To find out long term effects herbicides residues on phosphate solubilisers
under tillage systems and residue management practices during kharif 2013.
Treatment Crop:-Rice
Phosphate solubilisers CFU x 103/gm of soil
30 DAS 60 DAS/DAT At harvest
Main plots:- Tillage systems
T1 :- CT(Transplanted) 18.48 19.61 14.93
T2 :- CT(Transplanted) 18.03 21.88 17.08
T3:- CT(Direct seeded) 15.97 19.44 16.97
T4 :- ZT(Direct seeded) 14.23 14.77 11.76
T5 :- ZT(Direct seeded)+R 14.95 17.68 13.60
S. Em + 2.39 2.82 2.42
CD at 5% NS NS NS
Sub-Plots:- Weed control measures
W1:Oxadiargyl @ 0.1kg/ha 12.89 15.94 12.12
W2: Oxadiargyl @ 0.1kg/ha + HW at 40 DAS/DAT
15.71 18.38 15.20
W3: weedy check 20.39 21.71 17.28
S. Em + 2.17 2.41 2.00
C.D. at 5% NS NS NS
Interaction effect
S Em. + 4.78 4.68 4.43
C.D. at 5% NS NS NS
4) Total phosphate solubilisers: - The data of phosphate solubilisers is presented in table
noWSM.4
a) Effect of tillage systems:-
The phosphate solubilisers in soil didn’t influenced at 30DAS/30DAT,
60DAS/DAT and at harvesting stage of the rice crop.
b) Effect of weed control measure: -
The phosphate solubilisers didnt significantly influenced by weed control measures
at 30DAS/30DAT, 60 DAS/DAT and harvesting stage of rice crop.
c) Interaction effect:-
The interaction effects of tillage systems and weed control measures were found to
be non significant.

44 Table no WSM 5 :- To find out long term effects of herbicides residues on microbial biomass
carbon under tillage systems and residue management practices during kharif 2013.
Treatment Crop:-Rice
Microbial biomass carbon( µg/gm soil)
30 DAS 60 DAS/DAT At harvest
Main plots:- Tillage systems
T1 :- CT(Transplanted) 201.12 216.29 207.40
T2 :- CT(Transplanted) 203.37 217.04 204.03
T3:- CT(Direct seeded) 201.05 216.67 201.67
T4 :- ZT(Direct seeded) 196.21 210.69 197.57
T5 :- ZT(Direct seeded)+R 198.87 211.45 200.37
S. Em + 5.51 4.68 5.05
CD at 5% NS NS NS
Sub-Plots:- Weed control measures
W1:Oxadiargyl @ 0.1kg/ha 190.93 209.33 197.19
W2: Oxadiargyl @ 0.1kg/ha + HW at 40 DAS/DAT
195.18 213.83 201.58
W3: weedy check 214.25 220.13 207.86
S. Em + 1.88 3.19 4.07
C.D. at 5% 7.38 NS NS
Interaction effect
S Em. + 7.42 7.83 8.27
C.D. at 5% NS NS NS
4) Microbial biomass carbon: - The data of microbial biomass carbon is presented in table
No WSM.5
a) Effect of tillage systems:-
The microbial biomass carbon in soil didn’t influenced at 30DAS/30DAT, 60
DAS/DAT and at harvesting stage of the rice crop.
b) Effect of weed control measure: -
The microbial biomass carbon in soil significantly influenced by weed control
measures at 30DAS/30DAT.The biomass significantly found less in recommended herbicide
and integrated weed management treatment at 30DAS/DAT as compared to the weedy check
treatement.The biomass was found non-significant at 60DAS and at harvesting stage of the
crop.
c) Interaction effect:-
The interaction effects of tillage systems and weed control measures were found to
be non significant.

45 Table no WSM 6 :- To find out long term effects of herbicides residues on basal soil respiration
under term tillage systems and residue management practices during kharif 2013.
Treatment
Crop:-Rice
Basal soil respiration( µg/100gm soil)
30 DAS 60 DAS/DAT At harvest
Main plots:- Tillage
T1 :- CT(Transplanted) 199.12 212.24 204.04
T2 :- CT(Transplanted) 200.54 215.97 200.49
T3:- CT(Direct seeded) 197.79 214.92 200.26
T4 :- ZT(Direct seeded) 193.03 207.36 195.85
T5 :- ZT(Direct seeded)+R 193.63 210.19 197.21
S. Em + 5.43 4.65 5.00
CD at 5% NS NS NS
Sub-Plots:- Weed control measures
W1:Oxadiargyl @ 0.1kg/ha 190.02 206.47 194.22
W2: Oxadiargyl @ 0.1kg/ha + HW at 40 DAS/DAT
193.36 211.26 199.51
W3: weedy check 207.08 218.68 204.98
S. Em + 1.96 3.40 4.25
C.D. at 5% 7.71 NS NS
Interaction effect
S Em. + 7.29 8.17 8.25
C.D. at 5% NS NS NS
6) Basal soil respiration: - The data of basal soil respiration is presented in table no WSM .6
a) Effect of tillage systems:-
The basal soil respiration in soil didn’t influenced at 30DAS/30DAT,
60DAS/DAT and at harvesting stage of the rice crop.
b) Effect of weed control measure: -
The basal soil respiration in soil significantly influenced by weed control measures
at 30DAS/30DAT.The respiration significantly found less in recommended herbicide and
integrated weed management treatment at 30DAS/DAT as compared to the weedy check
treatement.The respiration was found non-significant at 60DAS and at harvesting stage of the
rice crop.
c) Interaction effect:-
The interaction effects of tillage systems and weed control measures were found to
be non significant.
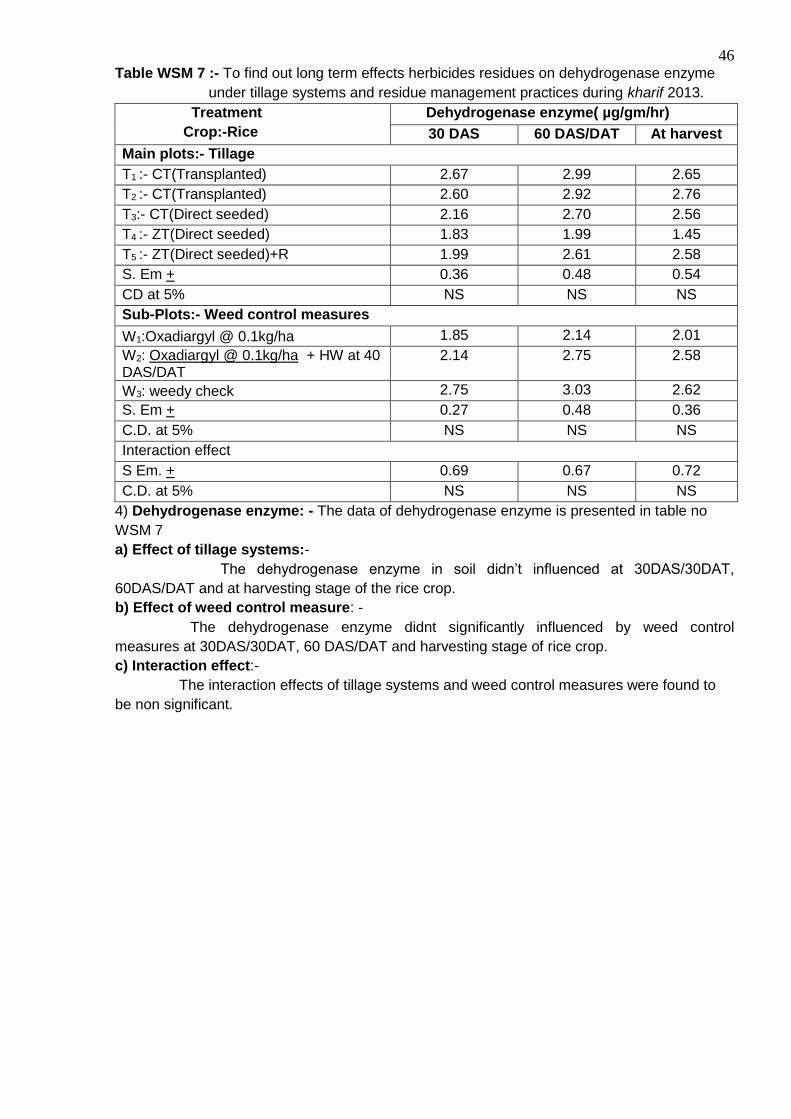
46 Table WSM 7 :- To find out long term effects herbicides residues on dehydrogenase enzyme
under tillage systems and residue management practices during kharif 2013.
Treatment
Crop:-Rice
Dehydrogenase enzyme( µg/gm/hr)
30 DAS 60 DAS/DAT At harvest
Main plots:- Tillage
T1 :- CT(Transplanted) 2.67 2.99 2.65
T2 :- CT(Transplanted) 2.60 2.92 2.76
T3:- CT(Direct seeded) 2.16 2.70 2.56
T4 :- ZT(Direct seeded) 1.83 1.99 1.45
T5 :- ZT(Direct seeded)+R 1.99 2.61 2.58
S. Em + 0.36 0.48 0.54
CD at 5% NS NS NS
Sub-Plots:- Weed control measures
W1:Oxadiargyl @ 0.1kg/ha 1.85 2.14 2.01
W2: Oxadiargyl @ 0.1kg/ha + HW at 40 DAS/DAT
2.14 2.75 2.58
W3: weedy check 2.75 3.03 2.62
S. Em + 0.27 0.48 0.36
C.D. at 5% NS NS NS
Interaction effect
S Em. + 0.69 0.67 0.72
C.D. at 5% NS NS NS
4) Dehydrogenase enzyme: - The data of dehydrogenase enzyme is presented in table no
WSM 7
a) Effect of tillage systems:-
The dehydrogenase enzyme in soil didn’t influenced at 30DAS/30DAT,
60DAS/DAT and at harvesting stage of the rice crop.
b) Effect of weed control measure: -
The dehydrogenase enzyme didnt significantly influenced by weed control
measures at 30DAS/30DAT, 60 DAS/DAT and harvesting stage of rice crop.
c) Interaction effect:-
The interaction effects of tillage systems and weed control measures were found to
be non significant.

47 Table no WSM 8 :- To find out long term effects of herbicides residues on phosphatase
enzyme under tillage systems and residue management practices during kharif 2013.
Treatment Crop:-Rice
Phosphatse enzyme ( µg/gm/hr)
30 DAS 60 DAS/DAT At harvest
Main plots:- Tillage
T1 :- CT(Transplanted) 161.75 171.92 154.83
T2 :- CT(Transplanted) 158.03 177.34 158.13
T3:- CT(Direct seeded) 151.24 171.73 155.21
T4 :- ZT(Direct seeded) 147.28 159.60 149.29
T5 :- ZT(Direct seeded)+R 148.34 165.15 152.37
S. Em + 8.00 5.42 5.42
CD at 5% NS NS NS
Sub-Plots:- Weed control measures
W1:Oxadiargyl @ 0.1kg/ha 147.51 165.29 150.75
W2: Oxadiargyl @ 0.1kg/ha + HW at 40 DAS/DAT 151.67 169.09 154.00
W3: weedy check 160.81 173.06 157.15
S. Em + 3.69 2.65 4.43
C.D. at 5% NS NS NS
Interaction effect
S Em. + 14.20 7.98 12.42
C.D. at 5% NS NS NS
4) Phosphatase enzyme: - The data of phosphatase enzyme is presented in table no WSM 8 a) Effect of tillage systems:- The phosphatase enzyme in soil didn’t influenced at 30DAS/30DAT, 60DAS/DAT and at harvesting stage of the rice crop. b) Effect of weed control measure: - The phosphatase enzyme didnt significantly influenced by weed control measures at 30DAS/30DAT, 60DAS/DAT and harvesting stage of rice crop. c) Interaction effect:-
The interaction effects of tillage systems and weed control measures were found to be non significan Summery The total bacterial population,fungi, free living nitrogen fixers and total phosphate solubilisers,microbial biomass carbon dehydrogenase enzyme and phosphatase enzyme in soil didn’t influenced by all four tillage systems at all the above three mention stages of the rice crop. The total bacterial population,microbial biomass carbon and basal soil respiration in soil were significantly found less in recommended herbicide and integrated weed management treatment at 30DAS/30DAT as compared to the weedy check treatement.The same were found non-significant at 60DAS and at harvesting stage of the crop.The total fungal population,free living nitrogen fixers, dehydrogenase enzyme and phosphatase enzyme didnt significantly influenced by weed control measures at 30DAS/30DAT,60DAS/DAT and harvesting stage of rice crop. The interaction effects of tillage systems and weed control measures were found to be non significant.
Conclusion There was no significant effect of tillage systems was found on soil microflora and their
associated parameters.The some parameters(total bacterial population,microbial biomass carbon and basal soil respiration ) significantly adversely get affected by application of herbicides residues at the initial stage (30DAS/DAT) of the rice crop. However later get improved at the further stages(60DAS/DAT and harvesting stage) of the crop.There is no significant adverse effect of herbicides residues was found on the total fungal population, free living nitrogen fixers, dehydrogenase enzyme and phosphatase enzyme at all the above mention stages of rice crop.This shows that microflora and their associated parameters did not adversely affected by the application of herbicide and integrated weed management systems.The more research is required to know long term effect of continuous application of herbicides residues ,integrated weed management practices and residue management practices on soil microflora and their associated parameters.

48
W. S. 3.7:- long term herbicide trial in different cropping systems.
Objective : To find out combined effects of herbicides and green manuaring on weed dynamics, herbicide efficacy and growth and productivity of rice-groundnut cropping sytem.
Year of commencement : Kharif, 2011
Location : Agronomy Farm, College of Agriculture, Dapoli,
Dist. Ratnagiri.
Dominant Cropping system : Rice – Groundnut
Treatment details :
A) Main plot treatments : Green manuring
M1 : Green manuring (Sesbania rostrata)
M2 : Without Green manuring
B) Sub plot treatments : Weed control measures
For Rice (Kharif) : For Groudnut (Rabi)
T1 : Fixed herbicide Pretilachlor-S 50 EC @ 0.75 kg/ha 3-
7 DAT
Pendimethalin 30EC @ 1.0 kg/ha PE
T2: Rotational herbicide sequence
Pyrazosulfuron 10 WP @ 0.25 kg/ha
8-10 DAT(I yr), Fenoxaprop 10 EC @ 80 kg/ ha25-30
DAT (IIyr), Oxadiargyl 80
WP@ 0.100 kg/ha 0-5 DAT(IIIyr)
: Oxadiargyl 80 [email protected] kg/ha 0-2 DAS (Iyr),
Butachlor 50 EC @ 1.0 kg/ha
0-3 DAS(IIyr), Alachlor 50 EC @ 1.5 kg/ha 0-3 DAS (IIIyr)
T3:
Weed free check (2HW at
20&40DAT)
: Weed free check
(2HW at 20&40DAS)
T4: Weedy check : Weedy check
Plot size : Gross :10 m X10 m (Main plot)
Net:2.30 m X10m(Sub plot)
Replications : Three
Design : Split plot
Season and crop : Kharif rice – Rabi groundnut
Variety : R-24 Konkan Tapora
Spacing : 20 × 15 cm 30 × 15 cm
Fertilizers (N:P2O5:K2O kg/ha)
: 100:50:50 25:50-00
Date of Sowing (Groundnut)
: 12-13/12/2011
Date of Harvesting 18-21/4/2012
Date of sowing (Rice) 21/06/2013 Date of Transplanting : 19/07/2013
Date of Harvesting 25/10/2013
Date of sowing of dhaincha 31/5/2013
Date of incorporation 17/7/2013
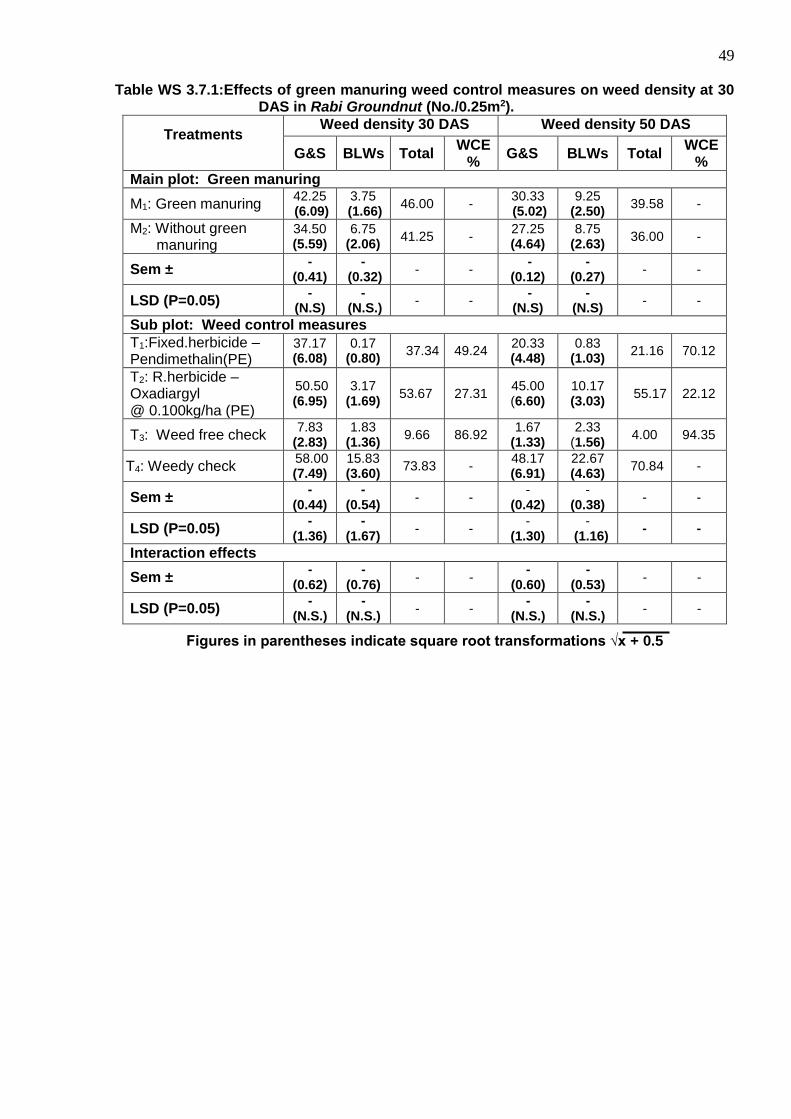
49 Table WS 3.7.1:Effects of green manuring weed control measures on weed density at 30
DAS in Rabi Groundnut (No./0.25m2).
Treatments
Weed density 30 DAS Weed density 50 DAS
G&S BLWs Total WCE
% G&S BLWs Total
WCE %
Main plot: Green manuring
M1: Green manuring 42.25 (6.09)
3.75 (1.66)
46.00 - 30.33 (5.02)
9.25 (2.50)
39.58 -
M2: Without green manuring
34.50 (5.59)
6.75 (2.06)
41.25 - 27.25 (4.64)
8.75 (2.63)
36.00 -
Sem ± -
(0.41) -
(0.32) - -
- (0.12)
- (0.27)
- -
LSD (P=0.05) -
(N.S) -
(N.S.) - -
- (N.S)
- (N.S)
- -
Sub plot: Weed control measures
T1:Fixed.herbicide – Pendimethalin(PE)
37.17 (6.08)
0.17 (0.80)
37.34 49.24 20.33 (4.48)
0.83 (1.03)
21.16 70.12
T2: R.herbicide – Oxadiargyl @ 0.100kg/ha (PE)
50.50 (6.95)
3.17 (1.69)
53.67 27.31 45.00 (6.60)
10.17 (3.03)
55.17 22.12
T3: Weed free check 7.83
(2.83) 1.83
(1.36) 9.66 86.92
1.67 (1.33)
2.33 (1.56)
4.00 94.35
T4: Weedy check 58.00 (7.49)
15.83 (3.60)
73.83 - 48.17 (6.91)
22.67 (4.63)
70.84 -
Sem ± -
(0.44) -
(0.54) - -
- (0.42)
- (0.38)
- -
LSD (P=0.05) -
(1.36) -
(1.67) - -
- (1.30)
- (1.16)
- -
Interaction effects
Sem ± -
(0.62) -
(0.76) - -
- (0.60)
- (0.53)
- -
LSD (P=0.05) -
(N.S.) -
(N.S.) - -
- (N.S.)
- (N.S.)
- -
Figures in parentheses indicate square root transformations √x + 0.5

50 Table WS 3.7.2 : Effects of green manuring & weed control measures on weed growth in
Rabi Groundnut (g/0.25m2).
Treatments
Weed growth 30 DAS Weed growth 50 DAS
G&S BLWs Total WCE
% G&S BLWs Total
WCE %
Main plot: Green manuring
M1: Green manuring
2.37 (1.61)
0.17 (0.81)
2.54 - 4.97
(2.14) 3.73
(1.86) 8.70 -
M2: Without green manuring
2.03 (1.54)
0.81 (1.01)
2.84 - 4.29
(1.91) 6.32
(2.22) 10.61 -
Sem ± -
(0.08) -
(0.05) - -
- (0.06)
- (0.21)
- -
LSD (P=0.05) (N.S.) (N.S.) - - (N.S.) (N.S.) - -
Sub plot: Weed control measures
T1:Fixed.herbicide – Pendimethalin(PE)
2.32 (1.66)
0.02 (0.72)
2.34 54.38 3.74
(2.03) 0.94
(1.04) 4.68 78.60
T2: R.herbicide – Oxadiargyl @ 0.100kg/ha (PE)
2.58 (1.73)
0.22 (0.84)
2.80 45.42 5.82
(2.31) 5.62
(2.41) 11.44 47.69
T3: Weed free check
0.39 (0.83)
0.10 (0.77)
0.49 90.45 0.09
(0.77) 0.53
(1.01) 0.62 97.13
T4: Weedy check 3.51
(1.99) 1.62
(1.31) 5.13 -
8.86 (3.01)
13.01 (3.71)
21.87 -
Sem ± -
(0.10) -
(0.15) - -
- (0.14)
- (0.32)
- -
LSD (P=0.05) -
(0.31) -
(N.S.) - -
- (0.43)
- (0.97)
- -
Interaction effect
Sem ± -
(0.14) -
(0.21) - -
- (0.20)
- (0.45)
- -
LSD (P=0.05) -
(N.S.) -
(N.S.) - -
- (N.S.)
- (N.S.)
- -
Figures in parentheses indicate square root transformations √x + 0.5

51 Table WS 3.7.3: Effects of green manuring & weed control measures on weed density &
weed growth at harvest in Rabi Groundnut (No.0.25m2).
Treatments
Weed density at harvest Weed growth at harvest
G&S BLWs Total WCE % G&S BLWs Total WCE %
Main plot: Green manuring
M1: Green manuring 4.33
(1.79) 19.25 (4.19)
23.55 - 0.43
(0.91) 10.86 (2.86)
11.29 -
M2: Without green manuring
0.83 (1.02)
22.75 (4.50)
23.58 - 0.18
(0.80) 6.03
(2.35) 6.21 -
Sem ± -
(0.19) -
(0.08) - -
- (0.08)
- (0.22)
- -
LSD (P=0.05) -
(N.S.) -
(N.S.) - -
- (N.S.)
- (N.S)
- -
Sub plot: Weed control measures
T1:Fixed.herbicide – Pendimethalin(PE)
3.50 (1.79)
18.67 (4.19)
22.17 37.85 0.58
(1.01) 4.81
(2.12) 5.39 66.52
T2: R.herbicide – Oxadiargyl @ 0.100kg/ha (PE)
1.17 (1.14)
29.33 (5.37)
30.50 14.49 0.05
(0.74) 12.96 (3.44)
13.01 19.19
T3: Weed free check 0.00
(0.71) 6.00
(2.43) 6.00 83.18
0.00 (0.71)
0.48 (0.98)
0.48 97.02
T4: Weedy check 5.67
(1.99) 30.00 (5.39)
35.67 0.58
(0.96) 15.52 (3.89)
16.10 -
Sem ± -
(0.28) -
(0.47) - -
- (0.07)
- (0.31)
- -
LSD (P=0.05) -
(0.85) -
(1.44) - -
- (0.22)
- (0.97)
- -
Interaction effects:
Sem ± -
(0.39) -
(0.66) - -
- (0.10)
- (0.44)
- -
LSD (P=0.05) -
(N.S) -
(N.S.) - -
- (N.S.)
- (N.S.)
- -
Figures in parentheses indicate square root transformations √x + 0.5

52
Table WS 3.7.4: Effects of green manuring & weed control measures on yield attributes & yield of Groundnut.
Treatments Height (cm)
Number of
Branches /plant
Dry pod yield q/ha
Haulm yield q/ha
WCI%
Main plot: Green manuring:
M1 : Green manuring 28.93 10.18 31.87 49.22 -
M2 : Without green manuring 28.52 9.78 31.19 49.70 -
Sem ± 0.58 0.25 1.39 2.64 -
LSD (P=0.05) N.S N.S N.S N.S -
Sub plot: Weed control measures
T1 : F.H:Pendimethalin 27.90 11.90 33.04 54.02 8.58
T2 : R.H:Oxadiargyl 26.22 9.00 32.27 50.33 10.71
T3: Weed free check 29.28 9.80 36.14 53.36 -
T4 : Weedy check 31.50 9.23 24.66 40.12 31.76
Sem ± 1.60 0.83 1.56 1.41 -
LSD (P=0.05) N.S N.S 4.82 4.34 -
IIInteraction effects:
Sem ± 2.26 1.17 2.21 1.99 -
LSD (P=0.05) N.S N.S N.S N.S -
Rabi G’nut
Results : Composition of weed flora.
Base year Rabi G’nut,2011-12 Rabi G’nut,2012-13 Grasses and Sedges BLWs Grasses and Sedges BLWs
Isachne globossa Ludwigia octovalvis Oryza sativa Ludwigia octovalvis
Leptochloa chinensis Ageratum conyzoides Leptochloa.chinensis Ageratum conyzoides
Cyperus iria Aiternenthera sessilis Cyperus rotundus Aiternenthera sessilis
Eriocaulon.hexangularis Biumea lacera Eiusine.indica Cleome viscosa
Eiusine.indica Portulaca oleracea
Cardiospermum.halicacabum,
Convolvusarvensis
Celotiaargentea.
Chinopodium album
I) Effects on weed density: a) Effects of green manuring:
In rabi G’nut density of both groups of weeds did not differ significantly due to green
manuring & without green manuring.
b) Effect of weed control measures: (WCMs)
Weed density of rabi G’nut the weed density of monocots at 30 and 50 DAS was
significantly reduced in weed free check over other measures WCMs. Similarly, rotational and
fixed herbicide schedule remained at par with weedy check. At harvest, the rotational herbicide
schedule reduced weed density over weedy check. But use of fix herbicide schedule did not
differ significantly as compared to weedy check. The weed free check (HW at 20 & 40 DAS)
significantly reduced weed density of monocots over all other treatments except at harvest,
which was at par with rotational herbicide schedule.
Weed density of BLWs was significantly reduced due to use of fixed herbicide schedule
(Pretilachlor – Pendimethalin) over weedy check. However, it was at par with schedules of fixed

53 herbicide and rotational herbicide at 30 & 50 DAS. At harvest weed free check treatment
significantly reduced weed density of BLWs, over other treatments. However, weed density of
BLWs due to fixed herbicide schedule and weed free check at 50 DAS and rotational herbicide
schedule & weedy check were found to be statistically identical.
c) Interaction effects: Interaction effects between green manuring and weed control measures on density
weeds were found to be non- significant.
II) Effects on weed growth:- a) Effects of green manuring:-
The weed growth of monocots & BLWs in Kharif rice and Rabi G’nut was not
significantly influenced at 30, 50 DAT & at harvest due to green manuaring as compared to
weed control treatment of no green manuring and green manuring with S.rostrata at any stage
of observation.
b) Effects of weed control measures (WCMs):-
Weed growth of monocots & BLWs in Kharif rice at all stages of observation was not
significantly influenced due to different WCMs.
In case of rabi G’nut, weed free check (2 HWs) significantly reduced growth of
monocots over other treatments at 30 & 50 DAS. At harvest it was identical with rotational
herbicide schedule & weedy check. However, weed growth of monocots due to fixed &
rotational herbicide schedule was significantly reduced over weedy check and remained at par
with rotational herbicide schedule at 30 DAS at harvest. The growth of monocots in weed free
check (2 HWs) was significantly reduced over weedy check, fixed herbicide schedule and
rotational herbicide schedule at all the stages observation except at harvest where weed free
check remained at par with rotational herbicide schedule.
At 50 DAS, significantly lowest growth of monocots was recorded due to fixed &
rotational herbicide schedule over weedy check.
Growth of BLWs in Rabi G.nut due to weed free check (2HWs) treatment was
significantly reduced over rotational herbicide schedule and weedy check which remained at
par with fixed herbicide schedule. Weed free check treatment recorded least growth of BLWs
over all the treatments.
c) Interaction effects:- The interaction effects between green manuring and weed control measures were found
to be non significant.
III) Effects on yield attributes and yield:
a) Effects of green manuring:-
Green manuring to Kharif rice did not significantly influence yield attributes and dry pod
and haulm yield of groundnut. However green manuring to kharif rice produced highest dry pod
yield of groundnut.
b) Weed control measures:-
Various weed control measures did not significantly influence the yield attributes of
groundnut. However, weed free check produced significantly higher pod yield of groundnut which remained at par with fixed herbicide schedule.. The, haulm yield of groundnut
significantly higher in all treatments over weedy check. As a result of weed free check is best
treatment compared with fixed herbicide schedule recorded least weed index (8.58 %) followed
by rotational herbicide (10.71 %)

54
c) Interaction effects:
The interaction effects between green manuring and weed control measures were found
to be non significant.
Summary:- Green manuring to kharif rice did not influenced in weed density and growth of monocots and BLWs. Various weed control measures significantly influenced weed density and growth at 30, 50 DAS and at harvest.The fixed and rotational herbicide reduced weed density and weed growth resulted in increase dry pod yield of G’nut over weedy check. As compared to best treatment of weed free check the per cent reduction in dry pod yield was least in fixed herbicide (8.58 %) followed by rotational herbicide (10.71%).
Kharif Rice:2013 Table WS 3.7.5: Effects of green manuring & weed control measures on weed density at 30 DAS in Kharif rice 2013
Treatments
Weed Density 30 DAT (No/0.25m2).
Weed Density 50 DAT (No/0.25m2).
G&S BLWs Total WCE% G&S BLWs Total WCE%
Main plot: Green manuring
M1: Green manuring
5.92 (2.35)
0.25 (0.81)
6.17 - 6.67
(2.61) 1.83
(1.39) 8.50 -
M2: Without green manuring
5.50 (2.25)
0.25 (0.83)
5.75 - 11.00 (3.25)
2.08 (1.44)
13.08 -
Sem ± -
(0.28) -
(0.08) - -
- (0.18)
- (0.13)
- -
LSD (P=0.05) -
(N.S) -
(N.S.) - -
- (1.08)
- (N.S)
- -
Sub Plot: Weed control measures
T1:F.herbicide –Pretilachlor
4.33 (2.14)
0.00 (0.71)
4.33 27.6 9.00
(2.88) 0.17
(0.80) 9.17 31.20
T2: R.herbicide - Fenoxaprop
6.67 (2.53)
0.00 (0.71)
6.67 10.00 9.83
(3.11) 2.50
(1.63) 12.33 7.50
T3: Weed free check
5.17 (2.33)
1.00 (1.13)
6.17 7.50 6.17
(2.53) 2.17
(1.52) 8.34 37.43
T4: Weedy check
6.67 (2.21)
0.00 (0.71)
6.67 - 10.33 (3.20)
3.00 (1.71)
13.33 -
Sem ± -
(0.41) -
(0.12) - -
- (0.22)
- (0.28)
- -
LSD (P=0.05) -
(N.S.) -
(N.S.) - -
- (N.S.)
(N.S.) - -
Interaction effect
Sem ± -
(0.58) -
(0.16) - -
- (0.32)
- (0.39)
- -
LSD (P=0.05) -
(N.S.) -
(N.S.) - -
- (N.S.)
- (N.S.)
- -
Figures in parentheses indicate square root transformations √x + 0.5

55 Table WS 3.7.6: : Effects of green manuring & weed control measures on weed growth in
Kharif rice 2013
Treatments
Weed Growth 30 DAT
(g/0.25m2).
Weed Growth 50 DAT
(g/0.25m2).
G&S BLWs Total WCE% G&S BLWs Total WCE%
Main plot: Green manuring
M1: Green Manuring
0.84
(1.10)
0.01
(0.71) 0.85
2.22
(1.31)
0.12
(0.79) 2.34 -
M2: Without green manuring
2.14
(1.56)
0.01
(0.71) 2.15
4.14
(1.67)
0.14
(0.79) 4.28 -
Sem ± -
(0.05)
-
(0.01) -
-
(0.16)
-
(0.03) - -
LSD (P=0.05) -
(0.29)
-
(N.S.) -
-
(N.S.)
-
(N.S.) - -
Sub Plot: Weed control measures
T1:F.herbicide –Pretilachlor
0.93
(1.17)
0.00
(0.72) 0.93 46.9
2.61
(1.83)
0.00
(0.72) 2.61 66.84
T2: R.herbicide - Fenoxaprop
1.72
(1.38)
0.00
(0.72) 1.72 - 3.61
1.33
(1.51)
0.23
(0.85) 1.56 80.18
T3: Weed free check
1.65
(1.39)
0.04
(0.73) 1.69 - 1.81
1.09
(1.18)
0.12
(0.79) 1.21 84.62
T4: Weedy check 1.66
(1.38)
0.00
(0.71) 1.66 -
7.70
(2.54)
0.17
(0.81) 7.87 -
Sem ± -
(0.19)
-
(0.01) - -
-
(0.37)
-
(0.04) - -
LSD (P=0.05) -
(N.S)
-
(N.S.) - -
-
(N.S.)
-
(N.S.) - -
Interaction effects:
Sem ± -
(0.27)
-
(0.01) - -
-
(0.52)
-
(0.06) - -
LSD (P=0.05) -
(N.S.)
-
(N.S.) - -
-
(N.S.)
-
(N.S.) - -
Figures in parentheses indicate square root transformations √x + 0.5

56 Table W S 3.7.7: Effects of green manuring & weed control measures on weed Density & weed
growth at harvest in Kharif rice 2013.
Treatments
Weed density at harvest
(No/0.25m2).
Weed growth at harvest
(g /0.25m2).
G&S BLWs Total WCE% G&S BLWs Total WCE%
Main plot: Green manuring
M1: Green manuring 1.67
(1.28)
25.08
(4.58) 26.75 -
0.07
(0.75)
1.84
(1.49) 1.91 -
M2: Without green manuring 6.08
(2.16)
33.08
(5.55) 39.16 -
3.71
(1.50)
1.96
(1.54) 5.67 -
Sem ± -
(0.04)
-
(0.23) - -
-
(0.37)
-
(0.07) - -
LSD (P=0.05) -
(0.27)
-
(N.S.) - -
-
(N.S.)
-
(N.S) - -
Sub Plot: Weed control measures
T1:F.herbicide –Pretilachlor 2.00
(1.41)
26.67
(4.96) 28.67 17.69
1.80
(1.19)
1.65
(1.43) 3.45 49.71
T2: R.herbicide - Fenoxaprop 1.50
(1.28)
32.00
(5.38) 33.50 3.82
0.11
(0.77)
2.30
(1.65) 2.41 64.87
T3: Weed free check 5.00
(1.71)
29.83
(5.04) 34.83 10.00
0.50
(0.91)
1.94
(1.56) 2.44 64.43
T4: Weedy check 7.00
(2.47)
27.83
(4.88) 34.83 -
5.16
(1.64)
1.70
(1.41) 6.86 -
Sem ± -
(0.50)
-
(0.91) - -
-
(0.40)
-
(0.19) - -
LSD (P=0.05) -
(N.S)
-
(N.S.) - -
-
(N.S)
-
(N.S.) - -
Interaction effects:
Sem ± -
(0.70)
-
(1.29) - -
-
(0.57)
-
(0.27) - -
LSD (P=0.05) -
(N.S.)
-
(N.S.) - -
-
(N.S.)
-
(N.S.) - -
Figures in parentheses indicate square root transformations √x + 0.5

57 Table W S 3.7.8 Effects of green manuring & weed control measures on yield attributes & yield of Kharif rice.
Treatments
Height of plant
Number of tillers/
hill
Length of Panicle
(cm)
Number of
Panicle/ hill
hill
Yield (q/) WI % Grain
Straw
Main plot: Green manuring
M1 Green manuring 82.86 8.80 23.85 7.57 30.71 36.18 - M2 Without green manuring 79.53 7.30 23.91 6.27 29.70 30.40 -
Sem ± 0.91 0.32 0.08 0.42 0.19 1.39 -
LSD (P=0.05) N.S N.S N.S N.S N.S N.S - Sub Plot: Weed control measures-
T1 Fixed herbicide – Pretilachlor
79.47 7.63 23.27 6.63 28.17 33.25 11.83
T2 Rotational herbicide - Fenoxaprop
81.49 8.33 24.24 7.17 31.80 33.67 0.47
T3 Weed free check 81.63 7.77 23.93 6.63 31.95 32.66 - T4 Weedy check 82.18 8.47 24.07 7.23 28.89 33.60 9.58
Sem ± 1.58 0.39 0.46 0.32 1.51 3.75 -
LSD (P=0.05) N.S N.S N.S N.S N.S N.S - Interaction effects:
Sem ± 2.23 0.55 0.66 0.45 2.14 5.31 -
LSD (P=0.05) N.S N.S N.S N.S N.S N.S -
Figures in parentheses indicate square root transformations √x + 0.5 Results and Discussion : Composition of weed flora :
Base year Kharif,2011 Kharif,2012 Kharif,2013 Grasses and Sedges BLWs Grasses and Sedges BLWs Grasses and Sedges BLWs Isachnae globossa L. octovalvis I globossa L. octovalvis I globossa L. octovalvis
Leptochloa.chinensis E.indica L.chinensis A.conyzoides C. Iria A.sessilis Cyperus Iria A.conyzoides, C. Iria A.sessilis E.Colona P minima
Erioculon.hexangularis A.sessilis E. Indica B. lacera, E. hexangularis C. argentea B. lacera I rugosum P minima A.conyzoides,
E hexangularis
I) Effects on weed density:
a) Effects of green manuring: As compared to no green manuring did not influenced significantly the density of monocots at 30 DATand at harvest. However, at 50 DAT green manuring significantly reduced the density of monocots than without green manurings. The weed density of BLWs did not differ significantly. b) Effect of weed control measures:
The weed density of monocots & BLWs at 30, 50 DAs & at harvest did not differ significantly.
c) Interaction effects:
The Interaction effect between green manuring & weed control measures was found to be non
significanlt.
II) Effects on weed growth:-
a) Effects of green manuring:-
The green manuring did not influenced significantly the weed growth at 30, 50 DAT & at harvest except monocot at 30 DAT. However, weed growth of monocots at 30 DAS reduced significantly in green manuring than without green manuring. b) Effect of weed control measures:
Various weed control measures did not influence growth of grasses & sedges and BLWs at 30,
50 DAT & at harvest. The grain yield of R.H. & weed free check treatment was higher than fixed
herbicide and weedy check.
c) Interaction effects:

58 The interaction effects between green manuring and weed control measures on weed growth
were found to be non significant.
III) Effects on yield attributes and yield:
a) Effects of green manuring:-
The yield attributes viz No of tillers/hill length of panicle (cm), No. of panicles & yield of rice did
not influence significantly. Green manuring recorded higher yield attribute & yield of rice than without
green manauring.
b) Effects of weed control measures:
Various weed control measures did not influence growth of grasses & sedges and BLWs at 30,
50 DAT & at harvest. The grain yield of R. H & weed free check treatment was higher than fixed
herbicide and weed check.
c) Interaction effects:
The interaction effects between green manuring and weed control measures on weed growth
were found to be non significant.
Summary:-
Green manuring with dhaincha did not influence weed density and weed growth except
monocot weed at 50 DAS under study. The weed control measures not influcnce weed density and
growth at 30, 50 DAS and at harvest. Green manuring not influence yield attributes rice.
However, grain and straw yield of rice higherwith green maniuring than without green manuring
treatment. The grain yield of rice produced significantly highest in rotational herbicide schedule and
weed free check treatments.
\\:Microbiolog
Project :- Long term herbicide trial in different cropping systems
Objective :- To find out combined effects of green manuring and
herbicides on soil microflora and their associated parameters
Year of commencement
Location
:-
:-
Agronomy work:- Kharif, 2011
Microbiology work:-Kharif,2011
Agronomy Farm, Collage of Agriculture ,Dapoli
Methodology :-
A field experiment was conducted on long term herbicide trial in kharif Rice-rabi
Groundnt cropping system. The soil samples were collected from rhizo-sphere soil at 3 stages of
plant growth, 30 DAT, 50 DAT and at harvesting stage of rice crop during kharif season and at
30DAS, 50DAS and at harvesting stage of the groundnut crop during rabi season.(The soil adhered to
the plant roots). It was used for all the microbial analysis.
The soil sample was analyzed for following observation
a) Total bacterial population
b) Total Fungal population
c) Free living nitrogen fixers.
d) Phosphate solubilisers.
e) Microbial biomass carbon.
f) Basal soil respiration
g) Dehydrogenase enzyme.
h)
i)
Phosphatase enzyme (In case of rice crop)
Dry wt of nodule (50DAT of groundnut crop)
j) Number of nodule/Plant (50DAT of groundnut crop).
Rabi 2012-2013

59 Table no WSM 1 :- Combined effects of green manuring and weed control measures on soil
bacterial population in rice-groundnut cropping system during rabi (2012)
Treatment Crop:-Groundnut
Bacteria CFU x 106/gm of soil
30 DAS 50 DAS At harvest
Main plots:- Green Manuring
M1 :- Green manuring 45.85 48.21 44.71
M2 :-Without green manuring 38.91 41.93 38.86
S. Em + 0.18 0.20 0.82
CD at 5% 1.10 1.22 4.98
Sub-Plots:- Weed control measures
T1:- Fix herbicide (Pendimethalin) 39.26 41.74 38.40
T2:- Rotational herbicide (Butachlor) 41.27 43.91 39.76
T3:- Weed free 46.33 49.51 45.95
T4:- Weedy Check 42.68 45.25 43.03
S. Em + 1.15 2.62 1.86
C.D. at 5% 3.56 NS NS
Interaction effect
S Em. + 1.63 3.71 2.63
C.D. at 5% NS NS NS
1) Bacteria: - The data of bacterial population is presented in table no.WSM 1 a) Effect of green manuring:- The population of bacteria in soil was significantly influenced by green manuring as compared to without green manure at 30DAT, 50DAT and at harvesting stage of the groundnut crop. They recorded significantly higher bacterial population in green manuring treatment as compared to the without green manuring treatment. b) Effect of weed control measure: -
The total bacterial population in soil were significantly influenced by weed control measures at 30DAT. They were found significantly less in fixed herbicide, rotational herbicide as compared to the weed free treatment at 30DAT.The weed control measures was found to be non-significant at 50DAT and harvesting stage of the groundnut crop. c) Interaction effect:-
The interaction effects of green manuring and weed control measures were found to be non significant. Table no WSM 2:- Combined effects of green manuring and weed control measures on soil fungi in rice-
groundnut cropping system during rabi (2012).
Treatment Crop:-Groundnut
Fungi CFU x 104/gm of soil
30 DAS 50 DAS At harvest
Main plots:- Green Manuring
M1 :- Green manuring 27.93 30.35 27.65
M2 :-Without green manuring 24.47 26.72 21.17
S. Em + 0.33 0.29 0.59
CD at 5% 2.03 1.78 3.57
Sub-Plots:- Weed control measures
T1:- Fix herbicide (Pendimethalin ) 24.52 26.52 23.26
T2:- Rotational herbicide (Butachlor) 26.08 28.42 23.71
T3:- Weed free 27.62 30.12 26.86
T4:- Weedy Check 26.59 29.09 23.83
S. Em + 1.21 1.45 1.25
C.D. at 5% NS NS NS
Interaction effect
S Em. + 1.71 2.06 1.77
C.D. at 5% NS NS NS
2) Fungi: - The data of total soil fungal population is presented in table no WSM 2

60 a) Effect of green manuring: -
The total fungal population in soil was significantly influenced by green manuring
treatment as compared to without green manuring treatment at 30 DAT and at 50 DAT and at
harvesting stage of groundnut crop. They recorded significantly higher fungal population in green
manuring treatment as compared to the without green manuring treatment.
b) Effect of weed measure: -
The population of total fungi was not significantly influenced by weed control measure
at 30 DAT, 50DAT and at harvesting stage of groundnut crop.
c) Interaction effect:-
The interaction effects of green manuring and weed control measures were found to
be non significant.
Table no WSM 3.3:- Combined effects of green manuring and weed control measures on free
living nitrogen fixers in rice-groundnut cropping system during rabi (2012).
Treatment Crop:-Groundnut
Free living nitrogen fixers CFU x 103/gm of soil
30 DAS 50 DAS AT harvest
Main plots:- Green Manuring
M1 :- Green manuring 27.88 29.17 27.53
M2 :-Without green manuring 25.33 26.33 22.70
S. Em + 0.20 0.30 0.67
CD at 5% 1.23 1.80 4.07
Sub-Plots:- Weed control measures
T1:- Fix herbicide (Pendimethalin ) 24.53 26.33 22.26
T2:- Rotational herbicide (Butachlor) 26.10 26.97 23.84
T3:- Weed free 29.44 30.38 28.33
T4:- Weedy Check 26.36 27.11 26.03
S. Em + 0.95 1.28 1.48
C.D. at 5% 2.94 NS NS
Interaction effect
S Em. + 1.35 1.81 2.09
C.D. at 5% NS NS NS
3) Free living Nitrogen fixers: -The data of population of Nitrogen fixers is presented in table
No WSM 3
a) Effect of Green manuring: -
The free living nitrogen fixers were significantly influenced at 30DAT,
50DAT, and at harvesting stage by green manuring treatment as compared to the without green
manuring treatment.They recorded significantly higher population in green manuring treatment as
compared to the without green manuring treatment.
b) Effect of weed control measures: -
The free living nitrogen fixers in soil were significantly influenced by weed
control measures at 30DAT. They were found significantly less in fixed herbicide, rotational herbicide
as compared to the weed free treatment at 30DAT. The weed control measures was found to be non-
significant at 50DAT and harvesting stage of the groundnut crop.
c) Interaction effect:-
The interaction effects of green manuring and weed control measures were found to
be non significant.

61 Table no WSM 4 Combined effects of green manuring and weed control measures on
phosphate solubilisers in rice-groundnut cropping system during rabi (2012).
Treatment Crop:-Groundnut
Phosphate solubilisers CFU x 103/gm of soil.
30 DAS 50 DAS At harvest
Main plots:- Green Manuring
M1 :- Green manuring 28.78 29.79 27.65
M2 :-Without green manuring 23.44 26.06 21.01
S. Em + 0.53 0.53 1.07
CD at 5% 3.20 3.23 6.54
Sub-Plots:- Weed control measures
T1:- Fix herbicide (Pendimethalin ) 24.54 25.78 21.86
T2:- Rotational herbicide (Butachlor) 24.91 27.49 22.62
T3:- Weed free 28.86 30.89 27.91
T4:- Weedy Check 26.12 27.54 24.93
S. Em + 0.88 1.80 1.77
C.D. at 5% 2.72 NS NS
Interaction effect
S Em. + 1.25 2.55 2.51
C.D. at 5% NS NS NS
4) Phosphate solubilisers: - The data of P-solubilisers is presented in table no WSM 4
a) Effect of Green manuring: -
The phosphate solubilisers in soil were significantly influenced at 30 DAT, 50DAT
and at harvest stage by green manuring treatment as compared to the without green manuring
treatment.They recorded significantly higher population in green manuring treatment as compared to
the without green manuring trratment.
b) Effect of weed control measures: -
The phosphate solubilsers in soil were significantly influenced by weed
control measures at 30DAT. They were found significantly less in fixed herbicide, rotational herbicide
as compared to the weed free treatment at 30DAT. The weed control measures was found to be non-
significant at 50DAT and harvesting stage of the groundnut crop.
c) Interaction effect: -
The interaction effects of green manuring and weed control measures were found to be non
significant.
Table no WSM 5:- Combined effects of green manuring and weed control measure on
microbial biomass carbon in rice – groundnut cropping system during rabi 2012
Treatment Crop:-Groundnut
Microbial biomass carbon ( µg/gm soil)
30 DAS 50 DAS At harvest
Main plots:- Green Manuring
M1 :- Green manuring 248.16 277.40 236.82
M2 :-Without green manuring 226.53 254.01 223.00
S. Em + 2.16 3.75 1.71
CD at 5% 13.14 22.84 10.41
Sub-Plots:- Weed control measures
T1:- Fix herbicide (Pendimethalin ) 226.51 259.18 224.45
T2:- Rotational herbicide (Butachlor) 230.19 264.58 227.90
T3:- Weed free 254.58 270.94 237.27
T4:- Weedy Check 238.11 268.12 230.03
S. Em + 4.96 4.34 2.96
C.D. at 5% 15.28 NS NS
Interaction effect
S Em. + 7.02 6.13 4.18
C.D. at 5% NS NS NS

62
5) Microbial biomass carbon:-The data of microbial biomass carbon is presented in table no WSM 5.
a) Effect of Green manuring: -
The microbial biomass carbon is significantly influenced at 30DAT, 50DAT and
harvesting stage by green manuring treatment as compared to the without green manuring
treatment.The significantly higher microbial biomass in green manuring treatment was found as
compared to the without green manuring treatment.
b) Effect of weed control measures: -
The microbial biomass carbon in soil were significantly influenced by weed control
measures at 30DAT. They were found significantly less in fixed herbicide, rotational herbicide as
compared to the weed free treatment at 30DAT. The weed control measures was found to be non-
significant at 50DAT and harvesting stage of the groundnut crop.
c) Interaction effect:-
The interaction effects of green manuring and weed control measures were found to be non
significant.
Table no WSM 6 :- Combined effects of green manuring and weed control measure on basal
soil respiration in rice – groundnut cropping system during rabi 2012 .
Treatment Crop:-Groundnut
Basal soil respiration ( µg CO2/100 gm soil)
30 DAS 50 DAS At harvest
Main plots:- Green Manuring
M1 :- Green manuring 250.63 278.67 237.46
M2 :-Without green manuring 218.71 231.23 216.88
S. Em + 2.60 4.88 1.48
CD at 5% 15.80 29.72 9.00
Sub-Plots:- Weed control measures
T1:- Fix herbicide (Pendimethalin ) 226.60 248.55 222.39
T2:- Rotational herbicide (Butachlor) 230.23 251.76 223.68
T3:- Weed free 247.03 262.35 235.30
T4:- Weedy Check 234.82 257.15 227.33
S. Em + 3.86 4.97 3.24
C.D. at 5% 11.89 NS NS
Interaction effect
S Em. + 5.46 7.03 4.58
C.D. at 5% NS NS NS
6) Basal soil respiration:-The data of basal soil respiration is presented in table no WSM 6 a) Effect of Green manuring: -
The basal Soil respiration was significantly influenced by green manuring as compared to
without green manuring treatment at at 30DAT, 50DAT and at harvesting stage of the groundnut
crop.The basal soil respiration was significantly found higher in green manuring treatment as compared
to the without green manuring treatment at all above mention stages of crop.
b) Effect of weed control measures:-
The basal soil respiration in soil were significantly influenced by weed control
measures at 30DAT. They were found significantly less in fixed herbicide, rotational herbicide as
compared to the weed free treatment at 30DAT. The weed control measures was found to be non-
significant at 50DAT and harvesting stage of the groundnut crop.
c) Interaction effect:-
The interaction effects of green manuring and weed control measures were found to be non
significant.

63 Table no WSM 7:- Combined effects of green manuring and weed control measure on
Dehydrogenase enzyme in rice – groundnut cropping system during Rabi 2012
Treatment Crop:-Rice
Dehydrogenase enzyme( µg/gm/hr)
30 DAT 50 DAT At harvest
Main plots:- Green Manuring
M1 :- Green manuring 9.95 10.14 9.38
M2 :-Without green manuring 8.03 8.02 7.57
S. Em + 0.29 0.34 0.26
CD at 5% 1.79 2.08 1.61
Sub-Plots:- Weed control measures
T1:- Fix herbicide (Pendimethalin) 8.15 8.47 7.70
T2:- Rotational herbicide (Butachlor) 8.73 8.89 8.24
T3:- Weed free 9.96 9.83 9.21
T4:- Weedy Check 9.13 9.13 8.75
S. Em + 0.62 0.49 0.74
C.D. at 5% NS NS NS
Interaction effect
S Em. + 0.87 0.69 1.05
C.D. at 5% NS NS NS
15) Dehydrogenase enzyme: The dehydrogenase enzyme activity in soil is presented in
table WSM 4.5.
a) Effect of Green manuring: -
The dehydrogenase enzyme activity in soil was significantly influenced by green
manuring treatment as compared to the without green manuring treatment.The enzyme activity was
significantly higher in green manuring treatment as compared to the without green manuring treatment.
b) Effect of weed control measures:-
The dehydrogenase enzyme in soil was not significantly influenced by weed control measure.
c) Interaction effect:-
The interaction effect green manuring treatment and weed control measures was found to be
non-significant.
Table no WSM 7 :- Combined effects of green manuring and weed control measure on dry wt
of nodule in rice – groundnut cropping system during rabi 2012 .
Treatment Crop:-Groundnut
Dry wt of nodule ( gm/plant ) at 50 DAT
Main plots:- Green Manuring
M1 :- Green manuring 0.07
M2 :-Without green manuring 0.06
S. Em + 0.01
CD at 5% NS
Sub-Plots:- Weed control measures
T1:- Fix herbicide (Pendimethalin ) 0.06
T2:- Rotational herbicide (Butachlor) 0.07
T3:- Weed free 0.08
T4:- Weedy Check 0.07
S. Em + 0.01
C.D. at 5% NS
Interaction effect
S Em. + 0.01
C.D. at 5% NS
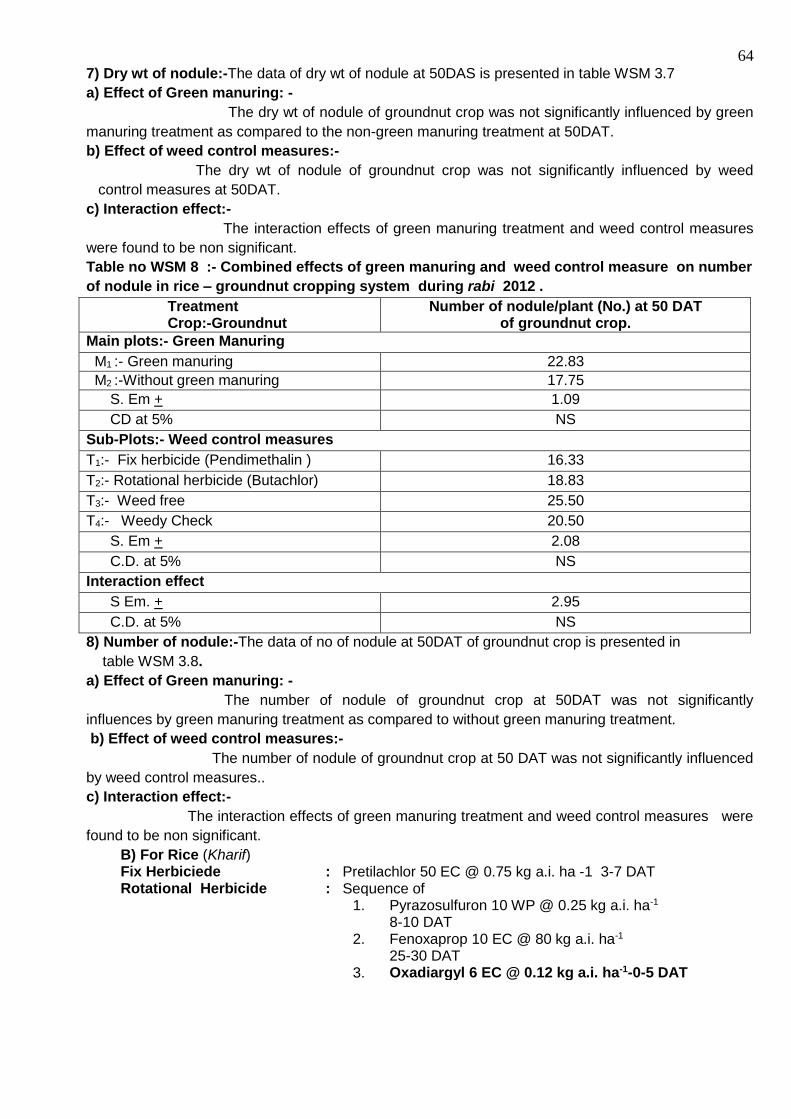
64 7) Dry wt of nodule:-The data of dry wt of nodule at 50DAS is presented in table WSM 3.7
a) Effect of Green manuring: -
The dry wt of nodule of groundnut crop was not significantly influenced by green
manuring treatment as compared to the non-green manuring treatment at 50DAT.
b) Effect of weed control measures:-
The dry wt of nodule of groundnut crop was not significantly influenced by weed
control measures at 50DAT.
c) Interaction effect:-
The interaction effects of green manuring treatment and weed control measures
were found to be non significant.
Table no WSM 8 :- Combined effects of green manuring and weed control measure on number
of nodule in rice – groundnut cropping system during rabi 2012 .
Treatment Crop:-Groundnut
Number of nodule/plant (No.) at 50 DAT of groundnut crop.
Main plots:- Green Manuring
M1 :- Green manuring 22.83
M2 :-Without green manuring 17.75
S. Em + 1.09
CD at 5% NS
Sub-Plots:- Weed control measures
T1:- Fix herbicide (Pendimethalin ) 16.33
T2:- Rotational herbicide (Butachlor) 18.83
T3:- Weed free 25.50
T4:- Weedy Check 20.50
S. Em + 2.08
C.D. at 5% NS
Interaction effect
S Em. + 2.95
C.D. at 5% NS
8) Number of nodule:-The data of no of nodule at 50DAT of groundnut crop is presented in
table WSM 3.8.
a) Effect of Green manuring: -
The number of nodule of groundnut crop at 50DAT was not significantly
influences by green manuring treatment as compared to without green manuring treatment.
b) Effect of weed control measures:-
The number of nodule of groundnut crop at 50 DAT was not significantly influenced
by weed control measures..
c) Interaction effect:-
The interaction effects of green manuring treatment and weed control measures were
found to be non significant.
B) For Rice (Kharif) Fix Herbiciede : Pretilachlor 50 EC @ 0.75 kg a.i. ha -1 3-7 DAT Rotational Herbicide : Sequence of 1. Pyrazosulfuron 10 WP @ 0.25 kg a.i. ha-1
8-10 DAT 2. Fenoxaprop 10 EC @ 80 kg a.i. ha-1
25-30 DAT 3. Oxadiargyl 6 EC @ 0.12 kg a.i. ha-1-0-5 DAT

65 Table no WSM 3.9 :- Combined effects of green manuring and weed control measure on
bacterial population in rice – groundnut cropping system during kharif 2013 .
Treatment Crop:-Rice
Bacteria CFU x 106/gm of soil.
30 DAT 50 DAT At harvest
Main plots:- Green Manuring
M1 :- Green manuring 38.00 34.12 32.45
M2 :-Without green manuring 28.99 30.71 24.53
S. Em + 0.72 0.48 1.28
CD at 5% 4.36 2.91 7.78
Sub-Plots:- Weed control measures
T1:- Fix herbicide (Pretilachlor ) 30.85 29.79 25.31
T2:- Rotational herbicide (Oxadiargyl) 32.02 31.40 26.28
T3:- Weed free 37.08 36.24 32.96
T4:- Weedy Check 34.04 32.23 29.41
S. Em + 0.62 0.88 2.54
C.D. at 5% 1.90 2.71 NS
Interaction effect
S Em. + 0.87 1.24 3.59
C.D. at 5% NS NS NS
9)Total bacterial population:-The data of total bacteria in soil is presented in table WSM 3.9.
a) Effect of Green manuring: -
The population of bacteria in soil was significantly influenced by green
manuring as compared to without green manure at 30DAT, 50DAT and at harvesting stage of the rice
crop. They recorded significantly higher bacterial population in green manuring treatment as
compared to the without green manuring treatment.
b) Effect of weed control measures:-
The total bacterial population in soil were significantly influenced by weed control
measures at 30DAT, 50DAT. They were found significantly less in fixed herbicide, rotational
herbicide and weedy check as compared to the weed free treatment at 30DAT and 50DAT. The
bacterial population was also found significantly less at the fixed herbicide treatment (Pretilachlor)
and the rotational herbicide treatment (Oxadiargyl) as compared to weedy check treatment at 30DAT
and at par with weedy check at 50DAT.The weed control measures was found to be non-significant
at harvesting stage of the rice crop.
c) Interaction effect:-
The interaction effect of green manuring treatment and weed control measures was found to
be non-significant.

66 Table no WSM 4.0 :- Combined effects of green manuring and weed control measure on fungi
in rice – groundnut cropping system during kharif 2013.
Treatment Crop:-Rice
Fungi CFU x 104/gm of soil.
30 DAT 50 DAT At harvest
Main plots:- Green Manuring
M1 :- Green manuring 25.22 21.82 19.61
M2 :-Without green manuring 13.73 14.97 10.71
S. Em + 1.48 0.64 0.79
CD at 5% 8.99 3.91 4.81
Sub-Plots:- Weed control measures
T1:- Fix herbicide (Pretilachlor ) 17.15 16.94 14.21
T2:- Rotational herbicide (Oxadiargyl) 19.24 17.82 14.66
T3:- Weed free 22.39 20.41 16.85
T4:- Weedy Check 19.12 18.42 14.92
S. Em + 1.90 1.18 0.95
C.D. at 5% NS NS NS
Interaction effect
S Em. + 2.69 1.67 1.34
C.D. at 5% NS NS NS
10) Fungi: - The data of total soil fungal population is presented in table no WSM 2
a) Effect of green manuring: -
The total fungal population in soil was significantly influenced by green manuring
treatment as compared to without green manuring treatment at 30 DAT and at 50 DAT and at
harvesting stage of rice crop. They recorded significantly higher fungal population in green manuring
treatment as compared to the without green manuring treatment.
b) Effect of weed measure: -
The population of total fungi was not significantly influenced by weed control measure
at 30 DAT, 50DAT and at harvesting stage of rice crop.
c) Interaction effect:-
The interaction effects of green manuring and weed control measures were found to be non
significant.
Table no. WSM 4.1 :- Combined effects of green manuring and weed control measure on free
living nitrogen fixers in rice – groundnut cropping system during kharif 2013 .
Treatment Crop:-Rice
Free living nitrogen fixers CFU x 103/gm of soil.
30 DAT 50 DAT At harvest
Main plots:- Green Manuring
M1 :- Green manuring 27.97 22.81 20.39
M2 :-Without green manuring 17.84 17.93 15.50
S. Em + 0.92 0.50 0.54
CD at 5% 5.61 3.02 3.30
Sub-Plots:- Weed control measures
T1:- Fix herbicide (Pretilachlor ) 18.70 17.74 15.72
T2:- Rotational herbicide (Oxadiargyl) 20.38 18.25 15.92
T3:- Weed free 28.31 26.57 22.44
T4:- Weedy Check 24.23 18.92 17.72
S. Em + 1.23 1.14 2.31
C.D. at 5% 3.79 3.52 NS
Interaction effect
S Em. + 1.74 1.62 3.26
C.D. at 5% NS NS NS
11) Free living Nitrogen fixers: -The data of population of Nitrogen fixers is presented in

67 Table no WSM 3
a) Effect of Green manuring: -
The free living nitrogen fixers were significantly influenced at 30DAT,
50DAT, and at harvesting stage by green manuring treatment as compared to the without green
manuring treatment.They recorded significantly higher population in green manuring treatment as
compared to the without green manuring treatment.
b) Effect of weed control measures: -
The free living nitrogen fixers were significantly influenced by weed control
measure at 30 DAT, 50 DAT.They were found significantly less in both fixed (Pretilachlor), rotational
herbicide(Oxadiargyl) and weedy check as compared to the weed free treatment at the above growth
stages(except at harvesting stage) of the rice crop. The population in both the herbicides treatments
was found significantly less as compared to the weedy check treatment at 30DAT and at par with
weedy check treatments at 50DAT. The weed control measures was found to be non-significant at the
harvesting stage of the crop.
c) Interaction effect:-
The interaction effects of green manuring and weed control measures were found to
be non significant.
WS M 4.2 :- Combined effects of green manuring and weed control measure on
phosphate solubilisers in rice – groundnut cropping system during kharif 2013
Treatment Crop:-Rice
Phosphate solubilisers CFU x 103/gm of soil.
30 DAT 50 DAT At harvest
Main plots:- Green Manuring
M1 :- Green manuring 28.37 22.22 20.09
M2 :-Without green manuring 16.34 18.36 14.03
S. Em + 0.99 0.22 0.86
CD at 5% 6.01 1.32 5.25
Sub-Plots:- Weed control measures
T1:- Fix herbicide (Pretilachlor ) 17.97 17.73 15.45
T2:- Rotational herbicide (Oxadiargyl) 19.08 18.47 15.92
T3:- Weed free 28.19 25.91 20.82
T4:- Weedy Check 24.17 19.03 16.05
S. Em + 1.25 1.04 1.86
C.D. at 5% 3.86 3.20 NS
Interaction effect
S Em. + 1.77 1.47 2.64
C.D. at 5% NS NS NS
12) Phosphate solubilisers:-The data of phosphate solubilisers is presented in table WSM 4.2
a) Effect of Green manuring: -
The phosphate solubilisers were significantly influenced at 30DAT, 50DAT, and
at harvesting stage by green manuring treatment as compared to the without green manuring
treatment.They recorded significantly higher population in green manuring treatment as compared to
the without green manuring treatment.
b) Effect of weed control measures:-
The phosphate solubilisers were significantly influenced by weed control
measure at 30 DAT, 50 DAT.They were found significantly less in both fixed (Pretilachlor), rotational
herbicide(Oxadiargyl) and weedy check as compared to the weed free treatment at the above growth
stages(except at harvesting stage) of the rice crop. The population in both the herbicides treatments
was found significantly less as compared to the weedy check treatment at 30DAT and at par with
weedy check treatments at 50DAT. The weed control measures was found to be non-significant at the
harvesting stage of the crop.

68 c) Interaction effect:-
The interaction effect of green manuring treatment and weed control measure was found
to be non-significant.
WS M 4.3:- Combined effects of green manuring and weed control measure on microbial
biomass carbon in rice – groundnut cropping system during kharif 2013 .
Treatment Crop:-Rice
Microbial biomass carbon( µg/gm soil)
30 DAT 50 DAT At harvest
Main plots:- Green Manuring
M1 :- Green manuring 244.10 223.38 213.39
M2 :-Without green manuring 194.06 206.98 189.87
S. Em + 2.16 1.20 0.77
CD at 5% 13.13 7.28 4.67
Sub-Plots:- Weed control measures
T1:- Fix herbicide (Pretilachlor ) 207.46 205.55 195.89
T2:- Rotational herbicide (Oxadiargyl) 211.86 208.59 197.77
T3:- Weed free 235.40 234.03 212.09
T4:- Weedy Check 221.62 212.56 200.79
S. Em + 2.90 4.95 6.39
C.D. at 5% 8.93 15.27 NS
Interaction effect
S Em. + 4.10 7.01 9.04
C.D. at 5% NS NS NS
13) Microbial biomass carbon:-The data of microbial biomass carbon is presented in table WSM 4.3
a) Effect of Green manuring: -
The microbial biomass carbon were significantly influenced at 30DAT, 50DAT, and at
harvesting stage by green manuring treatment as compared to the without green manuring
treatment.They recorded significantly higher microbial biomass carbon in green manuring treatment as
compared to the without green manuring treatment.
b) Effect of weed control measures:-
The microbial biomass carbon were significantly influenced by weed control
measure at 30 DAT, 50 DAT.They were found significantly less in both fixed (Pretilachlor), rotational
herbicide(Oxadiargyl) and weedy check as compared to the weed free treatment at the above growth
stages(except at harvesting stage) of the rice crop. The microbial biomass carbon in both the
herbicides treatments was found significantly less as compared to the weedy check treatment at
30DAT and at par with weedy check treatments at 50DAT. The weed control measures were found to
be non-significant at the harvesting stage of the crop.
c) Interaction effect:-
The interaction effect of green manuring treatment and weed control measure was found to
be non-significant.

69 Table no WSM 4.4 :- Combined effects of green manuring and weed control measure on basal
soil respiration in rice – groundnut cropping system during kharif 2013 .
Treatment Crop:-Rice
Basal soil respiration( µg/100gm soil)
30 DAT 50 DAT At harvest
Main plots:- Green Manuring
M1 :- Green manuring 239.87 222.15 214.61
M2 :-Without green manuring 198.28 205.77 192.96
S. Em + 0.99 0.82 1.65
CD at 5% 6.05 4.96 10.04
Sub-Plots:- Weed control measures
T1:- Fix herbicide (Pretilachlor ) 208.37 205.46 200.34
T2:- Rotational herbicide (Oxadiargyl) 214.15 208.28 200.81
T3:- Weed free 230.79 228.64 208.98
T4:- Weedy Check 222.99 213.47 205.02
S. Em + 2.34 3.94 4.04
C.D. at 5% 7.22 12.14 NS
Interaction effect
S Em. + 3.31 5.57 5.72
C.D. at 5% NS NS NS
14) Basal soil respiration:-The data of basal soil respiration in soil is presented in table WSM 4.4
a) Effect of Green manuring: -
The basal soil respiration were significantly influenced at 30DAT, 50DAT, and at harvesting
stage by green manuring treatment as compared to the without green manuring treatment.They
recorded significantly higher basal soil respiration in green manuring treatment as compared to the
without green manuring treatment.
b) Effect of weed control measures:-
The basal soil respiration were significantly influenced by weed control measure at 30 DAT, 50
DAT.They were found significantly less in both fixed (Pretilachlor), rotational herbicide(Oxadiargyl) and
weedy check as compared to the weed free treatment at the above growth stages(except at harvesting
stage) of the rice crop. The respiration in both the herbicides treatments was found significantly less as
compared to the weedy check treatment at 30DAT and at par with weedy check treatments at 50DAT.
The weed control measures was found to be non-significant at the harvesting stage of the crop.
c) Interaction effect:-
The interaction effect green manuring treatment and weed control measures was found
to be non-significant.
Table no WSM 4.5:- Combined effects of green manuring and weed control measure on
Dehydrogenase enzyme in rice – groundnut cropping system during kharif 2013
Treatment Crop:-Rice
Dehydrogenase enzyme( µg/gm/hr)
30 DAT 50 DAT At harvest
Main plots:- Green Manuring
M1 :- Green manuring 6.64 4.75 3.99
M2 :-Without green manuring 1.62 2.70 2.61
S. Em + 0.23 0.30 0.22
CD at 5% 1.40 1.81 1.36
Sub-Plots:- Weed control measures
T1:- Fix herbicide (Pretilachlor ) 3.82 3.06 2.74
T2:- Rotational herbicide (Oxadiargyl) 4.09 3.93 3.06
T3:- Weed free 4.44 4.20 4.08
T4:- Weedy Check 4.17 3.73 3.31

70
S. Em + 0.35 0.52 0.33
C.D. at 5% NS NS NS
Interaction effect
S Em. + 0.49 0.73 0.47
C.D. at 5% NS NS NS
15) Dehydrogenase enzyme: The data of dehydrogenase enzyme activity in soil is presented
in table WSM 4.5.
a) Effect of Green manuring: -
The dehydrogenase enzyme activity in soil were significantly influenced at
30DAT, 50DAT, and at harvesting stage by green manuring treatment as compared to the without
green manuring treatment.They recorded significantly higher dehydrogenase enzyme in green
manuring treatment as compared to the without green manuring treatment.
b) Effect of weed control measures:-
The dehydrogenase enzyme activity in soil was not significantly influenced by weed
control measure at 30 DAT, 50DAT and at harvesting stage of rice crop.
c) Interaction effect:-
The interaction effect green manuring treatment and weed control measures was found
to be non-significant.
Table no. WSM 5 :- Combined effects of green manuring and weed control measure on
Phosphatase enzyme in rice – groundnut cropping system during kharif 2013
Treatment Crop:-Rice
Phosphatase enzyme( µg/gm/hr)
30 DAT 50 DAT At harvest
Main plots:- Green Manuring
M1 :- Green manuring 198.59 188.41 158.56
M2 :-Without green manuring 151.08 154.30 141.71
S. Em + 2.05 0.72 1.46
CD at 5% 12.48 4.38 8.90
Sub-Plots:- Weed control measures
T1:- Fix herbicide (Pretilachlor ) 168.34 164.53 146.19
T2:- Rotational herbicide (Oxadiargyl) 171.49 167.08 149.05
T3:- Weed free 182.68 181.67 154.90
T4:- Weedy Check 176.83 172.14 150.40
S. Em + 1.65 2.79 2.99
C.D. at 5% 5.08 8.59 NS
Interaction effect
S Em. + 2.33 3.94 4.23
C.D. at 5% NS NS NS
15) Phosphatase enzyme: The data of phosphatase enzyme activity in soil is presented in
table WSM 4.5.
a) Effect of Green manuring: -
The phosphatase enzyme activity in soil were significantly influenced at
30DAT, 50DAT, and at harvesting stage by green manuring treatment as compared to the without
green manuring treatment.It was found significantly higher in green manuring treatment as compared
to the without green manuring treatment.
b) Effect of weed control measures:-
The phosphatase enzyme activity in soil were significantly influenced by
weed control measure at 30 DAT, 50 DAT.It was found significantly less in both fixed (Pretilachlor),
rotational herbicide(Oxadiargyl) and weedy check as compared to the weed free treatment at the
above growth stages(except at harvesting stage) of the rice crop. The phosphatase enzyme in both the
herbicides treatments was found significantly less as compared to the weedy check treatment at

71 30DAT and at par with weedy check treatments at 50DAT. The weed control measures was found to
be non-significant at the harvesting stage of the crop.
c) Interaction effect:-
The interaction effect green manuring treatment and weed control measures was found
to be non-significant.
Summary The experiment was conducted to see the combine effects of green manuring
and different weed control measures on soil microflora and their associated parameters such as
microbial biomass carbon, basal soil respiration,dehydrogenase enzymes and phosphatase enzyme in
a rice- groundnut cropping system. The summery of the experiment are as follows.
1.The soil microflora such as bacteria, fungi, free living nitrogen fixers and phosphate solubilisers and
their associated parameters such as microbial biomass carbon, basal soil respiration dehydrogenase
enzyme and phosphatase enzyme activity (In case of rice crop) were found significantly higher in
green manuring treatment as compared to the without- green manuring treatment in rabi groundnut
crop and kharif rice crop at all the above mention stages of the crops.
2 The bacterial population,fungi,free living nitrogen fixers ,phosphate solubilsers,microbial biomass
carbon,basal soil respiration in soil were significantly influenced by weed control measures at 30DAT.
They were found significantly less in fixed herbicide, rotational herbicide as compared to the weed free
treatment at 30DAT. The weed control measures was found to be non-significant at 50DAT and
harvesting stage of the groundnut crop.
2 The total bacterial population, free living nitrogen fixers, phosphate solubilisers, microbial biomass
carbon ,basal soil respiration and phosphatase enzyme activity was significantly found less in both
fixed herbicide, rotational herbicide and weedy check treatment as compared to the weed free
treatment in case Kharif rice crop at 30DAS and 50DAS.
3 The total bacterial population, free living nitrogen fixers, phosphate solubilisers, microbial biomass
carbon and basal soil respiration were significantly found less in both fixed herbicide and rotational
herbicide as compared to the weedy check treatment at 30DAT and at par with weedycheck treatment
at 50DAT during kharif season.
4.The total fungal population and dehydrogenase activity in soil was not significantly influenced by
weed control measure at all the above mention stage of the groundnut and rice crop.
5.The number of nodule and their dry weight was found to be non-significant in the main
treatment(green manuring)and the sub-treatment(weed control measures) during rabi season.
Conclusion
The green manuring treatment contain higher soil microflora and their associated
parameters as compared to the without green manuring treatment during both kharif and rabi season.It
may be due to the more stimulation of microbial population due to the green manuring treatment.The
microbial population and their associated parmeters (except fungi and dehdrogenase enzyme activity)
of the fixed and rotational herbiciedes (during kharif and rabi) get supressed at 30DAT but then
recovered at 50DAT and harvesting stage of both the rice and groundnut crop. However it still need to
do further research especially the long term effect of fixed herbicide and rotational herbicide on soil
microflora and their other associated parameters.

72 WS 4.2 Biologial weed management
a Biological control of Parthenium by Zygogramma bicolorata
2.08.013 released at site of KVK Kalwade
500 Beetle send form DWSR, Jabalpur for expt purpose
38 dead & 462 live zygogramma bicolorata
Pathenium /Sqm: 377
Pathenium /Sqm: 210
One site selected for control of pathenium by Zygogramma bicolorata
Sr .No
Site-1 KVK Kalwade Tal: Karad
Egg Larva Adult % damage
1 0 4 5 80
2 0 5 8 78
3 0 10 7 75
4 0 12 13 58
5 0 0 10 70
6 0 8 11 65
7 0 7 7 63
8 0 6 10 60
9 0 3 8 51
10 0 2 7 50
Average 0 5.7 8.6
Overalldamage 57% Plants are dried & Blackish in colour
Zoygoramma bicolorata released for Management of Pathenium hysteropterus resulted in
overall damage of the parthenium plants by 51%.
b: Biological control of Parthenium by competitive replacement through Cassia tora:NIL
WS 5 Herbicide residues and environmental quality
WS 5.1: Herbicide residues in long-term herbicide trial: NIL
WS 6.1 On-Farm Trial (OFT)
The technology developed for weed management at research farm should be tested at farmer’s
field as OFT.
Rabing Vs no rabing demonstrations was conducted during kharif,2013 in four districts of the
jurisdictions of our university through Kvk’s and research stations with view to stop rabing practice
followed for growing rice nursery on large scale in konkan region .
WS 6.2 Front Line Demonstration (FLD) :NIL
The weed management technology tested in OFT should be taken to FLD

73
Station Trials: S T 1.: Effect of time of sowing and weed control measures on performance of direct seeded dibbled rice.
Objective : To study effect of time of sowing and weed control measures on
weed incidence, their growth and performance of direct seeded dibbled rice variety Sahyadri 2.
Year of commencement : Kharif, 2011
Location : Agronomy Farm, College of Agriculture, Dapoli
Treatments Details:
A) Main plot treatments : I) Sowing times
1 : Before onset of monsoon (BOM)
2 : One week after onset of monsoon (OWAOM)
B) Sub plot treatments : II) Weed control measures
1 : Pretilachlor –S @ 0.5 kg /ha (PE)
2 : Azimsulfuron @ 35 gm/ ha PE
3 : Fenoxaprop -p- ethyl @ 60 g / ha (PoE)
4 Cyhalofop-p-butyl @ 90 g /ha + 2,4-D @ 0.5 kg/ha (PoE)
5 : Butachlor @ 1.5 kg / ha PE + 1 hand weeding (40 DAS)
6 : Weedy check
7 : Weed free check
Plot size Gross : 5.0 m x 2.0 m Net : 4.8 m x 1.6 m
Replications : Three
Design : Split plot
Season and crop : Kharif rice
Variety : Sahyadri 2
Date of sowing : S 1 – BOM : 05/06/2013 S2 – OWAOM : 19/06/2013
Date of harvesting : S 1 – BOM : 04/10/2013 S2 – OWAOM : 20/10/2013

74 Table S.T 1.1.: Effect of sowing time and weed control measures as affected by different treatments on
weed density.
Treatments
Weed density at 60 DAS (No. 0.25 m2)
Weed density at 90 DAS (No. 0.25 m2)
G&S BLWs Total WCE (%)
G&S BLWs Total WCE (%)
A) Main plot treatments : Sowing times
S1 : BOM 19.62 (4.08)
1.71 (1.26)
21. 33 - 114.24 (8.95)
5.43 (1.73)
119.67 -
S2 : OWAOM 56.67 (6.89)
9.00 (2.34)
65.67 - 113.67 (8.84)
9.76 (2.92)
123.43 -
Sem ± -
(1.09) -
(0.53) - -
- (2.17)
- (0.16)
- -
LSD (P=0.05) -
(N.S.) -
(N.S.) - -
- (N.S.)
- (0.96)
- -
B) Sub plot treatments : Weed control measures
T1: Pretilachlor- s 47.17 (6.99)
0.67 (0.95)
47.84 39.7 101.33 (9.25)
4.00 (1.76)
105.33 64.3
T2: Azimsulfuron 57.83 (6.76)
1.83 (1.29)
59.66 24.8 128.17 (10.40)
2.67 (1.60)
130.84 56.3
T3: Fen. P-ethyl 26.67 (4.27)
14.33 (3.47)
41.00 48.3 113.83 (9.92)
21.17 (4.06)
135.00 54.9
T4: Cyhalofop-p-butyl 45.17 (6.58)
0.83 (1.07)
45.30 42.9 151.00 (12.08)
2.17 (1.34)
153.17 48.8
T5: Butachlor + HW 19.83 (4.13)
5.33 (1.74)
25.16 68.3 5.83
(2.09) 8.00
(2.66) 13.83 95.3
T6: Weedy check 66.83 (7.76)
12.50 (2.66)
79.33 - 290.83 (16.23)
8.50 (2.41)
299.33 -
T7: Weed free check 3.50
(1.89) 2.00
(1.40) 5.50 93.07
6.67 (2.30)
6.67 (2.46)
13.34 95.5
Sem ± (0.99) (0.42) - - (1.36) (0.47) - -
LSD (P=0.05) (2.88) (1.23) - - (3.69) (1.38) - -
Interaction effects
Sem ± (1.39) (0.59) - - (1.79) (0.67) - -
LSD (P=0.05) (N.S.) (N.S.) - - (N.S.) (1.96) - -
Figures in parentheses indicate square root transformations √x + 0.5

75
Table S.T 1.2 : Effect of sowing time and weed control measures on weed growth at 60 and 90 DAS
Treatments Weed growth at 60 DAS (g/0.25 m2)
Weed growth at 90 DAS (g/0.25 m2)
G &S BLWs Total WCE (%)
G &S BLWs Total WCE (%)
A) Main plot treatments : Sowing times
S1 : BOM 3.21
(1.81) 0.39
(0.89) 3.60 -
70.49 (7.18)
1.91 (1.22)
72.40 -
S2 : OWAOM 16.24 (3.42)
1.35 (1.20)
17.59 - 48.78 (6.27)
5.31 (2.04)
54.09 -
Sem ± (0.42) (0.20) - - (0.93) (0.20) - -
LSD (P=0.05) (N.S.) (N.S.) - - (N.S.) (N.S.) - -
B) Sub plot treatments : Weed control measures
T1: Pretilachlor 15.79 (3.69)
0.12 (0.78)
15.91 30.2 99.00 (8.96)
3.50 (1.82)
102.50 12.98
T2: Azimsulfuron 13.78 (3.33)
0.68 (1.00)
14.46 36.6 90.92 (8.58)
1.16 (1.22)
92.08 21.8
T3: Fenoxyprop. P- ethyl
6.42 (2.16)
1.90 (1.30)
8.32 63.5 48.50 (6.52)
12.50 (3.09)
61.00 48.2
T4: Cyhalofop-p-butyl
6.92 (2.65)
0.07 (0.75)
6.99 69.3 85.50 (8.99)
2.00 (1.30)
87.50 25.7
T5: Butachlor 3.47
(1.85) 1.75
(1.35) 5.22 77.1
0.73 (1.03)
0.92 (1.15)
1.65 98.6
T6: Weedy check
21.40 (3.75)
1.40 (1.24)
22.8 - 113.25 (8.51)
4.55 (1.77)
117.80 -
T7: Weed free check
0.30 (0.88)
0.17 (0.80)
0.47 98.9 0.56
(1.00) 0.65
(1.06) 1.21 99.0
Sem ± (0.49) (0.16) - - (1.36) (0.47) - -
LSD (P=0.05) (1.17) (0.46) - - (3.68) (N.S.) - -
Interaction effects
Sem ± (0.87) (0.22) - - (1.78) (0.66) - -
LSD (P=0.05) (N.S.) (N.S.) - - (N.S.) (N.S.) - -
Figures in parentheses indicate square root transformations √x + 0.5
Results and discussion: Composition of weed flora
Grasses & Sedges: Isachane globossa, Cyperus iria, Echinochlca colona, coix lacryma jobi, BLWs : Ludwigia octovalvis, Altrenanthera sessilis, Smithia sensitiva, Commelnna benghalensis
I) Effect on weed density:- a) Effect of sowing time:- The weed density of grasses & sedges significantly more than BLWs. The data presented in Table revealed that sowing time did not influence significantly density of monocot weeds at 60 & 90 DAS and BLWs at 60 DAS.The density of BLWs differed significantly at 90

76
DAS. However, sowing before onset of monsoon reduced density of BLWs significantly over week after onset of monsoon.
b) Effect of weed control measures:-
The data revealed that weed density of monocots at 60 DAS reduced significantly due to use of Butachlor + HW than other weed control measures except fenoxaprop -p- ethyl. Further the weed density of BLWs at 60 DAS recorded significantly least in application of Pretilachlor- s over fenoxaprop-p-ethyl, weedy check and which was at par with Azimsulfuron (T2), Cyhalofop p butyl (T4), butachlor + HW (T5), and weed free check treatments. At 90 DAS application of butachlor + HW significantly least density of monocot weeds over all measures except weed free check. The density of BLWs in all measures significantly least over the application of fenoxaprop p ethyl and which were remained at par with each other.
c) Interaction effects:- The interaction effects between sowing times & weed control measures found to be non-significant. II). Effect on weed growth:- a) Effect on sowing times:- The weed growth of monocots and BLWs did not differ significantly. b) Effect of weed control measures:- The data presented in Table revealed that the weed growth of monocots at 60 DAS recorded significantly least in Butachlor + HW over other weed control treatments except fenoxaprop p ethyl (T3) and Cyhalofop p butyl (T4). Further weed growth of BLWs at 60 DAS reduced significantly least in application of Cyhalofop p butyl, Pertilachlor-s, weed free check, Azimsulfuron than remaining weed control treatments fenoxaprop p ethyl , Butachlor + HW and weedy check.. Weed growth of monocot weeds at 90 DAS significantly least in Butachlor + HW (T5) over remaining weed control measures. However, it was at par with weed free check treatment. The weed growth of BLWs at 90 DAS did not differ significantly due to weed control treatments.
c) Interaction effects: The interaction effects between sowing times & weed control measures found to be non-significant.
III) Effect of yield attributes & yield: a) Effect of sowing time :-
The data presented in Table revealed that time of sowing did not differ significantly yield
attributes viz.height of plant, number of tillers & number of panicles, length of panicles & straw
yield. The grain yield of rice increased significantly in sowing before onset of monsoon over one
week after onset of monsoon.
b) Effect of weed control measures:- The weed free check recorded significantly higher number of tillers & number of panicles
/hill than the remaining treatments. However, it was at par with Azimsulfuron, fenoxaprop ethyl,
Cyhalofop butyl and butachlor + HW. The grain yield rice significantly higher in application of
butachlor + HW over other treatments and which was identical with Cyhalofop butyl & weed free
check. The straw yield of rice in Butachlor +HW, weed free check and Cyhalofop butyl
significantly higher over remaining treatments and which remained at par with each other.
c. Interaction effects:- The interaction effects between sowing times & weed control measures found to be non-significant.

77
S T.1.3. : Effect of sowing time and weed control measures on yield attributes and yield of dibbled rice Sahyadri-2
Treatments Height (cm)
Number of tillers
/hill
Number of Panicle
/hill
Length of Panicle
(cm)
Grain yield (q/ha)
Straw yield (q/ha)
WI (%)
Main plot treatments : Sowing times
S1: BOM 86.36 10.17 9.30 25.34 42.33 44.84 -
S2: OWAOM 86.64 9.17 8.51 29.73 34.56 40.16 -
Sem ± 1.57 0.32 0.72 0.63 1.54 1.20 -
LSD (P=0.05) N.S. N.S. N.S. N.S. 4.39 N.S. -
Sub plot : Weed control measures
T1: Pretilachlor 87.25 8.30 7.80 25.75 39.37 42.42 13.03
T2: Azimsulfuron 85.87 9.63 9.30 28.20 39.52 42.07 12.07
T3: Fen. P-ethyl 84.80 10.03 9.20 27.80 37.22 44.27 17.78
T4: Cyhalofop-p-butyl 85.87 10.73 9.50 28.00 41.77 45.73 7.73
T5: Butachlor + HW at 40 DAS
85.86 9.50 8.97 26.90 46.35 48.77 -2.38
T6: Weedy check 87.70 8.50 7.83 26.75 19.63 21.85 56.64
T7: Weed free check 88.13 10.98 9.73 27.30 45.27 52.40 -
Sem ± 1.37 0.52 0.13 0.53 2.07 2.38 -
LSD (P=0.05) N.S. 1.50 0.39 N.S. 6.03 6.95 - Interaction effect
Sem ± 1.93 0.73 0.19 0.76 2.92 3.37 -
LSD (P=0.05) N.S. N.S. N.S. N.S. 8.53 N.S. -
Summary:-
The weed density and growth of grasses & sedges significantly more than BLWs. The
weed density & weed growth of monocots at 60 DAS significantly least due to use of butachlor +
HW over other treatments except fenoxaprop-p-ethyl. The weed growth of BLWs at 60 DAS
reduced significantly in weed free check, Cyhalofop butyl & Pretilachlor-s over other remaining
treatments.
Amongst these herbicidal treatments use of Butachlor + H.W recorded significantly
higher number of tillers/hill, number of panicles/hill and grain yield of rice. However, it was at par
with weed free check and Cyhalofop butyl. Thus compared to weed free check the grain yield of
rice produced higher in use of butachlor + HW.

78
S T 3 : Efficacy of herbicides for controlling weeds in direct seeded rice.
Objective : To find out the best herbicides /herbicide mixtures for weed control in direct seeded rice.
Year of commencement
: Kharif, 2011
Location : Agronomy Farm, Collage of Agriculture, Dapoli
Treatments : Treatments details Time of
application
T1 : Pyrazosulfuron @ 25 g/ha 3-7 DAS
T2 : Pretilachlor – s. @ 750 g/ha 0-5 DAS
T3 : Cyhalofop butyl@ 90 g/ha 25 DAS
T4 : Fenoxaprop @ 60 g/ha 30 DAS
T5 : Cyhalofop butyl + (chlorimuron + metsulfuron) @ 90 + 20 g/ha
25-30DAS
T6 : Fenoxaprop + (chlorimuron + Metsulfuron) @ 60+20 g/ha
25-30DAS
T7 : Azimsulfuron @ 35 g/ha 20 DAS
T8 Bispyribac sodium @ 25 g/ha 20 DAS
T9 : Fenoxaprop + Ethoxysulfuron@ 60 + 15 g/ha 25-30 DAS
T10 : Oxyfluorfen + 2,4-D @ 300 +500 g/ha PE+30DAS
T11 : 2 hand weeding (20 & 40 DAS) -
T12 : Weedy Check -
Plot size Gross : 5 m x 2.5m Spacing : Sowing at 20 cm
Fertilizers kg /ha) : 100+50+50 kg/ha (N, P2O5 and K2O)
Replications : Three
Design : Randomized Block Design
Season and crop : Kharif : rice
Variety : Karjat-3
Date of sowing : 04/06/2013
Date of harvesting : 08/10/2013

79
Table S T 2.1: Effects of treatments on weed density at 60 & 90 DAS (No./0.25 m2) (Kharif, 2013)
Treatments
Weed Density 60 DAS Weed Density 90 DAS
G&S BLWs Total WCE% G&S BLWs Total WCE%
T1.: Pyrazosulfuron (3- 7 DAS)
128.67 (11.32)
6.00 (1.89) 134.67 25.60
193.00 (13.67)
7.33 (2.44) 200.33 20.17
T2.: Pretilachlor-S (PE)
117.33 (10.73)
27.67 (4.34)
145.00 19.89 157.33 (12.17)
11.67 (2.45)
169.00 32.49
T3:. Cyhalofop butyl (PoE)
165.0 (12.83)
2.00 (1.47)
167.00 7.73 181.67 (13.38)
0.00 (0.71)
181.67 27.43
T4: Fenoxaprop (PoE)
68.67 (8.25)
9.33 (2.72)
60.58 66.53 7.00
(5.74) 26.33 (5.13)
33.33 86.69
T5: Cyhalofop butyl (chlorim+metsul) (PoE)
46.33 (6.56)
12.00 (2.49) 58.33 67.77
183.33 (13.50)
0.67 (1.00) 184.00 26.50
T6: Fenoxaprop + (chlorim+ metsul) (PoE)
49.33 (6.91)
2.67 (1.45) 52.00 71.27
143.33 (11.81)
8.33 (2.67) 151.66 39.42
T7: Azimsulfuron (PoE)
58.33 (7.55)
1.00 (1.10)
59.33 67.22 167.00 (12.80)
0.67 (1.00)
167.67 33.02
T8:Bispyribac sodium (PoE)
155.0 (12.36)
0.00 (0.71)
155.00 14.36 254.33 (15.92)
0.00 (0.71)
254.33 -1.60
T9: Fenoxaprop + Ethoxysulfuron (PoE)
9.33 (2.53)
38.67 (6.13) 48.0 73.48
7.67 (2.84)
57.67 (7.51) 65.34 73.90
T10: Oxyfluorfen (PE)+2,4-D (PoE)
23.67 (4.74)
0.00 (0.71)
23.67 86.92 19.67 (4.38)
0.67 (1.00)
20.34 91.87
T 112 HW (20 &40 DAS)
4.33 (2.09)
12.00 (3.49)
16.33 90.98 41.67 (5.46)
4.33 (2.06)
46.00 81.62
T12: Weedy Check 173.0
(13.05) 8.00
(2.60) 181.00 -
239.33 (7.14)
11.00 (3.07)
250.33 -
S.Em ± -
(0.49) -
(1.16) - -
- (1.13)
- (0.84)
- -
LSD (P=0.05) -
(1.35) -
(3.23) - -
- (3.14)
- (2.33)
- -
(Figures in parentheses indicate square root transformations √x + 0.5) I) Effects of herbicides on weed density:
Data revealed that hand weeding twice 20 & 40 DAS recorded least weed density of
monocots at 60 DAS exhibiting highest weed control efficiency 90.98% and it was at par with
Fenoxaprop + Ethoxysulfuron (T9) followed by oxyfluorfen+2,4-D (T10).The weed density of
BLWs was least due to Oxyfluorfen+2, 4-D (T10) & Bispyribac-Na (T8) which remained at par
with other treatments except Pretilachlor – S (T2) & Fenoxaprop + Ethoxysulfuron (T9).

80
At 90 DAS, density of monocots was significantly least due to use of Fenoxaprop +
Ethoxysulfuron (T9) over all other treatments except Fenoxaprop (T4), Oxyfluorfen+2, 4- D (T10)
and hand weeding twice (T11). The weed density of BLWs was significantly least due to use of
Cyhalofop butyl, Cyhalofop butyl + (chlorim + metsul), Azimsulfuron, Bispyribac-Na and
Oxyfluorfen + 2,4-D than the application of Fenoxaprop p ethyl + Ethoxysulfuron(T9),
Fenoxaprop p ethyl (T4) and weedy check(T12).
Table S T 2.2: Effects of different treatments on weed growth at 60 & 90 DAS (g./0.25 m2) (Kharif 2013)
Treatments
Weed growth 60 DAS Weed growth 90 DAS
G&S BLWs Total WCE% G&S BLWs Total WCE
%
T1.: Pyrazosulfuron (3-7 DAS)
31.75 (5.60)
1.07 (1.12)
32.82 2.12 94.33 (9.68)
4.67 (2.16)
99.00 40.00
T2.: Pretilachlor-S (PE)
26.95 (5.17)
3.71 (1.85)
30.66 8.56 85.67 (8.98)
7.00 (2.00)
92.67 43.84
T3:. Cyhalofop butyl (PoE)
31.90 (5.64)
1.55 (1.36)
33.45 0.24 105.67 (10.27)
0.00 (0.71)
105.67
35.96
T4: Fenoxaprop (PoE)
13.42 (3.57)
4.51 (2.14)
17.93 46.52 2.00
(1.47) 47.33 (6.62)
49.33 70.10
T5: Cyhalofop butyl (chlorim+metsul) (PoE)
20.68 (4.42)
5.83 (1.88) 26.51 20.94
111.00 (10.51)
6.00 (1.89)
117.00
29.09
T6: Fenoxaprop + (chlorim+ metsul) (PoE)
8.30 (3.00)
0.16 (0.80) 8.46 74.77
34.67 (5.85)
8.33 (2.41) 43.00 73.94
T7: Azimsulfuron (PoE)
19.39 (4.39)
0.04 (0.73)
19.43 42.05 80.67 (8.92)
0.67 (1.00)
81.34 50.70
T8:Bispyribac sodium (PoE)
32.63 (5.98)
0.00 (0.71)
32.63 2.68 124.33 (13.81)
0.00 (0.71)
124.33
24.65
T9: Fenoxaprop + Ethoxysulfuron (PoE)
2.07 (1.48)
7.78 (2.75) 9.85 70.62
1.33 (1.56)
43.67 (6.59) 44.00 73.33
T10: Oxyfluorfen (PE)+2,4-D (PoE)
4.96 (2.28)
0.00 (0.71)
4.96 85.21 6.67
(2.64) 0.33
(0.88) 7.00 95.76
T 112 HW (20 &40 DAS)
0.64 (1.06)
1.41 (1.37)
2.05 93.89 13.00 (3.25)
4.33 (2.09)
17.33 89.50
T12: Weedy Check 31.30 (5.54)
2.23 (1.55)
33.53 - 117.33 (10.08)
47.67 (5.71)
165.00
-
S.Em ± -
(0.38) -
(0.72) - -
- (0.73)
- (1.06)
- -
LSD (P=0.05) -
(1.07) -
(N.S) - -
- (2.03)
- (2.94)
- -
Figures in parentheses indicate square root transformations √x + 0.5

81
II) Effects of herbicides on weed growth: The data revealed that at 60 DAS hand weeding at 20 and 40 DAS (T11) recorded
significantly least weed growth of monocots over other weed control measures except
Fenoxaprop + Ethoxysulfuron (POE) (T9). The weed growth of BLWs did not differ significantly
at 60 DAS. Hand weeding twice (T11) recorded highest weed control efficiency (93.9%) followed
by Oxyfluorfen + 2,4-D (85.21%).The weed growth of monocots at 90 DAS due to use of
Fenoxaprop (T4), Fenoxaprop + Ethoxysulfuron, Oxyfluorfen + 2,4-D (T10) and hand weeding
twice(T11) was significantly least over other WCMs and which were identical. The weed growth
of BLWs was significantly less due to all WCMs as compared to Fenoxaprop + Ethoxysulfuron
(T9) weedy check (T12) and Fenoxaprop (T4).
III) Effect of herbicides on yield attributes and grain yield of direct seeded rice
The data revealed that number of tillers, number of panicles/per meter row length
and panicle length were influenced significantly due to different treatments under study. The
number of panicles/per meter row length, panicle length was significantly increased due to use
of PE application Oxyfluorfen+ PoE application 2, 4-D (T10) compared to all of the treatments
under study. Hand weeding twice (T11) recorded highest grain yield (43.65 q/ha) over other
measures and which was at par with PE application Oxyfluorfen + PoE application 2, 4-D (T10).
Thus, compared to the best treatment of two hand weeding 2.25 percent reduction in grain yield
was found to be least in case of treatment use of PE application Oxyfluorfen+ PoE application 2,
4-D (T10) followed by Fenoxaprop + (chlorimuron + metsulfuron) (T6) (34.09)%.
Table S T 2.3: Effects of treatments on yield attributes & yield of direct seeded rice.
Treatments
Height (cm)
Number of tillers
/m
Number of Panicles
/ m
Panicle length (cm)
Grain yield (q/ha)
Straw yield (q/ha)
WI %
T1.: Pyrazosulfuron (3-7 DAS)
67.40 56.00 47.33 21.06 15.29 18.56 64.97
T2.: Pretilachlor-S (PE) 69.96 62.67 49.33 18.18 16.35 18.65 62.54
T3:. Cyhalofop butyl (PoE) 69.84 78.00 61.33 21.24 20.99 23.97 51.91
T4: Fenoxaprop (PoE) 67.39 84.67 74.00 21.33 18.40 21.67 57.85
T5: Cyhalofop butyl (chlorim+metsul) (PoE)
66.50 80.67 76.00 20.36 18.64 20.65 57.30
T6: Fenoxaprop + (chlorim+ metsul) (PoE)
57.37 78.00 65.33 18.41 28.77 31.33 34.09
T7: Azimsulfuron (PoE) 63.85 83.33 54.67 22.01 23.39 25.63 46.41
T8:Bispyribac sodium (PoE) 64.77 92.00 75.33 19.89 23.09 26.63 47.10
T9: Fenoxaprop + Ethoxysulfuron (PoE)
64.05 94.00 75.33 19.57 23.15 25.91 46.96
T10: Oxyfluorfen (PE)+2,4- D (PoE)
66.98 86.00 78.67 23.86 42.67 46.33 2.25
T 112HW(20 &40 DAS) 67.21 84.00 82.00 19.85 43.65 46.08 -
T12: Weedy Check 71.83 52.67 36.67 18.17 6.24 7.19 -
S.Em ± 0.64 0.50 0.94 0.31 0.72 0.76 -
LSD (P=0.05) N.S 1.37 2.61 0.87 1.99 2.11 -

82
Summary: At 60 DAS hand weeding twice 20 & 40 DAS recorded least weed density of monocots
exhibiting highest weed control efficiency 90.98% and it was at par with Fenoxaprop + Ethoxysulfuron (T9) followed by oxyfluorfen+2,4-D (T10).while the least weed density of BLWs was observed due to combined use of Oxyflurofen and 2-4-D,Bispyribac –Na and Azimsulfuron (PoE). Similarly at 90 DAS, the least weed density of monocots was observed due to combined use of Fenoxaprop p ethyl and Ethoxysulfuon, while the least weed density of BLWs was observed due to use of Oxyflurofen and 2-4-D, Bispyribac –Na and Azimsulfuron (PoE). The application of Fenoxaprop p ethyl recorded least weed growth of monocots at 90 DAS. Weed growth of BLWs was conspicuously less in almost all treatment combinational as compared to the treatment where Fenoxaprop p ethyl was combined with Ethoxysulfuron probably because latter controlled monocots but not BLWs. Hand weeding twice recorded highest grain yield (43.45 q/ha) which was at par with the combined application of Oxyflurofen and 2-4-D (42.67 q/ha). Thus the latter group of treatments effectively controlled both monocots and BLWs and lead to significantly increase in grain yield. Pooled Analysis: Table ST3.4:Effect of various treatments on weed density No/ 0.25 m2 (pooled data of three years)
Treatments
weed density at 60 DAS (G&S) weed density at 60 DAS (BLWs)
2011 2012 2013 Pooled mean
WCE %
2011 2012 2013 Pooled mean
WCE %
T1.:Pyrazosulfuron (3-7 DAS)
139.33 (11.63)
52.00 (7.19)
128.67 (11.32)
106.67 (10.12)
22.3 0.33
(0.88) 7.33
(2.55) 6.00
(1.89) 4.55
(2.09) 60.2
T2.: Pretilachlor-S (PE)
121.33 (11.01)
38.33 (5.95)
117.33 (10.73)
92.33 (9.34)
32.7 2.33
(1.39) 7.67
(2.56) 27.67 (4.34)
12.56 (3.27)
- 9.8
T3:. Cyhalofop butyl (PoE)
152.00 (12.26)
51.67 (7.15)
165.00 (12.83)
122.89 (10.79)
10.4 1.00
(1.17) 5.33
(2.14) 2.00
(1.47) 2.78
(1.74) 75.7
T4: Fenoxaprop (PoE)
46.33 (6.80)
20.67 (4.09)
68.67 (8.25)
45.22 (6.55)
67.0 2.00
(1.47) 11.33 (2.98)
9.33 (2.72)
7.55 (2.69)
34.0
T5: Cyhalofop butyl (chlorim+metsul) (PoE)
104.00 (9.99)
22.67 (4.67)
46.33 (6.56)
57.67 (7.26)
57.9 0.00
(0.71) 2.00
(1.43) 12.00 (2.49)
4.67 (1.92)
59.2
T6: Fenoxaprop + (chlorim+ metsul) (PoE)
76.00 (8.49)
51.33 (7.10)
49.33 (6.91)
58.89 (7.63)
57.0 0.00
(0.71) 1.33
(1.18) 2.67
(1.45) 1.33
(1.28) 88.4
T7: Azimsulfuron (PoE)
154.00 (12.19)
35.33 (5.59)
58.33 (7.55)
82.55 (8.66)
39.8 0.00
(0.71) 0.00
(0.71) 1.00
(1.10) 0.33
(0.88) 97.1
T8:Bispyribac sodium (PoE)
178.67 (13.23)
64.67 (6.67)
155.00 (12.36)
132.78 (11.29)
3.2 3.67
(1.90) 0.00
(0.71) 0.00
(0.71) 1.22
(1.15) 89.3
T9: Fenoxaprop + Ethoxysulfuron(PoE)
37.00 (5.31)
9.00 (3.03)
9.33 (2.53)
18.44 (4.10)
86.5 2.67
(1.64) 8.33
(2.71) 38.67 (6.13)
16.55 (3.66)
-44.7
T10: Oxyfluorfen (PE)+2,4-D (PoE)
58.67 (7.53)
13.67 (3.45)
23.67 (4.74)
32.00 (5.41)
76.7 4.00
(1.94) 0.67
(1.00) 0.00
(0.71) 1.56
(1.33) 86.4
T 112HW(20 &40
DAS) 6.67
(8.67) 8.00
(2.80) 4.33
(2.09) 6.33
(2.56) 90.2
0.00 (0.71)
6.33 (2.49)
12.00 (3.49)
6.11 (2.07)
46.6
T12: Weedy Check 154.67 (11.62)
83.67 (8.96)
173.00 (13.05)
137.11 (11.58)
- 3.33
(1.79) 23.00 (4.75)
8.00 (2.60)
11.44 (3.23)
-
S.Em ± -
(1.30) -
(0.64) -
(0.64) -
(0.50) -
- (0.64)
- (0.65)
- (1.16)
- (0.73)
-
LSD (P=0.05) -
(N.S) -
(1.78) -
(N.S) -
(1.38) -
- (N.S)
- (1.79)
- (3.32)
- (N.S)
-

83
Figures in parentheses indicate square root transformations √x + 0.5 I ) Effects on weed density :- Weed density of monocots at 60 DAS was not significantly influenced due to different treatments under study during first and third year of the study. The pooled data revealed that Fenoxaprop p ethyl in combination with Ethoxysulfuron was most effective in reducing monocots density at 60 DAS next to HW and which was at par with use of Oxyflurofen + 2-4-D over all other treatments. While the least weed density of BLWs was observed due to combined use of Oxyflurofen + 2-4-D, Bispyribac –Na and Azimsulfuron (PoE). At 90 DAS comparison of these effective treatments viz.two hand weeding,Fenoxaprop p ethyl in combination with Ethoxysulfuron,Fenoxaprop p ethyl and Oxyflurofen + 2-4-D reducing monocots density over other WCMs and which were at par. The weed density of BLWs density significantly least in Oxyflurofen + 2-4-D,and sole use of Bispyribac –Na and Azimsulfuron (PoE).
The comparison of these effective herbicide treatments with two hand weedings at 20 and 40 DAS brought out the fact that, the use of Fenoxaprop + Ethoxysulfuron was the most effective treatment in reducing density of monocot weeds (WCE 93.2 %) at 90 DAS followed by the treatment of using Fenoxaprop p ethyl alone. (WCE 90.2 %). On similar lines, weed density of BLWs was significantly and conspicuously reduced by the treatment. Bispyribac sodium (WCE 98 %) and Oxyfluorfen + 2,4-D (WCE 92.8 %).

84
Table S T 3.5: Effects of treatments on weed density of monocots and BLWs (No/0.25 m2) at 90 DAS (pooled data of three years).
Treatment
weed density at 90 DAS (G&S) weed density at 90 DAS (BLWs)
2011 2012 2013 Pooled mean
WCE %
2011 2012 2013 Pooled mean
WCE %
T1.: Pyrazosulfuron (3-7 DAS)
53.67 (7.32)
21.67 (4.65)
193.00 (13.67)
89.45 (8.63)
39.5 0.00
(0.71) 4.33 (1.80)
7.33 (2.44)
3.89 (1.90)
63.9
T2.: Pretilachlor-S (PE)
85.00 (9.22)
33.67 (5.17)
157.33 (12.17)
92.00 (9.19)
37.8 1.67
(1.26) 11.67 (3.19)
11.67 (2.45)
8.33 (2.77)
22.7
T3:. Cyhalofop butyl (PoE)
91.33 (9.52)
27.00 (5.08)
181.67 (13.38)
100.00 (9.41)
32.4 0.00
(0.71) 10.67 (2.90)
0.00 (0.71)
3.56 (1.56)
67.0
T4: Fenoxaprop (PoE)
19.00 (4.23)
7.33 (2.60)
7.00 (5.74)
11.11 (3.30)
92.5 2.33
(1.68) 21.00 (4.39)
26.33 (5.13)
16.56 (3.83)
-53.6
T5: Cyhalofop butyl (chlorim+metsul) (PoE)
73.33 (8.53)
40.33 (6.19)
183.33 (13.50)
99.00 (9.48)
33.1 0.33
(0.88) 7.67 (2.07)
0.67 (1.00)
2.89 (1.62)
73.2
T6: Fenoxaprop + (chlorim+ metsul) (PoE)
35.00 (5.58)
74.00 (8.57)
143.33 (11.81)
84.11 (8.83)
43.1 0.00
(0.71) 0.00 (0.71)
8.33 (2.67)
2.78 (1.46)
74.2
T7: Azimsulfuron (PoE)
52.33 (6.51)
31.33 (5.23)
167.00 (12.80))
83.55 (8.58)
43.5 0.00
(0.71) 5.00 (1.76)
0.67 (1.00)
1.89 (1.38)
82.5
T8:Bispyribac sodium (PoE)
85.67 (9.09)
61.33 (7.79)
254.33 (15.92)
133.78 (11.01)
9.54 0.67
(1.00) 0.00 (0.71)
0.00 (0.71)
0.22 (0.83)
98.0
T9: Fenoxaprop + Ethoxysulfuron (PoE)
21.33 (4.60)
1.33 (1.18)
7.67 (2.84)
10.11 (2.94)
93.2 3.33
(1.74) 12.00 (3.45)
57.67 (7.51)
24.33 (4.34)
-125.7
T10: Oxyfluorfen (PE)+2,4-D (PoE)
29.67 (5.42)
15.67 (3.92)
19.67 (4.38)
21.67 (4.62)
85.3 0.33
(0.88) 1.33 (1.29)
0.67 (1.00)
0.78 (1.11)
92.8
T 112HW(20 &40 DAS)
1.33 (1.18)
12.67 (3.49)
41.67 (5.46)
18.56 (3.79)
87.5 0.33
(0.88) 11.33 (3.37)
4.33 (2.06)
5.33 (2.16)
49.4
T12: Weedy Check 84.33 (8.72)
120.00 (10.93)
239.33 (13.68)
147.89 (12.08)
- 4.33
(2.15) 17.00 (3.15)
11.00 (3.07)
10.78 (3.21)
-
S.Em ± -
(0.70) -
(0.67) -
(1.12) -
(0.75) -
-(0.49)
- (0.91)
- (0.84)
- (0.74)
-
LSD (P=0.05) -
(1.94) -
(1.87) -
(5.11) -
(2.09) -
-(1.36)
- (N.S)
- (2.33)
- (2.06)
-
Figures in parentheses indicate square root transformations √x + 0.5
II) Effects on weed growth:-
Similar to effects on weed density of monocots and BLWs, their growth was influenced by different treatments under study both at 60 DAS as also 90 DAS. In pooled results the different herbicide treatment effects and the combination compared to the recommended practice of hand weeding twice at 20 and 40 DAS, No doubt the treatment of Fenoxaprop p ethyl + Ethoxysulfuon turned out to be the best combination for suppressing growth of monocot weeds at 60 and 90 DAS. Such a comparison for suppressing growth of BLWs brought out the

85
fact that use of Azimsulfuron topped the rank followed by Fenoxaprop p ethyl integration with combination product of Chlorimuron ethyl+ metsufuron m ethyl, Oxyfluorfen + 2,4-D and Bispyribac sodium at 60 DAS while at 90 DAS Oxyflnorfen + 2,4-D was the best treatment followed by use of Bispyribac sodium, Azimsulfuron and Fenoxaprop + combination product of Chlorimuron ethyl + metsulfuron methyl.
Table S T 3.6: Effects of treatments on growth of monocots and BLWs (90.25m2) at 60 DAS (Pooled data of three years).
Treatment
Weed growth of monocot at 60 DAS Weed growth of BLWs at 60 DAS
2011 2012 2013 Poole
d mean
WCE %
2011 2012 2013 Pooled mean
WCE %
T1:Pyrazosulfuron (3-7 DAS)
15.00 (3.85)
13.67 (3.68)
31.75 (5.60)
20.47 (4.51)
28.0 0.33
(0.88) 1.67
(1.44) 1.07 (1.12)
1.03 (1.21)
71.6
T2: Pretilachlor-S (PE) 17.67 (4.16)
9.33 (2.91)
26.95 (5.17)
17.98 (4.17)
36.7 1.33
(1.18) 1.00
(1.22) 3.71 (1.85)
2.01 (1.54)
44.6
T3:. Cyhalofop butyl (PoE)
22.33 (4.69)
10.00 (3.18)
31.90 (5.64)
21.41 (4.54)
24.7 1.00
(1.17) 2.67
(1.61) 1.55 (1.36)
1.74 (1.48)
52.1
T4: Fenoxaprop (PoE) 6.33 (2.44)
7.00 (2.27)
13.42 (3.57)
8.92 (3.00)
68.6 0.50
(0.98) 1.67
(1.39) 4.51 (2.14)
2.23 (1.57)
38.6
T5: Cyhalofop butyl (chlorim+metsul) (PoE)
17.67 (4.19)
4.33 (2.08)
20.68 (4.42)
14.23 (3.65)
49.9 0.00
(0.71) 0.67
(1.05) 5.83 (1.88)
2.17 (1.44)
40.2
T6: Fenoxaprop + (chlorim+ metsul) (PoE)
11.33 (3.37)
12.33 (3.49)
8.30 (3.00)
10.65 (3.25)
62.5 0.00
(0.71) 0.33
(0.88) 0.16 (0.80)
0.16 (0.81)
95.6
T7: Azimsulfuron (PoE) 26.33 (5.07)
13.33 (3.35)
19.39 (4.39)
19.69 (4.39)
30.7 0.00
(0.71) 0.00
(0.71) 0.04 (0.73)
0.01 (0.72)
99.7
T8:Bispyribac sodium (PoE)
24.00 (4.87)
12.67 (3.55)
32.63 (5.98)
23.10 (4.72)
18.7 2.00
(1.52) 0.00
(0.71) 0.00 (0.71)
0.67 (1.00)
81.5
T9: Fenoxaprop + Ethoxysulfuron (PoE)
7.00 (2.84)
4.33 (2.06)
2.07 (1.48)
4.47 (2.18)
84.3 1.67
(1.39) 2.67
(1.66) 7.78 (2.75)
4.04 (2.04)
-11.3
T10: Oxyfluorfen (PE) + 2,4-D (PoE)
11.00 (3.55)
4.33 (1.99)
4.96 (2.28)
6.76 (2.62)
76.2 1.00
(1.17) 0.33
(0.88) 0.00 (0.71)
0.44 (0.95)
87.9
T 112HW(20 &40 DAS) 1.67 (1.46)
1.33 (1.34)
0.64 (1.06)
1.21 (1.30)
95.7 0.00
(0.71) 1.00
(1.00) 1.41 (1.37)
0.80 (1.10)
78.0
T12: Weedy Check 30.33 (5.46)
22.67 (4.70)
31.30 (5.54)
28.43 (5.32)
- 1.67
(1.46) 7.00
(2.74) 2.23 (1.55)
3.63 (1.95)
-
S.Em ± -
(0.33) -
(0.51) -
(0.38) -
(0.35) -
- (0.40)
- (0.36)
- (0.72)
- (0.42)
-
LSD (P=0.05) -
(0.92) -
(1.45) -
(1.07) -
(0.98) -
- (N.S)
- (0.99)
- (N.S)
- (1.16)
-
Figures in parentheses indicate square root transformations √x + 0.5

86
Table S T 3.7: Efficacy of herbicide for controlling weeds in direct seeded rice on weed Growth at 90 DAS (G&S) & (BLWs) (No/0.25 m2)
Treatments
Weed growth at 90 DAS (G&S) Weed growth at 90 DAS (BLWs)
2011 2012 2013 Pooled mean
WCE %
2011 2012 2013 Pooled mean
WCE %
T1.: Pyrazosulfuron (3-7 DAS)
30.80 (5.54)
6.04 (2.52)
94.33 (9.68)
43.72 (5.94)
37.8 0.00
(0.71) 8.24
(2.61) 4.67
(2.16) 4.30
(1.98) 86.2
T2.: Pretilachlor-S (PE)
50.87 (7.12)
8.70 (2.88)
85.67 (8.98)
48.41 (5.96)
31.1 7.50
(1.05) 30.10 (5.44)
7.00 (2.00)
14.87 (3.69)
52.2
T3:. Cyhalofop butyl (PoE)
46.90 (6.83)
16.87 (4.06)
105.67 (10.27)
56.48 (7.08)
19.6 0.00
(0.71) 13.83 (3.22)
0.00 (0.71)
4.61 (1.71)
85.2
T4: Fenoxaprop p ethyl (PoE)
11.77 (3.38)
6.89 (2.26)
2.00 (1.47)
6.89 (2.58)
90.2 10.67 (3.03)
17.46 (4.10)
47.33 (6.62)
25.15 (4.78)
19.2
T5: Cyhalofop butyl (chlorim+metsul) (PoE)
44.03 (6.63)
18.34 (4.23)
111.00 (10.51)
57.79 (7.15)
17.7 1.03
(1.11) 3.63
(1.57) 6.00
(1.89) 3.55
(1.94) 88.6
T6: Fenoxaprop + (chlorim+ metsul) (PoE)
16.63 (4.00)
24.12 (4.91)
34.67 (5.85)
25.14 (4.96)
64.2 0.00
(0.71) 0.00
(0.71) 8.33
(2.41) 2.78
(1.46) 91.1
T7: Azimsulfuron (PoE)
25.63 (4.84)
12.54 (3.27)
80.67 (8.92)
39.61 (5.86)
43.6 0.00
(0.71) 6.87
(1.99) 0.67
(1.00) 2.51
(1.50) 91.9
T8:Bispyribac sodium (PoE)
34.43 (5.85)
30.98 (5.23)
124.33 (13.81)
63.25 (7.53)
10.0 2.67
(1.45) 0.00
(0.71) 0.00
(0.71) 0.89
(1.07) 97.1
T9: Fenoxaprop + Ethoxysulfuron (PoE)
11.77 (3.38)
0.22 (0.83)
1.33 (1.56)
4.44 (1.88)
93.7 7.20
(2.43) 16.45 (3.71)
43.67 (6.59)
22.44 (4.48)
27.9
T10: Oxyfluorfen (PE)+2,4-D (PoE)
13.47 (3.60)
8.17 (2.73)
6.67 (2.64)
9.43 (3.10)
86.6 0.73
(1.02) 0.82
(1.09) 0.33
(0.88) 0.63
(1.06) 98.0
T 112HW(20 &40 DAS)
0.70 (1.01)
4.11 (2.13)
13.00 (3.25)
5.94 (2.28)
91.5 0.50
(0.94) 1.00
(1.00) 4.33
(2.09) 1.94
(1.47) 93.8
T12: Weedy Check 56.33 (7.14)
37.12 (6.08)
117.33 (10.08)
70.26 (8.14)
- 12.67 (3.42)
33.03 (5.73)
47.67 (5.71)
31.12 (5.40)
-
S.Em ± -
(0.53) -
(0.54) -
(0.73) -
(0.79) -
- (0.75)
- (0.89)
- (1.06)
- (0.72)
-
LSD (P=0.05) -
(1.48) -
(1.49) -
(2.03) -
(2.19) -
- (2.07)
- (2.46)
- (2.94)
- (2.00)
-
Figures in parentheses indicate square root transformations √x + 0.5

87
Table S T 3.8: Efficacy of herbicides for controlling weeds in direct seeded rice on Height of plant (cm), No of tillers/m, No of
panicles /m.
Treatments
Height of plant (cm) No of tillers/m No of panicles / m
2011 2012 2013 Pooled mean
2011 2012 2013 Pooled mean
2011 2012 2013 Pooled mean
T1.: Pyrazosulfuron (3-7 DAS) 60.20 67.87 67.40 65.16 74.00 66.33 56.00 65.44 68.00 52.00 47.33 55.78
T2: Pretilachlor-S (PE) 60.20 57.97 69.96 62.71 88.00 33.33 62.67 61.33 74.00 21.67 49.33 48.33
T3:. Cyhalofop butyl (PoE) 61.13 59.33 69.04 63.17 107.33 40.67 78.00 75.33 98.67 22.00 61.33 60.67
T4: Fenoxa p ethyl (PoE) 62.93 56.20 67.39 62.18 88.67 88.00 86.00 87.56 77.33 64.33 78.67 73.44
T5: Cyhalofop butyl (chlorim+metsul) (PoE) 59.33 63.87 66.50 63.23 118.00 54.33 94.00 88.78 77.33 79.00 76.00 77.44
T6: Fenoxa p ethyl (PoE) + (chlorim+ metsul) (PoE) 60.20 59.13 57.37 58.90 66.00 80.67 78.00 74.89 65.33 65.33 65.33 65.33
T7: Azimsulfuron (PoE) 59.40 59.60 63.85 64.28 64.67 72.00 83.33 73.33 56.67 59.67 54.67 57.00
T8:Bispyribac sodium (PoE) 57.33 56.13 64.77 59.41 49.33 52.33 92.00 67.89 48.67 33.00 75.33 52.33
T9: Fenoxa p ethyl (PoE) + Ethoxy (PoE) 54.73 63.27 64.05 60.68 106.00 64.00 84.00 88.00 96.67 57.33 75.33 76.44
T10: Oxyfluorfen (PE)+2,4-D (PoE) 68.13 66.27 66.98 67.13 162.00 35.00 84.67 93.89 109.33 47.00 82.00 79.44
T 11 2HW (20 & 40 DAS) 66.27 63.00 67.21 65.51 102.00 100.33 80.67 94.33 146.67 26.67 74.00 85.78
T12: Weedy Check 64.97 67.03 71.83 67.94 78.67 76.67 52.67 69.34 74.67 67.67 36.67 59.67
S.Em ± 0.54 0.59 0.64 0.45 3.22 3.47 0.50 2.66 2.85 3.89 0.94 2.51
LSD (P=0.05) 1.49 1.62 (N.S) (N.S) 8.92 (N.S) 1.37 N.S 7.91 (N.S) 2.61 N.S.

88
Table S T 3.9: Efficacy of herbicides for controlling weeds in direct seeded rice on length of panicles (cm), grain yield, straw yield q/ha.
Treatments
Length of panicles (cm) Grain yield (q/ha) Straw yield q/ha
2011 2012 2013 Pooled mean
2011 2012 2013 Pooled mean
WI
% 2011 2012 2013
Pooled mean
T1.: Pyrazosulfuron (3-7 DAS) 17.73 19.00 21.06 19.26 21.71 9.73 15.29 18.91 40.7 23.88 20.00 18.56 20.81
T2.: Pretilachlor-S (PE) 15.33 16.43 18.18 16.65 15.41 11.60 16.35 14.45 54.7 17.16 12.60 18.65 16.14
T3:. Cyhalofop butyl (PoE) 18.13 17.27 21.24 18.88 14.60 9.51 20.99 18.37 42.4 16.71 19.97 23.97 20.22
T4: Fenoxaprop p ethyl (PoE) 16.93 17.40 21.33 18.56 21.01 10.97 18.40 16.79 47.3 23.54 12.67 21.67 19.29
T5: Cyhalofop butyl (chlorim+metsul) (PoE)
18.53 17.80 20.36 18.90 20.47 14.55 18.64 17.89 43.9 23.04 15.27 20.65 19.65
T6: Fenoxa p ethyl (PoE)+ (chlorim+ metsul) (PoE)
17.53 15.13 18.41 17.03 23.36 11.49 28.77 21.21 33.4 25.82 12.67 31.33 23.27
T7: Azimsulfuron (PoE) 17.33 16.13 22.01 18.49 24.16 14.99 23.39 20.85 34.6 26.93 15.80 25.63 22.79
T8:Bispyribac sodium (PoE) 16.87 16.80 19.89 17.85 19.92 10.41 23.09 17.81 44.1 21.74 11.60 26.63 19.99
T9: Fenoxa p ethyl (PoE) + Ethoxysulfuron (PoE)
17.60 18.47 19.57 18.55 32.51 12.56 23.15 22.74 28.6 36.27 13.77 25.91 25.32
T10: Oxyfluorfen (PE)+2,4-D (PoE) 19.13 18.07 23.86 20.35 28.59 18.56 42.67 29.94 6.1 31.54 21.53 46.33 33.13
T 11 :2HW (20 &40 DAS) 19.13 20.00 19.85 19.66 34.32 17.65 43.65 31.87 - 37.86 19.17 46.08 34.37
T12: Weedy Check 17.47 17.37 18.17 17.67 8.37 5.07 6.24 6.56 - 9.21 6.10 7.19 7.54
S.Em ± 0.36 0.45 0.31 0.25 0.56 0.47 0.72 1.21 - 0.58 0.47 0.76 1.16
LSD (P=0.05) (N.S) (N.S) (N.S) (N.S) 1.54 1.30 1.99 3.36 - 1.61 1.30 1.11 3.21

89
III) Effect on grain yield of rice:- All the treatments under study exhibited significant increase in grain yield of Kharif rice when compared with weedy check. The extent of increase in grain yield of rice over weedy check varied from 385 and 356 per cent due to the treatments of hand weeding twice at 20 & 40 DAS and PE application of Oxyfluorfen integration with PoE application of 2, 4-D respectively. Such increase was least due to application of Pretilachlor with Safner (120.3 percent). When these effective treatments were compared with standard check of hand weeding twice in terms of weed index PE application of Oxyfluorfen integration with PoE application of 2, 4-D was the best treatment which exhibited least weed growth (monocots & BLWs), highest weed control efficiency and the least weed index and thus it produced highest grain yield of Kharif rice. The second treatment in that order was PoE application of Fenoxaprop p ethyl + Ethoxysulfuon.
Table S T 3.10: Economics of different treatments.
Treatments Grain yield (q/ha)
Straw yield q/ha
Gross return (Rs/ha)
Cost of cultivati
on (Rs/ha)
Net returns (Rs/ha)
B.C. ratio
T1.: Pyrazosulfuron (3-7 DAS) 18.91 20.81 30446 31919 (-)1473 0.95
T2.: Pretilachlor-S (PE) 14.45 16.14 23289 30294 (-) 7005 0.77
T3:. Cyhalofop butyl (PoE) 18.37 20.22 29577 31676 (-) 2099 0.93
T4: Fenoxaprop p ethyl (PoE) 16.79 19.29 27114 31854 (-) 4740 0.85
T5: Cyhalofop butyl (chlorim+metsul) (PoE)
17.89 19.65 28800 32024 (-) 3224 0.90
T6: Fenoxaprop p ethyl (PoE) + (chlorim+ metsul) (PoE)
21.21 24.27 34142 33470 672 1.02
T7: Azimsulfuron (PoE) 20.85 22.79 33554 32259 1295 1.04
T8:Bispyribac sodium (PoE) 17.81 19.99 28714 33694 (-) 4980 0.85
T9: Fenoxa p ethyl (PoE) + Ethoxysulfuron (PoE)
22.74 25.32 36642 33476 3166 1.09
T10: Oxyfluorfen (PE)+2,4-D (PoE)
29.94 33.13 48223 37522 10701 1.28
T 11: 2HW (20 &40 DAS) 31.87 34.37 51242 41301 9941 1.24
T12: Weedy Check 6.56 7.54 10594 27317 (-)16723 0.39
Economics of treatments:- The highest net return of Rs. 10701/ha were obtained due to Oxyfluorfen (PE)+2,4-D (PoE) followed by hand weeding twice Rs. 9941/- with B:C ratio of 1.28 and1.24 respectively. Conclusion:- On the basis of three years study, it could be concluded that Oxyfluorfen (PE)+2,4-D (PoE) was the most effective and economical treatment followed by the treatment of hand weeding twice (20 &40 DAS) to control weeds effectively in direct seeded drilled rice during Kharif season and thus obtain higher productivity & profit.
Recommendation:- For effective and economical weed management in direct seeded drilled rice and inturn its higher productivity under conditions of south konkan coastal zone, pre emergence application of Oxyfluorfen @ 300 g/ha integrated with PoE application of 2,4-D @ 500 g/ha or hand weeding twice (20 &40 DAS) is recommended.

90 WSM Project :- Effect of recommended herbicides of rice crop on soil
microflora in rice-cowpea cropping system. Objective :- To find out effect of recommended herbicides of rice crop on
soil microflora of rice and cowpea during kharif and rabi season.
Name of the scientist Year Location
:- :- :-
Shri Y.R.Govekar 2013 Agronomy Farm, Collage of Agriculture ,Dapoli
Methodology :- A field experiment was conducted on herbicide trial in kharif Rice-rabi cowpea cropping system. The soil samples were collected from rhizo-sphere soil at 5 stages namly initial (Before application of herbicides and before sowing of the crops), 30 DAS, 60 DAS , at and after harvesting stage of rice crop during kharif season (The soil adhered to the plant roots).It was used for all the microbial analysis. The soil sample was analyzed for following observation a) Total bacterial population b) Total Fungal population c) Actinomyctes population. d) Free living nitrogen fixers. e) Phosphate solubilisers. h) i)
Dry wt of nodule (60DAS of cowpea crop) Number of nodule/Plant (60DAS of cowpea crop).
Treatments : T1 Oxidiargyl - Two spray-
1.Pre-emergence:-6 EC @ 0.1 kg a.i. ha-1 2-3 DAS 2.Post-emergence:- 6 EC @ 0.1 kg a.i. ha-1 45 DAS
T2 Pretilachlor :- Pre-emergence:-50 EC @ 0.75 kg a.i. ha-1 2-3 DAS T3 Butachlor:- Pre-emergence:-50 EC @ 1.5 kg a.i. ha-1 2-3 DAS T4 Pendimethalin:-Pre-emergence:-38.7EC@ 1.0 kg a.i. ha-1 2-3 DAS. T5 Weed free check T6 Weedy check Design:-RBD Replication:- Four Plot size:-5mx2m Crop and variety:-Ratnagiri-1-Rice and Konkan sadabahar-Cowpea Fertilizers:-Rice:-100:50:50 N,P2O5,K2OKg/ha Cowpea:- 25:50 N,P2O5,K2OKg/ha
Table no WSM 1:-Effect of recommended herbicides of rice crop on soil bacterial
population in rice- cowpea cropping system during kharif season.
Treatment Crop:-Rice
Bacteria CFU x 106/gm of soil
Initial Observation
30 DAS 60 DAS At harvest After harvest
T1:- Oxidiargyl 12.81 26.17 23.58 27.56 12.19
T2:- Pretilachlor. 12.55 26.02 32.67 28.07 12.02
T3:- Butachlor. 11.97 23.10 29.17 28.18 11.12
T4:- Pendimethalin. 11.39 22.99 27.44 26.16 11.03
T5:- Weed free check 10.41 33.43 38.88 32.29 13.82
T6:- Weedy check 11.21 29.80 32.76 28.46 13.03
S Em. + 1.5 1.05 1.99 2.36 1.76
C.D. at 5% NS 3.16 5.99 NS NS
1) Total bacterial population: - The data of total bacterial population is presented in table
noWSM 1

91 The total bacterial population in soil were significantly influenced by
weed control measures at 30DAS, 60DAS. They were found significantly less in recommended
herbicides and weedy check as compared to the weed free treatment at 30DAS and 60DAS.
The bacterial population was also found significantly less at recommneded herbicides
treatments as compared to weedy check at 30DAS and at par with weedy check at
60DAS(Except oxadiargyl at 60DAS).The weed control measures was found to be non-
significant at initial(Before sowing and before application of recommended herbicides),at and
after harvesting stage of the rice crop.
Table no WSM 2:-Effect of recommended herbicides of rice crop on soil fungal population in
rice-cowpea cropping system during kharif season.
Treatment Crop:-Rice
Fungi CFU x 104/gm of soil
Initial obsevation
30 DAS 60 DAS At harvest After harvest
T1:- Oxidiargyl 5.02 9.18 11.63 13.18 4.39
T2:- Pretilachlor. 6.41 9.45 15.71 13.97 5.77
T3:- Butachlor. 6.22 9.08 15.81 13.80 5.42
T4:- Pendimethalin. 5.40 7.98 14.62 13.14 5.19
T5:- Weed free check 4.30 17.98 21.21 15.66 6.22
T6:- Weedy check 4.21 14.71 17.62 14.99 4.03
S Em. + 1.06 0.92 1.04 1.78 0.70
C.D. at 5% NS 2.78 3.13 NS NS
2) Total fungal population: - The data of total fungal population is presented in table no.2
The total fungal population in soil were significantly influenced by weed
control measures at 30DAS, 60DAS. They were found significantly less in recommended
herbicides and weedy check as compared to the weed free treatment at 30DAS and 60DAS.
The fungal population was also found significantly less at recommneded herbicides treatments
as compared to weedy check at 30DAS and at par with weedy check at 60DAS(Except
oxadiargyl at 60DAS).The weed control measures was found to be non-significant at
initial,(Before sowing and before application of recommended herbicides) at and after
harvesting stage of the rice crop
Table no WSM 3:-Effect of recommended herbicides of rice crop on soil Actinomycetes
population in
rice-cowpea cropping system during kharif season.
Treatment Crop:-Rice
Actinomycetes CFU x 104/gm of soil.
Initial obsevation
30 DAS 60 DAS At harvest After harvest
T1:- Oxidiargyl 2.55 2.40 1.94 2.10 1.96
T2:- Pretilachlor. 2.29 2.36 2.72 3.02 2.09
T3:- Butachlor. 1.75 2.19 2.96 2.84 1.86
T4:- Pendimethalin. 2.40 2.10 2.49 2.75 2.09
T5:- Weed free check 2.79 5.95 6.34 5.83 2.92
T6:- Weedy check 1.80 3.70 3.94 3.14 2.45
S Em. + 0.67 0.70 0.54 1.25 0.67
C.D. at 5% NS 2.11 1.63 NS NS
3) Total actinomycetes population: - The data of actinomycetes population is presented in
table no WSM 3
The total actinomycetes population in soil were significantly influenced by
weed control measures at 30DAS, 60DAS. They were found significantly less in recommended
herbicides and weedy check as compared to the weed free treatment at 30DAS and 60DAS.
The actinomycetes population in recommended herbicides was found at par with weedy check

92 at 30DAS and 60DAS (Except oxadiargyl at 60DAS).The weed control measures was found to
be non-significant at initial observation(Before sowing and before application of recommended
herbicides) at and after harvesting stage of the rice crop.
Table no WSM 4:-Effect of recommended herbicides of rice crop on free living nitrogen fixers
in rice-cowpea cropping system during kharif season.
Treatment Crop:-Rice
Free living nitrogen fixers CFU x 103/gm of soil
Initial observation
30 DAS 60 DAS At harvest After harvest
T1:- Oxidiargyl 2.73 7.64 7.75 8.90 2.53
T2:- Pretilachlor. 3.42 7.32 10.94 9.68 3.04
T3:- Butachlor. 1.69 7.26 10.18 9.32 2.84
T4:- Pendimethalin. 2.75 6.27 10.16 9.07 2.46
T5:- Weed free check 2.70 15.20 17.97 11.19 3.90
T6:- Weedy check 2.18 11.26 14.14 9.87 2.01
S Em. + 0.83 1.04 1.35 0.96 0.74
C.D. at 5% NS 3.13 4.06 NS NS
5) Total free living nitrogen fixers: - The data of free living nitrogen fixers is presented in
table no. WSM 5
The free living nitrogen fixers in soil were significantly influenced by
weed control measures at 30DAS, 60DAS. The population was found significantly less in
recommended herbicides as compared to the weed free treatment at 30DAS and 60DAS and at
par with weedycheck treatment at 60DAS. The free living nitrogen fixers was also found
significantly less at recommneded herbicides treatments as compared to weedy check at
30DAS and at par with weedy check at 60DAS (Except oxadiargyl at 60DAS).The weed control
measures was found to be non-significant at initial (Before sowing and before application of
recommended herbicides) at and after harvesting stage of the rice crop.
Table no WSM 5:-Effect of recommended herbicides of rice crop on phosphate solubilisers in
rice-cowpea cropping system during kharif season.
Treatment Crop:-Rice
Phosphate solubilisers CFU x 103/gm of soil
Initial observation
30 DAS 60 DAS At harvest After harvest
T1:- Oxidiargyl 1.92 9.64 9.01 10.05 1.86
T2:- Pretilachlor. 1.90 8.91 12.31 9.98 1.55
T3:- Butachlor. 3.35 8.13 10.94 9.63 3.05
T4:- Pendimethalin. 3.12 8.04 10.31 9.16 3.15
T5:- Weed free check 2.56 16.72 18.43 14.14 2.05
T6:- Weedy check 2.16 13.77 13.27 10.82 1.98
S Em. + 0.71 0.78 1.30 2.16 0.74
C.D. at 5% NS 2.37 3.93 NS NS
5) Total phosphate solublisers: - The data of phosphate solubilsers is presented in table no
WSM 5
The total phosphate solubilisers in soil were significantly
influenced by weed control measures at 30DAS, 60DAS. They were found significantly less in
recommended herbicides and weedy check as compared to the weed free treatment at 30DAS
and 60DAS. The phosphate solubilisers was also found significantly less at recommneded
herbicides treatments as compared to weedy check at 30DAS and at par with weedy check at
60DAS(Except oxadiargyl at 60DAS).The weed control measures was found to be non-
significant at initial(Before sowing and before application of recommended herbicides) at and
after harvesting stage of the rice crop.

93 Summary
The experiment was conducted to see the effects of recommended
herbicides of rice on soil microflora of rice and cowpea crop under rice-cowpea cropping
system.The microflora such as total bacterial population, total fungal
population,actinomycetes,free living nitrogen fixers and phosphate solubilisers were found
significantly less in recommended herbicides and weedy check as compared to the weed free
treatment at 30DAS and 60DAS. They were also found significantly less at recommneded
herbicides treatments as compared to weedy check at 30DAS(Except actinomycetes) and at
par with weedy check at 60DAS(Except oxadiargyl at 60DAS).The weed control measures was
found to be non-significant at initial(Before sowing and before application of recommended
herbicides) at and after harvesting stage of the rice crop.
Conclusion
The estimated microflora such as total bacterial population,total fungal
population,actinomycetes,free-living nitrogen fixers and phosphate solubilisers adversly
affected due to the application of all mention recommended herbicides at 30DAS and herbicide
oxidiargyl at 60DAS, of rice crop.The adverse effect of oxidiargyl traetment on microbial
population till 60DAS may be due to the additional dose of herbicide oxidiargyl at
45DAS.However the population in the recommended herbicides maintain their status at later
stage of the crop.

94 VIIIT.S.P. Programme:-
The farmar ralley regarding awareness on weed management in different crops was
organized at Nandgaon (Tribal area) Tal:- Karjat dist:- Raigad on occasion of world food day on
17th October, 2012. The awareness amongst the TSP farmers regarding management of weeds
in different crops by use of herbicide, hand hoes and weeding hook. The programme was
organized in collaboration with state Agril Deptt and AICRP –on weed control Dapoli centre
under the chairmanship of Dr. U. V. Mahadkar, Head, Deptt of Agronomy, Dr. B. S. Konkan.
Krish. Vidyapeeth. Dapoli and shri Ranchandra, Bramhande and shri V.R.Deshmukh chairman of
farmer and scientists group was acted as chief guest of this programme. In this programme Dr,
L. S. Chavan, Prof of Agronomy Deptt, & shri, Dr. N. M. Mhaskar, Tuber crop scheme, wakwali &
Smt Tambade madam, TAO,Karjat, State Agril. Deptt were present and guided to the farmers.
About 250 Farmers was participated for one day awareness on weeed management programme.
Hand tools and impliments, along with some herbicides are distributed to ST farmers in
tribal areas of Raigad, Thane districts
Sr No Particulars Total number
1 Khurpi (weeding hook) 481
2 Toothed spades 400
3 Knapsack Sprayer with plastic hood 18
4 Herbicides :Oxadiargyl,Pendimethalin
and paraquat
Oxadiargyl (35 gm 100 packets)
Pendimethalin (5 litres) and
paraquat (10Litres)
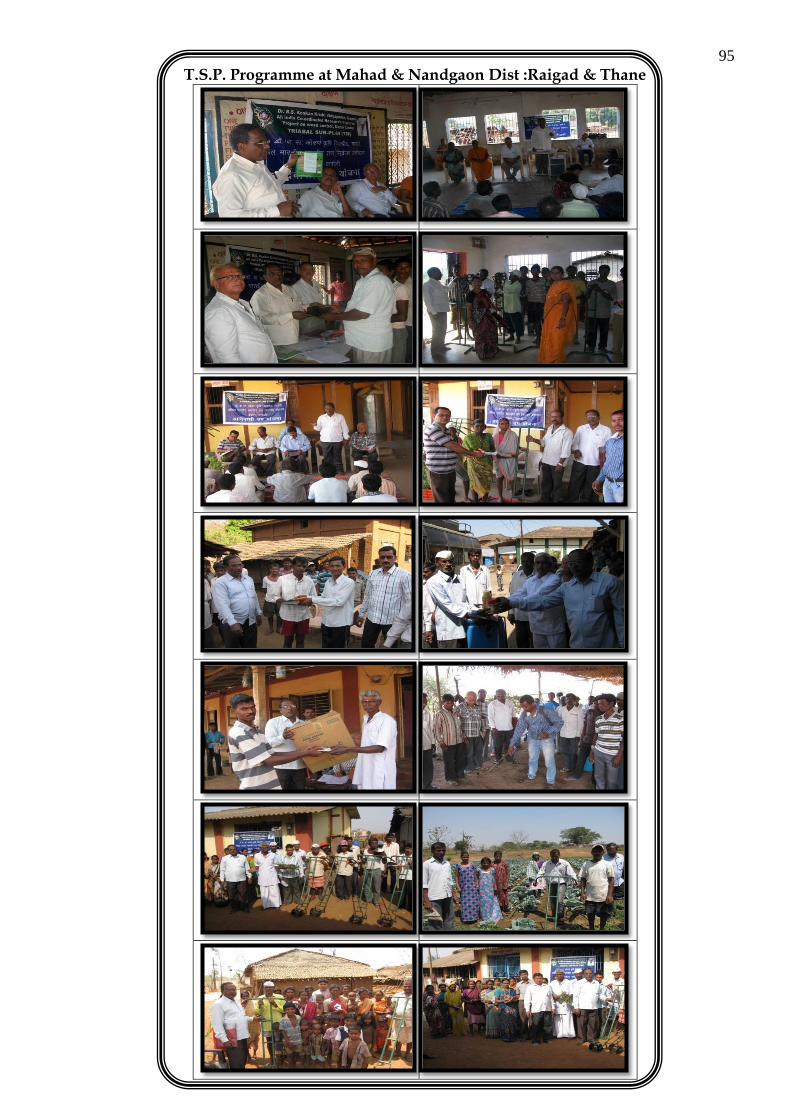
95
T.S.P. Programme at Mahad & Nandgaon Dist :Raigad & Thane

96
IX. List of publications (research, abstract of seminar/symposia/conference,
technical/extensionbulletin, popular articles, books/books chapter,
radio/TV talks etc.
1. List of publications:
1. Mane M.J., V.B. Nevase, L.G.Pawar, V.V. Sagvekar, S.A. Chavan, and U.V. Mahadkar,
Effect of Time of Sowing on Performance of Direct Seeded Dibbled Rice National seminar,
Climate Resilient Rice Production Under Rainfed Ecosystem, May 20-22-2013 Dr. BSKKV
agricultural research station Shirgaon Dist Ratnagiri.
2. Mane M.J., V.B. Nevase, L.G.Pawar, V.V. Sagvekar, S.A. Chavan, and U.V. Mahadkar,
Performance of Rice Establishment Techniques on Yield of Rice ,National seminar, Climate
Resilient Rice Production Under Rainfed Ecosystem, May 20-22-2013 Dr. BSKKV agricultural
research station Shirgaon Dist Ratnagiri 415 629 (MS).
3. Mane M.J., V.B. Nevase, L.G.Pawar, V.V. Sagvekar, S.A. Chavan, and U.V. Mahadkar,
Response of Weed Control Methods on Performance of Direct Seeded Dibbled Rice,National
seminar, Climate Resilient Rice Production Under Rainfed Ecosystem, May 20-22-2013 Dr.
BSKKV agricultural research station, Shirgaon Dist Ratnagiri 415 629 (MS).
4. Mane M.J., V.B. Nevase, L.G.Pawar, V.V. Sagvekar, S.A. Chavan, and U.V. Mahadkar,
Influence of Weed Management Practices on Performance of Rice, National seminar, Climate
Resilient Rice Production Under Rainfed Ecosystem, May 20-22-2013 Dr. BSKKV agricultural
research station, Shirgaon Dist Ratnagiri 415 629 (MS).
2. University Publication (Marathi) : NIL
3. Radio talk : NIL
4 Teaching Assignments
1. M.J. Mane:-
Sr. No. Title Course No. UG/PG
1. Principles and practices of weed management Agro-503 M.Sc. (Agri.)
2. Weed Management Agro-359 B.Sc. (Agri.)
3 Organic Farming H/Agro-243 B.Sc. (Hort)
4 Principles and practices in organic Farming Agro-506 M.Sc. (Agri.)
5 Dryland farming and watershed management Agro-512 M.Sc. (Agri.)
2. Y.R. Govekar:-
Sr. No. Title Course No. UG
1. Introductory microbiology MIBO-111 B.Sc. (Hort.)
2. Agricultural microbiology MIBO-121 B.Sc. (Agri.)
IX List of trainings/awareness campaign 1. Parthenium Awareness Programme 2013
At present parthenium is a major problem in all districts of Maharashtra except
Sindhudurg, Ratnagiri and Raigad district. As a part of parthenium awareness week during 16 th
to 22 th August, 2013 one programme was organized for farmers and citizens during the year
2013 in collaboration with Deptt of Agriculture Mharashtra state.
Parthenium Awareness programme was organized at various places at Tal. Patan Dist. Satara and Palghar, Dahanu, Bordi & Talasari Tahsil of Thane district. In this programme organizing rally, ill effects of parthenium explained to the students, farmers from differents village, farmers, staff of colleges were realized the ill effects of parthenium. Total 396 students, farmers, teachers were participated in parthenium Awareness programme.

97
Parthenium Awareness Programme 2013
In state of Maharashtra Parthenium Awareness Week was celebrated (Konkan region) from 16-
22 August, 2013. During the week, various events like rallies, group discussion, distribution of
pamphlet, folders & display of posters were conducted at various places.
Sr.no. Particular Date Place No. of participants
1. Explained biological chemical & cultural for control of Parthenium & display of video film on Parthenium
16/8/2013 College of Agriculture, Deptt. of Agronomy, Dapoli
50 Students
2.
Display of video film on ill effects & management of parthenium & organized a rally & explained harmful effects to the crops, livestock & human being
19/8/2013
Shri.kshetrapal vidyalaya, Adul,
54 Students 5 Teachers
2.
Display of video film on ill effects & management of parthenium & organized a rally & explained harmful effects to the crops, livestock & human being
19/8/2013
Agriculture School Malharpeth
42 Students 5 Teachers
4. Display of video film on ill effects & management of parthenium 21/8/2013
Agriculture Deptt. Office, Palghar,
28 officer & field staff of
4 Tahsil
5. Display of video film on ill effects & management of parthenium 21/8/2013
Shri. Sonopanth Dandekar High school, Palghar
67 Students 5 Staff
6.
Demonstration on uprooting of parthenium and awareness of parthenium
21/8/2013 22/8/2013
Palghar Research station farm & near Omkar Darshan apartment, Masoli area at Dahanu.
25
7. Display of video film on ill effects & management of parthenium 22/8/2013
Agriculture school Kosbad hill
74 Students 4 Staff
8. Display of video film on ill effects & and management of parthenium
22/8/2013 Panchyat samiti sabhagrah, Talasari.
33 farmers & Gramsevak.
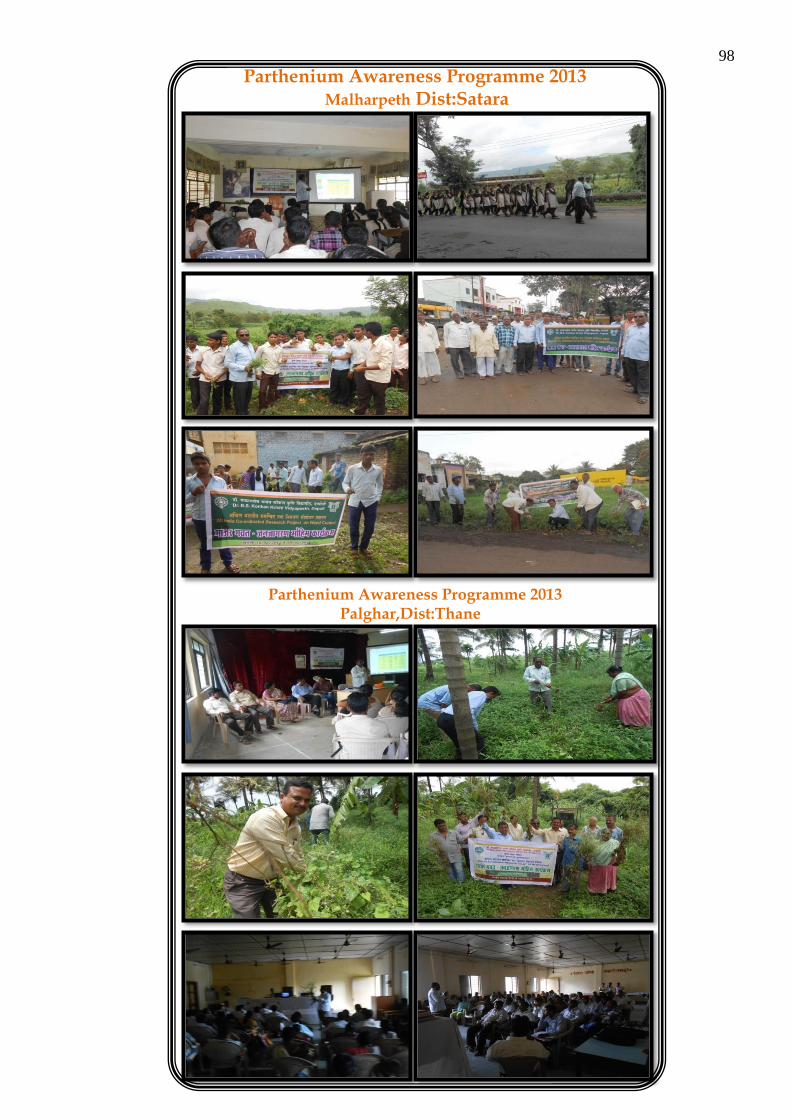
98
Parthenium Awareness Programme 2013 Malharpeth Dist:Satara
Parthenium Awareness Programme 2013
Palghar,Dist:Thane
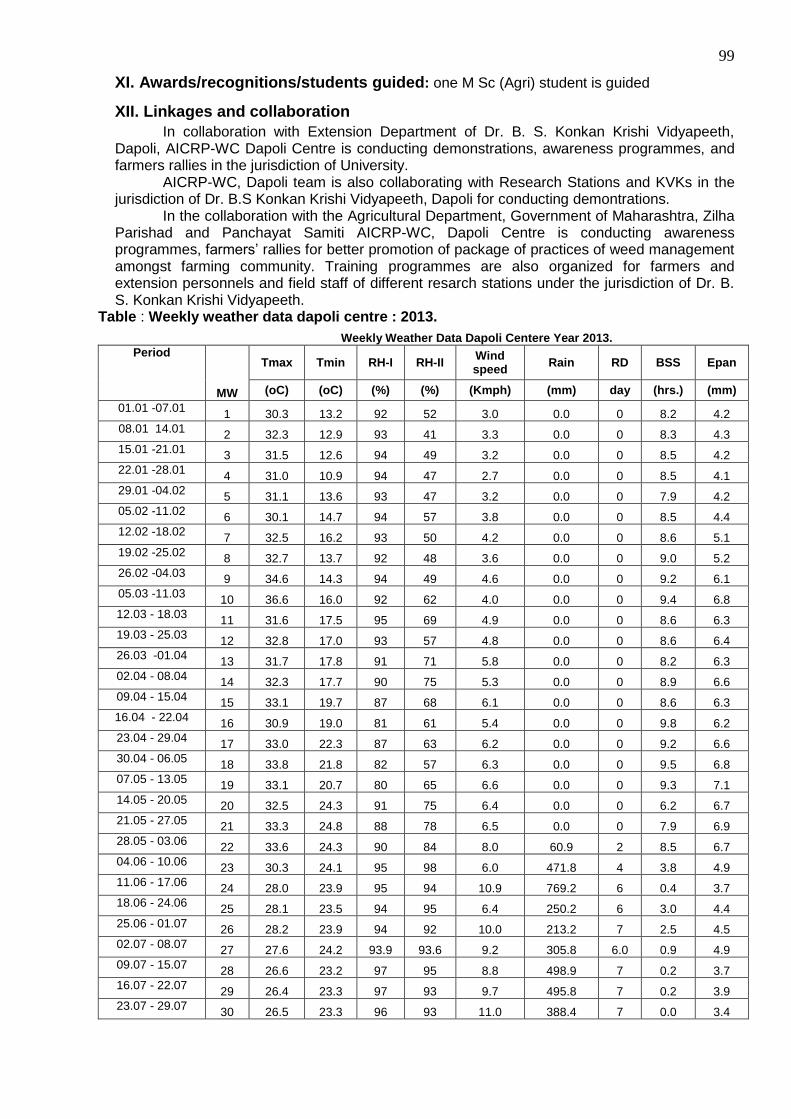
99
XI. Awards/recognitions/students guided: one M Sc (Agri) student is guided
XII. Linkages and collaboration
In collaboration with Extension Department of Dr. B. S. Konkan Krishi Vidyapeeth, Dapoli, AICRP-WC Dapoli Centre is conducting demonstrations, awareness programmes, and farmers rallies in the jurisdiction of University. AICRP-WC, Dapoli team is also collaborating with Research Stations and KVKs in the jurisdiction of Dr. B.S Konkan Krishi Vidyapeeth, Dapoli for conducting demontrations. In the collaboration with the Agricultural Department, Government of Maharashtra, Zilha Parishad and Panchayat Samiti AICRP-WC, Dapoli Centre is conducting awareness programmes, farmers’ rallies for better promotion of package of practices of weed management amongst farming community. Training programmes are also organized for farmers and extension personnels and field staff of different resarch stations under the jurisdiction of Dr. B. S. Konkan Krishi Vidyapeeth.
Table : Weekly weather data dapoli centre : 2013.
Weekly Weather Data Dapoli Centere Year 2013.
Period
MW
Tmax Tmin RH-I RH-II Wind speed
Rain RD BSS Epan
(oC) (oC) (%) (%) (Kmph) (mm) day (hrs.) (mm)
01.01 -07.01 1 30.3 13.2 92 52 3.0 0.0 0 8.2 4.2
08.01 14.01 2 32.3 12.9 93 41 3.3 0.0 0 8.3 4.3
15.01 -21.01 3 31.5 12.6 94 49 3.2 0.0 0 8.5 4.2
22.01 -28.01 4 31.0 10.9 94 47 2.7 0.0 0 8.5 4.1
29.01 -04.02 5 31.1 13.6 93 47 3.2 0.0 0 7.9 4.2
05.02 -11.02 6 30.1 14.7 94 57 3.8 0.0 0 8.5 4.4
12.02 -18.02 7 32.5 16.2 93 50 4.2 0.0 0 8.6 5.1
19.02 -25.02 8 32.7 13.7 92 48 3.6 0.0 0 9.0 5.2
26.02 -04.03 9 34.6 14.3 94 49 4.6 0.0 0 9.2 6.1
05.03 -11.03 10 36.6 16.0 92 62 4.0 0.0 0 9.4 6.8
12.03 - 18.03 11 31.6 17.5 95 69 4.9 0.0 0 8.6 6.3
19.03 - 25.03 12 32.8 17.0 93 57 4.8 0.0 0 8.6 6.4
26.03 -01.04 13 31.7 17.8 91 71 5.8 0.0 0 8.2 6.3
02.04 - 08.04 14 32.3 17.7 90 75 5.3 0.0 0 8.9 6.6
09.04 - 15.04 15 33.1 19.7 87 68 6.1 0.0 0 8.6 6.3
16.04 - 22.04 16 30.9 19.0 81 61 5.4 0.0 0 9.8 6.2
23.04 - 29.04 17 33.0 22.3 87 63 6.2 0.0 0 9.2 6.6
30.04 - 06.05 18 33.8 21.8 82 57 6.3 0.0 0 9.5 6.8
07.05 - 13.05 19 33.1 20.7 80 65 6.6 0.0 0 9.3 7.1
14.05 - 20.05 20 32.5 24.3 91 75 6.4 0.0 0 6.2 6.7
21.05 - 27.05 21 33.3 24.8 88 78 6.5 0.0 0 7.9 6.9
28.05 - 03.06 22 33.6 24.3 90 84 8.0 60.9 2 8.5 6.7
04.06 - 10.06 23 30.3 24.1 95 98 6.0 471.8 4 3.8 4.9
11.06 - 17.06 24 28.0 23.9 95 94 10.9 769.2 6 0.4 3.7
18.06 - 24.06 25 28.1 23.5 94 95 6.4 250.2 6 3.0 4.4
25.06 - 01.07 26 28.2 23.9 94 92 10.0 213.2 7 2.5 4.5
02.07 - 08.07 27 27.6 24.2 93.9 93.6 9.2 305.8 6.0 0.9 4.9
09.07 - 15.07 28 26.6 23.2 97 95 8.8 498.9 7 0.2 3.7
16.07 - 22.07 29 26.4 23.3 97 93 9.7 495.8 7 0.2 3.9
23.07 - 29.07 30 26.5 23.3 96 93 11.0 388.4 7 0.0 3.4

100 30.07 - 05.08
31 27.1 23.7 95 92 11.8 253.4 7 2.4 3.5
06.08 - 12.08 32 28.1 23.9 92 85 8.4 98.0 7 4.1 5.0
13.08 - 19.08 33 27.8 24.0 96 87 7.9 138.4 7 2.2 4.5
20.08 - 26.08 34 28.3 23.8 91 87 7.3 106.4 6 4.3 4.7
27.08 - 02.09 35 28.7 22.9 93 86 4.1 41.2 4 6.0 5.1
03.09 - 09.09 36 29.4 23.1 91 87 3.8 18.4 3 5.8 5.2
10.09 - 16.09 37 29.9 23.2 94 88 4.1 71.4 5 2.9 3.9
17.09 - 23.09 38 28.2 23.7 94 92 3.8 78.0 4 1.9 4.1
24.09 - 30.09 39 28.1 23.0 96 90 5.2 113.6 6 3.6 3.9
01.10 - 07.10 40 28.9 23.4 95 85 4.2 306.4 5 4.0 4.6
08.10 - 14.10 41 29.8 22.4 91 84 3.5 39.8 1 4.6 5.6
15.10 - 21.10 42 32.3 23.4 90 74 2.8 8.8 1 6.1 5.0
22.10 – 28.10 43 32.9 22.7 91 76 3.4 10.4 2 7.3 4.3
29.10 – 04.11 44 32.3 21.5 91 66 3.1 0.0 0 8.1 5.7
05.11 – 11.11 45 32.6 19.6 95 58 2.7 0.0 0 7.7 6.2
12.11 – 18.11 46 31.6 16.4 90 47 2.9 0.0 0 8.8 6.0
19.11 – 25.11 47 33.2 16.1 92 52 2.6 0.0 0 8.9 5.4
26.11 – 02.12 48 32.8 19.9 91 61 2.4 0.0 0 7.7 5.3
03.12 – 09.12 49 32.2 17.1 90 62 2.7 9.6 1 8.4 4.2
10.12 – 16.12 50 31.8 11.0 86 51 2.8 0.0 0 7.4 4.6
17.12 – 23.12 51 30.9 10.9 89 71 2.3 0.0 0 7.9 4.3
24.12 – 31.12 52 30.9 15.6 90 66 3.4 0.0 0 7.2 4.2
Total 4748mm
List of Herbicides Used:
1. Butachlor 50 EC 2. Oxadiargyl 6 EC & 80 WP 3. Fenoxaprop –p-ethyl 9EC 4. 2,4-D 80 %WP (Na Salt)
5. Paraquat 24 SL 6. Glyphosate 41 SL 7. Pretilachlor –S 50 EC 8. Pyrazosulfuron 10 G 9. Imazythepyr10 SL 10. Cyhalofop butyl 11. Fenoxaprop + (chlorimuron + metsulfuron) 12. Cyhalofop butyl + (chlorimuron + metsulfuron) 13. Azimsulfuron 14. Fenoxaprop + Ethoxysulfuron 15 Oxyfluorfen + 2,4-D 16 Bispyribac-Na
---------------x----------------x----------------