oxidative properties and thermal polymerization of …
TRANSCRIPT

The Pennsylvania State University
The Graduate School
Department of Chemical Engineering
OXIDATIVE PROPERTIES AND THERMAL POLYMERIZATION OF
SOYBEAN OIL AND APPLICATION IN GEAR LUBRICANTS
A Thesis in
Chemical Engineering
by
Mert Arca
© 2011 Mert Arca
Submitted in Partial Fulfillment
of the Requirements
for the Degree of
Master of Science
August 2011

ii
The thesis of Mert Arca was reviewed and approved* by the following:
Joseph M. Perez
Senior Research Scientist of Chemical Engineering
Thesis Adviser
Andre Boehman
Professor of Fuel Science and Materials Science and Engineering
Robert Rioux
Assistant Professor of Chemical Engineering
Sevim Z. Erhan
Adjunct Professor of Chemical Engineering
USDA, REE, ARS, NAA, ERRC Eastern Regional Research Center Director
Andrew Zydney
Professor of Chemical Engineering
Head of the Department of Chemical Engineering
*Signatures are on file in the Graduate School.

iii
ABSTRACT
The use of lubricants that are based on vegetable oils is increasing rapidly due to their
biodegradability, low ecotoxicity and excellent tribological properties. Biobased lubricants have
lower coefficient of friction, improved wear characteristics, a higher viscosity index, and lower
volatility and flashpoints than mineral based oils. Polymerized vegetable oils have found their
way into many industrial applications such as inks, polymers, and hydraulic fluids. The initial
objective of this thesis is to formulate a bio-based gear lubricant from thermally polymerized
vegetable oils.
In order to synthesize a variety of new gear oil formulations of desired properties, materials
without the glycerol moiety, which is naturally in thermally modified soybean oil were desired. It
was thought that Diels-Alder chemistry could be used where the thermally polymerized soybean
oil could be transesterified with the desired alcohol leading to the desired thermally modified
alkyl ester products. However, examinations of resultant materials showed that the cyclohexene
structures expected from the type reactions are not found in these products. A new structure for
thermal polymerization is suggested.
Biobased gear oil was developed from soybean oil, capitalizing on the knowledge of the new
structure. The soybean oil was first thermally polymerized and then mixed with additives and
diluents. The effect of pour point depressants, co-base oils, anti-oxidants and anti-wear additives
are reported. The final formulation of biobased gear oil gives excellent viscosimetric and wear
protection properties. Lubricant testing results, including oxidation resistance are comparable to
or better than commercially available gear oils.
The last study of the thesis investigated oxidative degradation kinetics of vegetable base fluids.
Thermal stability and deposit formation characteristics of soybean oil are studied by an
isothermal thermogravimetric analyzer. Heating rate, catalysis, isothermal time, purge flow and
oxygen diffusion are studied at different temperatures. Kinetic rates found from the new method
are comported with the well-known Penn State Micro Oxidation test.
In summary this thesis has three main objectives. The first objective is to understand the
structure of thermally polymerized vegetable oils. The second one is to formulate a gear
lubricant from thermally polymerized vegetable oils. The final objective of this study is to

iv
develop a method to calculate the oxidation kinetics of lubricants utilizing a readily available
thermogravimetric analyzer. Soybean oil is predominantly used as a vegetable oil due to the
technical properties and its worldwide availability.

v
Table of Contents
LIST OF FIGURES ..................................................................................................................... viii
LIST OF TABLES .......................................................................................................................... x
ABBREVIATIONS ....................................................................................................................... xi
ACKNOWLEDGEMENTS ......................................................................................................... xiii
Chapter 1 Introduction ............................................................................................................... 1
Chapter 2 Chemical Structure of Thermally Polymerized Vegetable Oils ............................. 19
2.1. Introduction .................................................................................................................... 19
2.2. Experimental .................................................................................................................. 20
2.2.1. Preparation of the materials .................................................................................... 20
2.2.1.1. Thermal Polymerization................................................................................ 21
2.2.1.2. Polymerization in glass reactor ..................................................................... 21
2.2.1.2.1. Polymerization in Steel Reactor ................................................................. 23
2.2.1.3. Transesterification......................................................................................... 25
2.2.2. Characterization of the materials ............................................................................ 26
2.2.2.1. Gardner-Holdt Viscometer............................................................................ 26
2.2.2.3. Nuclear Magnetic Resonance ....................................................................... 27
2.2.2.4. Gel Permeation Chromatography ................................................................. 27
2.2.2.5. Pressurized Scanning Differential Calorimetry ............................................ 28
2.3. Results ............................................................................................................................ 29
2.3.1. Nuclear Magnetic Resonance ................................................................................. 29
2.3.2. Gel Permeation Chromatography ........................................................................... 36
2.3.3. Pressurized Differential Scanning Calorimetry ...................................................... 37
2.4. Discussion ...................................................................................................................... 38
2.4.1. Diels Alder Reaction ............................................................................................... 38
2.4.2. Chemical Structure.................................................................................................. 41
2.5. Future Work ................................................................................................................... 42
Chapter 3 Biobased Gear Lubricant by Using Thermally Polymerized Soybean Oil ............. 43
3.1. Introduction .................................................................................................................... 43

vi
3.2. Experimental .................................................................................................................. 44
3.2.1. Thermal Polymerization.......................................................................................... 44
3.2.2. Low Temperature Properties................................................................................... 44
3.2.3. Viscosity and Viscosity Index ................................................................................ 45
3.2.4. Anti-Oxidant Additive Study .................................................................................. 45
3.2.5. Anti-Wear Additive Study ...................................................................................... 46
3.3. Results ............................................................................................................................ 48
3.3.1. Viscosity of Base Fluids ......................................................................................... 48
3.3.2. Improvement of Low Temperature Properties ........................................................ 50
3.3.3. Improvement of Oxidation Stability ....................................................................... 51
3.3.4. Improvement of Wear Prevention Properties ......................................................... 53
3.3.5. Final Lubricant Package ......................................................................................... 54
3.4. Comparison .................................................................................................................... 54
3.4.1. Lubricity .................................................................................................................. 54
3.4.2. Oxidation Stability .................................................................................................. 56
3.4.3. Temperature-Viscosity Properties .......................................................................... 57
3.5. Conclusion and Future Work ......................................................................................... 58
Chapter 4 Oxidation Studies with Thermogravimetric Analysis............................................. 59
4.1. Introduction .................................................................................................................... 59
4.1.1. Oxidative Behavior of Oils ..................................................................................... 60
4.2. Experimental .................................................................................................................. 60
4.2.1. Materials ................................................................................................................. 60
4.2.2. Methods................................................................................................................... 61
4.2.2.1. Thermogravimetric Analysis ........................................................................ 61
4.2.2.2. Penn State Micro Oxidation Reactor ............................................................ 62
4.3. Results ............................................................................................................................ 64
4.3.1. Thermogravimetric Analysis .................................................................................. 64
4.3.2. Sample Size ............................................................................................................. 64
4.3.3. Isothermal Time and Temperature .......................................................................... 66

vii
4.3.4. Pan Selection ........................................................................................................... 67
4.3.5. Final Experimental Conditions ............................................................................... 67
4.4. Results ............................................................................................................................ 68
4.4.1. Kinetic Rate Calculations in TGA .......................................................................... 68
4.4.2. Application to Oxidation Model ............................................................................. 72
4.4.3. Comparison of Oxidation Model with PSMO ........................................................ 73
4.4.4. Antioxidant Effect in Oxidation Model .................................................................. 78
4.4.5. Synthetic Fluid Effect ............................................................................................. 79
4.5. Conclusion ...................................................................................................................... 80
Chapter 5 Conclusions ............................................................................................................. 81
Appendix A: Selected NMR Results ............................................................................................ 82
Appendix B: Selected GPC Results .............................................................................................. 91
Appendix C: Selected PDSC Onset Temperatures ....................................................................... 94
Appendix D: Selected TGA Graphs ............................................................................................. 95
Appendix E: Kinetic Parameters Calculated for SBO .................................................................. 98
Appendix F: Matlab ® M-File for Kinetic Model ...................................................................... 102
Appendix G: Kinetic Parameters Calculated for PAO8 ............................................................. 105
References ................................................................................................................................... 109

viii
LIST OF FIGURES
Figure 1: 3-D Structure of TAG [16] .............................................................................................. 2
Figure 2: Diels Alder Reaction [35]................................................................................................ 5
Figure 3: Diels Alder Reaction in Vegetable Oils [36]................................................................... 5
Figure 4: GC Spectra of Thermally Polymerized Soybean Oil [37] ............................................... 6
Figure 5: FT-IR Spectra of SBO and Polymerized (Bodied) SBO [37] ......................................... 7
Figure 6 1H NMR of Soybean Oil (SBO) and Polymerized Soybean Oil (PSBO) [39] ................. 8
Figure 7: Transesterification of Triglyceride with Methanol [54] ................................................ 10
Figure 8: USDA’s Biobased Label [61]........................................................................................ 14
Figure 9: Polymerization and Transesterification of Soybean Oil and Polymerization of Methyl
Esters ............................................................................................................................................. 20
Figure 10: Calculated Vapor Pressures of Palmitic Acid Methyl Ester [83]. ............................... 23
Figure 11: Steel Reactor................................................................................................................ 25
Figure 12: PDSC Exoterm ............................................................................................................ 28
Figure 13:1H NMR Spectra for (a) Methly Linoleate, (b) Polymerized Methly Linoleate .......... 30
Figure 14:13
C NMR Spectra for (a) Methly Linoleate, (b) Polymerized Methly Linoleate ......... 31
Figure 15: NMR, IV comparison .................................................................................................. 33
Figure 16: HSQC 1H/
13C of Trans 10 ........................................................................................... 34
Figure 17: HMBC 1H/
13C of Trans 10 .......................................................................................... 35
Figure 18: 1H NMR of Trans 11................................................................................................... 36
Figure 19: Onset Temperature of SBO and Selected PSBO ......................................................... 38
Figure 20: 1H and 13C NMR Predictions for Cyclohexene ......................................................... 39
Figure 21: Further Polymerization of D-A Cyclohexene ............................................................. 40
Figure 22: 13
C and 1H Estimations for Proposed Structure........................................................... 41
Figure 23: Four Ball Test Unit ...................................................................................................... 47
Figure 24: Pour Point Depressant Effect in Trans 25 Polymerized Soybean Oil ......................... 50
Figure 25: Comparison of low temperature properties of synthetic fluids in Trans 25 ................ 51
Figure 26: PDSC Onset Temperatures of 2 wt% Antioxidants in Trans 25 ................................. 52
Figure 27 Four-Ball Results of Antiwear Additive Study ............................................................ 55
Figure 28: Commercial Lubricants and Bio-Based Gear Oil Wear Prevention Comparison ....... 56

ix
Figure 29: Commercial Lubricants and Bio-Based Gear Oil Oxidative Stability Comparison .... 57
Figure 30: Oxidation Reaction Model .......................................................................................... 60
Figure 31: Pan Setup ..................................................................................................................... 62
Figure 32: Micro Oxidation Reactor ............................................................................................. 63
Figure 33: Sample Size Study ....................................................................................................... 65
Figure 34: TGA Pans after Test .................................................................................................... 67
Figure 35: TGA Plot ..................................................................................................................... 69
Figure 36: Illustration of Kinetics in TGA ................................................................................... 70
Figure 37: Arrhenius Plot.............................................................................................................. 72
Figure 38: Kinetic Model Calculation Results for SBO at 300°C ................................................ 73
Figure 39: Deposit on Micro-Oxidation Pans ............................................................................... 74
Figure 40: Calculations and PSMO Experiments at 175°C .......................................................... 75
Figure 41: Calculations and PSMO Experiments at 200°C .......................................................... 75
Figure 42: Calculations and PSMO Experiments at 225°C .......................................................... 76
Figure 43: Calculations and PSMO Experiments at 250°C .......................................................... 76
Figure 44: Calculations and Extended PSMO Experiments at 250°C .......................................... 77
Figure 45: Extended PSMO Pans at 250°C .................................................................................. 78
Figure 46: Anti-Oxidant Effect ..................................................................................................... 79
Figure 47: PAO8 Calculations ...................................................................................................... 80

x
LIST OF TABLES
Table 1: Fatty Acid compositions of selected vegetable oils [17] .................................................. 3
Table 2: Base Fluid Properties for Industrial Gear Lubricants [58] ............................................. 12
Table 3: API Specifications for Gear Lubricants .......................................................................... 13
Table 4: Gear Lubricants in Biopreferred Program [61] .............................................................. 16
Table 5: Reaction Times and Labels for Glass Reactor Soybean Oil Polymerization ................. 22
Table 6: Reaction Times and Labels for Steel Reactor Soybean Oil Polymerization .................. 24
Table 7: Transesterification of Soybean Oil, Times and Labels ................................................... 26
Table 8:Gardner Holtz Viscosity Grade for Glass Reactor Polymerization ................................ 32
Table 9: Molecular Weight of Selected Materials ........................................................................ 37
Table 10: Thermal Polymerization of Soybean Oil ...................................................................... 44
Table 11: Synthetic Base Fluids ................................................................................................... 45
Table 12: Anti-Oxidants [92] ........................................................................................................ 46
Table 13: Commercial Gear Lubricants ........................................................................................ 47
Table 14: Viscosity of Base Fluids ............................................................................................... 48
Table 15 SAE Specifications for Gear Lubricants [56] ................................................................ 49
Table 16: Anti-Oxidant Blends ..................................................................................................... 53
Table 17: Commercial Lubricants and Bio-Based Gear Oil Viscosity Index Comparison .......... 58
Table 18: Investigated Experimental Conditions .......................................................................... 61
Table 19: Final experimental conditions for TGA study .............................................................. 67

xi
ABBREVIATIONS
AGMA: The American Gear Manufacturers Association
API: American Petroleum Institute
ASTM: American Society for Testing and Materials
CoF: Coefficient of Friction
cSt: Centistokes
D: Dark Deposit
DSC: Differential Scanning Calorimetry
D-A: Diels Alder
FAME: Fatty Acid Methyl Ester
GPC: Gel Permeation Chromatography
IV: Iodine Value
NMR: Nuclear Magnetic Resonance
OT: Onset Temperature
P: High Molecular Weight Products
PAME: Palmitic Acid Methyl Ester
PAO: Poly Alpha Olefin
PDSC: Pressurized Differential Scanning Calorimetry
PPD: Pour Point Depressant
PSBO: Polymerized Soy Bean Oil

xii
PSMO: Penn State Micro Oxidation
Q: Primary Oxidation Products
RH: Original Oil
SBO: Soybean Oil
SEC: Size-Exclusion Chromatography
TAG: Triglyceride
TGA: Thermal Gravimetric Analysis
USDA: United States Department of Agriculture
VI: Viscosity Index

xiii
ACKNOWLEDGEMENTS
I owe my deepest gratitude to my project advisor Dr. Joseph Perez, whose encouragement,
supervision and support from the initial to the final level enabled me to develop an understanding
of the subject. It is an honor for me to thank my research advisor in USDA, Dr. Kenneth Doll for
his utmost support for my endeavors. This thesis would not be possible without his endless effort
and guidance. I am grateful to Dr. Sevim Erhan who started USDA-PSU collaboration,
introduced me the PSU and helped me throughout my research. I would also like to thank Dr.
Brajendra K. Sharma where his hands-on assistance and knowledge allowed me to finish this
work. I am grateful to Erin Walter, Richard Henz and Cynthia Ruder for guiding me through
experimental procedures in USDA and Karl E. Vermillion for NMR analysis. I would like to
thank Dr. Svajus Asadouskas for our valuable discussions. I would also like to thank my
committee members Dr. Andre Boehman and Dr. Robert Rioux for their assistance. I would like
to acknowledge USDA who financially supported this project. Lastly, I offer my regards and
blessings to my family and friends who supported me in any respect during the completion of the
project.

1
Chapter 1 Introduction
Bio-based materials are attractive alternatives to petroleum based products due to the increase in
environmental concerns and our dependence on petroleum [1]. The interest in bio-based
materials has been accelerated as a result of the increasing prices of crude oil. Chemical
modification of vegetable oil is necessary in order to compete with petroleum products.
Use of vegetable oils are the leading alternative for the replacements of petroleum based
lubricants but have inherent weaknesses that have to be taken into consideration when
formulating lubricants such as engine oils, hydraulic fluids, machining fluids, gear oils [2]. The
weaknesses can be mitigated by chemical modification and proper selection of additives. The
vegetable oils have advantages such as excellent lubricity and temperature-viscosity properties,
shown by previous studies of the Tribology Group at Pennsylvania State University. They have
investigated the use of vegetable oils as motor oils [3-4], hydraulic fluids [5] and basic studies to
investigate how to improve some of the weaknesses such as oxidation stability [6].
This study was initiated as part of a CRADA between the USDA, Caterpillar Inc., and Penn
State. One of the lubricants of interest was gear oils. Gear oils are a workhorse in automotive
applications and are used in transmissions, differentials, power-takeoffs and non-drive
applications. They are required to have good lubricity (minimize friction and wear), reduce
noise, remove wear particles and contaminants from the contact areas, inhibit corrosion, act as a
heat transfer medium and improve overall efficiency of the system.
One of the most important components of a gear lubricant is the viscous base oil. Most vegetable
oils have similar viscosity properties in the range of 32 to 36 cSt at 40oC , too low for use as a
gear oil base fluid. Similar requirements are found in other applications such as printing inks,
composites, surfactants and hydraulic fluids used in elevators. Some of these fluids contain soy
based base oils formed by thermal polymerization to increase their viscosity. Thermal
polymerization is one of the highly applicable methods for modifying the properties of vegetable
oils. In the literature, it is reported that the formation and structure of these polymerized oils
structure of these polymers are explained with the Diels-Alder reaction.

2
In this study, it was of interest to produce base oils with acceptable viscosities for use in gear oils
and to conduct a study of the mechanism of the formation of the fluids by thermal
polymerization.
In addition to producing acceptable base oils, the study investigated the thermal and oxidative
stability, the lubricity (friction and wear) and how to improve the low temperature characteristics
of the formulated lubricants. TGA, PDSC, PSMO, NMR, and ASTM standard test methods were
used in the study.
1.1. Vegetable Oil
Vegetable oils have been used in many industrial applications like lubricants, surfactants,
emulsifiers, plasticizers, solvents, paints, inks and many others [7-13] Vegetable oils are
biodegradable, sustainable and have low ecotoxicity which makes them a better alternative to
petroleum based materials. US produce 25 billion pounds of vegetable oils annually [14].
However nonfood applications are increasing rapidly for the last 50 year and having alternative
uses for vegetable oils will add value to the vegetable oils [14-15]
1.1.1. Chemistry
Vegetable oil mostly contains triglyceride (TAG) structures basically glycerol linked with three
fatty acids. Figure 1 represents the 3-D structure of a TAG [16].
Figure 1: 3-D Structure of TAG [16]

3
Fatty acids contain different amount of carbon atoms and unsaturations which gives them their
characteristic properties. Every vegetable oil has varied composition of fatty acids in their TAG
structure (Table 1).
Table 1: Fatty Acid compositions of selected vegetable oils [17]
Vegetable Oil Palmitic
(16:0)
Stearic
(18:0)
Oleic
(18:1)
Linoleic
(18:2)
Linolenic
(18:3)
Safflower oil 6.4 2.5 17.9 73.2 -
High-oleic safflower oil 4.6 2.2 77.5 13.2 -
High-linoleic safflower oil 6.7 2.6 14.6 75.2 -
Sunflower oil 6.1 5.3 21.4 66.4 -
High-oleic sunflower oil 3.5 4.4 80.3 10.4 -
Soybean oil 6.0 5.2 20.2 63.7 5.0
High-oleic soybean oil 6.2 3.0 83.6 3.7 1.7
Corn oil 10.6 2.0 26.7 59.8 0.9
Cottonseed oil 18.0 2.0 41.0 38.0 1.0
1.1.2. Vegetable Oil-Based Lubricant Base Stocks
Most of the lubricants in the market are made from petroleum base stocks however use of
vegetable oil as a lubricant base stock is increasing. Vegetable oil base stocks are biodegradable
and nontoxic which is a benefit over mineral based oils [18]. Vegetable oils have low volatility
because of their high molecular weights. Moreover they have good lubricity due to their ester
groups. Also vegetable oils have higher viscosity index (VI) which indicates that they are less
sensitive to viscosity change with temperature. However vegetable oils mainly suffer from poor
oxidative stability and low-temperature solidification. These properties could be improved by
additives and chemical modifications [17-19].
Chemical structure of vegetable oil makes it very delicate to oxidation. Since vegetable oils
contain mostly oleic, linoleic and linolenic fatty acids they all have carbon double bonds which

4
decrease the oxidation stability. Allylic methylene groups are more stable than double allylic
methylene groups thus oleic acid is much more stable than linoleic and linolenic acids. On the
other hand carbon double bonds increase the low temperature properties [8].
1.1.3. Modification of Vegetable Oils
Properties of the vegetable oil based lubricants could be enhanced by adding additives and
diluting with other synthetic oils. However in many cases additives and synthetic fluids are not
sufficient. In such occasions chemical modification is a better alternative [20-22]. Many
chemical modifications have been introduced. Thermal polymerization and transesterification
will be studied in this thesis. Thermal polymerization increases the viscosity of the base fluid by
anaerobically heating it and transesterification replaces glycerol with other alcohols to alter low
temperature properties and viscosities.
1.1.3.1. Thermal Polymerization
The thermal polymerization of soybean oil is a reaction which has received significant study over
long period of time. Anaerobically heating vegetable oil leads higher viscosities and molecule
sizes. Polymerized vegetable oils have found its way into many industrial applications such as
inks, polymers, and lubricants both historically [23] and more recently [24-32].
The structures of the thermally polymerized vegetable oils are explained with Diels-Alder
reaction in many papers [23-34]. Thermal polymerization reaction can be defined as a cyclo-
addition reaction (Diels-Alder reaction) between a diene and an active dienophile (Figure 2) [35].

5
Figure 2: Diels Alder Reaction [35]
Diels-Alder reaction is a very useful method to create cyclic products. In vegetable oils; reaction
between conjugated linoleic acid and oleic acid would act as diene and dienophile respectively
and could produce the cyclo hexene structure. Figure 3 represents the D-A reaction in soybean
oil [36].
Figure 3: Diels Alder Reaction in Vegetable Oils [36]
D-A reaction has been well accepted to explain the structure of the thermally polymerized
vegetable oils as mentioned above. Probably due of the acceptance in the literature not much
attention has been given for the experimental results. For example Lozada et al.’s paper [37]
thermally polymerized the soybean oil is verified the D-A polymerization with GC (Figure 4).
They have found a decrease in the linoleic and linolenic acid content but there was no change in
the oleic acid. This is interesting since in D-A reaction oleic acid should act as a dienophile and

6
react with linoleic and linolenic acid. Moreover they investigated the polymerization of the
soybean oil with FT-IR. Their reported results are in Figure 5. They state that “In comparison
with the soybean oil spectra, the disappearance of carbon– carbon double bond at 1655 cm-1
…
are obvious. These results confirm the mechanism for heat polymerization of soybean oil…”
They did not find a trace of cyclo-hexene structure from D-A reaction. Double bonds in the ring
should show up at >3000 cm-1
. Also ring modes should be presented around 1600 and 1495 cm-1
[38].
Figure 4: GC Spectra of Thermally Polymerized Soybean Oil [37]

7
Figure 5: FT-IR Spectra of SBO and Polymerized (Bodied) SBO [37]
Another recently published article [39] studied the cationic polymerization of soybean oils with
boron trifluoride diethyl etherate under supercritical carbon dioxide medium. They have verified
the polymerization of soybean oil with 1H and
13C NMR. Figure 6 is the reported
1H NMR with
their 1H NMR estimation. They have confirmed the structure by looking the protons attached to

8
carbons of the cyclic ring (1.64 and 1.94 ppm) however the protons attached to the double bonds
in the ring is not presented but shown in their 1H NMR estimation (labeled as c but not shown in
paper).
Figure 6 1H NMR of Soybean Oil (SBO) and Polymerized Soybean Oil (PSBO) [39]
The problem using D-A to describe the thermal polymerization of linoleic acid and oleic acid is
that neither a conjugated diene nor a reactive dienophile are present. Many studies shows that
converting ordinary linoleates into their conjugated form requires considerable effort where
success could lead to the creation of value added oils, as oils with a high conjugated content sell
at a considerable premium compared to normal oils [40]. Early work showed that the conjugated
forms are fairly difficult to obtain. In a study of C6 toC8 alkane dienes, materials such as
alumina at 365 oC yield only 34% yield, and the double bonds arrange from terminal ends, not
favorable for linoleates with their internal bonds. Using magnesium catalyst in the same study

9
[40] the reaction did not have a considerable yield. Strong bases; such as NaOH [41] and, alkali
metals, strong acids; toluene sulphonic acid, and metals; [42], nickel on carbon, iron, chromium,
ruthenium platinum, rhodium have all been shown to accomplish the conjugation reaction [43].
However in thermal polymerization of vegetable oils only relies on anaerobic heating.
The misconception that the Diels-Alder reaction is operative in thermally polymerized
oleochemicals might come from the 1964 report where 10-trans-12-trans methyl linoleate was
actually polymerized via the Diels Alder reaction [44]. This group selected this system based on
their prior work which showed the reaction times of this 10-trans-12-trans conjugated material
were 7 times faster than the alkali conjugated material and at least 40 times faster than either the
cis-cis or trans-trans forms of the nonconjugated material [44-45]. In later work, this group
demonstrates normal linoleic acid does not produce Diels Alder products, although they envision
their existence as an intermediate clay catalyzed reactions [46].
The hindered dienophile of an internal double bond of a fatty chain also leads to doubts.
Utilizing primary olefins such as ethylene or butene one group was able to demonstrate Diels-
Alder chemistry of fatty materials [47]. However even with these much better dienophiles, it is
required that the linoleate and linolenate be heated with 1 mole excess NaOH 1 hour prior to the
addition of 1-butene to the reactor. The main situation where the Diels Alder reaction is
applicable to oleochemical polymers, the trick of using an actual dienophile comes into play.
Maleic anhydride has been shown to react with soybean oil [48], or even more effectively with
methyl calendulate, a 8,10-trans-12-cis octadecatrienoate. When this later reaction is performed
in benzene, the reaction showed that only the trans isomer reacts [49].
In a different study Figge points out that methyl linoleate does not conjugate under the sole
influence of heat [50]. Moreover they show that heat treatment of methyl linoleate leads to the
formation of dimers without D-A reaction. Another recent study in food industry shows that
when the oxygen is excluded via a steam blanketing and polymerizations reactions dominate
oxidations. Brutting and Spiteller did not find such Diels-Alder products in their investigations
with linolenic and linoleic acid [51].
Besides the accepted D-A structure of thermally polymerized vegetable oils there are many
controversially studies in the literature. One part of this thesis will focus on the chemical

10
structure of the thermally polymerized vegetable oils and attempts to conclude the misconception
of highly accepted D-A reaction.
1.1.3.2. Transesterification
Transesterification of vegetable oils, Figure 7, are commonly used in biodiesel production to
lower the viscosity. However in lubricants this process could also be used to increase the low
temperature properties by increasing the complexity of the structure. Polyol esters which use
neopentylglycol, trimethylolpropane or pentaerylthritol are the most common. Moreover this
method can also be employed in processing lower viscosity lubricants from monoesters [52-53].
Figure 7: Transesterification of Triglyceride with Methanol [54]

11
1.2. Gear Lubricants
Gear oils are essential for automotive and industrial lubrication where they are commonly used
in transmissions, differentials, power takeoffs and non-drive applications. They are required to
minimize friction and wear, reduce noise, remove wear particles, inhibit corrosion, transfer heat
and improve efficiency [55]. In order to provide this protection many properties have to be
investigated. However one of the most important properties is their viscosity characteristics
because in both the hydrodynamic and elastohydrodynamic regions they have to maintain their
lubricity properties [56].
Gear lubricants are divided to two main applications, industrial gear lubricants and automotive
gear lubricants. Industrial gear lubricant specifications are less demanding than automotive gear
lubricants [57]. Main requirements for industrial gear lubricants are having resistance to
oxidation, low foaming tendency, high load-carrying capacity, inert to the materials involved,
and good temperature viscosity behavior. Industrial gear lubricants follow The American Gear
Manufacturers Association (AGMA) Lubricant Specifications. Each application requires a
different specification for example spur gears require higher load-carrying capacity; on the other
hand worm gears require a wide operation temperature range. Both mineral and synthetic base
fluids are employed in industrial gear lubricants. However, like many other lubricants the trend
for industrial gear lubricants is using synthetic base stocks. Automotive gear lubricants have
been using synthetic base stocks since 1960s while synthetic base fluids were introduced in
industrial gear lubricants in 1994 [58]. Polyalkylene glycol (PAG) and polyalphaolefins (PAO)
are used along with mineral oils in industrial gear lubricant applications. Table 2 shows the main
properties of these three base lubricant properties.

12
Table 2: Base Fluid Properties for Industrial Gear Lubricants [58]
Properties Mineral Oil PAO PAG
Density at 20°C, g/ml 0.9 0.85 0.9-1.1
Viscosity Index 80-100 130-160 150-270
Pour Point °C -40 to -10 -50 to -30 -56 to -23
Flash Point °C <250 >200 150-300
Oxidation Resistance Moderate Good Good
Thermal Stability Moderate Good Good
Lubricity Good Good Very good
Compatibility Good Good Fair
Price relation 1 5-10 6-10
Automotive gear boxes are more complicated than industrial systems so that lubricants for
automotive applications have to be more sophisticated than industrial gear lubricants.
Automotive gear lubricants are required to minimize the friction, act as a heat transfer agent,
inhibit corrosion, remove wear particles from contact areas, reduce noise, function in a wide
temperature range and improve power transfer efficiency. In addition to these requirements a
competitive automotive lubricant should be able to work in higher temperatures and gear loads
with smaller amount of lubricants. Automotive gear lubricants are filled and sealed for the life of
the gear box. Many original manufacturers require a specific test method for their equipment.
There are many ‘original equipment manufacturer gear oil factory or service fill performance
specifications for standard drain applications’ are available. Clark MS 8, Ford EST-M2C108-C,
GM 9985182, Iveco 18-1805 are just a few of them. The intention of the lubricant industry is to
develop a single lubricant that could meet all the OEM specifications. This leads to increase in
the quality of the gear lubricants for automotive applications. Besides the OEM specifications
there is also the American Petroleum Institute (API) specifications for gear lubricants. Table 3
shows the API specifications [56, 59].

13
Table 3: API Specifications for Gear Lubricants
Specification Description
GL-1 Lubricants for mild conditions and low pressures. Designed for spiral and
worm gears axles and manual transmissions without synchronizers. Little
(anti-oxidant) or no additive is used.
GL-2 Lubricants for moderate conditions. Contains anti-wear and anti-oxidant
additives. Used in automotive worm gears.
GL-3 Lubricants for moderate conditions. Contains extreme pressure (EP)
additives with anti-wear additives. Designed for manual transmissions
and lightly loaded axles.
GL-4 Lubricants for moderate to severe conditions. Contains active EP
additives for spiral-bevel and hypoid gear applications in automotive
axles operated under moderate speeds and loads.
GL-5 Lubricants for severe conditions. Contains highly active EP additives.
Used in hypoid gear applications for passenger cars and trucks. GL-5
grade lubricants should meet MIL-L-2105D performance requirements.
GL-6 Lubricants for very heavy conditions. Contains higher additive
concentrations than GL-5. This category is used for high offset hypoid
gear axes.
MT-1 This category is specially designated for nonsynchronized heavy-duty
transmissions. MT-1 category adds additional requirements for thermal
degradation, component wear, and oil seal deterioration which are not
provided by lubricants meeting only the requirements of API GL-5.
As mentioned earlier commercial gear lubricants should meet the required API GL category as
well as manufacturers specifications. API GL-5 is the most common category for gear lubricants
which requires them to meet the MIL-L-2105D performance criteria. The first requirement for
MIL-L-2105D is the CRC L-60 Thermal Stability Test. In order to evaluate thermal and
oxidative degradation this method uses a special gear set, ball bearing and copper catalysis and
measures viscosity increase [60] along with the carbon and sludge formation in the gears. CRC

14
L-33 Water Corrosion Test investigates oil’s rust and corrosion inhibiting properties. Oil with
water contamination is placed in to 30 hypoid differential assembly at high temperatures and rust
in the system is inspected. CRC L-37 Axle test uses the same system as in CRC L-33 without
water contamination. Oil’s extreme pressure, load carrying and wear prevention properties are
investigated at high speed – low torque and low speed - high torque. Last test method in MIL-L-
2105D is Axle Shock Load Test (CRC L-42) which uses hypoid differential assembly to evaluate
oil’s antiscoring characteristics at high speed – high shock conditions [56].
1.3. Bio-Preferred Program
In 2002 USDA created a Biopreferred program to promote the use of biobased products [61].
Biopreferred program is a voluntary labeling program for many consumer marketing products.
Federal agencies and their contractors are required to purchase the Biopreferred product if the
price and properties are competitive. Biopreferred products are labeled by USDA and advertised
in USDA Biopreferred website. Each category of the products should meet certain biobased
content in order to be labeled with Biopreferred label. This amount is determined by USDA by
searching the highest biobased product in that specific category. Figure 8 shows the biobased
label. ASTM D6866 - 11 Standard Test Methods for Determining the Biobased Content of Solid,
Liquid, and Gaseous Samples Using Radiocarbon Analysis is employed to determine the
biobased content of the material [62].
Figure 8: USDA’s Biobased Label [61]

15
In order to label a gear lubricant with the Biopreferred label, a gear lubricant must have at least
58% biobased content. The description of the gear lubricants are specified as ―Products, such as
greases or oils, that are designed to reduce friction when applied to a toothed machine part
(such as a wheel or cylinder) that meshes with another toothed part to transmit motion or to
change speed or direction.” [61]. Gear lubricants that are listed in the Biopreferred program are
shown in Table 4. Automotive lubricants that are presented in the table are classified as 80W-90
grade which have viscosities are around 87 cSt at 40°C and 17 cSt at 100°C [60]. There are
currently no certified biobased automotive lubricants that meet higher viscosities.

16
Table 4: Gear Lubricants in Biopreferred Program [61]
Product Company Application
BioGear CO220 BioBlend Renewable Resources, LLC
Industrial
BioGear EP 150 BioBlend Renewable Resources,
LLC Industrial
Eco Biodegradable Gear Oils DSI Ventures Industrial
Biogear EP100 Dynacom, Inc. Industrial
Biogear EP100 Dynacom, Inc. Industrial
Biogear EP100 Dynacom, Inc. Industrial
Biogear EP100 Dynacom, Inc. Industrial
BiogeW-ar EP100 Dynacom, Inc. Industrial
ELM 80W-90 Multipurpose
Gear Lubricant
Environmental Lubricants
Manufacturing, Inc. Automotive
SAFE LUBE Gear Lube ISO-
150
GEMTEK Products LLC. Industrial
SAFE LUBE Gear Lube ISO-
150
GEMTEK Products LLC. Industrial
UltraLube 80W-90 Plews and Edelmann Automotive
EnviroLogic 200 Series Terresolve Technologies Industrial
NEF Food Grade Gear Oil Terriss Consolidated Industries
Inc. Industrial
ELM 80W-90 Multipurpose
Gear Lubricant
USA SOY SOLUTIONS, LLC Automotive
Bio-HVO Hydraulic Fluid ISO
46
Wise Solutions, Inc. Industrial

17
1.4. Oxidation Test Methods
The synthesis of vegetable oil based industrial products has been the interest of this decade [3, 8,
63-65]. In the lubrication area, the search for high performance lubricants that are based on
renewable materials is always growing [52, 66]. Oxidation has been an ongoing weakness of
vegetable oil based materials where several instrumental methods have proven valuable [67].
The Penn State Micro Oxidation (PSMO), Pressurized Differential Scanning Calorimetry
(PDSC) and Thermal Gravimetric Analysis (TGA) are some of the most common bench test
methods used to investigate the oxidation stability.
1.4.1. Penn State Micro Oxidation
PSMO is a thin-film oxidation test developed at The Pennsylvania State University to study
oxidative behaviors of engine oils. The primary purpose of the test was to simulate the initial
stages of oxidation. Time temperature correlations have been well studied [3]. The PSMO test
method can also be combined with a GPC to detect further oxidation products [68-70] The
PSMO is an inexpensive test and has many advantages over bulk oxidation test methods for
example requiring less test sample (20 μl), requiring less test time (30-120 min) [16]. The PDSC,
TGA and PSMO are all very useful test to study oxidation. They are all rapid tests, requiring
small samples but approach oxidation from different perspectives. The PSMO has temperature
limitations. Temperatures above 250° cannot be exceeded with the current models which limits
the test time. All three methods require experienced operators or training. The TGA and PDSC
require significantly more expensive instrumentation. Accumulation of test data with the PSMO
requires more time than PDSC or TGA, requiring several procedural steps but considerably less
time than ASTM type bulk oil oxidation tests.
1.4.2. Pressurized Differential Scanning Calorimetry
PDSC is another common method to determine the initial step of the oxidation. This method is
generally used to study additives and base fluids. ASTM procedures are available to test the
oxidation stability of the base fluids with or without additives [71]. Additive effect can be tested
rapidly and easyly. PDSC is routinely used in the literature [72-73]. Correlations of vegetable
oils, PDSC and NMR are available for modified and unmodified vegetable oil samples [74]. In

18
this thesis PDSC method will be used for scanning the base lubricants as well as with their
additives.
1.4.3. Thermal Gravimetric Analysis
There are numerous reports that have utilized TGA on vegetable oil compounds since the 1980s
but only four reports which primarily utilize the isothermal variety of this method are available
[75-78]. The first report is a well done study from 1985 which reports ~88 kJ mol-1
as the
activation energy of the oxidation of soybean oil and notes the change which occurs when the
temperature is taken around 150 oC [76]. The second report from 2001 reports the effectiveness
of antioxidants in ethyl linoleate [77]. One recent report from 2009, is a study relating to two
types of biodiesel with petroleum diesel [78]. According to this paper, diesel is less stable than
biodiesels, which is in contrast to a vast body of literature. Additionally, the activation energies,
73.86 kJ mol-1
for biodiesel and 21.62 kJ mol-1
for petroleum based diesel, differ by greater than
50 kJ mol-1
. These erroneous results are probably caused by the volatility difference in the
material combined with authors’ inability to tell evaporation from reaction. Suffice it to say there
are no isothermal TGA studies on the oxidation of vegetable oil at temperatures over 150 oC.
Hsu investigated the oxidation of lubricants with TGA constant heating mode [79-82]. He found
that under oxygen oil shows different behaviors than under nitrogen. However it was not
possible to calculate the kinetic parameters with the methods proposed.

19
Chapter 2 Chemical Structure of Thermally Polymerized Vegetable Oils
2.1. Introduction
In order to synthesize a variety of new gear oil formulations with desired properties, materials
without the glycerol moiety of the thermally modified soybean oil are desired. To accomplish
this it was thought that Diels-Alder chemistry could be used where either the thermally
polymerized soybean oil can be transesterified with the desired alcohol or methyl ester could be
thermally polymerized. Both methods should lead to the desired thermally modified alkyl ester
products (Figure 9). However, examination of resultant materials in both cases show that the
cyclohexene structures expected from the type reactions are not found in these products using
either order of reactions, a fact contrary to many literature reports recently [25-32, 39]. This part
of the thesis will present modern evidence against the accepted Diels Alder type mechanism in
these reactions. First, and most conclusively, Nuclear Magnetic Resonance (NMR) spectroscopy
shows the methine carbon linkages necessitated by the Diels Alder products are not present.
Additionally, evidences against this mechanism are pointed out by comparing; IV of thermally
polymerized oils with NMR results, oxidation stability of the thermally polymerized products
and their molecular weight. Finally a new structure will be proposed that agrees with the
experimental results.

20
Figure 9: Polymerization and Transesterification of Soybean Oil and Polymerization of
Methyl Esters
2.2. Experimental
2.2.1. Preparation of the materials
Polymerized materials are prepared by using two kind of thermal polymerization methods; glass
reactor polymerization and pressurized reactor polymerization. The glass reactor is used for
materials with lower volatility whereas a steel reactor must be employed when the sample has
high volatility. Transesterification is also used to produce methyl esters from thermally
polymerized vegetable oils. Many samples are prepared and designated with Trans followed by a

21
specific number. Synthesis of each material will be explained in this section and will be assigned
with a label.
2.2.1.1. Thermal Polymerization
Thermal polymerization is explained in the previous chapter. In this study, two different thermal
polymerization experimental setups are used. Glass reactor polymerization was used in this study
due to the necessity to synthesize larger batches. However, this method could only be applied to
materials that have low volatility. Steel reactor polymerization is employed when the material
has high vapor pressure.
2.2.1.2. Polymerization in glass reactor
Glass reactor polymerization [12] is used for the materials that have low volatility such as
vegetable oils. Oil is placed in 2000 ml four necked reactor. A neck in the middle is connected to
the stirrer. Other necks are connected to thermometer, dry nitrogen and condenser apparatus.
Condenser part is connected to round bottom flask. Oil is stirred constantly with 20 ml/min
nitrogen flow and heated with a heat jacket to 330 ± 3 °C. Time is counted when the reaction
temperature reached 330 °C. The pressure of the reaction is kept constant at atmospheric
pressure. Table 5 shows the starting material, reaction time and the labels for the oils synthesized
in glass reactor. Reaction time at 0 indicates that the material is the starting material.

22
Table 5: Reaction Times and Labels for Glass Reactor Soybean Oil Polymerization
Starting material Reaction Time (min) Label
Soybean oil 0 Trans 16
Soybean oil 60 Trans 18
Soybean oil 85 Trans 19
Soybean oil 110 Trans 20
Soybean oil 130 Trans 21
Soybean oil 160 Trans 22
Soybean oil 180 Trans 23
Soybean oil 210 Trans 24
Soybean oil 240 Trans 25
Soybean oil 280 Trans 26
Soybean oil 330 Trans 27
Soybean oil 370 Trans 28
Soybean oil 195 Trans 29
Soybean oil 350 Trans 30
Methyl esters have higher vapor pressure than vegetable oils. Figure 10 demonstrates vapor
pressure of palmitic acid methyl esters (PAME) vs. pressure. PAME has the highest volatility
among all the other methyl esters used in this study so PAME is used to determine the highest
vapor pressure that could be reached in the experiment [83]. Around the reaction temperatures
(330 ⁰C), the vapor pressure of the PAME should pass the atmospheric pressure. As a result, in
order to thermally polymerize the methyl esters a pressurized reactor was employed rather than
glass reactor.

23
Figure 10: Calculated Vapor Pressures of Palmitic Acid Methyl Ester [83]
2.2.1.2.1. Polymerization in Steel Reactor
Polymerization reactions are carried out in a 600 mL pressure reactor from Parr Instrument
Co. (Moline, IL). Figure11 shows the schematic diagram of the experimental set-up used for
the thermal polymerization. In this study a similar method that was employed by Liu and
Erhan for thermal polymerization reactions is used [39]. In the experiment 500 ml of the
sample is added to the reactor for polymerization. Then the reactor is purged with nitrogen
for 1 hour while constant stirring. After one hour, all the valves are closed and made sure that
there is no air flow to the reactor. Finally, the heater is turned on and once the temperature
reaches 330 °C, time is counted. After the desired time, the heater is turned off and the
reactor starts to cool to room temperature. Heat-up and cool down times in these test was
approximately 1-hour which is not counted in the test duration. Table 6 shows the starting
material, reaction time and the labels for the oils and methyl esters synthesized in steel
reactor.
0
40
80
120
160
200
200 220 240 260 280 300 320 340 360
Vap
or
pre
ssu
re (
kPa)
Temperature (°C)
palmitic acid methyl ester vapor pressure

24
Table 6: Reaction Times and Labels for Steel Reactor Soybean Oil Polymerization
Starting material
Reaction time
(min)
Label
Methyl linoleate 360 Trans 10
Methyl linoleate + methyl oleate (50% mol/mol) 360 Trans 11
Methyl oleate (MO) 0 Trans 12
Methyl linoleate 0 Trans 13
Methyl conjugated linoleate + MO (50% mol/mol) 360 Trans 14
Methyl conjugated linoleate 0 Trans 15
Soybean oil 180 Trans 17
Canola oil 0 Trans 31
High oleic sunflower oil 0 Trans 32
PAO 40 0 Trans 33
Canola oil 180 Trans 34
High oleic sunflower oil 180 Trans 35
SBO 75% and PAO 8 25% (w/w) 360 Trans 36
High linolenic SBO 0 Trans 37
PAO 8 0 Trans 38
High linolenic SBO 180 Trans 39
Glycerol triolein 0 Trans 40
Glycerol triolein 360 Trans 41
Methyl oleate (MO) 360 Trans 42

25
2.2.1.3. Transesterification
The transesterification reaction is carried out in a reaction vessel equipped with a stirrer and
thermometer. 2:1 molar ratio of methanol to fatty acid chain is used to increase the FAME yield.
1% (w/w) sodium hydroxide is used as catalyst. Methanol, sodium hydroxide mixture is prepared
in a separate beaker and added to the oil at 55 °C. Then the oil-methanol mixture is stirred for 1
to3 hours at 55-70⁰C. After the reaction, the methyl ester and glycerol phases are separated using
a separation funnel and the methyl ester is washed with distilled water. Water is separated and
the sample dried by using high vacuum distillation. Some of the viscous methyl esters could not
be separated from glycerol fraction by the separation funnel. In this case, it was separated by
washing the stream containing glycerol with distilled water. Table 7, shows the reaction
conditions and the designations of each material, which will be discussed in the next section.
Trans 7 which is not mentioned in the table is a commercial biodiesel used for comparison.
Figure 11: Steel Reactor
26
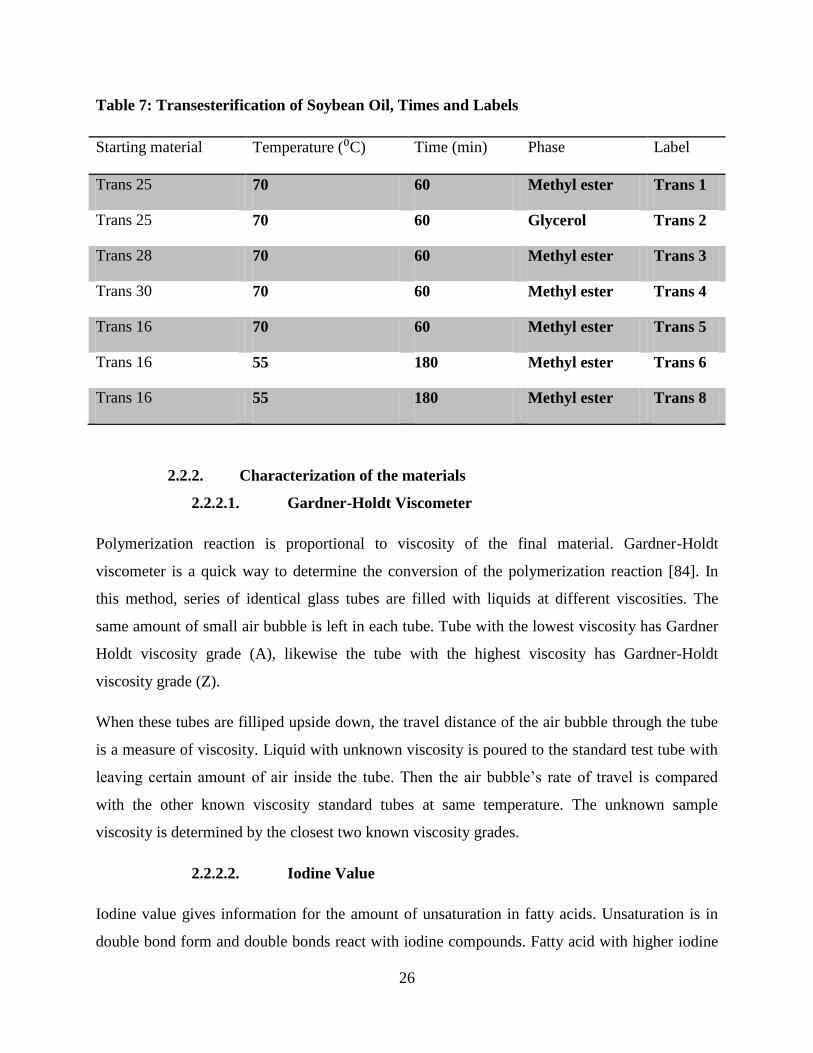
Table 7: Transesterification of Soybean Oil, Times and Labels
Starting material Temperature (⁰C) Time (min) Phase Label
Trans 25 70 60 Methyl ester Trans 1
Trans 25 70 60 Glycerol Trans 2
Trans 28 70 60 Methyl ester Trans 3
Trans 30 70 60 Methyl ester Trans 4
Trans 16 70 60 Methyl ester Trans 5
Trans 16 55 180 Methyl ester Trans 6
Trans 16 55 180 Methyl ester Trans 8
2.2.2. Characterization of the materials
2.2.2.1. Gardner-Holdt Viscometer
Polymerization reaction is proportional to viscosity of the final material. Gardner-Holdt
viscometer is a quick way to determine the conversion of the polymerization reaction [84]. In
this method, series of identical glass tubes are filled with liquids at different viscosities. The
same amount of small air bubble is left in each tube. Tube with the lowest viscosity has Gardner
Holdt viscosity grade (A), likewise the tube with the highest viscosity has Gardner-Holdt
viscosity grade (Z).
When these tubes are filliped upside down, the travel distance of the air bubble through the tube
is a measure of viscosity. Liquid with unknown viscosity is poured to the standard test tube with
leaving certain amount of air inside the tube. Then the air bubble’s rate of travel is compared
with the other known viscosity standard tubes at same temperature. The unknown sample
viscosity is determined by the closest two known viscosity grades.
2.2.2.2. Iodine Value
Iodine value gives information for the amount of unsaturation in fatty acids. Unsaturation is in
double bond form and double bonds react with iodine compounds. Fatty acid with higher iodine

27
value has more unsaturated bonds (double bonds). ASTM D1959-97 method is used for
determination of iodine value (IV) [85]. In this method, excessive Wijs solution (which is 1%
iodine monochloride and 99% acetic acid) is added to the sample, and left in the dark for 30 min.
The unreacted iodine is then titrated with sodium thiosulfate to determine the reacted iodine
monochloride.
2.2.2.3. Nuclear Magnetic Resonance
Materials are analyzed in 1H,
13C,
13C depth135, 2D
1H/
13C HSQC and 2D 1
H/13
C HMBC by
using Bruker ARX-500 spectrometer (Bruker,Rheinstetten, Germany). For 1H NMR, 500 MHz
frequency is used with 5 mm dual probe and materials are diluted in 99.8% deuterated
chloroform in 15% v/v concentration. In 13
C NMR, 125 MHz transmitter frequency is used with
5 mm dual probe and materials are diluted to 30% v/v concentration with 99.8% deuterated
chloroform. 1H,
13C signals are referenced to 7.24, 77.0 for respectively. Quantitate analysis for
1H is done by integration of methyl signal at 3.65 ppm in methyl esters and methylene signal at
4.45ppm in vegetable oils.
2.2.2.4. Gel Permeation Chromatography
Molecular weight distributions are determined by size exclusion chromatography (SEC).
Analysis is conducted using a Waters 2414 RI detector, Styragel HR1 SEC column (7.8mm ×
300mm), Waters 600-MS System controller connected to a 600-mulitsolvent delivery system,
and 717-plus auto sampler connected to a Dionex U120 Universal Interface. Retention time
calibration is obtained using six polystyrene standards with peak molecular weights of 250, 600,
1000, 1700, 2500, and 7000 Da (Polysciences, Inc). Modified vegetable oil and methyl ester
samples (3% w/w in tetrahydrofuran, THF) are prepared by dissolving ~30 mg and filtering
(0.45-µm Millipore PTFE) to remove suspended particulates. The pump flow rate is 1.0 mL/min
with THF as the carrier solvent and injection volumes are set to 50 µL.

28
2.2.2.5. Pressurized Scanning Differential Calorimetry
Experiments are done using Q-20 thermal analyzer from TA Instruments (New Castle, USA).
The sample is placed in an aluminum pan with a pinhole lid and hermetically sealed. A 1.5 mg (2
μl) sample is used for obtaining 1mm film thickness for higher reproducibility. Dry air is used as
a reactant and the sample container is pressurized to 200 psi to increase diffusion of the air in the
material and to limit evaporation of the material. System is equilibrated at 25 ±5 ⁰C before the
experiment and started heating with 20⁰C/min heating rates until the system reaches 350 ⁰C.
Experiments are done in duplicates and average values are reported. Figure 12, presents the
PDSC results of methyl oleate (Trans 12). 177.82 ⁰C is the onset temperature (OT) which is the
temperature, material starts to form primary oxidation products. Onset temperature is the
intersection point of the two tangent lines driven from no heat flow to the highest heat flow.
Figure 12: PDSC Exoterm

29
2.3. Results
2.3.1. Nuclear Magnetic Resonance
The glycerol structure of the transesterified polymerized soybean oils was not changed by
polymerization, which indicates that polymerization only affects the fatty acid chains at all
temperatures and pressures. Moreover, polymerized soybean oil methyl esters have the same
characteristics signals as the polymerized methyl esters in the NMR. In other words NMR results
suggest that transesterification of thermally polymerized soybean oils and polymerization of
methyl esters yield the same structures.
Soybean oil (Trans 17) has a higher yield than the canola oil (Trans 34) due to higher linoleic
and linolenic fatty acids. The structure of polymerized triolein (Trans 41) had greater
unsaturation, by 1NMR than the starting material, ~ 4 double bonds per triacylglycerol. This is
most probably due to elimination reactions, and was not studied further. Methyl oleate (Trans 42)
showed no changes at all in the polymerization reaction.
Selected NMR figures are reported in Appendix A. Figure 13 shows 1H NMR signals for, Trans
13, methyl linoleate (a), Trans 10, polymerized methyl linoleate (b) and the 1H NMR estimation
of linoleic acid around unsaturation. Around unsaturation is the key concept for the
polymerization since the reaction occurs on olefinic hydrogens. Before 0.7 ppm and beyond 5.5
ppm no signals are observed, thus NMR results are plotted from 0.7 to 5.5 ppm. 5.2-5.4 ppm
signals (5.40-5.49 ppm in the estimation) in 1H NMR correspond to the hydrogens that are
attached to the unsaturated carbons (olefinic hydrogens). 2.6-2.8 ppm (2.63 ppm in estimation)
represents the protons attached to the bis-allylic carbon hydrogen. The signal around 2 ppm (2.18
ppm in estimation) in 1H NMR illustrates protons that are attached to allylic carbons. It is has
been observed, Figure 13, that bis-allylic hydrogens are almost completely gone where allylic
protons and olefinic hydrogens are decreased dramatically after polymerization.

30
Figure 13:1H NMR Spectra for (a) Methly Linoleate, (b) Polymerized Methly Linoleate
The 13
C NMR estimation for the unsaturated part of the linolenic acid, 13
C NMR results for;
Trans 13, methyl linoleate (a) and, Trans 10, polymerized methyl linoleate (b) are found in
Figure 14. The ester carbonyl signal at 173.1 ppm remained unchanged in all methyl ester
samples, so it is not shown in the figures. Signals at 127-130 ppm in 13
C estimation are the
unsaturated carbons (olefinic carbons). It is important to notice from figure 14 that olefinic
carbon signals remain in the same 127-130 ppm region however only the intensity of the signals
decreased. Bis-allylic carbons can be found around 25.6 ppm and finally signal around 27.8 ppm
in 13
C NMR are the allylic carbons.

31
Figure 14:13
C NMR Spectra for (a) Methly Linoleate, (b) Polymerized Methly Linoleate

32
Table 8 shows the Gardner Holtz viscosity grade for the polymerizations of SBO in the glass.
Reaction time from 60 to 370 min has Garder Holtz viscosity grades from C-D to Z5 where C-D
has the lowest and Z5 has the highest viscosity among the polymerized soybean oils (PSBO).
Table 8:Gardner Holtz Viscosity Grade for Glass Reactor Polymerization
Label Reaction Time (Min) Gardner Holtz
Viscosity Grade
Trans 18 60 C-D
Trans 19 85 D-E
Trans 20 110 E-F
Trans 21 130 F-G
Trans 22 160 G-H
Trans 23 180 I-J
Trans 24 210 N-O
Trans 25 240 T-U
Trans 26 280 U-V
Trans 27 330 Z1-Z2
Trans 28 370 Z5
Trans 29 200 M-N
Trans 30 350 Z3-Z4
Iodine value is the most common method to determine the amount of carbon double bonds
contained in a fatty acid. Another way to determine the unsaturation is through NMR olefinic
hydrogen signals. However, 1H NMR can only detect the unsaturation with hydrogen attached to
the carbon double bonds. Figure 15 shows unsaturation values for various polymerized soybean
oils determined by 1H NMR olefinic hydrogen signals and iodine value. Before polymerization

33
of SBO; NMR and IV detects the same values because there are no C-C=C-C bonds. However
by the increase of the viscosity, the observed 1H NMR signals for unsaturation decreases more
than iodine value (IV). This indicated C=C bonds without hydrogen attached is forming.
Figure 15: NMR, IV comparison
Correlation NMR (2D NMR) between 1H and
13C offers a better understanding about the
distribution of hydrogen atoms around carbons. Heteronuclear single quantum coherence
between 1H and
13C (HSQC
1H/
13C) corresponds to coupling between directly connected
hydrogens and carbons. Figure 16 demonstrates the HSQC 1H/
13C experiment for polymerized
methyl linoleate (Trans 10). Olefinic hydrogens with carbon double bonds is in Region a. Region
b confirms that there are two different allylic carbons which agrees the results obtained from IV.
First allylic carbons are the one next to the unsaturated CH groups and the other group of allylic
carbons are next to C-C=C-C group.

34
Figure 16: HSQC 1H/
13C of Trans 10
Heteronuclear Multiple Bond Correlation (HMBC) experiment gives information about weak
proton-carbon J couplings. In other words, HMBC 1H/
13C provides information about protons
that are two to four bonds away from the carbon. Figure 17 shows the HMBC 1H/
13C experiment
for polymerized methyl linoleate (Trans 10). In the figure, region a shows that 130 ppm region in
13C NMR correlates with 2 allylic signals. This could be due to two different unsaturation, one
with the HC=CH and other with C-C=C-C.

35
Figure 17: HMBC 1H/
13C of Trans 10
Polymerization of methyl oleate-methyl linoleate and conjugated methyl linoleate-methyl oleate
experiments showed that methyl oleate does not react. Figure 18 demonstrates the polymerized
methyl oleate- methyl linoleate structure (Trans 11). Unsaturation signals around 5.2 ppm is
methyl oleate’s characteristic olefinic signals which are not affected by polymerization. This has
also been verified with 13
C NMR.

36
Figure 18: 1H NMR of Trans 11
2.3.2. Gel Permeation Chromatography
Selected GPC studies are reported in Appendix B. Molecular weight determinations of thermally
polymerized oils have been well studied. High molecular weight could be achieved because of
the intermolecular reactions and glycerol back bond support. On the other hand, it is observed
that polymerized methyl esters do not have high viscosities due to lack of glycerol.
Table 9 represents molecular weight distributions of some FAMEs and polymerized FAMEs.
Thermally polymerized materials only have monomers and dimers which indicate that through
thermal polymerization materials can only double their molecular weights. Another interesting
observation is polymerization of conjugated methyl linoleate methyl oleate mixture (Trans 14)
formed more dimers than polymerized methyl linoleate-methyl oleate mixture (Trans 11), which
means reaction of conjugated methyl linoleate is faster than methyl linoleate.

37
Table 9: Molecular Weight of Selected Materials
Material Peak Area % Molecular weight
Methyl linoleate
(trans 13) 100 384.8
Methyl oleate
(trans 12) 100 384.8
Polymerized methyl linoleate
( trans 10)
73.67 730.7
26.33 331.7
Polymerized
methyl linoleate-methyl oleate
( trans 11)
40.05 738.6
59.95 325.2
Polymerized
Conjugated methyl linoleate-methyl
oleate
( trans 14)
55.77 754.7
44.23 325.2
2.3.3. Pressurized Differential Scanning Calorimetry
PDSC is an effective method to determine the oxidative stability of vegetable oils by breaking
the vegetable oil matrix [86]. The weakest bond of the vegetable oil determines the stability of
the oil and in all cases; hydrogen-carbon bonds near carbon double bonds have the lowest
stability for oxidation. Onset temperature (OT) of oil would suggest the temperature that the oil
starts to break down so the high OT would state that the oil is more stable. In a vegetable oil,
increase in double bonds would lead to a decrease in stability. PDSC results are reported in
Appendix C. Figure 19 shows the OT of soybean oils vs. the increase in viscosity. As described

38
earlier, increase in the viscosity is a result of an increase in polymerization and increase in the
polymerization leads to decrease in oxidation stability, despite the fact of the decreases in the
unsaturation in thermally polymerized oils.
Figure 19: Onset Temperature of SBO and Selected PSBO
2.4. Discussion
2.4.1. Diels Alder Reaction
Diels-Alder (D-A) reaction mechanism and the polymerized vegetable oil structure with D-A is
explained previously. D-A was a favorable way to explain the polymerization structure, because
the existence of linoleic acid or linolenic acid (diene) and oleic acid (dienophile) is likely to form
cyclohexene structure. However, throughout this study we have found that D-A reaction is not
occurring in the thermal polymerization of vegetable oils because of several reasons.
Figure 20 shows the estimated 1H and
13C NMR signals for a cyclohexene in a polymerized
vegetable oil. According to the estimation proton signals attached to the carbon double bonds in

39
the cyclohexene has to show up at 6.30 ppm in 1H NMR. However,
1H NMR does not show
signals above 5.5 ppm. Moreover, predicted 13
C NMR shows (Figure 20) that carbon double
bond signals in the cyclohexene has to be higher than (137.8 ppm) the one on the fatty acid chain
(132 ppm). Moreover carbon signal in the cyclo ring (35 ppm) are not found in the 13
C NMR.
Figure 20: 1H and 13C NMR Predictions for Cyclohexene
In the methyl linoleate-methyl oleate experiment it is observed that methyl oleate does not react
at all which contradicts with what D-A reaction supports. In D-A reaction oleic acid acts as a
dienophile and stoichiometrically methyl linoleate and methyl oleate reaction (1:1 mol/mol) has
to yield 100% to cyclohexene. In D-A reaction linoleic acid first forms conjugated linoleic acid
then reacts with oleic acid. In the conjugated methyl linoleate- methyl oleate experiment, we
have observed that methyl oleate still does not react.
Furthermore, in the iodine value- NMR experiment confirm the formation of C-C=C-C bonds
but in D-A reaction all the carbon double bonds in the structure should have a hydrogen attached
to carbons. Both unsaturation in the cyclohexene and unsaturation the fatty acid chain have to be
presented in the NMR experiments.
GPC experiments showed that methyl ester fatty acid structures can only form monomer and
dimers. On the other hand, in D-A reaction double bonds in cyclohexene can act as a dienophile
and react with linoleic acid (diene). Figure 21 illustrates the possible trimer that could form by
D-A reaction which is not observed from GPC experiments

40
Figure 21: Further Polymerization of D-A Cyclohexene
Oxidation stability decrease cannot be explained by D-A polymerization reaction because the
double bonds in the cyclohexene are chemically more stable than the one on the fatty acid chain.
Moreover, decrease in the unsaturation should yield increase in the oxidation stability.
Nevertheless, in the PDSC experiment it is shown that increase in the polymerization decreases
the oxidative stability of the oil.

41
2.4.2. Chemical Structure
Throughout these observations, it is concluded that D-A reaction for thermally polymerized oils
is not possible because of the lack of a suitable conjugated diene, and the lack or a reasonable
dienophile and a new structure that explains these observations is necessary. Using results
obtained from the experiments above, the new structure should have C-C=C-C bonds between
two molecules. Figure 22 shows the possible structure for thermal polymerization and the NMR
estimations.
The anaerobic thermal polymerization is a highly useful reaction in the development of higher
viscosity products. The transesterification of these oils can be performed in order to synthesize
ester materials. Methyl esters can also be polymerized to produce similar products to the
transesterified thermally modified oils using a high pressure reactor. In literature the chemical
structures of the polymerized oils were explained by D-A polymerization reaction. In this study,
it is found out that D-A mechanism is not a viable explanation for these reactions. The
confirmation has been done by NMR, IV, GPC and PDSC. These results are in contrast to many
literature reports. We have suggested a new structure that agrees with the NMR, iodine value,
GPC and PDCS experiments. Understanding the chemical structure of anaerobic thermal
polymerization would give a better understanding to the properties of materials that employs this
technique.
Figure 22: 13
C and 1H Estimations for Proposed Structure

42
2.5. Future Work
The structure of the polymerized methyl esters will be analyzed with MALDI-TOF mass
spectrometer to confirm the dimer structures. The reaction mechanism of the thermal
polymerization should be investigated in detail with chemical traps but that adds difficulty
finding a suitable chemical trap for temperatures around 330°C.
Oxidative stability of the thermally polymerized samples will be studied further. Upcoming
project will involve the correlation between the oxidation stability with PDSC and NMR. These
results will provide an easier way to determine the oxidative properties of the material by using
NMR.

43
Chapter 3 Biobased Gear Lubricant by Using Thermally Polymerized Soybean
Oil
3.1. Introduction
The use of lubricants that are based on renewable materials is increasing rapidly due to their
biodegradability, low ecotoxicity and excellent tribological properties. Bio-based lubricants have
lower coefficient of friction, improved wear characteristics, a higher viscosity index, lower
volatility and flashpoints than mineral based oils. However they suffer from poor low-
temperature properties and oxidative stability. These problems can be overcome by using
additives and synthetic fluids.
Gear oils are essential for automotive lubricants. They are commonly used in transmissions,
differentials, power takeoffs and non-drive applications. The main functions of a gear lubricant is
to minimize friction and wear, reduce noise, remove wear particles, inhibit corrosion, transfer
heat and improve efficiency. Gear lubricants must provide protection in hydrodynamic,
elastohydrodynamic and boundary regions. In order to satisfy these requirements a good bulk
modulus and a relatively high viscosity is required.
Vegetable oils do not have sufficient viscosity for gear oil applications. This problem can be
overcome by using thermal polymerization or in other words the heat bodying reaction. Thermal
polymerization which is described in the earlier chapter is simply heating the oil under nitrogen
to get higher molecular weight products. This method has been used in various applications such
as inks, surfactants, composites and lubricants. Soybean oil is an excellent candidate for thermal
polymerization due to its high concentration of linoleate (C18:2), and linolenate (C18:3) fatty
acids and its availability in the US. In this part of the study thermal polymerization of soybean
oil is used to make fluids of various viscosities for gear oil applications. The fluids are blended
with synthetic fluids and additives to prepare gear oils and compared with API GL-5 grade gear
oils [56].

44
3.2. Experimental
Four different properties are investigated and modified for developing a gear lubricant from
soybean oil. First of all the viscosity of soybean oil is adjusted with thermal polymerization.
After reaching desired viscosity, low temperature properties are improved by adding pour point
depressant and synthetic fluids. Then oxidation stability of the oils is enriched by adding anti-
oxidants. Finally anti-wear properties of the gear lubricants are enhanced by adding anti-wear
additives.
3.2.1. Thermal Polymerization
The thermal polymerization process is explained in the previous chapter. All the polymerization
experiments are performed in a glass reactor in this part of the study. Soybean oil is used as a
starting material. Table 10 shows the polymerization reactions, reaction time and designation for
the polymerized oils used to produce gear lubricant base fluids.
Table 10: Thermal Polymerization of Soybean Oil
Starting material Reaction Time (min) Label
Soybean oil 110 Trans 20
Soybean oil 130 Trans 21
Soybean oil 160 Trans 22
Soybean oil 210 Trans 24
Soybean oil 240 Trans 25
Soybean oil 330 Trans 27
3.2.2. Low Temperature Properties
ASTM D 97 is the standard method that is used for testing the low temperature properties [87].
50 ml of sample is placed in the test jar and submerged in to the cooling media. Temperature of
the cooling bath is set to -18 °C for cooling the media from +9°C to -6°C. For the ranges -6°C to
-24°C and -24°C to-42°C and -33°C to -51°C °C bath temperatures are used respectively.
Samples pourability is measured in every 3°C increments and the final temperature is reported

45
when the sample stops pouring. Tests are done in duplicates in a Phase Technology Analyzer
model PSA-70S (Richmond, Canada) pour point apparatus.
In order to have good low temperature properties a sample has to remain liquid at low
temperatures [88-89]. Pour point depressants (PPD), LZ7670, LZ7671A and LZ3702, were
obtained from Lubrizol Corporation (Wicliff, OH). The additives were blended at concentrations
up to10% with the polymerized base fluid and the pour points determined. In addition10 to 50%
of several different synthetic lubricant blends were blended with the polymerized vegetable oil
samples to obtain the desired low temperature properties for the gear oils. Table 11 represents the
synthetic fluid name, primary chemical structure and the company that the fluid is purchased
from.
Table 11: Synthetic Base Fluids
Chemical Name Primary Structure Company
PAO 40 Poly alpha olefin Chevron Phillips
PAO 8 Poly alpha olefin Chevron Phillips
Esterex A 51 Ditridecyl adipate Exxon Mobil
Esterex P81 Ditridecyl phthalate Exxon Mobil
Esterex TM 101 Triisooctyl trimellitate Exxon Mobil
3.2.3. Viscosity and Viscosity Index
Kinematic viscosities of the samples are determined at 40 and 100°C by using Anton Paar
Stabinger Viscometer (SVM 3000, Ashland, VA). ASTM Test Method D445 is used for
measuring viscosities at 40 and 100°C and ASTM D2270 is used to calculate viscosity index
[90], [91]. Each measurement is done in duplicates and repeated if the difference between
measurements is more than 1%.
3.2.4. Anti-Oxidant Additive Study
Pressurized differential scanning calorimeter (PDSC) which is described in the previous chapter
is used to evaluate the oxidation stability. Various commercial anti-oxidants and their

46
combinations are evaluated at 2% concentrations to formulate an anti-oxidant package. Table 12
contains the anti-oxidant names, description or primary chemical group and the source from
which they were obtained (company).
Table 12: Anti-Oxidants [92]
Chemical Name Primary Chemical Group Company
Naugalube 531 3,5 Di-t-butyl-4-hydroxyl-hydrocinnamic
acid, C7-C9 alkyl ester
Chemtura
Naugalube 640 Butylated-octylated diphenylamine Chemtura
Naugalube 438 Diethyl diphenylamine Chemtura
Naugalube APAN Alkylated phenyl-alpha-napthylamine Chemtura
Lowinox 22M46 2,2’-methylenebis(6-t-butyl-4-
methylphenol)
Chemtura
Vanlube EZ Zinc diamyldithiocarbamate and diamyl
ammonium diamyldithiocarbamate
RT Vanderbilt
Vanlube 887E Tolutriazole compound in ester RT Vanderbilt
Vanlube 81 Dioctyl diphenylamine RT Vanderbilt
Vanlube 996E Methylene bis(di-butyl-dithiocarbamate)
and tolutriazole derrivative
RT Vanderbilt
3.2.5. Anti-Wear Additive Study
Four ball test method is used to investigate the anti-wear properties of the base lubricant with
anti-wear additives at concentration levels from 0.5-4%. The four ball test determines the anti-
wear properties of the fluids under boundary lubrication [93]. In this study a Falex friction and
wear multi-specimen test instrument (Falex Corp, Sugar Grove, IL) is used with AISE 52100
steel balls (12.7 mm in diameter, 64-66 Rc hardness). Prior to test, balls are cleaned with
tetrahydrofuran (THF) and dried under a stream of dry air. Components are assembled as shown
in figure 14 and 15 ml lubricant is placed in the ball pot. The lubricant is heated to 75°C, a 40 kg
(88 lb.) force is applied to the ball, and then the top ball is rotated at 1200 RPM for 60 min. After
the test the coefficient of friction (CoF) is determined and the wear scars of the three balls are

47
measured. All the tests are done in duplicate and if the difference is more than 5%, the test is
repeated.
Anti-wear and anti-oxidant additives used in the study include Vanlube 289 and Vanlube 73
superplus, a borate ester and dialkyldithiocarbamate compounds respectively were obtained from
RT Vanderbilt Company, Norwalk, CT [94]. Secondary zinc dialkyldithiophosphates (ZDDP)
was obtained from Ethyl Petroleum Additives (Richmond, VA).
Figure 23: Four Ball Test Unit
Five different commercial GL 5 grade synthetic and mineral oil based gear oils, found in Table
13 are used for comparison purposes. Oxidation stability, viscosity index and anti-wear
properties are compared with the final biobased gear lubricant.
Table 13: Commercial Gear Lubricants
Label Brand
Commercial 1 Pennzoil - Gearplus SAE 80W-90 GL-5 Multi-Purpose Gear Lubricant
Commercial 2 CRC SL2472 API/GL-5 Plus New Generation Limited Slip Gear Oil, 32 Fl Oz
Commercial 3 Mobil 1 LS 75W-90 Synthetic Gear Lube - 1 Quart
Commercial 4 Royal Purple Max Gear Synthetic Gear Oil 75W90 1 Quart Bottle
Commercial 5 Royal Purple 75W140 Synthetic Gear Oil, 1 Quart

48
3.3. Results
3.3.1. Viscosity of Base Fluids
In order to produce a gear lubricant base fluid, various polymerized soybean oils are prepared.
Table 14 shows the viscosities at 40 and 100°C and the calculated viscosity index of the base
fluids prepared in this study.
Table 14: Viscosity of Base Fluids
Label Viscosity at 40°C
(mm2/s)
Viscosity at 100°C
(mm2/s)
Viscosity Index
Trans 20 64.24 13.55 220
Trans 21 82.41 15.75 205
Trans 22 101.65 18.25 199
Trans 24 195.45 29.26 190
Trans 25 283.66 40.25 196
Trans 27 1251.56 137.43 222
The Society of Automotive Engineers (SAE) Axle and Manual Transmission Lubricant Viscosity
Classification (SAE J306) gear oil performance specifications are shown in Table 15.

49
Table 15 SAE Specifications for Gear Lubricants [56]
SAE
Viscosity
Grade
Maximum Temperature
for a viscosity of
150,000 cP (°C) ASTM D
2983
Minimum Kinematic
Viscosity (cSt) at
100°C ASTM D 445
Maximum Kinematic
Viscosity (cSt) at 100°C
ASTM D 445
70W -55℃ 4.1 -
75W -40℃ 4.1 -
80W -26℃ 7.0 -
85W -12℃ 11.0 -
80 - 7.0 <11.0
85 - 11.0 <13.5
90 - 13.5 <24.0
140 - 24.0 <41.0
250 - 41.0 -
By polymerizing soybean oil, many different viscosity grades could be achieved. However in
this study only SAE 140 viscosity grade is targeted so Trans 25 was chosen as a base lubricant
because of the optimum viscosity. Currently as described in the Biopreferred program lubricant
market has biobased lubricants that can meet SAE 90 viscosity grade. Due to the lack of ASTM
D 2983 [95] experimental setup this study cannot suggest a W grade for the base fluids however,
viscosity index data in Table 14 indicates that polymerized soybean oil has high viscosity index
implying that low W grades could be achieved.

50
3.3.2. Improvement of Low Temperature Properties
After the base lubricant selection (Trans 25) various pour point depressant (PPD) additives are
evaluated. Figure 24 shows the pour point of Trans 25 with three different PPD additives. The
tests were run using ASTM D-97 test method [87]. Based on the pour point experiments LZ
7671A LZ 7671A was found to demonstrate the best performance and a PPD concentration of
4% concentration selected as an optimum level for the gear oil formulation.
Figure 24: Pour Point Depressant Effect in Trans 25 Polymerized Soybean Oil
To further improve the low temperature characteristics of the gear oil, the base oil is blended
with synthetic fluids. According to USDA biopreferred program biobased gear oil should have at
least 57% biobased material [61]. In this case 10-50% of five synthetic fluids are studied. Figure
16 represents the pour point temperatures for each synthetic fluid blended with Trans 25. In
lower concentrations Esterex A51, P81 and TM101 showed similar behaviors. Due to the
availability and performance 30% Esterex TM101 is selected along with 4% LZ7671A to
improve the cold temperature properties.

51
Figure 25: Comparison of low temperature properties of synthetic fluids in Trans 25
3.3.3. Improvement of Oxidation Stability
Ten different anti-oxidants are evaluated to improve oxidation stability. The tests were
conducted in the PDSC as described previously. Figure 26 shows the onset temperature of all the
anti-oxidant additives that are tested in Trans 25 base oil at a 2% (w/w) concentration level.
Lowinox 22M46 showed the best improvement among all the anti-oxidants. Onset temperature
of Trans 25 without additives is 138.75°C. Since Lowinox 22M46 is a phenol derivative additive
synergistic effects with amine derivatives is highly possible.
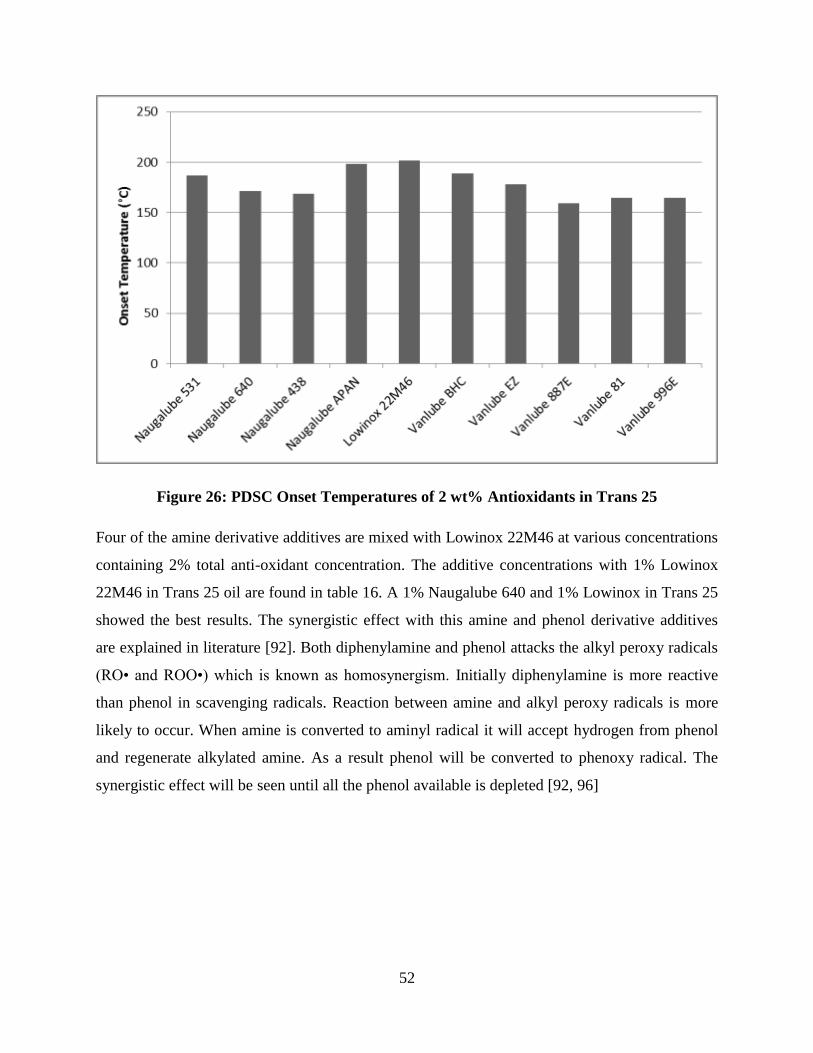
52
Figure 26: PDSC Onset Temperatures of 2 wt% Antioxidants in Trans 25
Four of the amine derivative additives are mixed with Lowinox 22M46 at various concentrations
containing 2% total anti-oxidant concentration. The additive concentrations with 1% Lowinox
22M46 in Trans 25 oil are found in table 16. A 1% Naugalube 640 and 1% Lowinox in Trans 25
showed the best results. The synergistic effect with this amine and phenol derivative additives
are explained in literature [92]. Both diphenylamine and phenol attacks the alkyl peroxy radicals
(RO• and ROO•) which is known as homosynergism. Initially diphenylamine is more reactive
than phenol in scavenging radicals. Reaction between amine and alkyl peroxy radicals is more
likely to occur. When amine is converted to aminyl radical it will accept hydrogen from phenol
and regenerate alkylated amine. As a result phenol will be converted to phenoxy radical. The
synergistic effect will be seen until all the phenol available is depleted [92, 96]

53
Table 16: Anti-Oxidant Blends
AO in Trans 25 with 1% Lowinox 22M46 Onset
Temperature
(°C)
1% Naugalube 640 210.5
1% Naugalube 438 210.4
1% Naugalube 78 208.5
1% Naugalube APAN 206.9
0.5% Naugalube 640 and 0.5% Naugalube 438 207.2
0.5% Naugalube 640 and 0.5% Naugalube 78 206.7
0.5% Naugalube 640 and 0.5% Naugalube APAN 207.0
0.5% Naugalube 438 and 0.5% Naugalube 78 206.5
0.5% Naugalube 438 and 0.5% Naugalube APAN 205.7
0.5% Naugalube 78 and 0.5% Naugalube APAN 203.4
0.33% Naugalube 640, 0.33% Naugalube 438 and 0.33% Naugalube 78 205.7
0.33% Naugalube 640, 0.33% Naugalube 438 and 0.33% Naugalube APAN 205.5
0.33% Naugalube 640, 0.33% Naugalube 78 and 0.33% Naugalube APAN 207.1
0.33% Naugalube 438 and 0.33% Naugalube78, 0.33% Naugalube APAN 206.9
0.25% Naugalube 640, 0.25% Naugalube438, 0.25% Naugalube 78, 0.25%
Naugalube APAN
206.7
3.3.4. Improvement of Wear Prevention Properties
Figure 27 shows the effects of the anti-wear additives. Three antiwear additives were evaluated.
Without any anti-wear additive the base oil showed 0.65 mm wear scar with 0.05 CoF. First
Vanlube 289 and 73 Superplus are tested in four ball at 0.5, 1.0 and 2% concentrations. The 2%
concentrations of both additives have similar results moreover Vanlube 289 which is a borate
ester does not contain any sulphur and phosphorus content so for this application 2% Vanlube
289 is preferred. In order to increase extreme pressure properties 1, 2 and 4% ZDDP additive are
added to the 2% Vanlube 289 formulation. The three concentrations were similar in antiwear

54
tests so 2% ZDDP is used with 2% Vanlube 289 as an anti-wear, extreme pressure additive
combination in the gear oil formulation.
3.3.5. Final Lubricant Package
The final lubricant package contains 59.5% polymerized soybean oil (Trans 25), 30.5 %
synthetic fluid (Esterex TM101), 4% PPD ( LZ 7671A), 2% anti-oxidant (1% Lowinox 22M76
and 1% Naugalube 640) and 4% anti-wear (2% Vanlube 289 and 2% ZDDP) additives.
3.4. Comparison
A primary requirement of bio-based lubricants is to meet or exceed the performance of the
petroleum based product it is attempting to replace. The antiwear properties, oxidation stability
and viscosity index of the final bio-based gear lubricant is compared with the five commercial
gear lubricants described previously in section
3.4.1. Lubricity
The four ball results that are shown in Figure 28. The results demonstrates that bio-based gear
lubricant has equivalent or better lubricity properties than the commercial oils as shown by the r
scar diameter and CoF data. A lower wear scar indicates that the oil is doing a better job
protecting the metal surface from wear
.

55
Figure 27 Four-Ball Results of Antiwear Additive Study

56
Figure 28: Commercial Lubricants and Bio-Based Gear Oil Wear Prevention Comparison
3.4.2. Oxidation Stability
Like many other vegetable oil based lubricant applications, bio-based gear oil has lower
oxidation stability than commercial synthetic and mineral oil based lubricants. Figure 29 shows
the onset temperature of the commercial gear lubricant and the bio-based gear lubricant. The
PDSC oxidation stability of the bio-based gear lubricant exceeds 200°C but is lower than the
commercial fluids however it can still meet the ASTM specifications. In order to fully
understand oxidative properties one should use ASTM D5704 - 10 standard test methods for
evaluation of the thermal and oxidative stability of lubricating oils used for manual transmissions
and final drive axles [97].

57
Figure 29: Commercial Lubricants and Bio-Based Gear Oil Oxidative Stability
Comparison
3.4.3. Temperature-Viscosity Properties
A comparison of the viscosity – temperature of the gear oils is found in Table 17. The Bio-based
gear lubricant has a higher viscosity index than most of the commercial lubricants. Commercial
lubricant 5 has a higher VI but has poorer lubricity properties than the bio-gear oil. Having a
higher viscosity index would imply that viscosity drop at higher temperatures, and viscosity
increase in lower temperatures is less than oils that have a lower viscosity index. However
viscosity index is not a specification in any gear lubricant applications. In order to understand the
low temperature properties ASTM D2983 - 09 method should be employed, which will measure
low-temperature viscosity of lubricants by using a Brookfield viscometer [95].

58
Table 17: Commercial Lubricants and Bio-Based Gear Oil Viscosity Index Comparison
Viscosity at 40°C Viscosity at 100°C Viscosity Index
Commercial 1 129.1 12.25 95
Commercial 2 141.19 12.19 96
Commercial 3 105.48 11.7 136
Commercial 4 119.94 14.51 156
Commercial 5 205.29 24.64 181
Bio Gear Oil 262.6 32.21 165
3.5. Conclusion and Future Work
The need for bio-based lubricants is increasing rapidly. Polymerized soybean oils are a good
candidate for high viscosity lubricant applications. This study showed that a gear lubricant from
polymerized soybean oil could be formulated. Different polymerized vegetable oils are prepared
and blended with synthetic fluids and additives. Low temperature, oxidation stability and anti-
wear properties of the lubricants are tested and final lubricant package is prepared.
Many bench tests have been done to formulate a bio-based gear lubricant from soybean oil.
Polymerized soybean oil offers good anti-wear properties in the comparison with other
commercial gear lubricants. On the other hand the tests that are employed in this study are not
sufficient to understand the full capability of the bio-based gear lubricant that is formulated.
MIL-L-2105D performance requirements should be tested for GL-5 grade gear but in this study
due to the availability of the instruments none of them are investigated. For the future studies
four of the MIL-L-L2105 performance requirements could be tested. These are L-60 thermal
stability test, L-33 water corrosion test, L-37 axle test and L-42 axle shock load test. Thermal
stability test measures viscosity change after heating the oil at high temperature conditions.
Water corrosion test evaluates gear lubricant’s rust and corrosion inhabiting properties under
water contamination at high temperatures. Axle and Axle shock test evaluate oil’s load carrying,
extreme pressure, wear and antiscoring properties by using ring and pinion gears.

59
Chapter 4 Oxidation Studies with Thermogravimetric Analysis
4.1. Introduction
In the literature many methods are suggested to calculate oxidative properties of base fluids.
Penn State Micro Oxidation System (PSMO) is one the more common methods to study
oxidative properties of base fluids. However PSMO test has some limitations which are:
1- Temperatures above 250° cannot be exceeded with current test units.
2- Multiple tests are required to obtain precision and accuracy. Only one data point for
volatiles and deposits can be obtained from each pan.
3- In order to find the amount of deposit; oxidized oil has to be washed with tetrahydrofuran
(THF) which has negative environmental impact.
Vegetable oils have good lubricity, wear protection and low volatility. However they have low
thermal oxidative stability and high deposit formation tendency. While formulating a vegetable
oil based lubricant oxidative stability is one of the most important property to investigate.
Mineral oils and some synthetic esters are more stable but have higher volatility than vegetable
oil [98]. Having a lower volatility and higher deposit formation tendency makes vegetable oils a
good candidate for TGA study.
TGA is a powerful method to monitor the volatility of the materials [99]. Each product in the
reaction has a different volatility and this can be monitored gravimetrically. Monitoring the
reaction time vs. difference in volatility would give information about the kinetic rates. This
study will be focusing on the volatility difference of the each reaction product and their kinetic
rates.
In this study soybean oil is used as a vegetable oil based fluid to study oxidative properties of
vegetable base fluids. Thermal stability and deposit formation characteristics of soybean oil are
studied by isothermal TGA. Heating rate, catalysis, isothermal time and sample weights are
studied at different temperatures.

60
4.1.1. Oxidative Behavior of Oils
Figure 30 represents the oxidation reaction of oil which is a series of 7 pseudo-elementary
reactions rate constants are used to connect 4 different species [100]. Original oil (RH) reacts
with oxygen at a rate of k1 forming primary oxidation product (Q). The primary oxidation
products then form high molecular weight products (P) at a rate of k2. Finally high molecular
weight products form dark deposits at a rate of k3. Besides oxidation each step also includes
evaporation at rates from k4 to k7.
Figure 30: Oxidation Reaction Model
Equations 4.1 to 4.4 are the rate equations for the kinetic model described in Figure 30.
This study aims to calculate all the kinetic rates (k1 to k7) by using TGA and compare the results
with highly accepted PSMO test.
4.2. Experimental
4.2.1. Materials
Alkali refined soybean oil is obtained from ADM packaged oils (Decatur, IL) and used without
any modification. Lowinox 22M46 and Naugalube APAN antioxidants are obtained from
𝑑𝑀𝑅𝐻
𝑑𝑡= −𝑘1𝑀𝑅𝐻 − 𝑘4𝑀𝑅𝐻 (Equation 4.1)
𝑑𝑀𝑄
𝑑𝑡= 𝑘1𝑀𝑅𝐻 − 𝑘2𝑀𝑄 − 𝑘5𝑀𝑄 (Equation 4.2)
𝑑𝑀𝑃
𝑑𝑡= 𝑘2𝑀𝑄 − 𝑘3𝑀𝑃 − 𝑘6𝑀𝑃 (Equation 4.3)
𝑑𝑀𝐷
𝑑𝑡= 𝑘3𝑀𝑃 − 𝑘7𝑀𝐷 (Equation 4.4)

61
Chemtura. PAO 8 is obtained from Chevron-Philips. Other solvents are obtained from Sigma
Aldrich. In this study mostly SBO is investigated because:
1- SBO has low volatility which leads to more deposits. Having more deposits helps to
monitor the reactions easily.
2- Low thermal oxidative stability helps to get oxidation products even at lower
temperatures.
3- Usage of soybean oil is increasing rapidly in lubrication industry.
4- Soybean oil is available worldwide.
4.2.2. Methods
4.2.2.1. Thermogravimetric Analysis
Thermogravimetric Analysis instrument (model Q 500; TAInstruments, New Castle, DE) is used
in various modes which is shown in Table 18.
Table 18: Investigated Experimental Conditions
Isothermal Temperature 200-430 ⁰C
Heating Rate Equilibrium mode and 20⁰C/min ramp
Isothermal Time 100 min
Purge flow Air- N2
Sample weight 0.5 - 9 mg
Purge flow rate 20 ml/min
All the TGA experiments are done in isothermal mode at various temperatures. Isothermal
temperature is achieved by using heating rate of 20°C/min or TA instrument equilibrium mode.
Equilibrium mode uses a decreasing heating rate to avoid overshooting. The isothermal time
starts after the system reaches the isothermal temperature. Dry air and nitrogen are used as purge
gases at constant flow rate of 20 ml/min.

62
Oil is placed in aluminum, copper and steel differential scanning calorimetry (DSC) pans. DSC
pan is then placed in platinum TGA pan which is illustrated in Figure 31.
.
Figure 31: Pan Setup
4.2.2.2. Penn State Micro Oxidation Reactor
PSMO was developed in 1979 at Penn State University to study the thermo-oxidative stability of
engine oils by simulating thin-film conditions in the piston cylinder region. PSMO display many
advantages over bulk oxidation tests. It requires less sample, shorter test durations and employs
uniform catalytic surfaces. However many thin film test variations of the instrument are available
in the market and conventional procedure has not become available. Despite these variations,
lubricant industry still employs the PSMO test for their research needs. A modification of the
PSMO, the CMOT (Caterpillar Micro Oxidation Test) is an accepted ASTM test [3].
The general method described in the literature is used [3], [100]. Figure 32 illustrates a micro-
reactor. Aluminum pans are washed with THF prior to testing, dried under air and placed in
bottles filled with drierite to dry. Glass micro-reactor is cleaned with soap and water, rinsed with
acetone and dried for 12 hours before the experiment. Micro-reactors are placed in the heating
specimen and desired test temperature is set. Flow rate is adjusted to 20 ml/min. Aluminum pans
are weighted, 20 μl oil is placed and weighted again. Once the system reached to the set
temperature, pans are placed over the metal block and time is counted. Sample pans are held in
the reactor for 30, 60, 90 and 120 minutes. Sample pans are removed and rapidly cooled. Once
the oxidation is done pans are weighted again and the difference will give the volatiles. The pan
is washed with THF and weighted again. The remaining material is considered deposit.

63
Figure 32: Micro Oxidation Reactor

64
4.3. Results
4.3.1. Thermogravimetric Analysis
In order to establish a method for TGA many parameters are considered in order to originate the
optimum method. The parameters considered are sample size, heating rate, isothermal
temperature and time and catalysis effects. These parameters will be explained in detail.
4.3.2. Sample Size
Oil placed in the DSC pan has to be in certain limits. If too much oil is placed in the pan thin
film would not be effective so the reaction will be oxygen diffusion limited. However placing
less oil than desired would decrease the repeatability of the experiment because TGA balance
sensitivity would be limiting factor. In order to investigate the optimum sample weight and film
thickness 0.5 mg to 9 mg sample size is studied. Figure 33 demonstrates the sample weight vs.
percent weight loss. Other parameters such as heating rate, test duration, catalysis are kept same
but only weight of the sample is changed. Experiments are done in triplicates and standard error
is calculated. As seen in the Figure 33 increase in the sample weight decreases the standard error
however higher weights leads to lower volatility. Low volatility indicates that the oxidation
reaction has become oxygen diffusion limited. Sample sizes between 3-4 mg have high volatility
and low standard error so throughout this study sample size between 3-4 mg is used. This result
also agrees with PSMO pans where the area of the PSMO pan is four times bigger than the DSC
pans used for TGA studies. As a result PSMO uses 20 μl where TGA experiment uses only 3-4
mg (5 μl) sample.
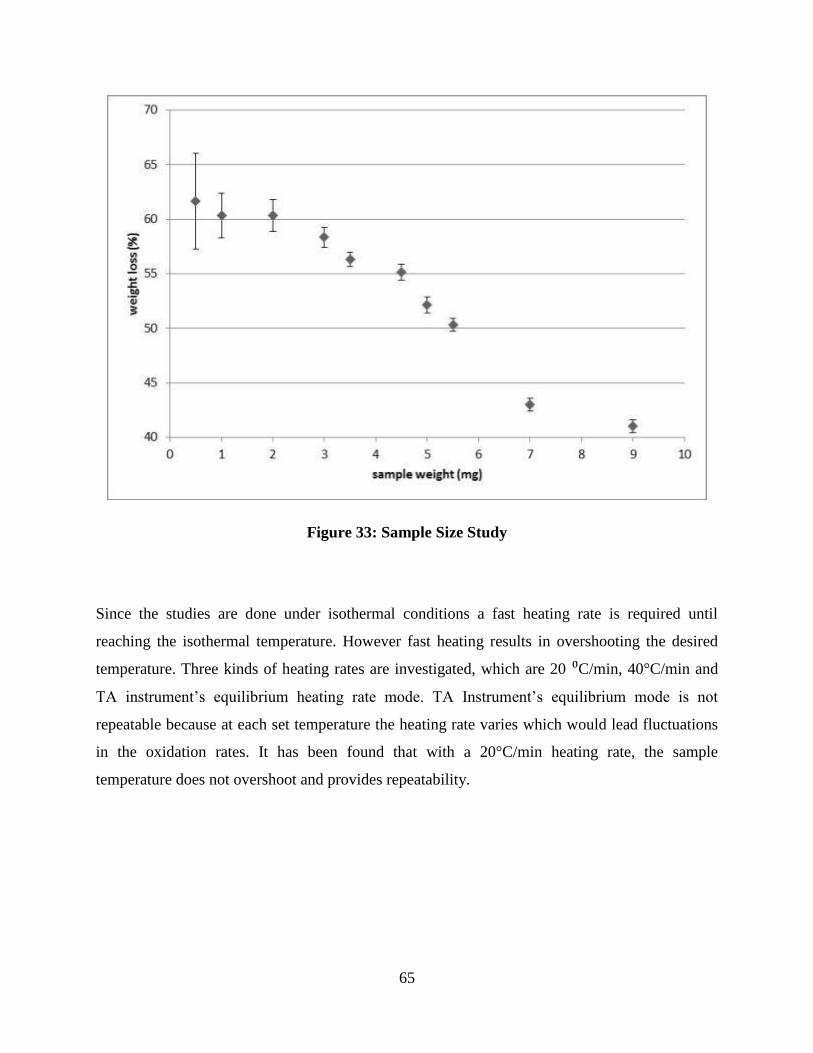
65
Figure 33: Sample Size Study
Since the studies are done under isothermal conditions a fast heating rate is required until
reaching the isothermal temperature. However fast heating results in overshooting the desired
temperature. Three kinds of heating rates are investigated, which are 20 ⁰C/min, 40°C/min and
TA instrument’s equilibrium heating rate mode. TA Instrument’s equilibrium mode is not
repeatable because at each set temperature the heating rate varies which would lead fluctuations
in the oxidation rates. It has been found that with a 20°C/min heating rate, the sample
temperature does not overshoot and provides repeatability.

66
4.3.3. Isothermal Time and Temperature
In order to calculate all the seven kinetic rates the oil has to decompose to a dark deposit. Four
different isothermal times, 15, 25, 40 and 100 are investigated at 350°C with aluminum pan.
These 4 temperatures also corresponds to t1, t2, t3 and t4 respectively in figure 35. After the
TGA experiment pans are weighted again and then washed with THF to remove any liquid
remaining in the pan. This study shows the remaining liquid which could be the original oil or
the primary oxidation products and the remaining deposits which could be dark deposit or high
molecular weight products. The 15, 25 and 40 min isothermal time lost weight after washing
with THF which indicates that there is still liquid remaining in the pan. The remaining liquid
could further react with oxygen or evaporate in the system. The 100 min test result shows no
weight change after washing with THF. This result confirms that all the material remained in the
pan is deposit. Figure 34 shows the pan pictures of 15, 25, 40 and 100 min test results, from left
to right respectively, taken after the washing test. The 15 min test demonstrates that the almost
no deposit is formed. 25 and 40 min tests show that high molecular weight products are formed.
Finally, 100 min test shows only dark deposit which indicates that the oil is fully oxidized and
the only material left in the pan is dark deposit. In TGA study it is important to oxidize the oil
until it is all dark deposit so that all oxidation stages could be monitored. Based on these results
100 min isothermal temperature is chosen for TGA experiments.
Isothermal temperatures from 200 °C to 430°C are investigated by using aluminum pan, 100 min
isothermal time and 3.5 mg sample. Temperatures below 320°C showed that after 100 min oil is
not fully oxidized. Temperatures above 430°C are not investigated because at evaluated
temperatures the oxidation and evaporation kinetics are too high to monitor. The kinetics
experiments for soybean oil are done in the temperature range of 320°C to 430°C.

67
Figure 34: TGA Pans after Test
4.3.4. Pan Selection
Aluminum, steel and copper DSC pans are examined. In all three pans oxidation is observed.
Steel DSC pan showed the highest kinetic rates of oxidation where aluminum pans showed the
lowest. In this study aluminum pans are used only because of the availability.
4.3.5. Final Experimental Conditions
Final experimental conditions are shown in Table 19. Temperature is the only variable to
determine the kinetic rates in this study.
Table 19: Final experimental conditions for TGA study
Isothermal Temperature 320°C -430 ⁰C
Heating Rate 20⁰C/min
Isothermal Time 100 min
Purge flow Air
Sample weight 3-4 mg
Purge flow rate 20 ml/min

68
4.4. Results
4.4.1. Kinetic Rate Calculations in TGA
Figure 35 represents a typical TGA graph that is observed throughout this study. Selected TGA
figures can be found in Appendix D. The appropriate information was extracted from the weight
curves. It is worth mentioning here that at this point, we are working with weights, not
concentrations. Therefore, the pseudo-rate constants obtained here are not truly rate constants,
but only proportional to actual rate constants through this assumption. Plot on the top of the
Figure 35 is the weight of the sample in time scale and the plot at the bottom is the first
derivative of the weight with time. W0 is the weight of the oil placed in the DSC pan and t1, t2
and t3 are the points that are assumed to be the breaking points on the weight rate plot. Time at
the highest point of the dW/dt plot is t1 where RH is converted to Q. It is known Q has the
highest volatility as a result, highest weight loss rate. After t1, the weight loss rate suddenly
decreases and t2, the point where Q is converted to P, can be identified from the dW/dt plot. It is
at the intersection of two tangents, the first at the highest slope of the dW/dt plot, which occurs
near t1, and the lowest slope which is essentially zero. The point where dW/dt equals to zero also
identifies t3 where dark deposit undergoes only evaporation. Evaporation of the dark deposit is
first order reaction, supported by the flat dW/dt graph. The t4 point corresponds to the end of the
100 min isothermal time. From these time points, and their corresponding weights, a series of
pseudo-kinetic equations can be developed (Equation 4.5-4.11), in an analogous to those used in
the PSMO system.

69
Figure 35: TGA Plot

70
Illustration of the TGA graph with the reaction rates could be found in figure 36. RH starts to
oxidize at a rate of k1 until time is equal to t1. During this reaction RH evaporates with rate of
k4. Since the weight loss is only due to evaporation, kinetic rate (k4) is the difference between
W1 and W0 divided by the time difference. Other than evaporation reaction between RH and Q
does not lead to a weight change so the kinetics rate (k1) is one over time difference. Other rates
are calculated similarly. Equation 4.5 through Equation 4.11 is the equations used for calculating
all the kinetic rates from TGA graph.
Figure 36: Illustration of Kinetics in TGA

71
Once all the rates are calculated for all the temperatures activation energy and pre-exponential
factors are calculated using Arrhenius equation (Equation 4.12).
Figure 37 is a representative Arrhenius plot used in this study. Actual graphs, calculated
activation energies and pre-exponential factors could be found at Appendix E. Coefficient of
determinations is varied from 0.78-0.97. The main reason for the low coefficient of
determination in some cases is the heating time. At higher temperatures primary oxidation
products are formed before reaching isothermal temperature which results in scattering. k2 is
effected mostly because of the high kinetic rates.
𝑟1 = 𝑘1 ∙ 𝑊1 =𝑊1
𝑡1−𝑡0⟹ 𝑘1 =
1
𝑡1 (Equation 4.5)
𝑟2 = 𝑘2 ∙ 𝑊2 =𝑊2
𝑡2−𝑡1⟹ 𝑘2 =
1
𝑡2−𝑡1 (Equation 4.6)
𝑟3 = 𝑘3 ∙ 𝑊3 =𝑊3
𝑡3−𝑡2⟹ 𝑘3 =
1
𝑡3−𝑡2 (Equation 4.7)
𝑟4 = 𝑘4 ∙ 𝑊0 =𝑊1−𝑊0
𝑡1−𝑡0⟹ 𝑘4 =
𝑊1−𝑊0
(𝑡1−𝑡0)∙𝑊0 (Equation 4.8)
𝑟5 = 𝑘5 ∙ 𝑊1 =𝑊2−𝑊1
𝑡2−𝑡1⟹ 𝑘5 =
𝑊2−𝑊1
(𝑡2−𝑡1)∙𝑊1 (Equation 4.9)
𝑟6 = 𝑘6 ∙ 𝑊2 =𝑊3−𝑊2
𝑡3−𝑡2⟹ 𝑘6 =
𝑊3−𝑊2
(𝑡3−𝑡2)∙𝑊2 (Equation 4.10)
𝑟7 = 𝑘7 ∙ 𝑊3 =𝑊4−𝑊3
𝑡4−𝑡3⟹ 𝑘7 =
𝑊4−𝑊3
(𝑡4−𝑡3)∙𝑊3 (Equation 4.11)
𝑘(𝑇) = 𝐴𝑒−𝐸𝑅𝑇 (Equation 4.12)

72
Figure 37: Arrhenius Plot
Pre-exponential factor and activation energy could be used to calculate the kinetic rates at any
temperature.
4.4.2. Application to Oxidation Model
These kinetic rates could be applied to equation 4.1 to 4.4 and by solving the differential
equations concentration of each material could be calculated. Matlab is used for solving the first
order differential equation set and Figure 38 represents the results for soybean oil at 300°C.
Matlab computer program for calculating the materials could be found in Appendix F.
ln(k
)
1/T (K)
slope = -E/R
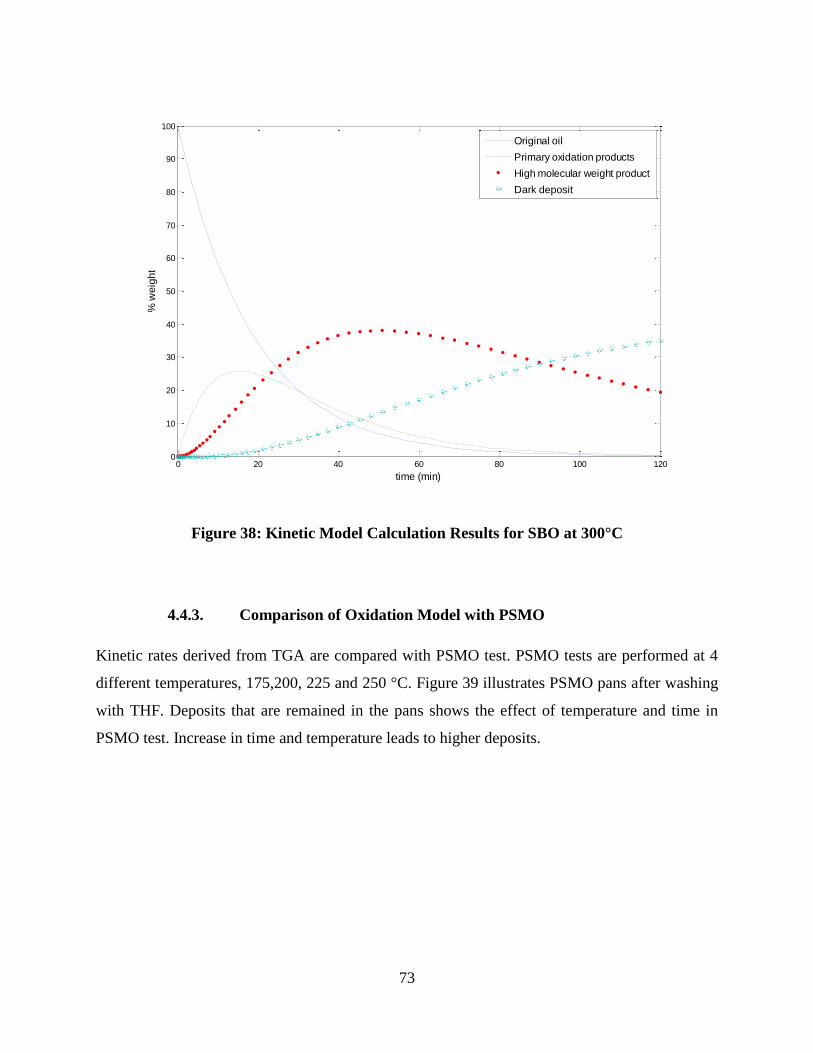
73
Figure 38: Kinetic Model Calculation Results for SBO at 300°C
4.4.3. Comparison of Oxidation Model with PSMO
Kinetic rates derived from TGA are compared with PSMO test. PSMO tests are performed at 4
different temperatures, 175,200, 225 and 250 °C. Figure 39 illustrates PSMO pans after washing
with THF. Deposits that are remained in the pans shows the effect of temperature and time in
PSMO test. Increase in time and temperature leads to higher deposits.
0 20 40 60 80 100 1200
10
20
30
40
50
60
70
80
90
100
time (min)
% w
eig
ht
Original oil
Primary oxidation products
High molecular weight product
Dark deposit

74
Figure 39: Deposit on Micro-Oxidation Pans
Weight after test and deposits are compared with the model derived from TGA experiments.
Figure 40-43 demonstrates the agreement between calculated results from TGA model and
PSMO experiments.

75
Figure 40: Calculations and PSMO Experiments at 175°C
Figure 41: Calculations and PSMO Experiments at 200°C
0 20 40 60 80 100 1200
10
20
30
40
50
60
70
80
90
100
time (min)
% w
eig
ht
Calculated deposit Calculated weight loss Experimental weight loss Experimental deposit
0 20 40 60 80 100 1200
10
20
30
40
50
60
70
80
90
100
time (min)
% w
eig
ht
Calculated deposit Calculated weight loss Experimental weight loss Experimental deposit

76
Figure 42: Calculations and PSMO Experiments at 225°C
Figure 43: Calculations and PSMO Experiments at 250°C
0 20 40 60 80 100 1200
10
20
30
40
50
60
70
80
90
100
time (min)
% w
eig
ht
Calculated deposit Calculated weight loss Experimental weight loss Experimental deposit
0 20 40 60 80 100 1200
10
20
30
40
50
60
70
80
90
100
time (min)
% w
eig
ht
Calculated deposit Calculated weight loss Experimental weight loss Experimental deposit

77
PSMO test at temperatures below 250°C cannot oxidize the products to dark deposits at 120
minute so extended PSMO test is performed at 250°C. 100, 150, 200 and 300 minute tests are
performed in triplicates. Standard error is calculated and results are compared with TGA kinetic
model in Figure 44. High agreement between PSMO and TGA kinetic model is observed.
Figure 44: Calculations and Extended PSMO Experiments at 250°C
Figure 45 represents the deposit remaining from extended PSMO test at 250°C. After 150
minutes washing with THF does not have much effect moreover longer test durations such as
200 and 300 minutes does not change amount of deposit formed. These results also agree with
the TGA kinetic model plot which is plotted in Figure 35.
0 50 100 150 200 250 3000
10
20
30
40
50
60
70
80
90
100
time (min)
% w
eig
ht
Calculated deposit
Calculated remaining weight
Experimental remaining weight
Experimental deposit
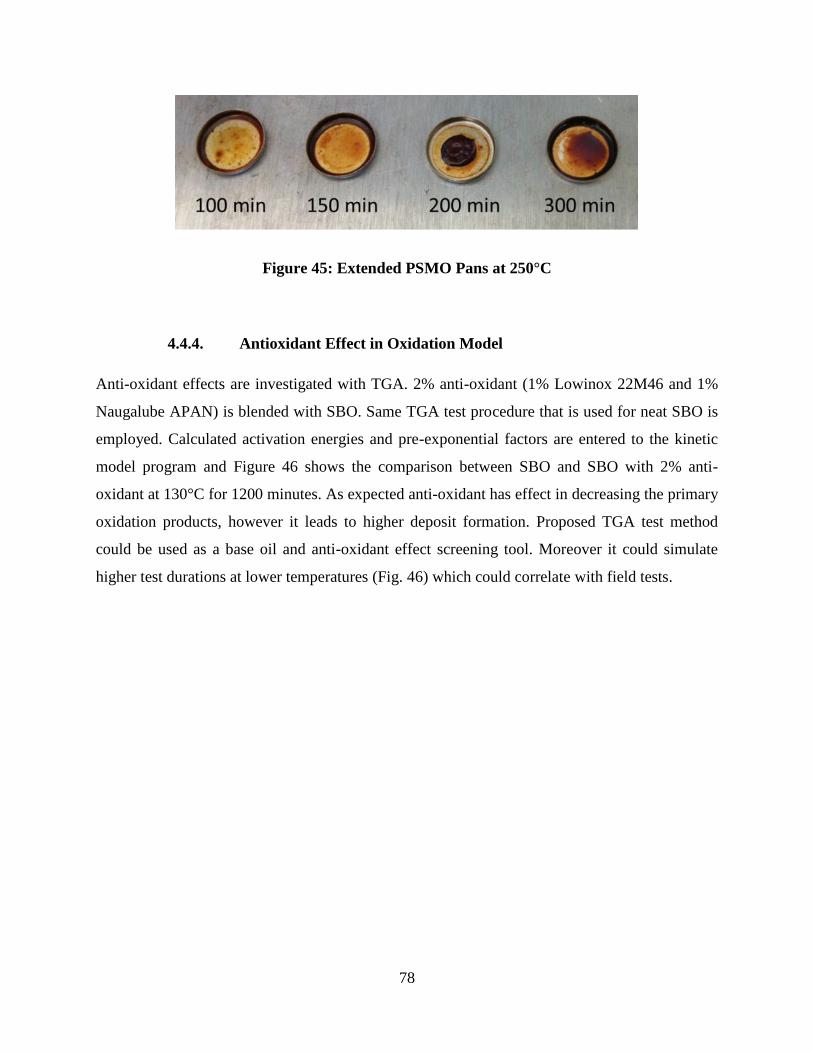
78
Figure 45: Extended PSMO Pans at 250°C
4.4.4. Antioxidant Effect in Oxidation Model
Anti-oxidant effects are investigated with TGA. 2% anti-oxidant (1% Lowinox 22M46 and 1%
Naugalube APAN) is blended with SBO. Same TGA test procedure that is used for neat SBO is
employed. Calculated activation energies and pre-exponential factors are entered to the kinetic
model program and Figure 46 shows the comparison between SBO and SBO with 2% anti-
oxidant at 130°C for 1200 minutes. As expected anti-oxidant has effect in decreasing the primary
oxidation products, however it leads to higher deposit formation. Proposed TGA test method
could be used as a base oil and anti-oxidant effect screening tool. Moreover it could simulate
higher test durations at lower temperatures (Fig. 46) which could correlate with field tests.

79
Figure 46: Anti-Oxidant Effect
4.4.5. Synthetic Fluid Effect
Screening capability of TGA for synthetic fluids is investigated by using PAO 8. PAO 8 is
highly volatile comparing to SBO. High volatility decreases of the accuracy of the tests. 100
minute isothermal test conditions at temperatures between 300-380°C results in deposits
between 3% to 5% where as in SBO it was more than 60%. Correlation of determination is
between 0.6 to 0.97.
Calculations and test results for PAO8 can be found in Appendix G. Kinetic model
calculations at 300°C are plotted in Figure 47. The results do not match the real values where
the deposit should be 5%. In order to increase accuracy lower temperatures with longer test
durations should be investigated with steel pans however this study will not conclude those
results.
0 200 400 600 800 1000
0
20
40
60
80
100
time (min)
% w
eig
ht
SBO original oil
SBO primary oxidation products
SBO high molecular weight products
SBO dark deposit
SBO with 2% AO original oil
SBO with 2% AO primary oxidation products
SBO with 2% AO high molecular weight products
SBO with 2% AO dark deposit

80
Figure 47: PAO8 Calculations
4.5. Conclusion
New test method to calculate oxidative properties of oils is proposed using TGA. TGA is a great
screening tool to analyze the volatility. This study shows that by looking at the time difference
and volatility change, oxidation kinetics could be calculated. In a soybean oil test case, there is a
correlation between instrumentation available in many laboratories to equipment that is less
available. The data is comparable to, and perhaps superior to that obtained by the more laborious
tests. Additionally, this methodology can be applied to more general cases such as other lubricant
systems and conditions such as on steel surfaces, or with anti-oxidant packages.
0 20 40 60 80 100 1200
10
20
30
40
50
60
70
80
90
100
time (min)
% w
eig
ht
Original oil
Primary oxidation product
High molecular weight product
Dark deposit

81
Chapter 5 Conclusions
Vegetable oils are becoming more accepted as a lubricant base oils. This thesis focused on the
thermal polymerization of vegetable oils, application of thermally polymerized oils in gear
lubricants and oxidation kinetics of soybean oil by using TGA.
Structural analysis of thermally polymerized vegetable oils showed no evidance that D-A
reactions can take place. Heating vegetable oil under nitrogen leads to internal C=C bonds
without formation of cyclic derivatives. The chemical structure of the polymerized vegetable oils
has been supported by the data from NMR, PDSC, IV and GPC.
High viscosity gear lubricant has been formulated using thermally polymerized soybean oil by
using conventional performance additives and synthetic fluids. Low temperature properties are
improved by using PPD and synthetic lubricant base stocks. Oxidation stability is enhanced by
using two different anti-oxidants. Finally the lubricity is enriched by adding anti-wear additives.
The properties of the lubricants are tested with PDSC, four ball, pour point apparatus and
viscometer. The final properties are compared with commercial gear lubricants and it has been
found that many properties are comparable.
An Isothermal TGA method that can measure oxidation kinetics by evaluating the difference in
the evaporation is proposed. The oxidation kinetics are calculated and compared with PSMO.

82
Appendix A: Selected NMR Results

83
Trans 1 13
C Dept NMR

84
Trans 1 1H NMR

85
Trans 10 13
C Dept NMR

86
Trans 11 13
C Dept NMR

87
Trans 14 1H NMR

88
Trans 14 13
C Dept NMR

89
Trans 42 1H NMR

90
Trans 42 13
C Dept NMR

91
Appendix B: Selected GPC Results
Sample ID Area % RT(min) MW
Trans 1 34.3 8.4 796.49
65.7 9.22 341.63
Trans 10 73.67 8.48 730.75
26.33 9.25 331.69
Trans 11 40.05 8.47 738.63
59.95 9.27 325.24
Trans 12 100 9.1 384.82
Trans 13 100 9.1 384.82
Trans 14 55.77 8.45 754.67
44.23 9.27 325.24
Trans 42 100 9.33 306.72
Trans 1: Transesterified T-U SBO

92
Trans 10: Polymerized Methyl Linoleate
Trans 11: Polymerized Methyl Linoleate: Methyl Oleate
Trans 12: Methyl Oleate

93
Trans 13: Methyl Linoleate
Trans 14: Polymerized Methyl Conjugated Linoleate: Methyl Oleate
Trans 42: Polymerized Methyl Oleate

94
Appendix C: Selected PDSC Onset Temperatures
Sample ID Average OT Sample ID Average OT
Trans 1 141.98 Trans 23 135.455
Trans 2 121.95 Trans 24 140.46
Trans 3 138.165 Trans 25 138.14
Trans 4 128.49 Trans 26 148.735
Trans 5 168.14 Trans 27 143.4
Trans 6 160.575 Trans 28 150.02
Trans 7 135.815 Trans 29 140.13
Trans 8 151.835 Trans 30 144.94
Trans 10 125.51 Trans 31 182.955
Trans 11 145.93 Trans 32 180.885
Trans 12 177.455 Trans 33 201.705
Trans 13 135.175 Trans 34 145.85
Trans 14 143.4 Trans 35 134.505
Trans 15 132.295 Trans 36 135.75
Trans 16 177.295 Trans 37 169.98
Trans 17 127.46 Trans 38 190.695
Trans 18 136.12 Trans 39 133.07
Trans 19 140.805 Trans 40 178.975
Trans 20 140.61 Trans 41 132.245
Trans 21 136.78 Trans 42 144.17
Trans 22 139.875

95
Appendix D: Selected TGA Graphs
Neat SBO at 340°C Isothermal Mode with Al Catalysis

96
Neat SBO at 380°C Isothermal Mode with Al Catalysis

97
Neat SBO at 410°C Isothermal Mode with Al Catalysis

98
Appendix E: Kinetic Parameters Calculated for SBO
y = -2112.1x + 0.5934 R² = 0.8596
-3.4
-3.2
-3
-2.8
-2.6
-2.4
-2.2
-2
0.0014 0.00145 0.0015 0.00155 0.0016 0.00165 0.0017
ln(k
1)
1/T (K)
k1
y = -6801.1x + 9.0686 R² = 0.7851
-3
-2.5
-2
-1.5
-1
-0.5
0
0.0014 0.00145 0.0015 0.00155 0.0016 0.00165 0.0017
ln(k
2)
1/T (K)
k2

99
y = -10188x + 13.327 R² = 0.97
-4.5
-4
-3.5
-3
-2.5
-2
-1.5
-1
-0.5
0
0.0014 0.00145 0.0015 0.00155 0.0016 0.00165 0.0017
ln (
k3)
1/T (K)
k3
y = -4495.2x + 3.0337 R² = 0.9401
-4.8
-4.6
-4.4
-4.2
-4
-3.8
-3.6
-3.4
-3.2
-3
0.0014 0.00145 0.0015 0.00155 0.0016 0.00165 0.0017
ln(k
4)
1/T (K)
k4

100
y = -9317.2x + 12.121 R² = 0.9301
-4
-3.5
-3
-2.5
-2
-1.5
-1
-0.5
0
0.0014 0.00145 0.0015 0.00155 0.0016 0.00165 0.0017
ln(k
5)
1/T (K)
k5
y = -12150x + 15.368 R² = 0.9619
-6
-5
-4
-3
-2
-1
0
0.0014 0.00145 0.0015 0.00155 0.0016 0.00165 0.0017
ln(k
6)
1/T (K)
k6

101
Calculated kinetic parameters for SBO:
k1 k2 k3 k4 k5 k6 k7
Activation Energy
(J/mol)
1.76E+04 5.65E+04 8.47E+04 3.74E+04 7.75E+04 1.01E+05 5.85E+04
Pre-Exp Coeff 1.81E+00 8.68E+03 6.13E+05 2.08E+01 1.84E+05 4.72E+06 2.77E+02
R^2 0.86 0.79 0.97 0.94 0.91 0.96 0.83
y = -7032.8x + 5.6255 R² = 0.8285
-7
-6.5
-6
-5.5
-5
-4.5
-4
-3.5
-3
0.0014 0.00145 0.0015 0.00155 0.0016 0.00165 0.0017
ln(k
7)
1/T (K)
k7

102
Appendix F: Matlab ® M-File for Kinetic Model
% k = Rate constant
% A = Pre-exponential factor
% Ea = Activation energy
% R = Gas constant
% T = Absolute temperature, K
clc
clear all
global k
T = 320+273; % Kelvin
R= 8.3144; % J/molK
%Kinetic parameters for Soybean Oil
A= [0.815162803 268.6108807 77059.59361 2.125068371 1541.043192 612.469761 0.082226873];
E =[ 11709.19642 36544.89772 66789.85777 21014.80041 46550.63697 45824.6708 16847.19386];
% %Kinetic parameters for Soybean Oil with 2%Anti-oxidant
% A=[2.392505438 8502.285636 749691.6956 12.51489783 376897.1216 9325672.125 5292.461233];
% E=[19071.09593 55995.02578 86071.87147 34612.40885 80922.96157 104829.1676 74059.33629];
%
% %Kinetic parameters for PAO8
%
% A=[0.815162803 268.6108807 10533.15895 2.125068371 1541.043192 83.71756248 0.122647745];
% E=[11709.19642 36544.89772 56337.72705 21014.80041 46550.63697 35372.54008 18947.20033];
%Arhenious Equation
for i=1:7
k(i)= A(i)*exp(-E(i)/(R*T));
end
[T,Y] = ode45(@TGA,[0 120],[100 0 0 0]);

103
RH=Y(:,1);
Q=Y(:,2);
P=Y(:,3);
D=Y(:,4);
Vol=RH+Q;
Dep=P+D;
Total=Dep+Vol;
%PSMO experimental values
PSMOt=[30 60 90 120];
PSMOtext=[100,150,200,300];
vol175=[99.41176471 98.29545455 96.64804469 94.41340782];
dep175= [ 1.176470588 6.25 12.29050279 17.87709497];
vol200=[93.04932735 93.88888889 90.97701149 82.55813953];
dep200= [5.605381166 17.22222222 22.4137931 33.72093023];
vol225=[92.68841395 87.44318182 86.53637351 82.77661795];
dep225= [11.13610799 27.84090909 32.30184582 41.54488518];
vol250=[86.93522047 75.80952381 73.27542156 72.21917808];
dep250= [23.78878606 30.47619048 58.09913132 67.78082192];
extdep250=[56.758 68.76333333 71.62666667 70.87466667];
extvol250=[79.33233333 75.62266667 73.81733333 70.795];
errbardep=[3.008689416 2.535869345 2.175047892 1.733339359];
errbarvol=[3.080672708 1.692010737 2.081665999 1.795711837];
plot(T,Y(:,1),'-',T,Y(:,2),'-.',T,Y(:,3),'.',T,Y(:,4),'*')
hold on
%grid on
% Different Plots
%plot(T,Dep,T,Total,PSMOt,vol250,'*',PSMOt,dep250,'o')
%plot(T,Dep,T,Total,PSMOtext,extvol250,'*',PSMOtext,extdep250,'o')
%plot(T,Dep,T,Total)
%errorbar(PSMOtext,extvol250,errbarvol,'xr')
%errorbar(PSMOtext,extdep250,errbardep,'oc')
xlabel('time (min)','FontSize',12);
ylabel('% weight','FontSize',12);

104
Differential Equations:
function dy = TGA(t,y)
global k
dy = zeros(4,1);
dy(1)=-k(1)*y(1)-k(4)*y(1);
dy(2)=k(1)*y(1)-k(2)*y(2)-k(5)*y(2);
dy(3)=k(2)*y(2)-k(3)*y(3)-k(6)*y(3);
dy(4)=k(3)*y(3)-k(7)*y(4);

105
Appendix G: Kinetic Parameters Calculated for PAO8
y = -1408.3x - 0.2044 R² = 0.8667
-2.7
-2.65
-2.6
-2.55
-2.5
-2.45
-2.4
-2.35
-2.3
-2.25
-2.2
0.0015 0.00155 0.0016 0.00165 0.0017 0.00175 0.0018
ln(k
1)
1/T (K)
k1
y = -6801.1x + 9.0686 R² = 0.7851
-2.5
-2
-1.5
-1
-0.5
0
0.0015 0.00155 0.0016 0.00165 0.0017 0.00175 0.0018
ln(k
2)
1/T (K)
k2

106
y = -8033x + 11.252 R² = 0.9608
-3.5
-3
-2.5
-2
-1.5
-1
-0.5
0
0.0015 0.00155 0.0016 0.00165 0.0017 0.00175 0.0018
ln (
k3)
1/T (K)
k3
y = -2527.5x + 0.7538 R² = 0.6996
-3.9
-3.7
-3.5
-3.3
-3.1
-2.9
-2.7
-2.5
0.0015 0.00155 0.0016 0.00165 0.0017 0.00175 0.0018
ln(k
4)
1/T (K)
k4

107
y = -5598.8x + 7.3402 R² = 0.9283
-3
-2.5
-2
-1.5
-1
-0.5
0
0.0015 0.00155 0.0016 0.00165 0.0017 0.00175 0.0018
ln(k
5)
1/T (K)
k5
y = -5511.5x + 6.4175 R² = 0.8887
-3.5
-3.3
-3.1
-2.9
-2.7
-2.5
-2.3
-2.1
-1.9
-1.7
-1.5
0.0015 0.00155 0.0016 0.00165 0.0017 0.00175 0.0018
ln(k
6)
1/T (K)
k6

108
Calculated kinetic parameters for PAO8:
k1 k2 k3 k4 k5 k6 k7
Activation Energy
(J/mol)
1.17E+04 3.65E+04 6.68E+04 2.10E+04 4.66E+04 4.58E+04 1.68E+04
Pre-Exp Coeff 8.15E-01 2.69E+02 7.71E+04 2.13E+00 1.54E+03 6.12E+02 8.22E-02
R^2 0.87 0.86 0.96 0.70 0.98 0.89 0.65
y = -2026.3x - 2.4983 R² = 0.6492
-6.2
-6.1
-6
-5.9
-5.8
-5.7
-5.6
-5.5
0.0015 0.00155 0.0016 0.00165 0.0017 0.00175 0.0018
ln(k
7)
1/T (K)
k7

109
References
1 Whitby D. Market share of bio-lubricants in Europe and USA. 2004;16:125-129.
2 Erhan S. Vegetable oils as lubricants, hydraulic fluids, and inks. In: Shahidi F, editor.
Bailey's Industrial Oil and Fats Products: Industrial and Nonedible Products from Oils and
Fats. Indianapolis: John Wiley & Sons; 2005.
3 Asadauskas S. Oxidative degradation of fluids based on synthetic and natural esters. Doctor
of Philosophy Dissertation. The Pennsylvania State University; 1997.
4 Cheenkachorn K. A study of structural effects on oxidative stability of soybean oils. PhD
Thesis. 2003.
5 Erhan S. USDA. [Internet]. 2004 Available from:
http://www.ars.usda.gov/is/AR/archive/oct04/soy1004.pdf.
6 Castro W, Perez JM, Erhan SZ, Caputo F. A Study of the Oxidation and Wear Properties of
Vegetable Oils: Soybean Oil Without Additives. J. AOCS. 2006 47–52.
7 Erhan S, Perez J. Biobased Industrial Fluids and Lubricant. AOCS Press; 2002.
8 Perez JM. Vegetable Oil-Based Engine Oils: Are They Practical? In: Erhan S, editor.
Industrial Uses of Vegetable Oils. AOCS Press.
9 Polyols VOB. In: Erhan S, editor. Industrial Uses of Vegetable Oils. 2005.
10 Development of Soy Composites by Direct Deposition. In: Erhan S, editor. Industrial Uses
of Vegetable Oils. AOCS Press; 2005.
11 Mark M, Sandefur K. Vegetable Oils in Paint and Coatings. In: Erhan S, editor. Industrial
Uses of Vegetable Oil. AOCS Press; 2005.
12 Erhan S. Printing Inks. In: Erhan S, editor. Industrial Uses of Vegetable Oils. AOCS Press;
2005.
13 Holser R. Synthesis of Surfactants from Vegetable Oils Feedstocks. In: Erhan S, editor.
Industrial Uses of Vegetable Oils. AOCS Press; 2005.
14 Hörner D. Recent trends in environmentally friendly lubricants. 2002;18(4):327–347.
15 Honary L, Richter E. Biobased Lubricants and Greases. John Wiley& Sons; 2010.

110
16 Fox NJ, Stachowiak GW. Vegetable oil-based lubricants—A review of oxidation.
Tribology International. 2007 1035-1046.
17 Erhan S, Adhvaryu A. Vegetable Oil-Based Base Stocks. In: Perez SEaJ, editor. Biobased
Industrial Fluids and Lubricants. AOCS Press; 2002.
18 Shogren RL, Petrovic Z, Liu Z, Erhan SZ. Biodegradation Behavior of Some Vegetable
Oil-based Polymers. 2004;12(3).
19 Srivastava SP. Advances in Lubricant Additives and Tribology. Tribology Society of India;
2009.
20 Hwang H, Erhan S. Modification of epoxidized soybean oil for lubricant formulations with
improved oxidative stability and low pour point. 2001;78.
21 Erhan SZ, Sharma BK, Liu Z, Adhvaryu A. Oils, Lubricant Base Stock Potential of
Chemically Modified Vegetable. J. Agric. Food Chem. 2008;56:8919-8925.
22 Sharma BK, Adhvaryu A, Liu Z, Erhan SZ. Chemical modification of vegetable oils for
lubricant applications. J. Amer. Oil Chem. Soc. 2006;83(2).
23 Gast LE, Schneider WJ, Forest CA, Cowan JC. Composition of methyl esters from heat-
bodied linseed oils. J. Amer. Oil Chem. Soc. 1963;40:287-289.
24 Schneider MP. Review: Plant-oil-bades lubricants and hydraulic fluids. 2006;86:1769-
1780.
25 Erhan SZ, Bagby MO, inventors. Vegetable Oil-based Printing Ink. 1992 Jun 16. 5122188.
26 Erhan SZ, Bagby MO. Polymerization of vegetable oils and their uses in printing inks. J.
Amer. Oil Chem. Soc. 1994;71(11).
27 Erhan SZ, Bagby MO, inventors. Vegetable Oil-based Offset Printing Inks. 1998. Feb 3.
5713990.
28 Erhan SZ, Bagby MO, Nelsen TC. Drying properties of metathesized soybean oil. J. Amer.
Oil Chem. Soc. 1997;74(6).
29 Erhan SZ, Sheng Q, Hwang HS. Volatile by-products during heat polymerization of
soybean oil. J. Amer. Oil Chem. Soc. 2003;80(2).
30 Wang C, Erhan S. Studies of thermal polymerization of vegetable oils with a differential

111
scanning calorimeter. J. Amer. Oil Chem. Soc. 1999;76(10).
31 Guo A, Javni I, Petrovic Z. Rigid polyurethane foams based on soybean oil. J. Appl.
Polym. Sci. 2000;2(77):457-473.
32 Khot SN, Lascala JJ, Can E, Morye SS, Williams GI, Palmese GR, Kusefoglu SH, Wool
RP. Development and application of triglyceride-based polymers and composites. J. Appl.
Polym. Sci. 2001;3(82):703-723.
33 Bradley TF, Johnston WB. Drying Oils and Resins Reactions Involving the Carbon-to-
Carbon Unsaturation during the Thermal Treatement of Some Esters of Unsaturated C18
Fatty Acids. Industrial & Engineering Chemistry. 1940;32:802-809.
34 Brod JS, France WG, Evans WL. Thermal Polmerization of Ethyl Eleostearate and 9, 11-
and 9, 12-Ethyl Linoleate. Industrial & Engineering Chemistry. 1939;31:114-118.
35 McHale M. Connexions. [Internet]. Available from: http://cnx.org/content/m15191/latest/.
36 Doll KM. A Convenient Low-Resolution NMR Method for the Determination of the
Molecular Weight of Soybean Oil-Based Polymers. J. Assoc. Lab. Autom. 2009;14:185-
189.
37 Lozada Z, Suppes GJ, Hsieh FH, Lubguban A, Tu YC. Preparation of Polymerized
Soybean Oil and Soy-Based Polyols. Journal ofAppliedPolymer Science. 2009;112:2127–
2135.
38 Smith B. Infrared Spectral Interpretation. CRC Press; 1998.
39 Liu Z, Erhan SZ. Preparation of Soybean Oil Polymers with High Molecular Weight. J
Polym Environ; 2010.
40 Henne AL, Turk A. Conjugated Diolefins by Double Bond Displacement. J. Am. Chem.
Soc. 1942;64:826-828.
41 Cowan JC. lsomerization Reactions of Drying Oils. Industrial & Engineering Chemistry.
1949;41:294-304.
42 Clingman AL, Sutton DA. The chemistry of polymerized oils. II. Dehydro-polymers of
methyl linoleate and methyl stearate. 1953;30:53-56.
43 Larock RC, Dong X, Chung S, Kishan Reddy C, Ehlers LE. Preparation of conjugated
soybean oil and other natural oils and fatty acids by homogeneous transition metal

112
catalysis. J. Amer. Oil Chem. Soc. 2001;78:447-453.
44 Paschke RF, Peterson LE, Wheeler DH. Dimer acid structures. the thermal dimer of methyl
10-trans, 12-trans, linoleate. J. Amer. Oil Chem. Soc. 1964;41:723-727.
45 Paschke RF, Jackson JE, Wheeler DH. Thermal Polymerization of Drying Oils Isomers of
Methyl Linoleate. Industrial & Engineering Chemistry. 1952;44:1113-1118.
46 Wheeler DH, Milun A, Linn F. Dimer acid structures: Cyclic structures of clay catalyzed
dimers of normal linoleic acid, 9-cis, 12-cis-Octadecadienoic acid. J. Amer. Oil Chem. Soc.
1970;47:242-244.
47 Beal RE, Lauderback LL, Ford JR. Soybean soapstock utilization: Fatty acid adducts with
ethylene and 1-butene. JAOCS. 1975;52:400-403.
48 Eren T, Kusefoglu SH, Wool R. Polymerization of maleic anhydride-modified plant oils
with polyols. J. Appl. Polym. Sci.. 2003;90:197-202.
49 Biermann U, Butte W, Eren T, Haase D, Metzger JO. Regio- and stereoselective Diels-
Alder additions of maleic anhydride to conjugated triene fatty acid methyl esters. European
Journal of Organic Chemistry. 2007 3859-3862.
50 Figge K. Dimeric fatty acid [1-14C] methyl esters. I. Mechanisms and products of thermal
and oxidative-thermal reactions of unsaturated fatty acid esters - literature review. Chem.
Phys. Lipids. 1971;6:159-177.
51 Gertz C, Klostermann S, Kochhar SP. Testing and comparing oxidative stability of
vegetable oils and fats at frying temperature. Eur. J. Lipid Sci. Technol. 2000;102:543-551.
52 Hwang HS, Erhan S. Lubricant Base Stocks from Modified Soybean Oil. AOCS Press;
2002.
53 Bokade VV, Yadav GD. Synthesis of Bio-Diesel and Bio-Lubricant by Transesterification
of Vegetable Oil with Lower and Higher Alcohols Over Heteropolyacids Supported by
Clay (K-10). Process Safety and Environmental Protection. 2007;85(5):372-377.
54 Biodiesel Production. [Internet]. 2007 Available from:
http://en.wikipedia.org/wiki/Biodiesel_production.
55 Dresel W, Mang T. Lubricants and Lubrication. 2nd ed. Wiley-Vch; 2007.
56 Lakes SC. Automotive Gear Lubricants. In: Rudnick LR, editor. Synthetics, Mineral Oils,

113
and Bio-based Lubricants. CRC Press; 2006.
57 Schodel UF. Automatic Transmission Fluids.; 1992.
58 Lauer D. Industrial Gear Lubricants. CRC Press; 2006.
59 Pirro DM, Wessol AA. Lubrication Fundimentals. 2nd ed. Marcel Dekker; 2001.
60 ELMUSA. Multi Purpose Gear Lubricant. [Internet]. Available from:
http://www.elmusa.com/products/datasheets/general/elm_80W90_multipurpose_gear_lube.
pdf.
61 Biopreferred. [Internet]. Available from: http://www.biopreferred.gov.
62 ASTM. D6866 11 Standard Test Methods for Determining the Biobased Content of Solid,
Liquid, and Gaseous Samples Using Radiocarbon Analysis. 2011.
63 Voith M. Start-ups reveal biobased chemicals. Chem. Eng. News. 2010;7(88).
64 Tullo AH. Catalyzing Biobased Chemicals. Chem. Eng. News. 2010;88(38).
65 Erhan SZ, Sharma BK, Perez JM. Oxidation and low temperature stability of vegetable oil-
based lubricants. 2006;24(3):292-299.
66 Hill K. Industrial development and application of biobased oleochemicals. In: Kamm B,
Gruber PR, Kamm M, editors. Biorefineries- Industrial processes and products, status quo
and future directions. Wiley VCH; 2006. p. 291-314.
67 Cosgrove JP, Church DF, Pryor WA. The kinetics of the autoxidation of polyunsaturated
fatty acids. Lipids. 1987;5(22):299-304.
68 Yeh PW. Microoxidation tests with mineral oils coupled with gel permeation
chromatographic analysis. The Pennsylvania State University: Thesis; 1977.
69 Cvitkovic E. Reaction Rate Studies in Ester Oxidation. Master Thesis. 1976.
70 Shah RJ. Development of a bench scale test to evaluate lubricants for use with alternative
fuels. Doctor of Philospohy Dissetation. The Pennsylvania State University; 1995.
71 ASTM. D5483 - 05 Standard Test Method for Oxidation Induction Time of Lubricating
Greases by Pressure Differential Scanning Calorimetry. American Society for Testing and
Materials; 2010.

114
72 Dunn RO. Antioxidants for improving storage stability of biodiesel. Biofuel Bioprod.
Biorefining. 2008;4(2):304-318.
73 Sharma BK, Stipanovic AJ. Development of a new oxidation stability test method for
lubricating oils using high-pressure differential scanning calorimetry. Thermochim. Acta.
2003;402(1-2).
74 Adhvaryu A, Erhan SZ, Liu ZS, Perez JM. Oxidation kinetic studies of oils derived from
unmodified and genetically modified vegetables using pressurized differential scanning
calorimetry and nuclear magnetic resonance spectroscopy. Thermochimica Acta.
2000;364(1-2).
75 Flynn JH, Wall LA. A quick, direct method for the determination of activation energy from
thermogravimetric data. J. Polym. Sci. B Polym. Lett. 1966;4(5):323-328.
76 Takaoka K, Kobayashi K. Study of thermal oxidation of thin film of trilinolein by
thermogravimetric analysis. JAOCS. 1986;63(11):1447-1451.
77 Litwinienko G, Dabrowska M. Thermogravimetric investigation of antioxidant activity of
selected compounds in lipid oxidation. J. Therm. Anal. 2001;65(2):411-417.
78 Rodriguez RP, Sierens R, Verhelst S. Thermal and kinetic evaluation of biodiesel derived
from soybean oil and higuereta oil. J. Therm. Anal. 2009;96(3):897-901.
79 Hsu CICaSM. A chemical kinetics model to predict lubricant performance in a diesel
engine. Part I: Simulation methodology. 2003;14(2).
80 Hsu SM, Cummings AL. Thermogravinetric Analysis of Lubricants.; 1983.
81 procedures SMHaCICPIBt. A chemical kinetics model to predict diesel engine
performance. 14(2).
82 Li H, Hsu SM. Thermal Oxidative Characteristics of some High Temperature Diesel
Lubricants.
83 Yuan W, Hansen AC, Zhang Q. Vapor pressure and normal boiling point predictions for
pure methyl esters and biodiesel fuels. Fuel. 2005;84(7-8).
84 ASTM. D1545 - 07 Standard Test Method for Viscosity of Transparent Liquids by Bubble
Time Method. American Society for Testing and Materials; 2007.
85 ASTM. ASTM D1959-97 Standard Test Method for Iodine Value of Drying Oils and Fatty

115
Acids. 1997.
86 Adhvaryu A, Sevim EZ. Epoxidized soybean oil as a potential source of high-temperature
lubricants. 2002;15(3):247-254.
87 ASTM. D97 Standard Test Method for Pour Point of Petroleum Products. 2009.
88 Adhvaryu A, Erhan SZ, Perez JM. Wax appearance temperatures of vegetable oils
determined by differential scanning calorimetry: effect of triacylglycerol structure and its
modification. 2002;395(1-2):191-200.
89 Asadauskas S, Erhan SZ. Depression of pour points of vegetable oils by blending with
diluents used for biodegradable lubricants. 1999;76(3):313-316.
90 ASTM. D445 Standart Test Method for Kinematic Viscosity of Transparent and Opaque
Liquids and Calculation of Dynamic Viscosity. 2006.
91 ASTM. ASTM D2270 Standard Practice for Calculating Viscosity Index From Kinematic
Viscosity at 40 and 100°C. American Society for Testing and Materials; 2010.
92 Dong J, Migdal C. Antioxidants. In: Rudnick L, editor. Lubricant Additives: Chemistry and
Applications. Dekker; 2007.
93 ASTM. D4172 Standard Test Method for Wear Preventive Characteristics of Lubricating
Fluid. American Society for Testing and Materials; 2010.
94 RT Vanderbilt. [Internet]. 2011 Available from: http://www.rtvanderbilt.com/.
95 ASTM. D2983 Standard Test Method for Low-Temperature Viscosity of Lubricants
Measured by Brookfield Viscometer. American Society for Testing and Materials; 2009.
96 Sharma BK, Perez JM, Erhan SZ. Soybean oil-based lubricants: A search for synergistic
antioxidants. Energy & Fuels. 2007;17:2408-2414.
97 ASTM. D5704 - 10 Standard Test Method for Evaluation of the Thermal and Oxidative
Stability of Lubricating Oils Used for Manual Transmissions and Final Drive Axles. 2010.
98 Rudnick L, Bartz W. Comparison of Synthetic, Mineral Oil and Bio-Based Lubricant
Fluids. In: Rudnick L, editor. Synthetics, Mineral Oils, and Bio-based Lubricants. CRC
Press; 2006. p. 331-349.
99 Gustavsson B. Volatility Determination of Oils by TG. 1991;175.

116
100
0
Naidu SK, Klaus EE, Duda JL. Evaluation of liquid phase oxidation products of ester and
mineral oil lubricants. Ind. Eng. Chem. Prod. Res. Dev. 1984;23(4):613-619.