oxford, milton keynes, cambridge northampton growth … · econometrics study the property market...
TRANSCRIPT

Oxford, Milton Keynes, Cambridge Northampton Growth Corridor
National Infrastructure
Commission
Transport Infrastructure
Assessment: Final Report
November 2017
Our ref: 23142501
Client ref: CCCC17A41


Steer Davies Gleave has prepared this material for National Infrastructure Commission. This material
may only be used within the context and scope for which Steer Davies Gleave has prepared it and may
not be relied upon in part or whole by any third party or be used for any other purpose. Any person
choosing to use any part of this material without the express and written permission of Steer Davies
Gleave shall be deemed to confirm their agreement to indemnify Steer Davies Gleave for all loss or
damage resulting therefrom. Steer Davies Gleave has prepared this material using professional practices
and procedures using information available to it at the time and as such any new information could alter
the validity of the results and conclusions made.
Oxford, Milton Keynes, Cambridge Northampton Growth Corridor
National Infrastructure
Commission
Transport Infrastructure
Assessment: Final Report
November 2017
Our ref: 23142501
Client ref: CCCC17A41
Prepared by:
Prepared for:
Steer Davies Gleave
28-32 Upper Ground
London SE1 9PD
National Infrastructure Commission
5th Floor, 11 Philpot Lane
London EC3M 8UD
+44 20 7910 5000
www.steerdaviesgleave.com

November 2017
Contents
Executive Summary ....................................................................................................................... i
Overview ........................................................................................................................................ i
Methodology ................................................................................................................................. i
Findings ..........................................................................................................................................ii
1 Introduction ....................................................................................................................... 3
Context ......................................................................................................................................... 3
Overview of method ..................................................................................................................... 4
Structure of this report ................................................................................................................. 5
2 The Corridor ....................................................................................................................... 6
Introduction .................................................................................................................................. 6
The Strategic Road Network ......................................................................................................... 6
The Rail Network ........................................................................................................................ 11
3 Methodology.................................................................................................................... 14
Introduction ................................................................................................................................ 14
The Regional Dynamic Model ..................................................................................................... 14
Scenario Specification ................................................................................................................. 17
4 Findings ........................................................................................................................... 23
The opportunity cost of transport congestion and crowding .................................................... 23
The transport impacts of growth without new east-west infrastructure .................................. 24
The contribution of East West Rail and the Oxford to Cambridge Expressway to delivering new
homes and settlements .............................................................................................................. 29
The impacts of new growth on the wider highway network ..................................................... 32
The integration of first-mile last-mile transport in urban areas ................................................. 36

November 2017
Figures
Figure 2.1: Road network hierarchy within the study area .......................................................... 7
Figure 2.2: Existing highway network flows (AM peak) and constraints ..................................... 8
Figure 2.3: Shortlisted Oxford to Cambridge Expressway Options ............................................ 10
Figure 2.4: Existing rail network constraints (average AM peak load factor on departure) ...... 12
Figure 3.1: Simplified schematic of the Regional Dynamic Model ............................................. 15
Figure 4.1: Percentage increase in demand on the Strategic Highway Network and Major Local
Road Network between 2015 and 2031 ..................................................................................... 26
Figure 4.2: Percentage increase in demand on the Strategic Highway Network and Major Local
Road Network between 2015 and 2041 ..................................................................................... 27
Figure 4.3: Percentage increase in demand on the Strategic Highway Network and Major Local
Road Network between 2015 and 2050 ..................................................................................... 28
Figure 4.4: Changes in AM peak journeys on the Strategic Highway Network and Major Local
Road Network following construction of the Oxford to Cambridge Expressway (2050) ........... 34
Figure 4.5: Changes in AM peak journeys on the Strategic Highway Network and Major Local
Road Network following construction of Eastern Section of East West Rail (2050) .................. 35
Figure 4.6: Overview of 2050 First-Mile Last-Mile strategies .................................................... 37
Tables
Table 3.1: Market segmentation categories used in the RDM ................................................... 17
Table 3.2: Land-use scenarios (housing and jobs growth) ......................................................... 18
Table 3.3: Indicative development locations (to 2050) by typology and geography ................. 19
Table 3.4: Transport supply scenarios (highway and rail enhancements) ................................. 20
Table 3.5: First-mile last-mile journey time assumptions .......................................................... 21
Table 3.6: Land-use and transport supply scenarios .................................................................. 22
Table 4.1: Households and jobs suppressed in the absence of transport investment
(thousands) ................................................................................................................................. 23
Table 4.2: The incremental effect of the Expressway (Thousands) (Growth Scenario C) .......... 29
Table 4.3: The Incremental effect of East West Rail (Thousands) (Growth Scenario C) ............ 30
Table 4.4: The incremental effect of EWR and the Expressway (Thousands) (Growth Scenario C)
.................................................................................................................................................... 31

Oxford, Milton Keynes, Cambridge Northampton Growth Corridor | Transport Infrastructure Assessment: Final Report
November 2017 | i
Executive Summary
Overview
This report presents the findings of a study to inform the national Infrastructure Commission
on:
• the impact that different patterns of spatial development (for both households and
businesses) might have on the performance, capacity and sustainability of the strategic
road network, other primary routes and national rail network within the Cambridge-
Milton Keynes- Oxford Corridor, and between this corridor and other destinations; and
• the development of effective and deliverable long-term strategies for first/last mile
transport in Cambridge, Oxford, Milton Keynes and Northampton.
It provides a strategic assessment of the impact that specific, indicative development
scenarios could have on the performance, capacity and sustainability of the strategic highways
network, other key road links, and the national rail network to 2050. In doing so, it presents a
high-level assessment of:
• network usage and spare capacity within today’s strategic road and rail network;
• the impact that trend-based growth in travel demands will have on the network to 2050;
and
• the impact that planned and committed schemes (Including East West Rail and the Oxford
to Cambridge Expressway) will have in supporting/enabling this growth and changing
travel behaviours.
To understand the impact of alternative growth scenarios on the strategic road and rail
networks, a range of land-use and transport supply scenarios have been tested. The land-use
scenarios are based on the growth scenarios defined within the Savills and Cambridge
Econometrics study The Property Market Within the Cambridge – Milton Keynes – Oxford
Corridor, and further developed by 5th Studio and SQW in their Cambridge, Milton Keynes and
Oxford Future Planning Options Project (2017). Transport-supply scenarios relate to delivery of
proposed rail and road infrastructure within the corridor (specifically East West Rail and the
Oxford to Cambridge Expressway) in addition to the delivery of long-term strategies for first-
mile last-mile transport in Cambridge, Oxford, Milton Keynes and Northampton.
Methodology
The scenarios described above have been simulated within an implementation of Steer Davies
Gleave’s Regional Dynamic Model (RDM), which was designed specifically to look at how
transport, people, employers and land-use interact over time to 2050. It was designed and
built to test how long-term regional strategies of the type envisaged in this report might
perform in future, showing what does and does not work, and where future constraints will
affect outcomes.
The model covers the Cambridge, Milton Keynes, Oxford and Northampton Growth Corridor
and a broad hinterland around it (including London). It is then populated with information
about numbers of households, population, employers and jobs, each of them split into various
categories that have been tailored to reflect the socio-economic and demographic
characteristics of the corridor.

Oxford, Milton Keynes, Cambridge Northampton Growth Corridor | Transport Infrastructure Assessment: Final Report
November 2017 | ii
Findings
The outputs of the RDM scenario tests were used to respond to assess the following
questions:
• Without the Oxford to Cambridge Expressway and East West Rail, what is the impact on
achieving for the transformational growth potential of the corridor?
• Without the Oxford to Cambridge Expressway and East West Rail, where are the pinch-
points and severely congested links, both now and in the future?
• To what extent do the Oxford to Cambridge Expressway and East West Rail support the
housing and employment potential for the corridor?
• With the delivery of the Oxford to Cambridge Expressway and East West Rail, to what
extent can the supporting highway network accommodate growth in travel demand?
• To what extent do the four 2050 First-Mile Last-Mile strategies for the largest cities and
towns along the corridor support the transformational growth potential of the corridor?
The results of the analysis indicate that:
• Without the delivery of the Oxford to Cambridge Expressway and East West Rail, it is
forecast that almost 100,000 new homes and almost 300,000 additional jobs would be
suppressed under the highest growth scenario – the scenario aligned to the National
Infrastructure Commission’s transformational goal of an additional one million homes in
the corridor.
• Without the delivery of the Oxford to Cambridge Expressway and East West Rail, not only
would the number of additional home and jobs be suppressed but the Strategic Transport
Network and major local transport network would require significant investment in order
to not suppress additional homes and jobs further.
• The Oxford to Cambridge Expressway contributes the most additionality in terms of jobs
and homes.
• Together, the Oxford to Cambridge Expressway and East West Rail result in higher
forecasts of jobs (4,500 more), than the sum of their impacts individually.
• Also, together, both schemes increase the labour market catchment of London – so
London benefits too with higher forecasts of jobs (30,000 more).
• The Strategic Highway Network and major local transport network will experience
increased congestion as a result of construction of the Oxford to Cambridge Expressway
and East West Rail, principally the M40, M1, A1(M) and M11. This is as a result of the
network better functioning as a network to increased labour market catchments.
• Completion of East West Rail also results, typically, in incremental increases in highway
demand as commuters drive to and from rail stations, but also to additional jobs
supported by the rail investment.
• Further investment is required to accommodate additional travel demand, either on the
highway network or through mode shift to more sustainable alternatives.
• Strategic and local transport interventions will better achieve the envisaged growth
potential in this corridor, as well as helping to achieve wider social and environmental
objectives.
• Planning should continue on the 2050 First-Mile Last-Mile strategies to develop
integrated, robust, and deliverable plans which optimise the benefits of strategic
investment.

Oxford, Milton Keynes, Cambridge Northampton Growth Corridor | Transport Infrastructure Assessment: Final Report
November 2017 | 3
Context
1.1 In March 2016, the Chancellor of the Exchequer asked the National Infrastructure Commission
(hereafter referred to as “the NIC” or “the Commission”) to:
“make recommendations to maximise the potential of the Cambridge – Milton Keynes – Oxford
corridor as a single, knowledge intensive cluster that competes on the global stage, whilst
protecting the area’s high-quality environment and securing the homes and jobs the area
needs. The commission will look at the priority infrastructure improvements needed and assess
the economic case for which investments would generate the most growth.”
1.2 In response to this brief, the Commission published its interim report on the Cambridge -
Milton Keynes - Oxford Corridor in November 2016. The Commission’s central finding was
that:
“a lack of sufficient and suitable housing presents a fundamental risk to the success of the
area. Without a joined-up plan for housing, jobs and infrastructure across the corridor, it will
be left behind by its international competitors. By providing the foundations for such a
strategy, new east-west transport links present a once-in-a-generation opportunity to secure
the area’s future success.”
1.3 While the undersupply of housing is considered to be the single largest constraint on growth in
the corridor, this situation is exacerbated by poor east-west connectivity and limited first-mile
last-mile connectivity into town/city centres and other employment locations. As a result,
commuting between key hubs along the corridor is limited and the area does not function as a
coherent single labour market. In order to meet the corridor’s housing and connectivity needs,
therefore, significant changes to the way in which housing and infrastructure are planned and
financed are needed.
1.4 Among its interim findings the NIC recommends that local authorities, Local Enterprise
Partnerships, government departments and national delivery agencies should work together
to:
• Develop an integrated strategic plan for infrastructure, housing and jobs across the
corridor; and
• Develop proposals for the joint governance arrangements required to deliver coordinated
planning.
1.5 In light of the above, to inform its final report on the corridor the NIC commissioned Steer
Davies Gleave to provide advice and analysis on:
• the impact that different patterns of spatial development (for both households and
businesses) might have on the performance, capacity and sustainability of the strategic
road network, other primary routes and national rail network within the Cambridge-
Milton Keynes- Oxford Corridor, and between this corridor and other destinations; and
• the development of effective and deliverable long-term strategies for first/last mile
transport in Cambridge, Oxford, Milton Keynes and Northampton.
1 Introduction

Oxford, Milton Keynes, Cambridge Northampton Growth Corridor | Transport Infrastructure Assessment: Final Report
November 2017 | 4
1.6 This study, therefore, provides a strategic assessment of the impact that specific, indicative
development scenarios could have on the performance, capacity and sustainability of the
strategic highways network, other key road links, and the national rail network to 2050. It
provides a high-level assessment of:
• network usage and spare capacity within today’s strategic road and rail network;
• the impact that trend-based growth in travel demands will have on the network to 2050;
and
• the impact that planned and committed schemes (Including East West Rail and the Oxford
to Cambridge Expressway) will have in supporting/enabling this growth and changing
travel behaviours.
1.7 In addition, it examines how more ambitious growth scenarios might impact on the strategic
road and rail networks, and the extent to which transport bottlenecks and constraints might
act as a barrier to delivery of those growth scenarios.
Overview of method
1.8 At the core of the method applied has been an implementation of Steer Davies Gleave’s
Regional Dynamic Model (RDM), which was designed specifically to look at how transport,
people, employers and land-use interact over time to 2050. The model covers the Cambridge,
Milton Keynes, Oxford and Northampton Growth Corridor and a broad hinterland around it
(including London). The model contains 215 zones, each of which is populated with
information about numbers of households, population, employers and jobs, each of them split
into various categories that have been tailored to reflect the socio-economic and demographic
characteristics of the corridor1.
1.9 The model runs a simulation that calculates how conditions change over time. At each time-
step (one-year) it looks at how all its ‘actors’ (households, businesses, developers) perceive
and experience their world, and estimates how they will respond over the next time increment
(change job, relocate their business, build more houses etc.). In doing so it recognises that
people and organisations cannot respond immediately but that changes take time and are
often lagged. It subsequently makes corresponding incremental changes, updates its
assessment of conditions, and repeats the process. A simplified, schematic diagram of the
model, is provided in Figure 3.1.
1.10 In order to understand the impact of alternative growth scenarios on the strategic road and
rail networks a range of land-use and transport supply scenarios have been tested. The land-
use scenarios are based on those defined within the Savills’ study The Property Market Within
the Cambridge – Milton Keynes – Oxford Corridor which informed the Commission’s interim
report, and subsequently developed by 5th Studio and SQW in their Cambridge, Milton Keynes
and Oxford Future Planning Options Project (2017). These housing-led projections have then
been augmented with observed data on household structure (employment, occupation and
skill levels) to identify the level of employment required to sustain the forecast growth in
housing and workforce across the corridor2.
1 For example, identifying that the inner-city terraced housing areas of Oxford and Cambridge are occupied typically by a different demographic to similar properties in many other English cities.
2 The majority of supporting information and assumptions are derived from Census 2011, Business Register and Employment Survey and UK Business Counts data

Oxford, Milton Keynes, Cambridge Northampton Growth Corridor | Transport Infrastructure Assessment: Final Report
November 2017 | 5
1.11 Transport-supply scenarios relate to delivery of proposed rail and road infrastructure within
the corridor, specifically East West Rail and the Oxford to Cambridge Expressway, in addition
to the delivery of long-term strategies for first-mile last-mile transport in Cambridge, Oxford,
Milton Keynes and Northampton.
1.12 The results of these scenario tests have been used to assess the following questions:
• Without the Oxford to Cambridge Expressway and East West Rail, what is the impact on
achieving for the transformational growth potential of the corridor?
• Without the Oxford to Cambridge Expressway and East West Rail, where are the pinch-
points and severely congested links, both now and in the future?
• To what extent do the Oxford to Cambridge Expressway and East West Rail support the
housing and employment potential for the corridor?
• With the delivery of the Oxford to Cambridge Expressway and East West Rail, to what
extent can the supporting highway network accommodate growth in travel demand?
• To what extent do the four 2050 First-Mile Last-Mile strategies for the largest cities and
towns along the corridor support the transformational growth potential of the corridor?
Structure of this report
1.13 The remainder of this report is structured as follows:
• Section 2 introduces the study corridor, summarises the current performance of the
strategic road and rail networks within the corridor, and describes planned and
committed enhancements.
• Section 3 provides additional detail regarding the RDM, and an outline of our approach to
assessing the four long-term strategies for first-mile last-mile transport.
• Section 4 summarises the results of our analysis into the impact of different patterns of
spatial development upon the performance, capacity and sustainability of the strategic
road and rail networks.
• Appendix A provides indicative rail service specifications used to assess the impact of East
West Rail.

Oxford, Milton Keynes, Cambridge Northampton Growth Corridor | Transport Infrastructure Assessment: Final Report
November 2017 | 6
Introduction
2.1 Previous work undertaken for the Commission (Cambridge-Milton Keynes-Oxford Corridor:
Transport Workstream) demonstrates that the cities along the corridor operate largely as self-
contained labour markets with limited interaction. This was recognised to be partially due to
the physical distances between cities, their size, and the relatively poor connectivity of orbital,
inter-urban links.
2.2 The best example of this limited physical connection is the absence of an east-west rail
connection or an obvious high-quality road link, meaning both end-to-end and inter-urban
journeys need to be undertaken via London termini or via single carriageway links. This
situation has led the main urban centres in the study area to draw their labour from the
immediate vicinity, with the cities of Oxford and Cambridge showing the least interaction with
other towns and cities in the corridor. The limited capacity and capability of the transport
networks, particularly within city centres, may limit the pool of labour available to employers
in Oxford and Cambridge3. In contrast, where better public transport links are available, more
labour market interaction has occurred, as reflected in the Milton Keynes – Northampton –
Bedford cluster.
The Strategic Road Network
2.3 The study area is generally well served by the Strategic Road Network (SRN). The M11, A1(M),
M1 and M40 are radial in orientation, resulting in good overall connection into London and the
M25, towards the Midlands, and to the North; but east-west connectivity is poor with large
sections of single carriageway, both on primary and secondary roads (see Figure 2.1).
Currently, the roads providing the east to west connectivity are the A34, A43, A45, A14, A428,
and A421.
2.4 As shown in Figure 2.2, data compiled from Highways England’s latest Route Strategies
indicates that the most common issues are congestion, safety and capacity constraints4. The
figure also shows an estimate of the quantity of AM peak trips on the strategic highway
network in 2015. This forms the basis for the assessment of network constraints under the
alternative land-use and transport-supply scenarios described in Section 3.
3 The causal link, however, may run in the opposite direction. The relatively tight labour, and hence commuter, market may have led to high congestion and delays, particularly during peak periods when workers are trying to access the urban centres. In practice, a combination of the two effects is likely to occur.
4 Route Strategies, Highways England (March 2017)
2 The Corridor

Oxford, Milton Keynes, Cambridge Northampton Growth Corridor | Transport Infrastructure Assessment: Final Report
November 2017 | 7
Figure 2.1: Road network hierarchy within the study area

Oxford, Milton Keynes, Cambridge Northampton Growth Corridor | Transport Infrastructure Assessment: Final Report
November 2017 | 8
Figure 2.2: Existing highway network flows (AM peak) and constraints

Oxford, Milton Keynes, Cambridge Northampton Growth Corridor | Transport Infrastructure Assessment: Final Report
November 2017 | 9
Challenges and opportunities
2.5 On the M1, junctions 8, 10, 12 and 15 are congested, have poor safety performance, and
frequent delays. There is also persistent and increasing traffic congestion, and a concentration
of incidents and accidents, on the A34 from the M4 to Oxford.
2.6 Increasing development pressures are expected from the ‘Knowledge Spine’ Opportunity Area
of Science Vale, Oxford and Bicester as well as in locations such as Banbury, which are likely to
further increase demand on the A34. Modelling work commissioned by Oxford County
Council5 found that the main junction providing access to and from North Oxford, via the A34,
is forecast to be operating over capacity by 2026. The M40 linking west London to the area
just east of Oxford and further to Banbury has congestion and capacity constraints at junctions
connecting into Bicester and Oxford.
2.7 Congestion on the A421 is expected to increase and the upgrade of the A428 is expected to
add additional pressure to the A4216. Modelling work commissioned by Buckinghamshire
County Council shows that the link capacity issues on the A421 could intensify by 2031, with
evidence suggesting future growth in Aylesbury Vale and Milton Keynes could be constrained
if capacity problems are not addressed.
2.8 The A428 is earmarked for improvements within the Road Investment Strategy (RIS 1)
programme and is expected to be implemented in early 20207. Its role in supporting commuter
movements between St Neots and Cambridge and planned growth in Cambourne and Bourne
Airfield will be addressed through a Highways England committed scheme. The A43
(Northampton) has slow and/or unreliable journeys with negative impacts on strategic growth
sites and planned future employment sites.
2.9 Finally, in addition to the Strategic Road Network, the central networks and ring roads of the
cities in the study area are also constrained. With the exception of Milton Keynes, which has a
unique grid-based street pattern, Cambridge, Northampton and Oxford experience congestion
on the radial routes leading to the city/town centres, especially during the peak periods. This
congestion tends also to be reflected on the ring roads and at specific junctions connecting to
the inter-urban network.
2.10 The previous work undertaken for the Commission included analysis of traffic speeds across
the corridor and showed that north-south connections are generally faster (30-40 mph) than
east-west connections (20-30 mph) particularly to Swindon, Oxford, Luton and Stevenage. This
reflects the orientation and extent of motorway infrastructure. Except for Luton, all the local
authority networks were found to have higher average speeds than the England average,
although some are recognised to have recorded sharp declines in recent years, potentially
indicating increased pressure from local growth8.
5 Oxford to Cambridge Expressway Strategic Study: Stage 3 Report (Department for Transport, November 2016), pg. 12
6 Ibid 3
7 http://roads.highways.gov.uk/projects/a428-black-cat-to-caxton-gibbet/
8 Cambridge-Milton Keynes-Oxford Corridor Transport Workstream (Arup, February 2017), pg. B10

Oxford, Milton Keynes, Cambridge Northampton Growth Corridor | Transport Infrastructure Assessment: Final Report
November 2017 | 10
Road Network Enhancements
2.11 In addition to the aforementioned works to improve the A428 (to create an Expressway-like
standard link between Milton Keynes and Cambridge via Bedford), the latest Road Investment
Strategy (DfT, 2015) describes a series of committed schemes scheduled for delivery along the
corridor. These include the A14 Cambridge to Huntingdon corridor upgrade (north-south),
M11 Junctions 8 to 14 Technology Upgrade (north-south), A34 Oxford Junctions (primarily
north-south) and A34 Technology Enhancements (north-south) which will address some of the
issues identified.
2.12 The Road Investment Strategy also recommended delivery of a Strategic Route Study into road
connections between Oxford and Cambridge via Milton Keynes. The Strategic Route Studies
were intended to address the biggest challenges facing the road network, and which are too
large and too complex to fix in a single Road Period. One of six such studies. the resulting
Oxford to Cambridge Expressway Strategic Study: Stage 3 Report (DfT and Highways England,
2016) identified that the benefits of an Oxford to Cambridge Expressway were promising
enough to take them forward to the next stage of assessment.
2.13 A subsequent, and ongoing, stage of this study will undertake a more detailed qualitative and
quantitative assessment of the short-listed Expressway schemes illustrated in Figure 2.3.
Figure 2.3: Shortlisted Oxford to Cambridge Expressway Options
Source: Based on Figure 0-1 Oxford to Cambridge Expressway Strategic Study: Stage 3 Report
Cambridge
Milton
Keynes
Oxford

Oxford, Milton Keynes, Cambridge Northampton Growth Corridor | Transport Infrastructure Assessment: Final Report
November 2017 | 11
The Rail Network
2.14 The rail network in the study area is presented in Figure 2.4. As with the road network, north-
south infrastructure prevails, with limited links available east to west. Figure 2.4 also highlights
the average loading of trains (passengers as a proportion of total seats) during the morning
peak period.
2.15 These estimates are taken from the MOIRA 2.2 rail planning and forecasting model, and
represent base demand from March 2016, allocated to the rail network using the summer
2016 weekday timetable. The morning peak period is defined as any train departing between
0700 and 0959.
2.16 To the southern edge of the corridor, average peak period load factors on departure from
Aylesbury, High Wycombe and Welwyn Garden City exceed 100%. This is a feature of the
availability of fast and semi-fast services into central London, with a substantial number of
commuters travelling into the capital and very few passengers from further afield
disembarking at these stations.
2.17 By contrast, on the West Coast Main Line (WCML), the average load factor on departure from
Milton Keynes is between 50% - 60%. This is lower than the average load factor on departure
from Leighton Buzzard (between 70% - 80%) since, in part, Milton Keynes is an attractor of rail
commuters and therefore a number of WCML passengers will disembark in the city. It is also a
stopping point for northbound InterCity West Coast services which are less heavily loaded
than southbound services towards London during the AM Peak
2.18 It should be noted, however, that average load factors reported over an extended period of
time (such as the morning peak) do not fully capture the passenger experience of crowding
which can differ significantly between individual train services. For example, the most acutely
crowded service on departure from Milton Keynes in the morning peak has a load factor of
190% i.e. it is carrying 90% more passengers than seats.
2.19 While, in part, the average load factors presented in Figure 2.4 are as much an artefact of the
rail service stopping pattern as they are network and service constraints, they suggest that the
southern end of the Chiltern Mail Line, the West Coast Main Line and the East Coast Main Line
are highly capacity constrained.
2.20 Further, detailed analysis of rail ticket sales data shows that the largest flows originating and
ending in the study area (excluding London) are:
• Royston to Cambridge and Ely;
• Didcot Parkway to Oxford and Banbury;
• Stevenage to Hitchin and Letchworth;
• Milton Keynes to Northampton; and
• Bedford to Luton.
2.21 These sections of the network are expected to be put under increasing pressure should
demand increases in the future as forecast. For example, Network Rail Route Studies show
that average peak hour loading between Cambridge and Ely is expected to reach up to 80% of
capacity by 2043 without investment.

Oxford, Milton Keynes, Cambridge Northampton Growth Corridor | Transport Infrastructure Assessment: Final Report
November 2017 | 12
Figure 2.4: Existing rail network constraints (average AM peak load factor on departure)

Oxford, Milton Keynes, Cambridge Northampton Growth Corridor | Transport Infrastructure Assessment: Final Report
November 2017 | 13
Rail Network Enhancements (East West Rail)
2.22 Network Rail has recently conducted a consultation on the details for Phase 2 of East West
Rail, which proposes the upgrade and reconstruction of:
• the mothballed section between Bicester and Bletchley;
• the mothballed section between Aylesbury Vale Parkway and Calvert Junction (which
connects to the Bicester – Bletchley section);
• the existing railway between Princes Risborough and Aylesbury Vale Parkway; and
• the existing railway between Bletchley and Bedford.
2.23 After consultation is complete, it is expected that relevant powers will be applied for in Spring
2018. Funding arrangements are not yet confirmed, but the East West Rail Consortium may
seek a range of government and non-government funding to be able to deliver the above
works in the early 2020s.
2.24 The “Central Section” of the project is planned to fill the gap between Bedford and Cambridge.
As this will involve construction of a new alignment, the details of which have not yet been
finalised, it is unlikely that trains will be running before 2030. At this stage, detailed train
service specifications are not available but some options, via Sandy, have been shortlisted. In
order to assess the impact of East West Rail on the delivery of housing and employment
growth in the corridor it has been necessary to develop an indicative service specification for
East West Rail. This is provided at Appendix A. In addition to passenger services there is an
expectation that parts of the railway could be used to carry freight.
2.25 To accommodate East West Rail services, additional infrastructure investment would be
required for the southern approach tracks at Cambridge, platforms and northern approach
tracks at Oxford. In addition, the West Coast Main Line (WCML) between Bletchley and Milton
Keynes Central is heavily used and it will be difficult to timetable the proposed East West Rail
services over this section9.
2.26 Notwithstanding the above, some sections of the existing railway have the potential to
accommodate more train services as part of wider improvements to the rail network in the
study area.
• The Bedford to Bletchley section has two tracks except for a critical section near Bletchley.
After implementation of East West Rail Phase 2 the East West Rail Consortium anticipates
there will be two trains per hour, but it is highly likely that capacity for further additional
services exists on this route.
• The mothballed sections between Bletchley- Bicester were built as double track and will
not act as capacity constraints.
• The re-opened section between Bicester and Oxford has two tracks. After implementation
of East West Rail Phase 2 the East West Rail Consortium anticipates there will be four
trains per hour. Subject to suitable signalling, this route has the potential capacity to
handle further additional trains as far as Oxford Parkway.
• The existing section between Didcot Parkway and Reading has four tracks and is not
considered significantly constrained.
9 The capacity released on the West Coast Main Line following the commencement of HS2 services provides an opportunity to optimise the timetable along this section of the route, including the accommodation of East West Rail services.

Oxford, Milton Keynes, Cambridge Northampton Growth Corridor | Transport Infrastructure Assessment: Final Report
November 2017 | 14
Introduction
3.1 The NIC commissioned Steer Davies Gleave to provide advice and analysis on:
1. the impact that different patterns of spatial development (for both households and
businesses) might have on the performance, capacity and sustainability of the strategic
road network, other primary routes and national rail network within the Cambridge-
Milton Keynes- Oxford Corridor, and between this corridor and other destinations; and
2. the development of effective and deliverable long-term strategies for first-mile last-mile
transport in Cambridge, Oxford, Milton Keynes and Northampton.
3.2 This section describes the approach taken to meeting the NIC’s requirements, with particular
emphasis on the Task 1. Additional detail regarding the approach to Task 2 is presented
alongside a summary of findings in a separate report Oxford, Milton Keynes, Cambridge,
Northampton Growth Corridor: Strategy Assessment Report.
The Regional Dynamic Model
Introduction
3.3 The RDM is a simulation of how people, employment, transport and land-use10 all interact with
each other over long periods of time. It was designed and built to test how long-term regional
strategies of the type envisaged in this report might perform in future, showing what does and
does not work, and where future constraints will affect outcomes.
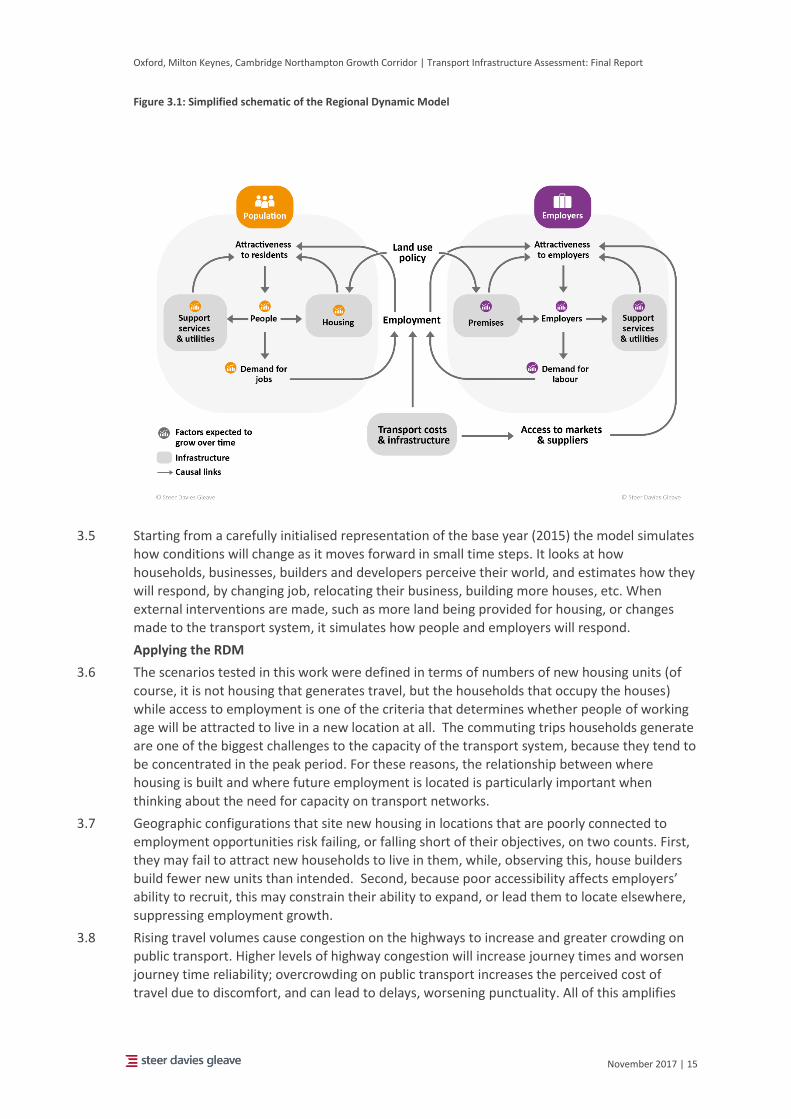
3.4 Figure 3.1 below, provides an overview of what is in the model. The attractiveness of places to
live in is affected by the availability of housing, employment and support services and utilities
(like health provision and schooling); while for employers the attractiveness is driven by the
availability of premises, the ability to recruit a suitable workforce, and access to markets and
suppliers. Transport provides the link between the two, giving people access to employment
opportunities, and employers access to their markets, suppliers and a workforce.
10 Shorthand for what gets built on the land, especially housing and employment premises.
3 Methodology
Oxford, Milton Keynes, Cambridge Northampton Growth Corridor | Transport Infrastructure Assessment: Final Report
November 2017 | 15
Figure 3.1: Simplified schematic of the Regional Dynamic Model
3.5 Starting from a carefully initialised representation of the base year (2015) the model simulates how conditions will change as it moves forward in small time steps. It looks at how
households, businesses, builders and developers perceive their world, and estimates how they will respond, by changing job, relocating their business, building more houses, etc. When
external interventions are made, such as more land being provided for housing, or changes
made to the transport system, it simulates how people and employers will respond.
Applying the RDM
3.6 The scenarios tested in this work were defined in terms of numbers of new housing units (of
course, it is not housing that generates travel, but the households that occupy the houses) while access to employment is one of the criteria that determines whether people of working age will be attracted to live in a new location at all. The commuting trips households generate
are one of the biggest challenges to the capacity of the transport system, because they tend to be concentrated in the peak period. For these reasons, the relationship between where housing is built and where future employment is located is particularly important when
thinking about the need for capacity on transport networks.
3.7 Geographic configurations that site new housing in locations that are poorly connected to
employment opportunities risk failing, or falling short of their objectives, on two counts. First, they may fail to attract new households to live in them, while, observing this, house builders
build fewer new units than intended. Second, because poor accessibility affects employers’ ability to recruit, this may constrain their ability to expand, or lead them to locate elsewhere,
suppressing employment growth.
3.8 Rising travel volumes cause congestion on the highways to increase and greater crowding on public transport. Higher levels of highway congestion will increase journey times and worsen
journey time reliability; overcrowding on public transport increases the perceived cost of travel due to discomfort, and can lead to delays, worsening punctuality. All of this amplifies

Oxford, Milton Keynes, Cambridge Northampton Growth Corridor | Transport Infrastructure Assessment: Final Report
November 2017 | 16
the effect of poor positioning of housing and employment. For many employers, there is a
double impact because they will also find it harder to get the access they need to their customers and suppliers.
3.9 For each growth scenario tested, the RDM was told where new housing and employment
growth is proposed. In each case it was told how many hectares of land would be available for
new construction in each of its 215 zones, and when that land would become available. (the
details are described below). This provides development capacity into which houses and
commercial property can grow.
3.10 Starting from its initial base year, the model simulates how conditions change from month to
month over the simulated period to 2050. When new land becomes available for housing, the
simulated housebuilders will build new houses, and will continue to do so until either the
allocated land runs out, or the housing vacancy rate becomes too high because they fail to
attract enough occupants11. Households will be attracted into the new housing for as long as it
is available, but the inflow will slow or even stop if local unemployment rates rise too much.
3.11 A similar process works for employers. As new land for employment becomes available, the
simulated developers will construct new premises, and will continue to do so until either the
land is fully occupied, or property vacancy rates become too high. Employers will be attracted
into the new premises, but if they find they cannot recruit the workforce they need
(manifested by high job vacancy rates) or have poor access to customers and suppliers, the
expansion of employment will halt.
3.12 Rising congestion increases travel times in the model, reducing recruitment catchments and
worsening the connections to customers and suppliers. The major new schemes proposed in
the corridor (East West Rail and the Oxford to Cambridge Expressway) can be switched on at
predetermined years, generating step changes in travel times and rail fares between zones in
the model that counter some of the deterioration in travel conditions through time due to
rising congestion.
3.13 Finally, the RDM is aware of different types of people, households, housing etc, and that they
have different requirements and preferences. Table 3.1 below summarises the main
categories used. It also simulates the effect of highways, rail, bus and walk / cycle travel
modes, across 215 zones.
11 Construction rates will be halved when vacancies reach 6%, and reduced by 97% when they reach
12%.

Oxford, Milton Keynes, Cambridge Northampton Growth Corridor | Transport Infrastructure Assessment: Final Report
November 2017 | 17
Table 3.1: Market segmentation categories used in the RDM
Entity How many? Types
Zones 215 151 in the Oxford to Cambridge corridor, 12 in London and 52 representing the rest of the UK
Employers 8 Advanced Manufacturing, Knowledge Service Sectors, Primary, Finance and Business, Education, Retail and Catering, Other Industry and Manufacturing, Other Services12
Employment premises 4 Commercial offices, Shops hotels and restaurants, Research and manufacturing premises, Other
Workforce skills 3 Manual, Skilled, Expert
Housing 6 Detached, Semi-Detached, Premium Terrace, Standard Terrace, Flats & Other, Student accommodation
Households* 5 NS-SeC 1-2, NS-SeC 3-4-5, NS-SeC 6-7, NS-SeC 8, Students
People 5 Non-Work Age, Manual, Skilled, Expert, Students
Source: Steer Davies Gleave * The National Statistics Socio-economic Classification is a system used to differentiate positions within labour markets and production units in terms of their typical ‘employment relations’ e.g. NS-SeC 1 represents ‘higher managerial, administrative and professional occupations’, NS-SeC 3 represents ‘intermediate occupations’ etc.
Scenario Specification
3.14 To understand the impact of alternative growth scenarios on the strategic road and rail
networks a range of land-use and transport supply scenarios have been tested. The land-use
scenarios are based on the growth scenarios defined within the Savills and Cambridge
Econometrics study The Property Market Within the Cambridge – Milton Keynes – Oxford
Corridor, and further developed in the Cambridge, Milton Keynes and Oxford Future Planning
Options Project (5th Studio and SQW, 2017). Transport-supply scenarios relate to delivery of
proposed rail and road infrastructure within the corridor (specifically East West Rail and the
Oxford to Cambridge Expressway) in addition to the delivery of long-term strategies for first-
mile last-mile transport in Cambridge, Oxford, Milton Keynes and Northampton.
Land-use scenarios
Households
3.15 To determine the distribution of land for housing and commercial development in future
years, scenarios have been developed to represent future growth in households and jobs (see
Table 3.2). Three levels of housing growth have been considered, which broadly correspond to
the business as usual, incremental growth and transformational growth scenarios specified by
Savills and Cambridge Econometrics13. . In each case the housing scenarios include local
expansion, plus a requirement of up to 7,000 households per annum to accommodate
overspill demand from London.
12 Mainly health and education. They are generated in the model in proportion to the increases in households.
13 These scenarios were determined following analysis of growth in the property market and drawing upon extensive local knowledge from local authority partners.

Oxford, Milton Keynes, Cambridge Northampton Growth Corridor | Transport Infrastructure Assessment: Final Report
November 2017 | 18
Table 3.2: Land-use scenarios (housing and jobs growth)
Scenario Housing growth Total additional housing (by 2050)
Housing distribution Total additional jobs (by 2050)
A 22,000 p.a. 726,000 NTEM 754,000
B 27,000 p.a. 891,000 NTEM 969,000
C 30,900 p.a. 1,020,000 NTEM/5th Studio 1,089,000
3.16 Under land-use Scenario A and Scenario B, total growth in households has been distributed
according to the planning trajectories described in the Department for Transport’s National
Trip End Model (NTEM), with the most significant growth occurring in Bedford, Cambridge,
Milton Keynes and Oxford. Significant growth is also forecast in towns in or near to the
corridor which have plans for future growth, including Banbury, Bicester, Aylesbury and
Dunstable.
3.17 By contrast, the distribution of household growth in Scenario C is based around the
development typologies put forward in the Cambridge, Milton Keynes and Oxford Future
Planning Options Project for the National Infrastructure Commission. These typologies and
their distribution were used to inform a workshop between the Steer Davies Gleave study
team and the NIC to generate an indicative ‘transformational growth’ scenario.
3.18 Within Scenario C, 278,000 households are located in new, largely autonomous, settlements
with a further 25,000 in small new settlements. A further 375,000 households are expected to
be delivered through a mix of urban intensification and extension around the main centres of
Oxford, Cambridge, Bedford and Milton Keynes. In order to meet the target growth level of
30,900 households per year, the remaining 342,000 households are distributed across the
study area using the National Trip End Model as in Scenario A and Scenario B.
3.19 5th Studio’s projected totals for each location (Calvert, Sandy, Bassingbourn, Marston Vale,
Bedford, Milton Keynes, Cambridgeshire and Oxfordshire) and the assumptions about how
that growth is distributed are summarised in Table 3.3.

Oxford, Milton Keynes, Cambridge Northampton Growth Corridor | Transport Infrastructure Assessment: Final Report
November 2017 | 19
Table 3.3: Indicative development locations (to 2050) by typology and geography
Type of Development Location New Households (2016-2050)
New autonomous town or city
Calvert 160,000
Sandy 75,000
Bassingbourn 43,000
Total 278,000
New small settlement
Marston Vale 25,000
- of which in Ridgmont 20%
- of which in Woburn Sands 40%
- of which in Stewartby 40%
Total 25,000
Extension or Intensification of an existing growth centre
Bedford (Local Authority District) 43,000
- of which city intensification 25%
- of which south of Bedford 75%
Milton Keynes (Local Authority District) 134,000
- of which city intensification 50%
- of which in Bletchley 25%
- of which to the SW (towards Aylesbury) 25%
Cambridgeshire County Council 76,000
Oxfordshire County Council 122,000
Total 375,000
Source: Based on Cambridge, Milton Keynes and Oxford Future Planning Options Project (5th Studio and SQW, 2017)
3.20 When compared to Scenario A and Scenario B, broadly speaking, growth is directed away from
Cambridge and Oxford and towards the new settlements around Sandy, Bassingbourn and
Calvert as well the densification of Milton Keynes and Bedford (south of the city centre). These
new and expanded settlements are provided with transport connections to the established
major employment centres through East West Rail and the Oxford to Cambridge Expressway.
Employment
3.21 Employment growth in the study area is directly linked to the growth in households. The total
growth in jobs is considered to be the level of employment required to sustain the forecast
growth in housing and workforce across the corridor.
3.22 To maintain a balance between workforce and jobs, the growth in employment has been
determined by the ratio of workers to households and jobs to workers as forecast by the
National Trip End Model in the period 2016 to2050. Because of falling household sizes, the
ratio of workers to households drops over the study period from 1.24 in 2016 to 0.99 in 2050.
However, the proportion of jobs per worker remains steady around 1.07 over the study
period. In Scenario A and Scenario B, average ratios across the corridor have been used. In
Scenario C, where there is localised growth, ratios have been altered for those model zones
containing Sandy, Bassingbourn and Calvert to better reflect expected work patterns.

Oxford, Milton Keynes, Cambridge Northampton Growth Corridor | Transport Infrastructure Assessment: Final Report
November 2017 | 20
3.23 The following assumptions have been used in allocating jobs to the new settlements outlined
by 5th Studio and SQW:
• In Calvert, the future jobs-to-workforce ratio has been set to be the same as Milton
Keynes in 2016. This provides a substantial pool of 191,000 jobs and a full mix of
employment types.
• In Sandy, a similar approach has been taken. However, because the development is
expected to have more people commuting to employment in other cities (principally
Cambridge, Bedford and Milton Keynes), the ratio has been set lower, to the same as
Bedford in 2016. This results in an allocation 74,000 allocated jobs.
• In Bassingbourn the employment base is expected to be primarily local tertiary services,
so the jobs-to-workforce ratio has been set to that of a comparable commuter town (St
Albans) and creating 39,000 new jobs. The model is constrained to provide new
employment infrastructure for services (health, schools), offices and shops, but not
factories or warehousing in this area.
Transport-supply scenarios
3.24 Transport-supply scenarios related to the delivery of East West Rail and the Oxford to
Cambridge Expressway have been developed. These are summarised in Table 3.4, with further
detail regarding the rail timetable assumptions provided in Appendix A.
Table 3.4: Transport supply scenarios (highway and rail enhancements)
Scenario Description
Highway
A Committed/ongoing RIS 1 enhancements to the A428.
B
Full implementation of the Oxford to Cambridge Expressway, including enhancements to the A34 (Oxford) and A428 (Milton Keynes to Cambridge) to deliver ‘expressway’ standard, and completion of the ‘missing link’ between the M1 and M40 (this is based upon an assumption that the Oxford to Cambridge Expressway will follow the same broad alignment to the western section of East West Rail).
Rail
A The western section of East West Rail (Oxford to Milton Keynes) plus a link to Aylesbury.
B As Scenario A, plus a new station at Calvert and increased service levels.
C Full East West Rail (i.e. as Scenario B plus an upgraded Marston Vale line and new alignment between Bedford and Cambridge).
Source: Steer Davies Gleave
3.25 In addition to testing a range of land-use and transport-supply combinations, a further
scenario designed to provide an indicative estimate of first-mile last-mile investment on the
level and distribution of households and employment within the corridor. In addition to the
journey time and capacity improvements delivered by enhancements to the strategic road and
rail networks, the first-mile last-mile interventions are assumed to reduce journey times for all
trips starting or ending in Cambridge, Milton Keynes, Northampton and Oxford.
3.26 Table 3.5 provides stylised assumptions developed by the study team to represent key
features of the four 2050 First-Mile Last-Mile strategies submitted to the Commission. They
are intended to reflect current and future transport conditions, and the scale of ambition put
forward in the strategies. For example, the majority of interventions put forward in the
Northampton 2050 First-Mile Last-Mile Strategy are highway-based. However, the
preponderance of car use for commuting into Northampton, and the limited public transport
alternatives are likely to mean that any spare capacity is taken up relatively quickly.

Oxford, Milton Keynes, Cambridge Northampton Growth Corridor | Transport Infrastructure Assessment: Final Report
November 2017 | 21
3.27 These assumptions should not be viewed as a representative expectation of what might be
delivered through implementation of the first-mile last-mile strategies. Instead, they provide a
high-level indication of the scale of opportunity available from improving first-mile last-mile
connectivity.
Table 3.5: First-mile last-mile journey time assumptions
Highway Rail/Metro Bus Active modes
Cambridge -10 mins -10 mins -5 mins
Oxfordshire -10 mins -10 mins -5 mins
Milton Keynes -5 mins -5 mins
Northampton -5 mins -5 mins
Source: Steer Davies Gleave
Implementing the scenarios
3.28 The land-use scenarios described above imply increases in household numbers within the
central study area of between 85% and 120% by 2050. Because average household sizes are
expected to fall over this time period, the relative increase in population and workforce is
rather less, at between 70% and 95%.
3.29 By contrast, current projections taken from NTEM imply 11% growth in the workforce over
that time. Consequently, the scenarios tested here imply much more travel than would
happen under the NTEM projections, and would introduce much more stress on the transport
networks.
3.30 Using information from the Department for Transport’s National Road Traffic Forecasts (2015)
it is possible to estimate the increase in highway congestion that would occur under the level
of growth projected by the National Trip End Model14. This implied a worsening in average
drive times of about 7.7% by 2050. This was then scaled up to reflect the higher levels of
household and employment growth which make up the land-use scenarios under
consideration, giving increases of +24%, +30% and +34% for land-use scenarios A, B and C
respectively15.
3.31 The RDM was initialised with sufficient new jobs to provide employment for the growing
workforce in the absence of rising congestion. It was then used to estimate by how much the
additional congestion caused by the higher growth levels represented by each scenario would
suppress the projected future growth of households and employment. In other words, without
new investment in transport, how many jobs and households would be deterred from locating
in the corridor because of rising congestion?
3.32 Finally, additional scenario tests were made to see how many jobs and households were
‘recovered’ by introducing East West Rail and the Oxford to Cambridge Expressway. Table 3.6
presents the seven combinations of land-use and transport-supply assumptions (plus a first-
14 See Road Traffic Forecasts 2015 (Department for Transport).
15 Note that in scaling up the level of highway congestion that would occur under alternative growth scenarios, an assumption of 50% of the level implied by that projected by the National Trip End Model was applied. This is to reflect the range of alternative route and time-of-day choices available to car users, and the non-linear relationship between car usage and congestion.

Oxford, Milton Keynes, Cambridge Northampton Growth Corridor | Transport Infrastructure Assessment: Final Report
November 2017 | 22
mile last-mile scenario overlay) that have been tested to inform the findings reported in the
following section. Various combinations of these tests can be used to isolate the impact of
alternative road, rail and land-use scenarios, some example of which are provided in the table.
Table 3.6: Land-use and transport supply scenarios
Scenario Road Rail Housing Comments
AAA A A A A do-minimum scenario with low population growth and only committed or planned transport infrastructure
AAB A A B This scenario captures the impact of higher population growth on committed and planned transport infrastructure
ABC A B C Comparison of these two scenarios isolates the impact of the Oxford to Cambridge Expressway BBC B B C
ACC A C C Can be compared with ABC to isolate the impact of the central section of East West Rail, or BCC to understand the impact of the Expressway.
BCB B C B Comparison of these two scenarios isolates the impact of more households (with an alternative spatial distribution including new settlements) on the future transport network BCC B C C
BCC+ B C C Includes journey time reductions described in Table 3.5 to reflect first-mile last-mile investment
Source: Steer Davies Gleave
3.33 The following section reports the outputs of these scenario tests and discusses their
implications with reference to the considerations set out in Paragraph 1.12. In all that follows
it should be noted that the findings depend on assumptions made about future growth
patterns and changes in congestion. The results are not to be taken as forecasts, but as
analyses of the consequences of proposed future scenarios.

Oxford, Milton Keynes, Cambridge Northampton Growth Corridor | Transport Infrastructure Assessment: Final Report
November 2017 | 23
The opportunity cost of transport congestion and crowding
Impacts on housing and jobs
4.1 In the absence of either the Oxford to Cambridge Expressway or East West Rail, housing
growth and the number of additional jobs supported is suppressed. Increased journey times
from congestion reduces the effective size of the labour market catchment for recruitment
and businesses potentially relocating to the corridor – growth in the number of jobs supported
is suppressed. People living within the corridor and moving into the corridor are still able to
find work (although under worsening commuting conditions) and additional homes are built to
meet the demand from a growing local workforce. As such, growth in the number of new
homes within the corridor is not suppressed to the same extent as the growth in the number
of jobs supported.
4.2 Within the corridor by 2050, under:
• Scenario A (lowest growth scenario) housing growth is suppressed by about 12,000
homes and the number of jobs supported is suppressed by about 143,000.
• Growth Scenario B (mid growth scenario) housing growth is suppressed by about 17,000
homes and the number of jobs supported is suppressed by about 173,000.
• Growth Scenario C (highest growth scenario) housing growth is suppressed by about
98,000 homes and the number of jobs supported is suppressed by about 290,000.
Table 4.1: Households and jobs suppressed in the absence of transport investment (thousands)
District Scenario A Scenario B Scenario C
Households Jobs Households Jobs Households Jobs
Aylesbury Vale 1.8 14.8 2.5 18.6 75.2 116.5
Bedford 1.7 9.1 2.3 10.6 6.6 9.0
Cambridge -0.8 3.9 -1.0 4.0 -0.3 7.2
Central Bedfordshire 2.3 27.8 3.1 33.2 4.8 42.0
Cherwell 1.6 6.2 2.1 7.1 1.5 10.5
East Cambridgeshire 2.0 -1.2 2.4 -1.5 0.2 0.8
Huntingdonshire 1.2 7.9 1.5 10.3 0.6 16.2
Luton (partial) 0.3 8.6 0.4 12.6 0.3 5.5
Milton Keynes -0.3 6.9 -0.3 5.8 6.1 1.2
Oxford -0.3 8.0 -0.4 9.6 -0.2 13.7
South Cambridgeshire 1.5 20.6 3.1 24.6 0.1 28.3
South Northamptonshire (partial) 0.3 3.7 0.4 4.8 2.3 5.1
South Oxfordshire 0.3 15.4 0.3 18.6 0.4 18.9
Vale of White Horse 0.4 9.0 0.4 11.1 0.4 11.6
West Oxfordshire 0.2 2.5 0.1 3.3 0.3 3.8
Total 12.1 143.3 16.8 172.7 98.3 290.3
4 Findings

Oxford, Milton Keynes, Cambridge Northampton Growth Corridor | Transport Infrastructure Assessment: Final Report
November 2017 | 24
Key findings:
• Without the delivery of the Oxford to Cambridge Expressway and East West Rail, it is
forecast that almost 100,000 new homes and almost 300,000 additional jobs would be
suppressed under the highest growth scenario – the scenario aligned to the National
Infrastructure Commission’s transformational goal of an additional one million homes in
the corridor.
The transport impacts of growth without new east-west infrastructure
From 2015 to 2031
4.3 Figure 4.1 displays the forecast changes in AM peak demand from 2015 to 2031 assigned to
the Strategic Highway Network and major local road network, without the Oxford to
Cambridge Expressway or East West Rail. Most of the network displayed is forecast to
experience increases in travel demand of 20% or more, with most of the existing east-west
network between Oxford and Milton Keynes forecast to experiences in demand in excess of
40%. The greatest increases in travel demand are forecast to be on the:
• A421 in Milton Keynes between the A5 and M1 Junction 13;
• M1 to east of Milton Keynes between Junctions 12 and 13;
• A5 directly south of Milton Keynes;
• A4146 between Leighton Buzzard and Milton Keynes;
• A1081 south of Luton;
• A421 south of Buckingham;
• M40 to the east of Oxford (Junction 8A) and south west of Bicester (Junction 9);
• A41 directly south west of Bicester; and
• sections of the A41 between Aylesbury and Bicester.
4.4 Analysis provides similar findings to work conducted by Oxfordshire County Council and
Buckinghamshire County Council that increased congestion will be experienced on the A34
and A421 respectively. Considering the existing transport issues identified in Section 2, all
those identified will be exacerbated by the growth in travel demand to 2031. Parts of the
network that might experience greatest additional pressure are:
• M1 Junction 8 to the south of Luton and Junction 10 to the east of Milton Keynes;
• the A5 to the south east of Milton Keynes;
• the A421 through Milton Keynes;
• M40 Junction 8A to the east of Oxford and Junction 9 to the south west of Bicester; and
• Oxford, Cambridge and Northampton’s ring roads and main arterials (including the A34 to
the south, west and north of Oxford).
From 2015 to 2041
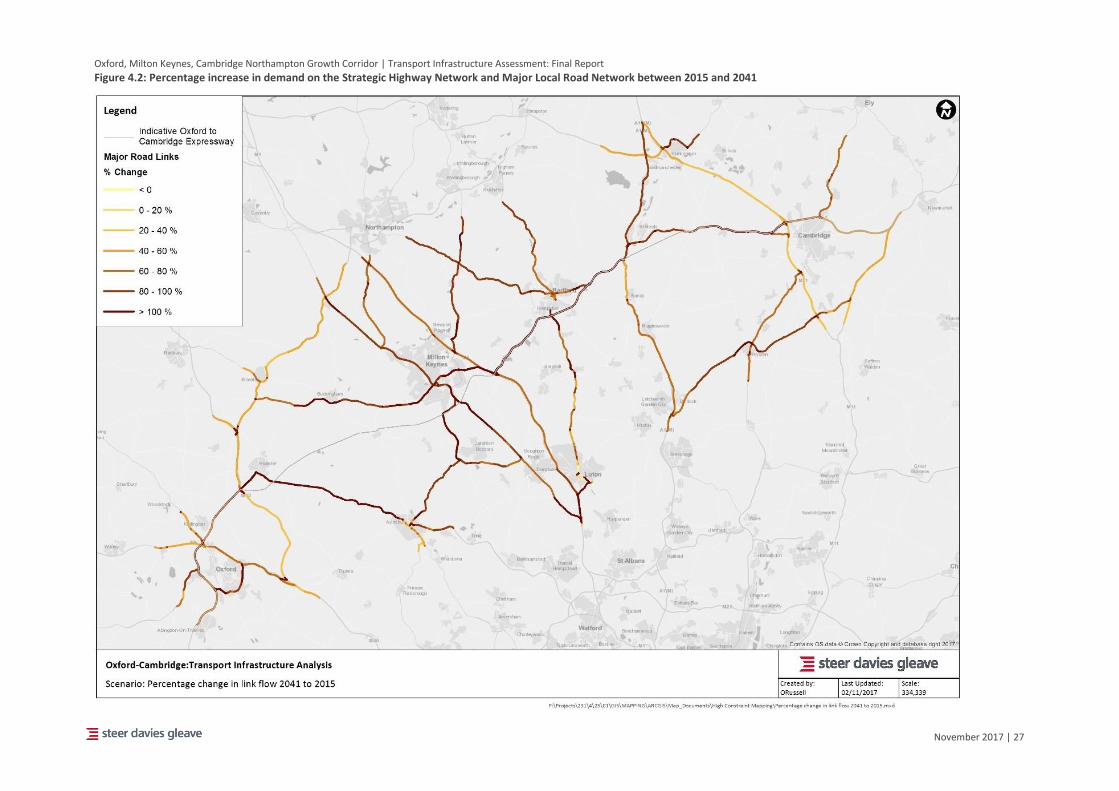
4.5 Figure 4.2 displays the forecast changes in AM peak demand from 2015 to 2041 assigned to
the Strategic Highway Network and major local road network, without the Oxford to
Cambridge Expressway or East West Rail. Almost all east-west highway links are forecast to
experience increases in AM peak demand in excess of 60%; and radial routes from London and
other ‘perpendicular’ routes forecast to experience increases within the corridor of 40% or
more, and in excess of 60% on the A5, M1, A6, and A1(M). All current issues identified would
need addressing if not to constrain growth further.

Oxford, Milton Keynes, Cambridge Northampton Growth Corridor | Transport Infrastructure Assessment: Final Report
November 2017 | 25
From 2015 to 2050
4.6 Figure 4.3 displays the forecast changes in AM peak demand from 2015 to 2050 assigned to
the Strategic Highway Network and major local road network, without the Oxford to
Cambridge Expressway or East West Rail. Almost all links are forecast to experience increases
in AM peak demand in excess of 60%, with the exception of 40% to 60% forecast increase on
the M11 (excluding Junctions 11A and 13); A14 between Cambridge and Huntingdon; and the
A11 to the east of Cambridge.
Key findings:
• Without the delivery of the Oxford to Cambridge Expressway and East West Rail, not only
would the number of additional home and jobs be suppressed but the Strategic Transport
Network and major local transport network would require significant investment in order
to not suppress additional homes and jobs further.

Oxford, Milton Keynes, Cambridge Northampton Growth Corridor | Transport Infrastructure Assessment: Final Report
November 2017 | 26
Figure 4.1: Percentage increase in demand on the Strategic Highway Network and Major Local Road Network between 2015 and 2031
Oxford, Milton Keynes, Cambridge Northampton Growth Corridor | Transport Infrastructure Assessment: Final Report
November 2017 | 27
Figure 4.2: Percentage increase in demand on the Strategic Highway Network and Major Local Road Network between 2015 and 2041

Oxford, Milton Keynes, Cambridge Northampton Growth Corridor | Transport Infrastructure Assessment: Final Report
November 2017 | 28
Figure 4.3: Percentage increase in demand on the Strategic Highway Network and Major Local Road Network between 2015 and 2050

Oxford, Milton Keynes, Cambridge Northampton Growth Corridor | Transport Infrastructure Assessment: Final Report
November 2017 | 29
The contribution of East West Rail and the Oxford to Cambridge Expressway to delivering new homes and settlements
4.7 The Regional Dynamic Model was run to forecast the impact of delivering the Oxford to
Cambridge Expressway and East West Rail on achieving the National Infrastructure
Commission’s objectives for housing and jobs. The forecasts presented are not additionality
relative to today, rather the additionality that the two strategic schemes would deliver under a
high growth scenario – Growth Scenario C (see Section 3 for scenario descriptions).
Impact of the Oxford to Cambridge Expressway
4.8 The main function of the Expressway is to provide faster journey times and increased capacity
along the corridor. This is greatest between Oxford and Milton Keynes, where there is no
existing strategic route. The Expressway supports growth by providing increased access for
residents to employment opportunities, and for employers to a larger skilled labour market
and greater proximity to their customers and suppliers. Under Growth Scenario C, the
incremental impact of the Expressway by itself is forecast to be an additional 28,500 homes
and 54,000 jobs (see Table 4.2 below).
4.9 The extra jobs are served predominantly by car commuting, but without reducing rail travel
volumes; this is because although the overall proportion of commuters choosing rail falls
slightly, the loss is offset by the increased total number of commuters. The Expressway serves
not just people living in the corridor, but increases access of people living elsewhere to the
corridor’s growing pool of jobs, so inward commuting increases.
Table 4.2: The incremental effect of the Expressway (Thousands) (Growth Scenario C)
District Households Jobs
Aylesbury Vale 21.3 23.5
Bedford 1.5 1.4
Cambridge 0.1 -0.1
Central Bedfordshire 2.7 20.8
Cherwell 0.5 2.6
East Cambridgeshire 0.0 -1.9
Huntingdonshire 0.1 0.0
Luton (partial) 0.1 -6.1
Milton Keynes 1.8 0.8
Oxford 0.0 -0.3
South Cambridgeshire 0.4 8.8
South Northamptonshire (partial) 0.4 -0.3
South Oxfordshire 0.1 6.1
Vale of White Horse 0.0 1.3
West Oxfordshire -0.3 -2.5
Total 28.6 54.0
Oxford, Milton Keynes, Cambridge Northampton Growth Corridor | Transport Infrastructure Assessment: Final Report
November 2017 | 30
Impact of East West Rail
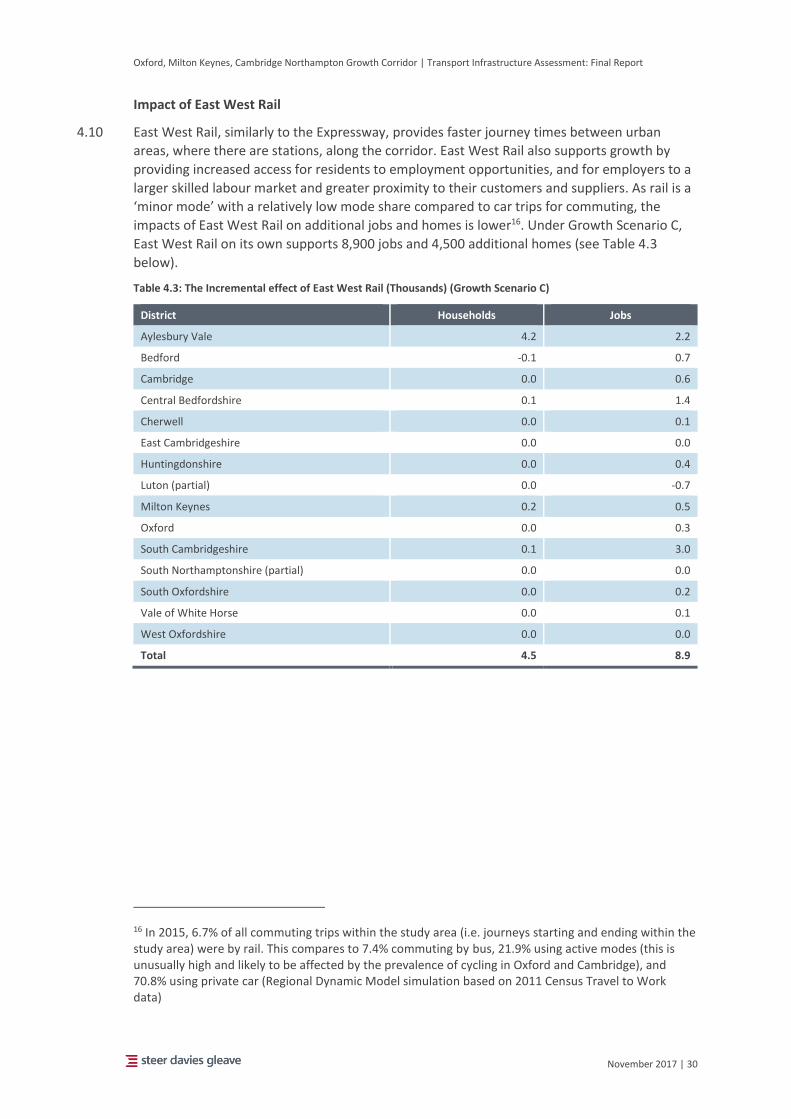
4.10 East West Rail, similarly to the Expressway, provides faster journey times between urban
areas, where there are stations, along the corridor. East West Rail also supports growth by
providing increased access for residents to employment opportunities, and for employers to a
larger skilled labour market and greater proximity to their customers and suppliers. As rail is a
‘minor mode’ with a relatively low mode share compared to car trips for commuting, the
impacts of East West Rail on additional jobs and homes is lower16. Under Growth Scenario C,
East West Rail on its own supports 8,900 jobs and 4,500 additional homes (see Table 4.3
below).
Table 4.3: The Incremental effect of East West Rail (Thousands) (Growth Scenario C)
District Households Jobs
Aylesbury Vale 4.2 2.2
Bedford -0.1 0.7
Cambridge 0.0 0.6
Central Bedfordshire 0.1 1.4
Cherwell 0.0 0.1
East Cambridgeshire 0.0 0.0
Huntingdonshire 0.0 0.4
Luton (partial) 0.0 -0.7
Milton Keynes 0.2 0.5
Oxford 0.0 0.3
South Cambridgeshire 0.1 3.0
South Northamptonshire (partial) 0.0 0.0
South Oxfordshire 0.0 0.2
Vale of White Horse 0.0 0.1
West Oxfordshire 0.0 0.0
Total 4.5 8.9
16 In 2015, 6.7% of all commuting trips within the study area (i.e. journeys starting and ending within the study area) were by rail. This compares to 7.4% commuting by bus, 21.9% using active modes (this is unusually high and likely to be affected by the prevalence of cycling in Oxford and Cambridge), and 70.8% using private car (Regional Dynamic Model simulation based on 2011 Census Travel to Work data)

Oxford, Milton Keynes, Cambridge Northampton Growth Corridor | Transport Infrastructure Assessment: Final Report
November 2017 | 31
Impact of delivering both the Oxford to Cambridge Expressway and East West Rail
4.11 Implementing both schemes together, under Growth Scenario C, increased job numbers by
67,500, and housing units by 33,000. This growth is not, of course, evenly spread. Locations
that gain most are Aylesbury Vale, Central Bedfordshire, South Cambridgeshire, South
Oxfordshire. These gains are offset by reduction elsewhere (or, to be more correct, reduced
growth), such as Luton and West Oxfordshire.
Table 4.4: The incremental effect of EWR and the Expressway (Thousands) (Growth Scenario C)
District Households Jobs
Aylesbury Vale 25.2 28.7
Bedford 1.7 2.7
Cambridge 0.1 0.7
Central Bedfordshire 2.9 22.7
Cherwell 0.6 2.9
East Cambridgeshire 0.0 -1.9
Huntingdonshire 0.2 0.3
Luton (partial) 0.1 -6.5
Milton Keynes 1.7 1.4
Oxford 0.0 -0.1
South Cambridgeshire 0.6 11.3
South Northamptonshire (partial) 0.4 -0.2
South Oxfordshire 0.1 6.4
Vale of White Horse 0.0 1.4
West Oxfordshire -0.3 -2.4
Total 33.1 67.5
4.12 Both schemes together support 4,500 more jobs by 2050 than individually – the two schemes
amplify each other’s effect on jobs. Both schemes also improve access to London for some
people, so there is more commuting from the corridor to London. In fact, there was evidence
of an increase in employment outside the corridor of the order of 30,000 jobs, generated by
the Expressway.
4.13 For information, under Growth Scenario B, the patterns of distribution within the corridor are
similar in the forecasts, but with a reduced scale – 10,000 additional home and 42,500
additional jobs supported.
Key findings:
• The Oxford to Cambridge Expressway contributes the most additionality in terms of jobs
and homes.
• Together, the Oxford to Cambridge Expressway and East West Rail result in higher
forecasts of jobs (4,500 more), than the sum of their impacts individually.
• Also, together, both schemes increase the labour market catchment of London – so
London benefits too with higher forecasts of jobs (30,000 more).

Oxford, Milton Keynes, Cambridge Northampton Growth Corridor | Transport Infrastructure Assessment: Final Report
November 2017 | 32
The impacts of new growth on the wider highway network
Impacts on demand from construction of the Oxford to Cambridge Expressway
4.14 Figure 4.4 displays the incremental changes in AM peak highway demand following the
construction of the Oxford to Cambridge Expressway under Growth Scenario C and assuming
Rail Scenario B has been delivered (see Section 3 and Appendix A for scenario descriptions).
The greatest increases in demand resulting from delivery of the Oxford to Cambridge
Expressway are along the Expressway itself, but also on the M40 and M1 experiencing more
than 20,000 additional AM peak commuter trips in 2050, and A1(M) and M11 experiencing
between 15,000 and 20,000 additional AM peak commuter trips in 2050.
4.15 Whilst the Expressway takes some demand off existing east-west links, the role it plays in
improving journey times expands labour market catchments, which in turn increases demand
from within the expanded catchment. This impacts most of the network, and not just the
Expressway itself.
4.16 Along the A421 through Milton Keynes and to the south of Buckingham, it is forecast that
whilst some links will experience a further increase in AM peak demand as a result of the
construction of the Expressway, some links will have a lower increase in demand as a result of
the Expressway. There are some other local roads that are might also see a reduction in the
quantity of demand as a result of the Expressway, including:
• The A505 between Royston and J10 of the M11;
• Sections of the A6 between Luton and Bedford; and
• The A418 between Aylesbury and Leighton Buzzard.
Further impacts on demand from construction of the Eastern Section of East West Rail
4.17 Figure 4.5 displays the incremental changes in highway demand following the construction of
the Eastern Section of East West Rail (and some increases in frequency) under Growth
Scenario C. The greatest increases in demand resulting from delivery of the Eastern Section
and related frequency enhancements are along the Expressway itself (1,500 or more
additional AM peak trips along much of the Expressway corridor) as more people drive to and
from stations as well as directly to additional jobs that have been supported by delivery of the
rail investment. Additional demand is also forecast along the A1(M); the A14 between
Cambridge and Huntingdon; and on the A41 south of Bicester.
4.18 Almost all links are forecast to experience further increases in demand except for:
• The A40 north of Oxford;
• The A5 north-west of Milton Keynes;
• The A5183 between J9 of the M1 and Dunstable; and
• The A509 and A428 north of Milton Keynes.
Possible pinch-points and congested linkages
4.19 Congestion issues on the M40 between Oxford and Bicester would also need addressing, as
well as on the M1 at around Junctions 8, 10, 12 and 15. In addition, the ring roads around and
arterial routes into and out of Oxford, Northampton and Cambridge would also not have
sufficient capacity to accommodate the demand for travel resulting from increased numbers
of homes and jobs supported by the Expressway.

Oxford, Milton Keynes, Cambridge Northampton Growth Corridor | Transport Infrastructure Assessment: Final Report
November 2017 | 33
4.20 Further analysis is required to understand if the A421 in Milton Keynes is forecast to
experience a further increase in demand as a result of the Expressway.
Key findings:
• The Strategic Highway Network and major local transport network will also experience
increased congestion as a result of construction of the Oxford to Cambridge Expressway
and East West Rail, principally the M40, M1, A1(M) and M11. This is as a result of the
network better functioning as a network to increased labour market catchments.
• Completion of East West Rail also results, typically, in incremental increases in highway
demand as commuters drive to and from rail stations, but also to additional jobs
supported by the rail investment.
• Investment is required to accommodate additional travel demand and improve travelling
conditions for commuters, either on the highway network or through mode shift to more
sustainable alternatives.

Oxford, Milton Keynes, Cambridge Northampton Growth Corridor | Transport Infrastructure Assessment: Final Report
November 2017 | 34
Figure 4.4: Changes in AM peak journeys on the Strategic Highway Network and Major Local Road Network following construction of the Oxford to Cambridge Expressway (2050)

Oxford, Milton Keynes, Cambridge Northampton Growth Corridor | Transport Infrastructure Assessment: Final Report
November 2017 | 35
Figure 4.5: Changes in AM peak journeys on the Strategic Highway Network and Major Local Road Network following construction of Eastern Section of East West Rail (2050)

Oxford, Milton Keynes, Cambridge Northampton Growth Corridor | Transport Infrastructure Assessment: Final Report
November 2017 | 36
The integration of first-mile last-mile transport in urban areas
Description of the 2050 first-mile last-mile strategies
4.21 Construction of the Oxford to Cambridge Expressway and East West Rail increases the labour
market catchment of the corridor. Local evidence indicates that forecast increases in AM peak
travel demand by commuters will place the ring roads and arterial networks of the largest
cities and towns under significant pressure. Local networks may not have the capacity to
accommodate the demand from additional homes and jobs. Investment in local first-mile last-
mile networks is, therefore, required to provide sufficient capacity to accommodate the
forecast increase in additional jobs and homes, as well as improve journey times to increase
labour market and business-to-business catchments and capture agglomeration benefits.
4.22 Figure 4.6 summarises the key components of each of the 2050 first-mile last-mile strategies.
Local authorities and their partners have demonstrated a preference towards improving
capacity and journey times locally through investment in rail / metro, public transport, and
active travel (cycling and walking), rather than solely relying on highway capacity and
connectivity enhancements. In addition, all strategies seek to apply demand management
principles to reduce the number of single-occupancy car vehicle trips, and make best use of
emerging digital and vehicular technologies to encourage more sustainable behaviour change,
reduce congestion, as well as reducing carbon emissions and improving air quality and road
safety.
Estimated impact of delivery of the 2050 First-Mile Last-Mile strategies
4.23 The projected growth of commuting volumes into and within the largest towns and cities is
substantial, and in the absence of any local measures, could lead to greatly increased local
congestion. This in turn could lead to dispersal of growth as conditions becomes intolerable
and people or businesses move out to less congested locations. Therefore, although new
strategic transport connecting the large centres of employment and housing is necessary for
growth, so too are local measures to tackle the rise in travel volumes within those centres.
4.24 High-level assumptions were made on the impact of the 2050 First-Mile Last-Mile strategies on
journey times. Reduced journey times were tested using the RDM. These assumptions were
based on improvements to public transport (Milton Keynes), public transport and active travel
(Oxford and Cambridge), and highways (Northampton).
4.25 It is estimated that the strategies could increase employment in the corridor by around 14,500
jobs. In Oxford and Cambridge, where the defined changes to public transport and active
travel times were the greatest, the gains were 3,500 and 2,500 jobs respectively, while
Northampton, whose strategy focused on car access, gained around 4,000 jobs. It should be
noted that a car-based strategy does relatively well in this test because, assuming current
mode preferences persist, it affects the travel conditions of a larger proportion of the
commuting workforce than does a public transport strategy.
4.26 The benefits of the 2050 First-Mile Last-Mile strategies are not simply to support journey time
savings, which stimulate growth and productivity gains, but also to provide capacity and to do
it in a way that supports wider objectives of maintaining a good quality of life; and in most
instances, reduce carbon emission and improve air quality, road safety, and social inclusion.

Oxford, Milton Keynes, Cambridge Northampton Growth Corridor | Transport Infrastructure Assessment: Final Report
November 2017 | 37
Figure 4.6: Overview of 2050 First-Mile Last-Mile strategies

Oxford, Milton Keynes, Cambridge Northampton Growth Corridor | Transport Infrastructure Assessment: Final Report
November 2017 | 38
Further considerations for 2050 First-Mile Last-Mile strategy planning and investment
4.27 Congestion on the scale modelled here would be widespread and pervasive. Investment
targeted at congestion pinch-points will, of course, help, and will almost invariably deliver
good economic value, but area-wide congestion on this scale cannot be overcome by packages
of single schemes.
4.28 The key will be to think of transport provision in the corridor differently:
• the first step could be a carefully designed mix of high quality, high capacity public
transport on major corridors and within urban areas; and
• the second step could be a programme of behavioural change / demand management.
4.29 The first could provide the high carrying capacity required within the constraints of the
networks, while the second would shift people’s preferences towards use of public transport
and away from the car. All the model tests used here assume that people’s future preferences
will be the same as now. Reduced rail travel times and fares could encourage more people to
use rail, in the model, but their underlying preferences do not change. The result is that rail,
for example, remains a minority choice even where it is viable. If those preferences can be
shifted, moving more people towards public transport, including rail, and the carrying capacity
is provided, this will again counteract the damaging effect of congestion.
4.30 New technology could have an important role in improving connectivity and providing more
network capacity to support higher growth in housing and jobs. Intelligent Mobility can be
used to increase the flows on highways, by managing speeds and routing or delaying traffic to
avoid congestion. The reliability and journey times of public transport can all be improved
using existing and emerging digital technology, while real time information for users helps
reduce or eliminate waiting time and increase seamlessness – increase confidence and
satisfaction of using public transport networks.
4.31 Current evidence suggests that connected and autonomous vehicles are likely to increase
highway capacity only marginally, but, depending how their power is generated for driver and
driverless vehicles, they could reduce emissions and improve air quality significantly.
4.32 Finally, walk and cycle, while not relevant for longer distance movements, have an important
role within the urban areas which could otherwise become overly congested. New technology
and payment systems are increasing cycle availability, while there is growing understanding of
how to design urban environments that encourage, rather than deter, walking and cycling. The
potential for applying these ideas is particularly great in the new settlements.
Key findings:
• Strategic and local transport interventions will better achieve the envisaged growth
potential in this corridor, as well as helping to achieve wider social and environmental
objectives.
• Planning should continue on the 2050 First-Mile Last Mile Strategies to develop
integrated, robust, and deliverable plans which optimise the benefits of strategic
investment.
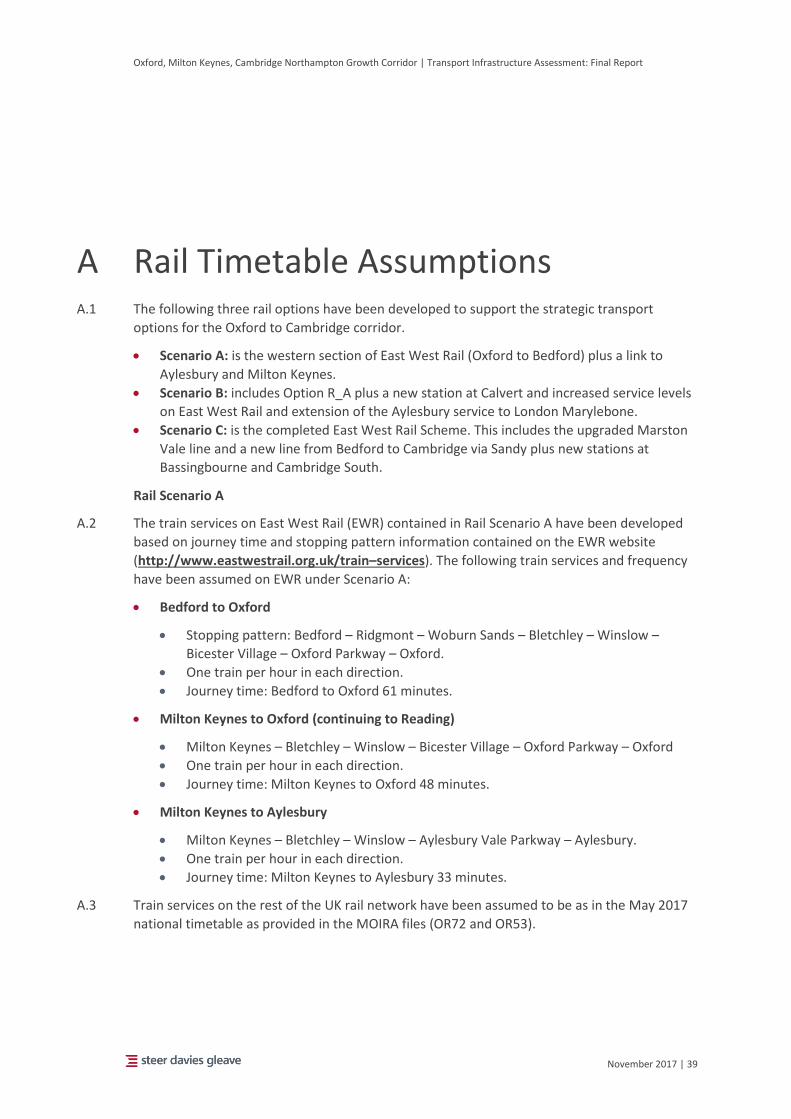
Oxford, Milton Keynes, Cambridge Northampton Growth Corridor | Transport Infrastructure Assessment: Final Report
November 2017 | 39
A.1 The following three rail options have been developed to support the strategic transport
options for the Oxford to Cambridge corridor.
• Scenario A: is the western section of East West Rail (Oxford to Bedford) plus a link to
Aylesbury and Milton Keynes.
• Scenario B: includes Option R_A plus a new station at Calvert and increased service levels
on East West Rail and extension of the Aylesbury service to London Marylebone.
• Scenario C: is the completed East West Rail Scheme. This includes the upgraded Marston
Vale line and a new line from Bedford to Cambridge via Sandy plus new stations at
Bassingbourne and Cambridge South.
Rail Scenario A
A.2 The train services on East West Rail (EWR) contained in Rail Scenario A have been developed
based on journey time and stopping pattern information contained on the EWR website
(http://www.eastwestrail.org.uk/train–services). The following train services and frequency
have been assumed on EWR under Scenario A:
• Bedford to Oxford
• Stopping pattern: Bedford – Ridgmont – Woburn Sands – Bletchley – Winslow –
Bicester Village – Oxford Parkway – Oxford.
• One train per hour in each direction.
• Journey time: Bedford to Oxford 61 minutes.
• Milton Keynes to Oxford (continuing to Reading)
• Milton Keynes – Bletchley – Winslow – Bicester Village – Oxford Parkway – Oxford
• One train per hour in each direction.
• Journey time: Milton Keynes to Oxford 48 minutes.
• Milton Keynes to Aylesbury
• Milton Keynes – Bletchley – Winslow – Aylesbury Vale Parkway – Aylesbury.
• One train per hour in each direction.
• Journey time: Milton Keynes to Aylesbury 33 minutes.
A.3 Train services on the rest of the UK rail network have been assumed to be as in the May 2017
national timetable as provided in the MOIRA files (OR72 and OR53).
A Rail Timetable Assumptions

Oxford, Milton Keynes, Cambridge Northampton Growth Corridor | Transport Infrastructure Assessment: Final Report
November 2017 | 40
Rail Scenario B
A.4 Rail Scenario B builds on Scenario A by adding a new station EWR at Calvert, increasing the
frequency on EWR and extending the Milton Keynes to Aylesbury through to London
Marylebone.
A.5 The following train services and frequency have been assumed on EWR under Scenario BB:
• Bedford to Oxford
• Stopping pattern: Bedford – Ridgmont – Woburn Sands – Bletchley – Winslow –
Calvert–Bicester Village – Oxford Parkway – Oxford.
• Two trains per hour in each direction.
• Journey time: Bedford to Oxford 65 minutes.
• Milton Keynes to Oxford
• Milton Keynes – Bletchley – Winslow – Calvert – Bicester Village – Oxford Parkway –
Oxford.
• Two trains per hour in each direction.
• Journey time: Milton Keynes to Oxford 52 minutes.
• Milton Keynes to Aylesbury (continuing to London Marylebone)
• Milton Keynes – Bletchley – Winslow – Calvert – Aylesbury Vale Parkway – Aylesbury
– Princes Risborough – High Wycombe – London Marylebone.
• One train per hour in each direction.
• Journey time: Milton Keynes to Aylesbury 34 minutes. Milton Keynes to London
Marylebone 104 minutes.
A.6 Train services on the rest of the UK rail network have been assumed to be as in the May 2017
national timetable as provided in the MOIRA files (OR72 and OR53).
Rail Scenario C
A.7 Rail Scenario C considers the potential train service options on EWR after the extension to
Cambridge is complete. The extension of EWR from Bedford to Cambridge has been assumed
pass through Sandy and includes a new station at Bassingbourne. The proposed new station at
Cambridge South (Addenbrookes) on the existing West Anglia Main Line is also included. The
train service for Scenario C includes the train services on EWR in Scenario B with the Oxford–
Bedford service extended through to Cambridge via Sandy and introduction a faster service
between Oxford and Cambridge.
A.8 The following train services and frequency have been assumed on EWR under Scenario C:
• Cambridge to Oxford (semi–fast)
• Stopping pattern: Cambridge–Sandy–Bedford–Bletchley–Calvert–Oxford.
• Three trains per hour in each direction.
• Journey time: Cambridge to Oxford 79 minutes.
• Cambridge to Oxford (stopper)
• Stopping pattern: Cambridge–Cambridge South–Bassingbourne–Sandy– Bedford –
Ridgmont – Woburn Sands – Bletchley – Winslow – Calvert– Bicester Village – Oxford
Parkway – Oxford – Reading.

Oxford, Milton Keynes, Cambridge Northampton Growth Corridor | Transport Infrastructure Assessment: Final Report
November 2017 | 41
• Three trains per hour in each direction.
• Journey time: Cambridge to Oxford 104 minutes.
• Milton Keynes to Oxford
• Milton Keynes – Bletchley – Winslow – Calvert – Bicester Village – Oxford Parkway –
Oxford.
• Three trains per hour in each direction.
• Journey time: Milton Keynes to Oxford 52 minutes.
• Milton Keynes to Aylesbury (continuing to London Marylebone)
• Milton Keynes – Bletchley – Winslow – Calvert – Aylesbury Vale Parkway – Aylesbury
– Princes Risborough – High Wycombe – London Marylebone.
• 1 train per hour in each direction.
• Journey time: Milton Keynes to Aylesbury 34 minutes. Milton Keynes to London
Marylebone 104 minutes.
A.9 Train services on the rest of the UK rail network have been assumed to be as in the May 2017
national timetable as provided in the MOIRA files (OR72 and OR53).
Calculating the Zone to Zone Rail Generalised Journey Time
A.10 The Generalised Journey Times (GJT) between each zone to zone pair for each of the three rail
options were calculated using information taken from MOIRA.
A.11 Each zone to zone pair was allocated a station to station pair. No version of MOIRA exists that
models each station separately in the Oxford to Cambridge corridor. For that reason, two
versions of MOIRA (OR53 and OR72) were combined to include the greatest number of
stations in the area. Where station pairs existed in both versions of MOIRA the one with the
minimum GJT was chosen to be representative GJT for that station pair.
A.12 GJTs between station pairs were calculated using MOIRA based on the imported train services
for each of the rail options. After extracting the GJTs from MOIRA, an access and egress times
is added to each zone to zone pair, to give a total rail GJT between each zone pair.
A.13 GJTs for the new station at Calvert and the existing station at Sandy were manually added into
the GJTs model, as they were not included in the versions of MOIRA provided.

U:\London\Projects\231\4\25\01\Work\08 - Reporting\Final report\171115 NIC Transport Infrastructure Assessment FINAL (clean) -
maps to be updated.docx
Control Information
CONTROL INFORMATION
Prepared by Prepared for
Steer Davies Gleave 28-32 Upper Ground London SE1 9PD +44 20 7910 5000 www.steerdaviesgleave.com
National Infrastructure Commission 5th Floor, 11 Philpot Lane London EC3M 8UD
SDG project/proposal number Client contract/project number
23142501 CCCC17A41
Author/originator Reviewer/approver
Jake Cartmell Steven Bishop, Neil Chadwick
Other contributors Distribution
Simona Dobrescu, John Swanson, Steven Bishop Client: Nick Francis Satish Luhar Alastair Gordon
SDG: As above
Version control/issue number Date
Version 1.0 (final) 15 November 2017

steerdaviesgleave.com