oxford instruments plc empowering science and … science and industry oxford instruments plc report...
TRANSCRIPT
Empowering Science and Industry
Oxford Instruments plcReport and Financial Statements 2017
Oxfo
rd In
strum
ents p
lc Rep
ort an
d Fin
ancial Statem
ents 2017

01: Strategic Report
Highlights 01
Our Business 02
Chairman’s Statement 04
Chief Executive’s Review 06
Business Model 10
Strategic Context 11
Strategy 12
Operations Review 14
KPIs and Principal Risks 22
Viability Statement 26
Finance Review 28
Corporate Responsibility 34
02: Governance
Board of Directors 42
Corporate Governance 44
Audit and Risk Committee Report 51
Nomination Committee Report 58
Remuneration Report 60
Report of the Directors 76
03: Financial Statements
Directors’ Responsibilities 79
Independent Auditor’s Report 80
Accounting Policies 84
Consolidated Statement of Income 90
Consolidated Statement of Comprehensive Income 91
Consolidated Statement of Financial Position 92
Consolidated Statement of Changes in Equity 93
Consolidated Statement of Cash Flows 94
Notes to the Financial Statements 96
Parent Company Statement of Financial Position 124
Statement of Changes in Equity 125
Notes to the Parent Company Financial Statements 126
04: Company Information
Historical Financial Summary 134
Shareholder Information 136
Oxford Instruments Directory 138
Directors and Advisers 140
Oxford Instruments plc is a leading provider of high technology solutions, information and support for industry and research.
We use innovation to turn smart science into world-class products that support research and industry to address the great challenges of the 21st Century.
We are proud to be recognised as the leaders in what we do and for the difference we make in the world.
Inside this year’s Report and Financial Statements
Front cover image: A group of nerve cells captured deep in a brain tissue sample by Andor’s Dragonfly confocal microscopy platform.
in this section
We discuss developments and the global issues that have had an impact on our business
page 01
in this section
Read about how we manage our Company and maintain high standards
page 42
in this section
See how we are performing in light of developments in the past year
page 79
in this section
Find additional information about us
page 134

01: Strategic Report 02: Governance 03: Financial Statements 04: Company Information
Oxford Instruments plc Report and Financial Statements 2017 01
2017
Highlights
It has been a year of structural, operational and strategic transition for the Group.
2016
2017
319.7
348.5
£348.5m9.0%
2017
2016 336.1
350.7
£350.7m4.3%
2017
2016 13.0
13.0
13.0p
2017
2016 45.3
47.836.0
47.8p5.5%
2016 33.6
£36.0m7.1%
Revenue (£m)
Orders (£m)
Continuing adjusted earnings per share1 (p)
Dividend per share (p)
Adjusted profit before tax1 (£m)
Highlights include:
• Reported revenue up 9.0%, down 3.7% at constant currency
• Adjusted profit before tax up 7.1%, in line with our expectations
• Net debt of £109.3 million (2016: £128.2 million), with leverage of 2.1 times reflecting good cash conversion and the sale of Oxford Superconducting Technology (2016: 2.3 times)
• Horizon strategy underway, focused on markets with long‑term growth drivers where the Group can be market leader
• Completed disposal of Oxford Superconducting Technology, and announced sale of Industrial Analysis
• Increased adjusted profit before tax on a continuing basis in NanoTechnology Tools and Industrial Products more than offset a fall in Service
1. Throughout these Financial Statements we make reference to adjusted numbers. These are presented as, in the opinion of the Directors, they present a clearer picture of the business performance. A full definition of adjusted numbers can be found in Note 1. Where we make reference to organic numbers these exclude the effect of acquisitions and disposals. Where we make reference to constant currency numbers these are prepared using the exchange rates which prevailed in the previous year rather than the actual exchange rates which prevailed in the year.

02 Oxford Instruments plc Report and Financial Statements 2017
Our Business
One of the great leading technology companies.Through our deep understanding of our customers’ world and our restless innovation we will change the art of the possible enabling our customers to address the challenges of the 21st Century.
Research and academia: physical sciencesOur target market sector includes research into nanotechnology applications, new materials, Quantum Information Processing and other developments.
Research and academia: bio sciencesA growing sector, this includes research into a range of disease states such as diabetes, cancer, Alzheimer’s and Parkinson’s.
Semiconductors/ITThis includes semiconductor electronics, Micro Electro Mechanical Systems (“MEMS”), compound semiconductor materials, thin film and particle analysis.
Medical servicesA growing sector that includes the support and service of MRI and CT imaging equipment as well as new opportunities driven by the convergence of physical and biological sciences.
EnergyWe have been involved in the search for sustainable energy, solar technologies, oil and gas exploration, and superconductor materials.
Metals/constructionWe are supporting global industries including metals, alloy manufacturing, steel foundries and scrap recycling.
EnvironmentThis includes greener production, recycling, detection of hazardous substances in soil, and agriculture and food.
Our business is structured around three segments that reflect our expertise and business objectives:
High technology tools to characterise, analyse, manipulate
and fabricate at the nanoscale
Technologically superior tools and components for
industrial applications
NanoTechnology Tools
Industrial Products
Service
Supplying knowledgeable support services, training and refurbishment of our
own products
The service, sale and rental of third‑party MRI and CT machines
Find out more on page 14 Find out more on page 19 Find out more on page 21
Our global market comprises seven areas:

01: Strategic Report 02: Governance 03: Financial Statements 04: Company Information
Oxford Instruments plc Report and Financial Statements 2017 03
We have offices in 18 countries and employ 1,974 people worldwide.
JAPAN £36.5M
REST OF ASIA £44.2M
REST OF EUROPE £42.7M
USA £1
06.1M
ROW £11.0M
CHINA £
65.0
M
UK £16.6M GERMANY £26.4MREVENUE FROM EXTERNAL CUSTOMERS BY DESTINATION
Principal offices
As one of the world’s first University spin‑out companies, we have been at the forefront of technological innovation for more than 55 years. For a full list of our locations please visit our website:
www.oxford-instruments.com/offices

04 Oxford Instruments plc Report and Financial Statements 2017
This is my first review as Chairman of Oxford Instruments plc, a position I am delighted to have taken on at our AGM in September.
It has been a year of structural, operational and strategic transition for the Group. We have a new and energised senior executive team led by Ian Barkshire and Gavin Hill. They have acted with impressive decisiveness in embedding a number of changes in our operating teams to raise the talent bar across our business.
We have also made good progress in developing and implementing the new Horizon strategy to reposition our Group for long‑term sustainable growth. This has seen some significant actions to manage our portfolio of businesses with the aim of accelerating our delivery of shareholder value. In November, we announced the disposal of our underperforming wire business, Oxford Superconducting Technology, and since the year end, we have announced the agreed sale of our Industrial Analysis business to Hitachi High‑Technologies.
Chairman’s Statement
As Ian Barkshire sets out in his Chief Executive’s Review, the management team is now implementing the next phase of the Horizon strategy to continue the transformation of Oxford Instruments. This is focused around the two anchors of returning to sustainable growth and improving margins by concentrating on market segments with long‑term growth drivers where we have the potential to become the market leader.
The business delivered a stable performance in line with our expectations against an extremely challenging market backdrop.
We have made good progress in developing and implementing the new Horizon strategy.
Our governance principles
LeadershipThe Chairman is responsible for leadership of the Board and ensuring its effectiveness on all aspects of its role.
EffectivenessThis year, the Board carried out its annual effectiveness evaluation exercise, including a specific review of the effectiveness of its principal committees and members.
Risk managementThe Board has accountability for reviewing and approving the adequacy and effectiveness of internal controls including financial, operational and compliance controls and risk management.
RemunerationThe remuneration policy promotes the delivery of the Group’s strategy and seeks to align the interests of Directors and Shareholders.
EngagementWe continue to ensure our investors receive regular and transparent communications.
Find out more on page 45
Find out more on page 49
Find out more on page 47
Find out more on pages 60 to 75
Find out more on page 35

01: Strategic Report 02: Governance 03: Financial Statements 04: Company Information
Oxford Instruments plc Report and Financial Statements 2017 05
Against this background of strategic activity, the team maintained the focus on short‑term performance. The business delivered a stable performance in line with our expectations against an extremely challenging market backdrop of slower academic funding in the US and Europe and the anticipated deterioration in the financial performance of our OI Healthcare business. Our NanoTechnology Tools sector performed strongly and we saw good returns from the servicing of our own products. These growth businesses provide the platform for our future growth.
Adjusted basic earnings per share on a continuing basis grew by 5.5%. However, taking into account the impact on the Group of business disposals, currency effects and our progressive strengthening of the balance sheet, the Board has proposed to hold the dividend at last year’s level. This results in a final dividend of 9.3 pence (2016: 9.3 pence) bringing the total dividend for the year to 13.0 pence (2016: 13.0 pence).
I am pleased that Stephen Blair will join the Board on 1 July 2017 as Senior Independent Director. He brings with him a wide range of international experience and sound technical understanding that was gained during his time at a number of top technical companies, such as e2v and Spectris.
Finally, I would like to thank the Board for their ongoing support during this time of change and for their commitment to repositioning Oxford Instruments to deliver long‑term profitable growth, providing sustainable value for our Shareholders.
Alan ThomsonChairman
13 June 2017
Our NanoTechnology Tools sector performed strongly and we saw good returns from the servicing of our own products.
NanoScience’s Triton refrigeration system. Andor’s Dragonfly 3D microscopy platform, which was launched earlier in the year.

06 Oxford Instruments plc Report and Financial Statements 2017
Chief Executive’s Review
I am encouraged by the performance of the Group during my first year as Chief Executive, having made good progress in strengthening the business and positioning it for the future. The year has been one of transition with a new strategy, associated portfolio changes and the formation of a new leadership team.
The most notable strategic development has been the launch of the Horizon strategy, our transformational programme for the Group, which will drive both our future direction and our operational model. Horizon will build on our strengths, brand and innovation heritage and has the following key elements:
• We will focus our investment on market segments where nanotechnology drives long‑term growth for our customers and where we can maintain or develop leadership positions.
• We will migrate to being a more commercially focused, market‑driven Group by maintaining our heritage in supporting fundamental research whilst increasing our focus on products for applied R&D and the commercialisation of nanotechnology.
• We will drive the delivery of synergies and enhanced collaboration. For example, in R&D we will prioritise our high‑impact projects and resource them from across the Group.
• We will evolve our existing “tools and service” model and move up the value chain by providing our customers with enhanced solutions, information and support that will drive advances in innovation and productivity.
• We will transform our operational model to embed consistency and excellence across our businesses, measured by clearly defined core capabilities that will enhance our competitive advantage.
Over the past ten years, Oxford Instruments has focused on being a leading provider of high technology tools and service to research communities all over the world. Nanotechnology is now well established as a fundamental and integral driver for delivering advances across the sciences and commercial end markets. We will build on our leadership and expertise in the fabrication, manipulation and analysis of materials down to the molecular and atomic scale. We will support the changing needs of our customers by evolving to become a leading provider of high technology solutions, information and support. We will be known for unprecedented performance, ease of use and service that will add value to our customers’ capabilities and productivity.
The year has been one of transition with a new strategy, associated portfolio changes and the formation of a new leadership team.
Summary• Horizon strategy underway,
repositioning the Group for long‑term growth
• Continued strength and improved profitability across NanoTechnology Tools sector
• Steady performance in Industrial Products
• Increased demand for services related to our own products

01: Strategic Report 02: Governance 03: Financial Statements 04: Company Information
Oxford Instruments plc Report and Financial Statements 2017 07
New operational modelWithin Horizon, we will actively manage our portfolio of businesses and products, selecting those markets with long‑term growth drivers where we can maintain or grow leading positions. We will focus on those markets where nanotechnology has the potential to address some of the world’s most complex and pressing challenges and where we can deliver enhanced solutions and service excellence.
Global drivers for our core markets are:
Healthcare where growth is driven by demand for improvements in disease detection and the understanding of fundamental mechanisms;
• Our advanced imaging and analysis solutions, such as our Dragonfly optical system and our newly launched video rate Atomic Force Microscope are examples of where we are providing enhanced capabilities and productivity for investigators working in this area.
Energy where improved efficiencies and sustainability remain core drivers, and includes work in photovoltaics and batteries.
• Our deposition and etch processes, and our characterisation solutions are essential for our customers in the development of their current and next generation devices. Plasma Technology, Asylum Research and NanoAnalysis are particularly well aligned to support these markets with new processing and characterisation capabilities.
IT and Communications where there is a focus on speed, security and capacity.
• Again, it is our ability to provide the fabrication capabilities for new materials and device structures, and the subsequent characterisation of their performance that helps our customers, for example in photonics, semiconductors and data storage devices. Our solutions are being utilised by fundamental science right through to the practical application of new materials within this area, and will support growth across our NanoTechnology Tools portfolio.
We have made notable progress in establishing a more synergistic portfolio.
Innovationand Product
Development
CustomerSupport
MarketIntimacy
OperationalExcellence
Customer
Advanced Materials where we can help customers lead the race to develop lighter, stronger, higher functioning and more affordable materials.
• This remains a core market for our businesses and we continue to build strong relationships with the leaders in this field, ranging from Nobel Prize winners through to Quality Assurance for leading manufacturers.
Quantum Technology is the exploitation of the regime where quantum effects dominate and radically change the ‘rule book’ of what is possible. For example, the quantum interaction between remote particles has the potential for new paradigms in secure communications, computing and sensors.
• Our cryogenics, advanced fabrication, imaging and characterisation capabilities are all critical to the advancement of this field.
Within our core markets, we have identified a number of niche segments that are particularly attractive to us, such as biodynamics, quantum computing and advanced batteries, where we will focus to gain competitive advantage.
As part of Horizon we have undertaken a strategic review of the growth opportunities, competitive landscapes and leadership capabilities across the Group to inform our portfolio management. We have made notable progress in establishing a more synergistic portfolio. In November, we announced the disposal of our Superconducting Wire business and since the year end we have announced the agreed sale of our Industrial Analysis business to Hitachi High‑Technologies.
Horizon will change the way by which we operate and will embed clearly defined core capabilities across our businesses in the following areas:
Market Intimacy: We will further develop in‑depth understanding of our customer segments and align our innovation and product development initiatives to customers’ strategic roadmaps.
Innovation and Product Development: We will focus our R&D investment on higher growth segments, prioritising our efforts on the most valuable product development opportunities.
Customer Support: We will build on the growing customer demand and offer a higher level and broader range of services and support.
Operational Excellence: We will drive improvements in cost, time and defects to become a more delivery and outcome focused business.
Horizon will drive a culture of continuous improvement and best practice across all of our businesses, which will deliver clear competitive advantage and long‑term shareholder value. I am excited by the potential of the Horizon strategy which builds on our heritage and is the next stage in the evolution and commercialisation of Oxford Instruments.
Find out more on page 13

08 Oxford Instruments plc Report and Financial Statements 2017
Chief Executive’s Review continued
ResultsLooking back over the previous financial year, the Group delivered a stable performance, supported by stronger second‑half trading in line with our expectations and currency tailwinds. This was despite an uncertain macroeconomic background, which has seen a sustained period of slow global academic and R&D funding and continued softness across industrial end markets.
Progress in the year has been underpinned by the continued strength and improved profitability across our NanoTechnology Tools Sector. Industrial Products delivered a steady performance against continued challenging end markets supported by new product launches. In our Service sector, the increased demand for services related to our own products was more than offset by the previously flagged weaker performance from our OI Healthcare business in the US.
Orders in the period increased by 4.3% to £350.7 million (2016: £336.1 million), orders at constant currency were down 7.3%, predominantly due to lower orders in OI Healthcare and Industrial Analysis. Orders in NanoTechnology Tools increased by 7.9% but were marginally down on the previous year at constant currency. The order book for future deliveries at the end of the year increased by 9.3% to £144.5 million (2016: £132.2 million), representing a constant currency increase of 0.5% at a Group level and 0.5% and 5.0% for NanoTechnology Tools and Service respectively.
Reported revenue in the period was up 9.0% to £348.5 million (2016: £319.7 million), down 3.7% at constant currency, reflecting the weaker performance across our Industrial Products and OI Healthcare businesses. On a geographical basis, demand for our products reflected global trends in funding and capital expenditure, resulting in an exceptionally strong performance in Asia, growth in Europe and a relatively flat performance in the USA. Reported revenue grew in Europe, North America and Asia by 4.2%, 0.7% and 22.3% respectively. Revenue on a constant currency basis grew 7.2% in Asia supported by continued strong growth in China. Constant currency revenue declined in Europe by 5.9% with growth in France and Germany being more than offset by reduced volumes from the Rest of Europe, principally from lower shipments from Plasma Technology, and it declined in North America by 12.0%, predominantly due to reduced volumes in OI Healthcare and Asylum Research.
Adjusted profit before tax from continuing operations increased by 7.1% to £36.0 million (2016: £33.6 million) with improvements across NanoTechnology Tools and Industrial Products more than offsetting a fall in Service. Adjusted operating profit margin fell to 12.2% (2016: 12.9%) reflecting the reduced profit from OI Healthcare and the uplift to revenue due to the movement in currency exchange rates.
We recorded a loss before tax of £25.5 million after the impairment of non‑current assets and other adjusting items of £45.8 million, primarily reflecting deterioration in the financial performance from Asylum Research, OI Healthcare and our joint venture, ScientaOmicron. While we have plans that address the weaknesses and issues within all three businesses, the impairment reflects the actions and time required to improve profitability.
Continuing adjusted basic EPS grew by 5.5% to 47.8 pence (2016: 45.3 pence). Basic EPS was a negative 44.0 pence (2016: 12.2 pence) after reflecting the impairments of non‑current assets and other adjusting items.
Net debt at the end of the period fell to £109.3 million (2016: £128.2 million), largely due to good cash conversion and proceeds received from the sale of Superconducting Wire business in November 2016.
Turning to the individual sectors: NanoTechnology Tools saw reported revenue growth of 11.4% to £208.7 million (2016: £187.4 million), adjusted operating profit grew 20.2% to £25.6 million (2016: £21.3 million), with an increase in adjusted operating margin by 90 basis points to 12.3%. The improved performance is due to the success of recently launched higher margin products across the portfolio combined with a focus on operational efficiencies. We continued to see enhanced performance from Andor Technology and NanoAnalysis; while Plasma Technology and NanoScience both continued to make progress in the year and contributed strongly to the improved performance. Asylum Research underperformed against the previous year having been disproportionally impacted by reduced academic funding levels and a delay in launching new products. As a result of prioritising investments and delivering operational efficiencies we expect to see an improvement in the profitability of the Asylum business, albeit still below original projections at the time of acquisition.
Progress in the year has been underpinned by the continued strength and improved profitability across our NanoTechnology Tools Sector.
01: Strategic Report 02: Governance 03: Financial Statements 04: Company Information
Oxford Instruments plc Report and Financial Statements 2017 09
In Industrial Products, reported revenue increased by 5.0% to £56.7 million (2016: £54.0 million), excluding discontinued contributions from the Superconducting Wire business, which was divested in November. Reported adjusted operating profit increased to £1.7 million (2016: £1.1 million) with an associated increase of 100 basis points in adjusted operating margin to 3.0%. This represents a stable performance in the face of continued challenging end‑market conditions.
In Service, reported revenue increased by 6.1% to £83.2 million (2016: £78.4 million). This was driven by the increased demand for services relating to our own products. As previously flagged, the OI Healthcare business in the US, which offers refurbished imaging systems, mobile imaging solutions and maintenance services, had a slower year due to a change in the software licensing policy on second hand systems by one of the main system manufacturers. This significantly reduced the number of refurbished systems sold in the year and, despite improved profit and operational margin from the servicing of our own products, resulted in a fall in reported adjusted operating profit to £15.2 million (2016: £18.8 million). We have taken the necessary actions to align the business to the new software licensing model for refurbished imaging systems and the OI Healthcare business is now positioned to deliver an improved performance going forward.
From a customer perspective, our end‑market distribution has remained relatively unchanged compared to the previous year. Over half of the Group’s revenue came from academic and commercial research customers, of which a quarter was engaged in Bio and Life Sciences.
The Group continues to invest in future products and services and in the year we increased investment in R&D by 7.1% to £30.3 million (2016: £28.3 million). We monitor the proportion of our revenue which originates from products launched in the last three years (our Vitality Index). Our Vitality Index stands at 31%, and is in the range we expect from a high technology business. This reflects the continued strength of our existing leading products and the successful uptake of more recently launched products. Some of the new products launched in the year are outlined in the Operational Review. We continue to have a healthy pipeline of new products in development that push the boundaries of scientific understanding and technical performance and increase our market reach.
PeopleOur staff are central to the successful delivery of our Horizon strategy. We will focus on resourcing our core capabilities through the development of our existing workforce and targeted recruitment.
To further support the delivery of Horizon, I have reshaped our Management Board. The Management Board develops and embeds our business processes across the Group and the new structure will drive the exploitation of synergies and efficiencies across our businesses.
The progress we have made so far in our transformation is largely due to the talented workforce we have at Oxford Instruments. I would like to thank all our employees for their positive response to the new strategy and the resulting changes, their continued enthusiasm and their dedication to our customers.
OutlookIn a year of transition, the Group delivered a stable performance, supported by currency tailwinds. Whilst academic and R&D funding levels remain uncertain, we believe that progress with our strategic initiatives and favourable currency effects will deliver an outcome for the year in line with expectations.
Our focus is on markets with long‑term growth drivers where nanotechnology has the potential to address some of the world’s most complex and pressing challenges. Fundamental improvements to our structure, operations and strategy are underway and give us a solid platform to return to sustainable growth, at improved margins over the medium term.
Ian BarkshireChief Executive
13 June 2017
10 Oxford Instruments plc Report and Financial Statements 2017
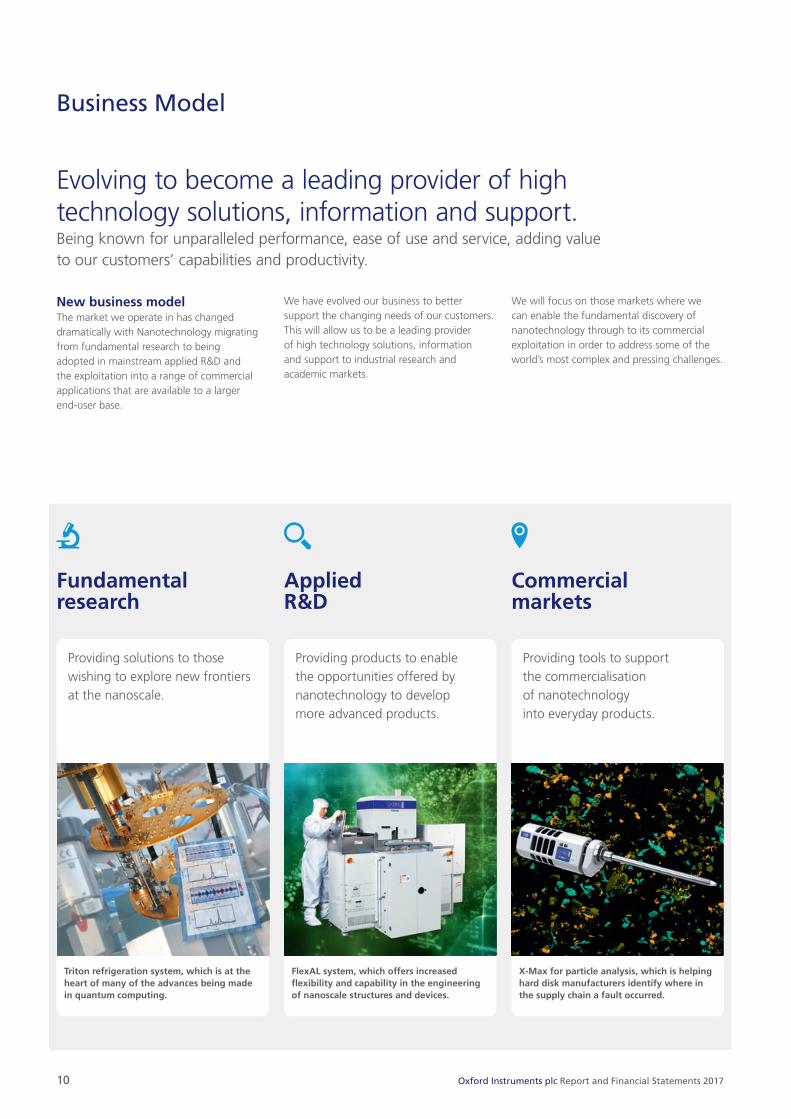
Providing solutions to those wishing to explore new frontiers at the nanoscale.
Providing products to enable the opportunities offered by nanotechnology to develop more advanced products.
Providing tools to support the commercialisation of nanotechnology into everyday products.
New business modelThe market we operate in has changed dramatically with Nanotechnology migrating from fundamental research to being adopted in mainstream applied R&D and the exploitation into a range of commercial applications that are available to a larger end‑user base.
We have evolved our business to better support the changing needs of our customers. This will allow us to be a leading provider of high technology solutions, information and support to industrial research and academic markets.
We will focus on those markets where we can enable the fundamental discovery of nanotechnology through to its commercial exploitation in order to address some of the world’s most complex and pressing challenges.
Triton refrigeration system, which is at the heart of many of the advances being made in quantum computing.
FlexAL system, which offers increased flexibility and capability in the engineering of nanoscale structures and devices.
X-Max for particle analysis, which is helping hard disk manufacturers identify where in the supply chain a fault occurred.
Business Model
Fundamental research
Applied R&D
Commercial markets
Evolving to become a leading provider of high technology solutions, information and support.Being known for unparalleled performance, ease of use and service, adding value to our customers’ capabilities and productivity.

01: Strategic Report 02: Governance 03: Financial Statements 04: Company Information
Oxford Instruments plc Report and Financial Statements 2017 11
Strategic Context
New paradigm for systems and devices
Increased application focusExploiting advanced materials
and capabilities
Accelerated scientific discovery and innovation
2005 2010 2020 2040
Increasing capabilities and ease of use
Co
mm
erci
al e
xplo
itat
ion
Convergence of sciencesBiology
ChemistryPhysics
Engineering
Over the past ten years, Oxford Instruments has been successfully driving the adoption of nanotechnology by industrial and research communities all over the world.
We previously used growth in the convergence of sciences to build our market position. Convergence is now well established, and our customers are now focused on the application of convergence and nanotechnology to help address many of the world’s greatest challenges.
Within academic research, funding is increasingly being targeted towards nanotechnology applications that are building on the initial foundations of convergence. Our industrial research and corporate customers are increasingly focused on exploiting nano‑enhanced properties in their commercial applications and the development of new advanced systems and devices.
To support our customers’ new requirements, we will build our leadership in exploiting our expertise, skill and intellectual property in fabrication, manipulation and characterisation of materials, structures and devices down to the molecular and atomic scale. We will focus our investment on those market segments where nanotechnology drives long‑term growth for our customers and where we can maintain or grow into leadership positions.
We will move up the value chain providing our customers with solutions, information and support to increase their capabilities and productivity in line with their evolving requirements.
We have called our new strategic focus Horizon. It is a transformational programme for the Group and will drive both our future direction and our operational model, returning us to long‑term sustainable growth with improved margins.
12 Oxford Instruments plc Report and Financial Statements 2017
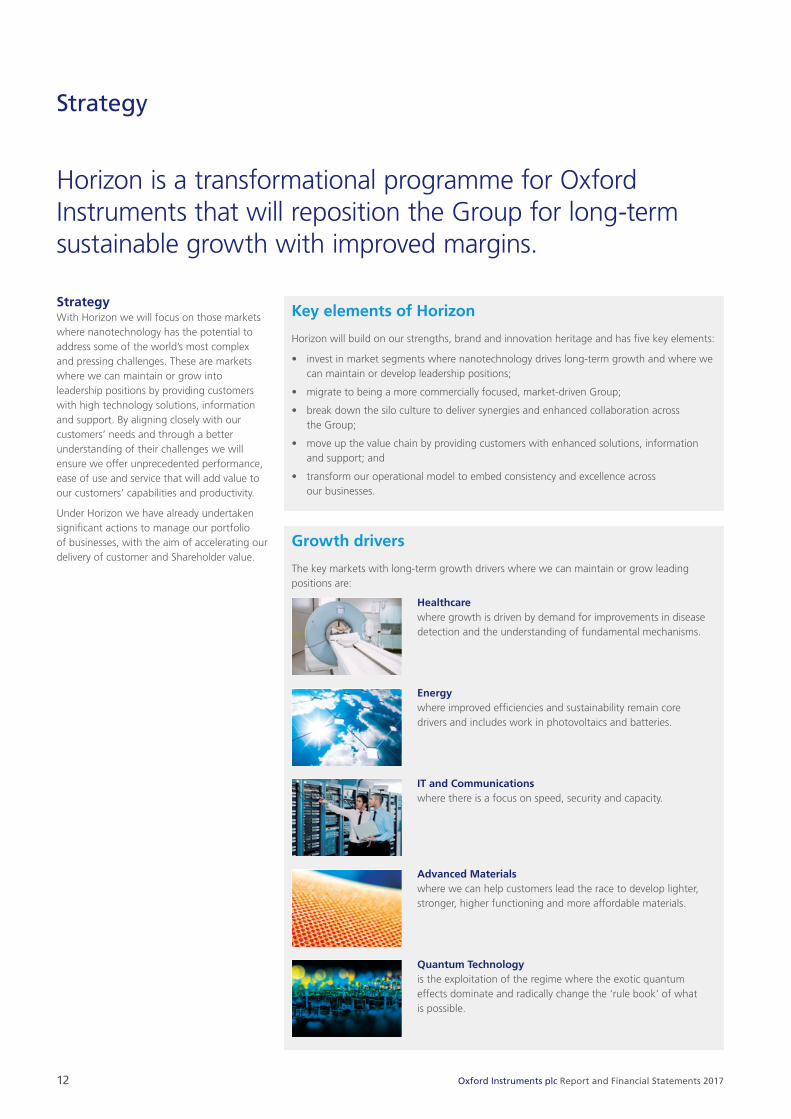
StrategyWith Horizon we will focus on those markets where nanotechnology has the potential to address some of the world’s most complex and pressing challenges. These are markets where we can maintain or grow into leadership positions by providing customers with high technology solutions, information and support. By aligning closely with our customers’ needs and through a better understanding of their challenges we will ensure we offer unprecedented performance, ease of use and service that will add value to our customers’ capabilities and productivity.
Under Horizon we have already undertaken significant actions to manage our portfolio of businesses, with the aim of accelerating our delivery of customer and Shareholder value.
Strategy
Horizon is a transformational programme for Oxford Instruments that will reposition the Group for long‑term sustainable growth with improved margins.
Growth drivers
The key markets with long‑term growth drivers where we can maintain or grow leading positions are:
Key elements of Horizon
Horizon will build on our strengths, brand and innovation heritage and has five key elements:
• invest in market segments where nanotechnology drives long‑term growth and where we can maintain or develop leadership positions;
• migrate to being a more commercially focused, market‑driven Group;
• break down the silo culture to deliver synergies and enhanced collaboration across the Group;
• move up the value chain by providing customers with enhanced solutions, information and support; and
• transform our operational model to embed consistency and excellence across our businesses.
Healthcare where growth is driven by demand for improvements in disease detection and the understanding of fundamental mechanisms.
Energy where improved efficiencies and sustainability remain core drivers and includes work in photovoltaics and batteries.
Quantum Technology is the exploitation of the regime where the exotic quantum effects dominate and radically change the ‘rule book’ of what is possible.
Advanced Materials where we can help customers lead the race to develop lighter, stronger, higher functioning and more affordable materials.
IT and Communications where there is a focus on speed, security and capacity.

01: Strategic Report 02: Governance 03: Financial Statements 04: Company Information
Oxford Instruments plc Report and Financial Statements 2017 13
New operational model
Market Intimacy: We will develop an in‑depth understanding of our customer segments and tailor our solutions to more closely meet customer needs. Insights from our stronger customer relationships will better inform and align our innovation and product development initiatives to customers’ strategic roadmaps.
Innovation and Product Development: We will focus our R&D investment on higher growth segments, prioritising our efforts on the most valuable product development opportunities. Importantly, our new operating model will enhance our ability to leverage the technical capabilities and synergies across the Group to ensure the more effective delivery of our chosen priority projects.
Customer Support: We will build on the growing customer demand for a higher level and broader range of services and support to help meet their evolving commercial and strategic needs. Service will become a core differentiator in our markets.
Operational Excellence: We will target improvements in cost, time and defects to deliver a world class experience for Oxford Instruments’ customers. Operational Excellence will drive us to become a more delivery and outcome focused business.
Innovation and Product Development
CustomerSupport
Market Intimacy
Operational Excellence
Customer
Horizon will change the way by which we operate and will embed clearly defined core capabilities across our businesses in the following areas:

Operations Review
NanoTechnology Tools
An Andor Technology technician working under contamination-controlled conditions in a cleanroom.
01: Strategic Report 02: Governance 03: Financial Statements 04: Company Information
Oxford Instruments plc Report and Financial Statements 2017 15
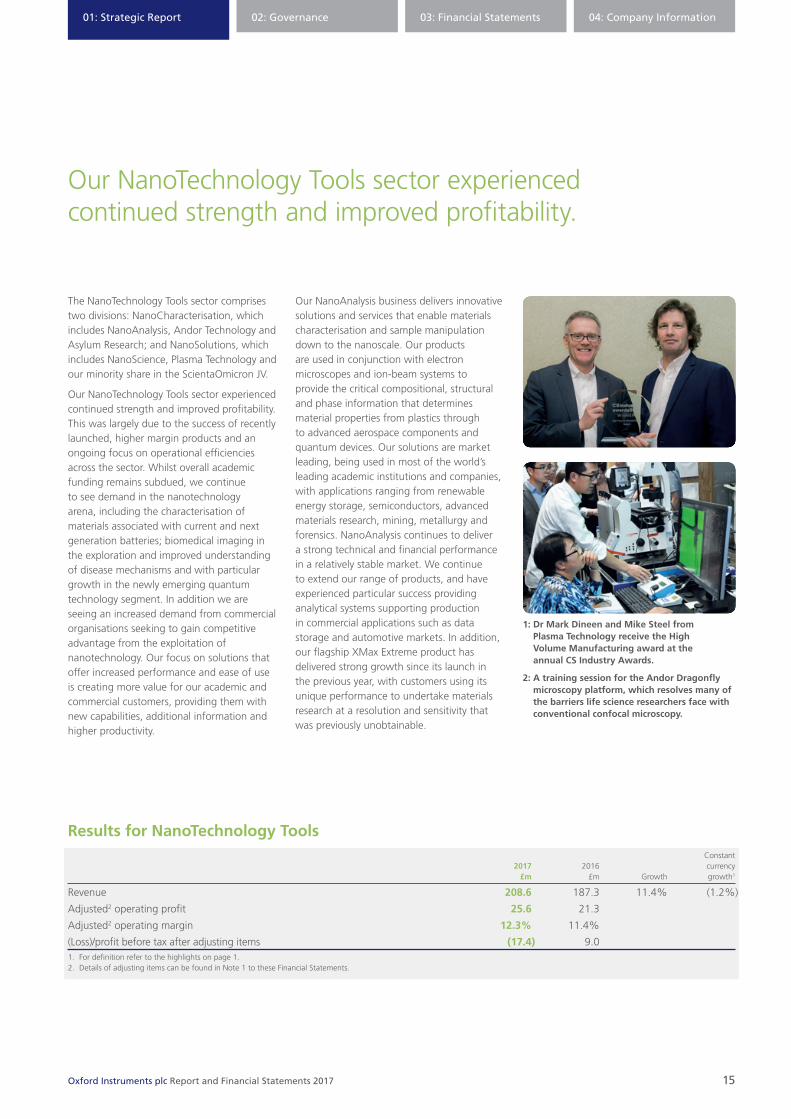
Our NanoTechnology Tools sector experienced continued strength and improved profitability.
The NanoTechnology Tools sector comprises two divisions: NanoCharacterisation, which includes NanoAnalysis, Andor Technology and Asylum Research; and NanoSolutions, which includes NanoScience, Plasma Technology and our minority share in the ScientaOmicron JV.
Our NanoTechnology Tools sector experienced continued strength and improved profitability. This was largely due to the success of recently launched, higher margin products and an ongoing focus on operational efficiencies across the sector. Whilst overall academic funding remains subdued, we continue to see demand in the nanotechnology arena, including the characterisation of materials associated with current and next generation batteries; biomedical imaging in the exploration and improved understanding of disease mechanisms and with particular growth in the newly emerging quantum technology segment. In addition we are seeing an increased demand from commercial organisations seeking to gain competitive advantage from the exploitation of nanotechnology. Our focus on solutions that offer increased performance and ease of use is creating more value for our academic and commercial customers, providing them with new capabilities, additional information and higher productivity.
Our NanoAnalysis business delivers innovative solutions and services that enable materials characterisation and sample manipulation down to the nanoscale. Our products are used in conjunction with electron microscopes and ion‑beam systems to provide the critical compositional, structural and phase information that determines material properties from plastics through to advanced aerospace components and quantum devices. Our solutions are market leading, being used in most of the world’s leading academic institutions and companies, with applications ranging from renewable energy storage, semiconductors, advanced materials research, mining, metallurgy and forensics. NanoAnalysis continues to deliver a strong technical and financial performance in a relatively stable market. We continue to extend our range of products, and have experienced particular success providing analytical systems supporting production in commercial applications such as data storage and automotive markets. In addition, our flagship XMax Extreme product has delivered strong growth since its launch in the previous year, with customers using its unique performance to undertake materials research at a resolution and sensitivity that was previously unobtainable.
1: Dr Mark Dineen and Mike Steel from Plasma Technology receive the High Volume Manufacturing award at the annual CS Industry Awards.
2: A training session for the Andor Dragonfly microscopy platform, which resolves many of the barriers life science researchers face with conventional confocal microscopy.
Results for NanoTechnology Tools Constant 2017 2016 currency £m £m Growth growth1
Revenue 208.6 187.3 11.4% (1.2%)
Adjusted2 operating profit 25.6 21.3
Adjusted2 operating margin 12.3% 11.4%
(Loss)/profit before tax after adjusting items (17.4) 9.0 1. For definition refer to the highlights on page 1.2. Details of adjusting items can be found in Note 1 to these Financial Statements.

16 Oxford Instruments plc Report and Financial Statements 2017
Operations Review continued
In particular, Extreme offered researchers new capabilities to characterise current and next generation batteries and semiconductor structures at the nanoscale. Whilst the metals markets remained subdued during the year, we saw increasing interest and positive developments in the Advanced Materials and Biomedical markets driven by investment in new manufacturing technologies, such as additive manufacturing and a continued investment in biomedical research.
Andor Technology is a global leader in the design and manufacture of high performance scientific imaging cameras, spectroscopy solutions and microscopy systems for research and industrial markets. During the year, Andor continued to build sales and service presence and expand the portfolio of imaging and microscopy solutions. We significantly enhanced our offering into combustion and plasma research markets with the launch of an intensified camera solution with market leading speed and sensitivity. Several of our core technologies have been adopted by quantum imaging researchers who are studying quantum applications including quantum communication and quantum computing. At the core of our microscopy business strategy was the launch this year of our Dragonfly confocal microscope platform and its associated experiment sequencing software, Fusion. Combined, these investments have received exceptional customer feedback as they enable 3D imaging through thicker samples and larger areas at unprecedented resolution and speed. A solid order book, dedicated sales team and customer interest support our high expectations of this segment in the next financial year and beyond. The year also delivered exceptional performance from our associated analysis software platform Imaris,
where we continue to embrace our customers’ need to manage and process large complex data sets, often derived from our Dragonfly systems. Imaris will deliver smooth handling of extremely large data sets, which are a core requirement for the growing brain imaging market sector.
Asylum Research is the technology leader in atomic force microscopy (“AFM”) for both materials and bioscience applications. While Asylum continues to take a leadership position when it comes to advanced technology, this was a difficult year for us and other AFM providers. The market has been disproportionately impacted by reduced academic funding levels in the US and Europe and for us this has offset a stronger performance in Asia. Increased interest in battery energy storage, photovoltaics, industrial polymers and two dimensional materials such as graphene contributed to a stronger second half to the year. Our electrochemistry solution, which is based on our Cypher AFM platform, enables the measurement and observation in real time of reactions for critical processes in their normal environment. This is particularly important for battery research where the electrolyte, temperature and electrical bias all affect performance and chemical response. Towards the end of the year we launched our Video Rate (“VRS”) AFM which is also based on the versatile Cypher platform. It is the first and only full‑featured video‑rate atomic force microscope and sets a new benchmark for speed, enabling high resolution imaging of dynamic events at the nanoscale across a range of applications including biodynamics, cosmetics, pharmaceuticals, semiconductor processing and catalysis.
Plasma Technology provides material etch and deposition processes and solutions to semiconductor research laboratories and advanced specialised production facilities that develop devices and materials for novel applications in nanotechnology. Our focus on developing advanced process recipes to complement our etch and deposition platforms, combined with a focus on operational effectiveness, has helped deliver a significant improvement in the performance of the business. Our proprietary processes have helped us to win a number of orders into specialist production facilities for power semiconductors and the production of sensors. Our new hardware platforms are delivering the anticipated operational improvements and efficiencies through their increasing standardisation and modular design. We expect to see continuing interest from nanotechnology research with building interest in our solutions for atomic‑scale processing of materials for power conversion and storage. We were pleased to receive the ‘High Volume Manufacturing’ award from the Compound Semiconductor industry recognising our development of SiC plasma etch processes, which are delivered through our PlasmaPro 100 Polaris system launched in the previous year.
NanoTechnology Tools continued

01: Strategic Report 02: Governance 03: Financial Statements 04: Company Information
Oxford Instruments plc Report and Financial Statements 2017 17
NanoScience designs, manufactures and supports market‑leading products that create unique environments and measurement solutions primarily for the physical science and quantum technology research community. Our portfolio includes ultra‑low temperature cryogenic systems, specialised high field superconducting magnets and associated measurement solutions which are enabling the advances in quantum technologies, new materials and device development as well as fundamental research in the physical sciences. Demand for our specialist magnet systems remains strong, including installations into leading institutes across China, Europe and the US. In addition, increased investment in existing beamline facilities drove demand for high value, specialised superconducting magnet systems. In the year we made successful installations into several leading facilities including OakRidge National Laboratory in the US and the Rutherford Appleton Laboratory in the UK. We have benefited from the global increase of funding into quantum‑related technologies, fuelled by quantum computing and quantum sensors in particular. This has driven increased demand across our cryogenic and related optical measurement solutions. Our market leading portfolio of cryogenic and measurement solutions are well positioned to benefit from the forecast increase in quantum funding initiatives across Europe, the US and China.
The ScientaOmicron joint venture created the largest player in the Ultra‑High Vacuum surface science field. While the integration and ongoing restructuring continue, the business has been impacted by the subdued academic funding and slower than planned product launches. This is being addressed by more focused investment to address product gaps and a continued focus on driving operational efficiencies. The Group has a 47% share in the joint venture.
A loss before tax of £17.4 million (2016: profit of £9.0 million) for NanoTechnology Tools is after the impairment of non‑current assets, amortisation of acquired intangibles and other adjusting items. Total impairment costs of £31.3 million relate to Asylum (£23.3 million) and ScientaOmicron (£8.0 million). Amortisation of acquired intangibles was £10.6 million. Other adjusting items comprise £0.8 million of charges relating to ScientaOmicron and acquisition related costs of £0.3 million.
We are seeing an increased demand from commercial organisations seeking to gain competitive advantage from the exploitation of nanotechnology.
1: Asylum’s Video Rate AFM, which is the first and only full-featured video rate AFM on the market.
2: Andor’s iXon Ultra, one of the solutions we offer for those working within the quantum science arena.

18 Oxford Instruments plc Report and Financial Statements 2017
Operations Review continued
Industrial Products
A lab technician using the latest MQC analyser from our Magnetic Resonance business for quality assurance analysis

01: Strategic Report 02: Governance 03: Financial Statements 04: Company Information
Oxford Instruments plc Report and Financial Statements 2017 19
Industrial Products comprises the X‑ray Technology, Magnetic Resonance and Industrial Analysis businesses.
After the previously announced disposal of our Superconducting Wire business, Industrial Products comprises the X‑ray Technology, Magnetic Resonance and Industrial Analysis businesses. Since the close of the year, we have announced the agreed sale of our Industrial Analysis business to Hitachi High‑Technologies in line with our Horizon strategy.
The sector experienced a stable performance given the continued challenging end market conditions driven by subdued oil and commodity prices and reduced steel production in China. The launch of new products, combined with improved efficiencies across this sector, maintained a stable performance from the Industrial portfolio.
Our X‑ray Technology business supplies X‑ray sources to leading OEMs for industry, research and medical applications including material composition analysis, real‑time medical imaging and analysis of multi‑layer printed circuit boards. X‑ray Technology made progress in the year despite challenging markets. While growth of traditional laboratory and ROHS‑driven analysis markets have slowed, the imaging markets and industrial analysis markets are becoming an increasingly important part of our market focus.
Results for Industrial Products Constant 2017 2016 currency £m £m Growth growth1
Revenue 56.7 54.0 5.0% (7.0%)
Adjusted2 operating profit 1.7 1.1
Adjusted2 operating margin 3.0% 2.0%
Loss before tax after adjusting items (2.1) (3.1) 1. For definition refer to the highlights on page 1.2. Details of adjusting items can be found in Note 1 to these Financial Statements.
Industrial Analysis designs and sells a range of spectrometers into a broad range of industrial markets. Our customers span global industries from metals, steel foundries and scrap recycling through to automotive, solar, petrochemicals, cement, recycling, and food and agriculture. The business reinforced its market position through a number of key product launches across our Optical Emission Spectroscopy and Hand Held Analyser portfolio. For example, our recently launched Vulcan handheld laser induced breakdown spectroscopy analyser, offers portable analysis at lower cost and without ionising radiation. Vulcan has had a successful take up since launch and is targeted at quality control applications in general manufacturing as well as metals recycling. In the year we also added the “Optimum” model to the FOUNDRY‑MASTER range of compact optical emission spectrometers, which provides unparalleled analytical performance for the entry‑level quality assurance, quality control and metal production applications.
A loss before tax of £2.1 million (2016: loss of £3.1 million) is after the impairment of non‑current assets, amortisation of acquired intangibles and other adjusting items. Total impairment costs of £1.1 million relate to a write‑down of superseded intellectual property within Industrial Analysis. Amortisation of acquired intangibles was £1.3 million. Other adjusting items comprise £0.2 million of restructuring charges and acquisition related costs of £1.2 million.
The consumer electronics, printed circuit board inspection and oil and gas markets continued to be subdued. However, there was growth in medical imaging applications as demand for mini and micro CT, bone density and biopsy equipment increased, driven by trends in reduced footprint, portability and reduced patient dosage. Battery inspection is another increasing application area and we are further improving our products to provide enhanced offerings to this sector. The regulatory legislations that were expected in China to control metals in food and water have not yet materialised and represent potential future growth.
Our Magnetic Resonance business uses fundamental physical processes to provide essential information about the nature and behaviour of materials and products. We provide instruments to academic and industrial researchers that are simple to operate, providing essential information that relates directly to the performance of our customers’ products. We continue to see interest in Pulsar, the highest resolution benchtop NMR spectrometer on the market. Pulsar is an affordable system that allows researchers to have their own NMR analyser in‑house rather than having to go to high cost, low throughput specialist service laboratories.

20 Oxford Instruments plc Report and Financial Statements 2017
Operations Review continued
Service
MRI scanner inside a mobile imaging unit from our Healthcare business.

01: Strategic Report 02: Governance 03: Financial Statements 04: Company Information
Oxford Instruments plc Report and Financial Statements 2017 21
The Service sector comprises the Group’s maintenance service contracts, billable repairs and spare part sales for Oxford Instruments.
The Service sector comprises the Group’s maintenance service contracts, billable repairs and spare part sales for Oxford Instruments’ own products; and the service, sale and rental of refurbished third party MRI and CT machines under the OI Healthcare brand.
The improved profit and operational margin we saw from the servicing of our own products was unfortunately offset by a poor performance in our OI Healthcare business. The OI Healthcare business in the US, which offers refurbished imaging systems, mobile imaging solutions and maintenance services, was impacted by a change in the software licensing policy on second‑hand systems by one of the main system manufacturers and by the high level of activity in the comparative period. As a result, the number of refurbished systems sold in the year and revenue generated from leasing were significantly reduced. We are taking the necessary steps to improve sustainable profitability, including driving operational efficiencies and improving management capabilities in specific areas of focus.
A profit before tax of £1.7 million (2016: £14.9 million) is after the impairment of non‑current assets, amortisation of acquired intangibles and other adjusting items. Total impairment costs of £11.2 million relate to OI Healthcare and amortisation of acquired intangibles was £1.9 million. Other adjusting items comprise £0.4 million of restructuring charges.
Results for Service Constant 2017 2016 currency £m £m Growth growth1
Revenue 83.2 78.4 6.1% (7.1%)
Adjusted2 operating profit 15.2 18.8
Adjusted2 operating margin 18.3% 24.0%
Profit before tax after adjusting items 1.7 14.9 1. For definition refer to the highlights on page 1.2. Details of adjusting items can be found in Note 1 to these Financial Statements.
1: A mobile imaging unit leaving our Healthcare business for installation at a customer site.
2: A look inside a mobile imaging unit.

22 Oxford Instruments plc Report and Financial Statements 2017
KPIs and Principal Risks
Key performance indicatorsThe Group uses a range of measures to monitor progress against its strategic plans. The key performance indicators are presented below:
Financial goal What we measure Why we measure
How we performed %
2014 2015 2016 2017
To deliver shareholder returns through profitable, sustainable growth with strong cash conversion and efficient use of capital
Revenue growth To drive profitable, sustainable growth through the implementation of our strategy
7.1 7.6 (4.1) 9.0
Adjusted operating profit and margin1
To consistently maintain underlying operating margins
14.2 10.9 12.9 12.2
Adjusted earnings per share (“EPS”) growth
To achieve long‑term, consistent growth in EPS
10.8 (31.8) 9.7 5.5
Cash flow2 To maintain a strong operating cash conversion ratio and high level of free cash flow
43 72 110 86
Return on capital employed (“ROCE”)3
To deliver ROCE in excess of our cost of capital
9.5 5.2 8.3 9.6
Strategic priorities What we measure Why we measure
How we performed %
2014 2015 2016 2017
Inventing the Future Proportion of revenue coming from products launched in the previous three years4
To measure the effectiveness of our R&D programmes
45 45 36 31
Realising the Brand Net Promoter Score®5 To measure customer feedback 58 52 59 65
Adding Personal Value “Value add” = (adjusted operating profit + employment costs)/employment costs
To measure efficiency 1.50 1.34 1.44 1.39
1. Calculated as adjusted operating profit divided by revenue.
2. Cash conversion is defined as the ratio of adjusted operating cash generated to adjusted operating profit (see Income Statement). Adjusted operating cash is defined as adjusted EBITDA, less movement in working capital, capitalised development expenditure and net capital expenditure on property, plant and equipment.
3. Calculated as adjusted operating profit less amortisation (but before impairment) of intangible assets divided by capital employed. Capital employed is defined as assets (excluding cash, tax and derivative assets) less liabilities (excluding tax, debt, derivative and pension liabilities).
4. To ensure this metric better reflects the performance of those business which invest in R&D, the revenue from the Group’s OI Healthcare division has been excluded from this metric. Results from previous years have been restated to show this.
5. The Net Promoter Score is a metric which is compiled by asking customers whether they would recommend Oxford Instruments to a friend or colleague. Customers give a score between zero and ten. Those customers who score nine or ten are promoters, those customers who score seven or eight are neutral and customers who score six or less are detractors. The net promoter score is the difference between the numbers of promoters and the number of detractors (both expressed as a percentage of the number of replies received). The score can range between ‑100 (no customers are promoters) and +100 (all customers are promoters). A positive score indicates that the Company has fewer detractors than promoters.

01: Strategic Report 02: Governance 03: Financial Statements 04: Company Information
Oxford Instruments plc Report and Financial Statements 2017 23
Specific risk 1: Technical riskContext: The Group provides high technology equipment and systems to its customers.
Risk Possible impact Control mechanisms Mitigation
• Failure of the advanced technologies applied by the Group to produce commercial products, capable of being manufactured and sold profitably.
• Lower returns through loss of market share and reduced profitability.
• Negative impact on the Group’s reputation.
• “Voice of the Customer” approach to drive the product development road map.
• Formal new product development stage gate process to manage R&D.
• Product lifecycle management.
• Understanding customer needs/expectations and targeted new product development programme to maintain and strengthen product positioning.
• Stage gate process in product development to challenge commercial business case and mitigate technical risks.
• Operational practices around sales‑production matching and inventory management to mitigate stock obsolescence risks.
Specific risk 2: Routes to marketContext: In some instances the Group’s products are components of higher‑level systems
sold by OEMs, and thus the Group does not control its route to market.
Risk Possible impact Control mechanisms Mitigation
• Backward vertical integration by OEMs.
• Loss of a key route to market.
• New competitors.
• Lower sales and profitability.
• Customer intimacy to match product performance to customer needs.
• Positioning of Oxford Instruments brand and marketing directly to end users.
• Product differentiation to promote advantages of Oxford Instruments equipment and solutions.
• Strategic marketing with OEMs to sell performance of the combined system.
• Broadening the OEM customer base.
• Direct marketing to end users.
Specific risk 3: Economic environmentContext: Government expenditure may become constrained in key markets.
Risk Possible impact Control mechanisms Mitigation
• Reduction in global research funding.
• Lower sales and profitability. • Market intimacy and identification of alternative markets.
• Market diversification – increasing penetration into corporate customers not dependent on external funding.
Specific risk 4: Political riskContext: The Group operates in global markets and can be required to secure export licences from governments.
Risk Possible impact Control mechanisms Mitigation
• Geopolitical changes resulting in sanctions and bar on exports to specific countries or unfavourable changes in tariffs/other controls on exports.
• Lower sales and profitability. • Contract review and protection against breach in the event that export licence is withheld.
• Broad global customer base; contractual protection.
24 Oxford Instruments plc Report and Financial Statements 2017
KPIs and Principal Risks continued
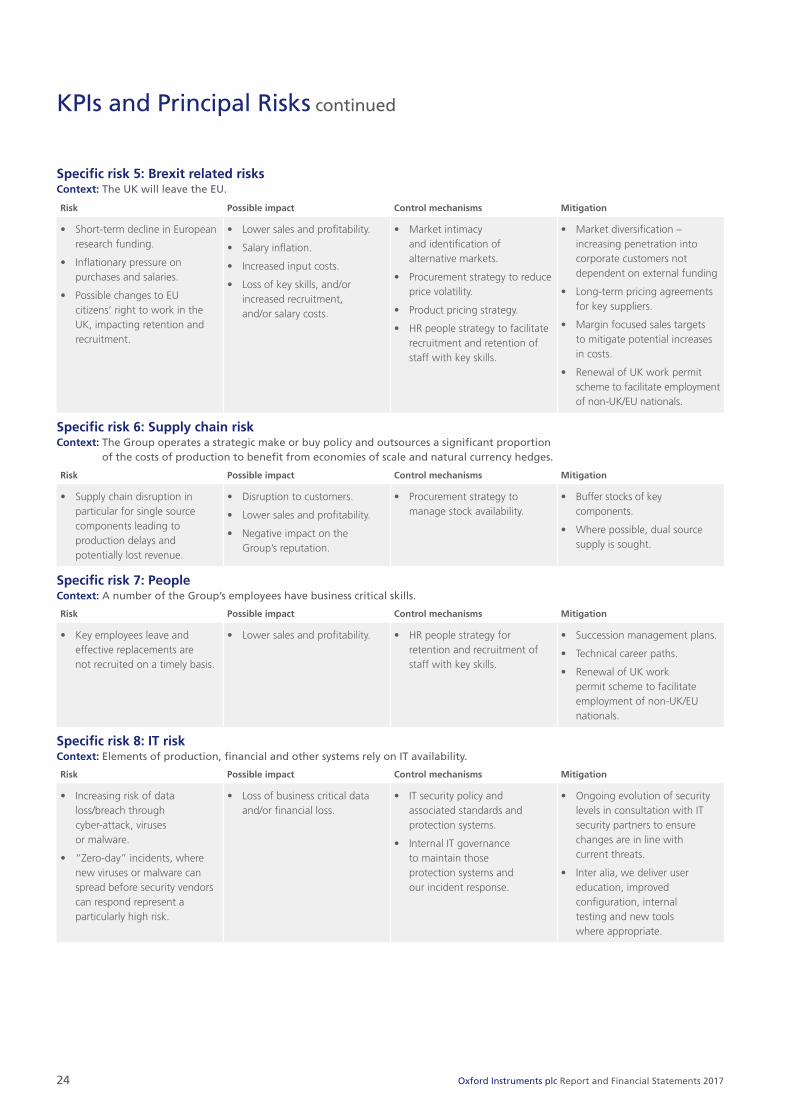
Specific risk 5: Brexit related risksContext: The UK will leave the EU.
Risk Possible impact Control mechanisms Mitigation
• Short‑term decline in European research funding.
• Inflationary pressure on purchases and salaries.
• Possible changes to EU citizens’ right to work in the UK, impacting retention and recruitment.
• Lower sales and profitability.
• Salary inflation.
• Increased input costs.
• Loss of key skills, and/or increased recruitment, and/or salary costs.
• Market intimacy and identification of alternative markets.
• Procurement strategy to reduce price volatility.
• Product pricing strategy.
• HR people strategy to facilitate recruitment and retention of staff with key skills.
• Market diversification – increasing penetration into corporate customers not dependent on external funding
• Long‑term pricing agreements for key suppliers.
• Margin focused sales targets to mitigate potential increases in costs.
• Renewal of UK work permit scheme to facilitate employment of non‑UK/EU nationals.
Specific risk 6: Supply chain riskContext: The Group operates a strategic make or buy policy and outsources a significant proportion
of the costs of production to benefit from economies of scale and natural currency hedges.
Risk Possible impact Control mechanisms Mitigation
• Supply chain disruption in particular for single source components leading to production delays and potentially lost revenue.
• Disruption to customers.
• Lower sales and profitability.
• Negative impact on the Group’s reputation.
• Procurement strategy to manage stock availability.
• Buffer stocks of key components.
• Where possible, dual source supply is sought.
Specific risk 7: PeopleContext: A number of the Group’s employees have business critical skills.
Risk Possible impact Control mechanisms Mitigation
• Key employees leave and effective replacements are not recruited on a timely basis.
• Lower sales and profitability. • HR people strategy for retention and recruitment of staff with key skills.
• Succession management plans.
• Technical career paths.
• Renewal of UK work permit scheme to facilitate employment of non‑UK/EU nationals.
Specific risk 8: IT riskContext: Elements of production, financial and other systems rely on IT availability.
Risk Possible impact Control mechanisms Mitigation
• Increasing risk of data loss/breach through cyber‑attack, viruses or malware.
• “Zero‑day” incidents, where new viruses or malware can spread before security vendors can respond represent a particularly high risk.
• Loss of business critical data and/or financial loss.
• IT security policy and associated standards and protection systems.
• Internal IT governance to maintain those protection systems and our incident response.
• Ongoing evolution of security levels in consultation with IT security partners to ensure changes are in line with current threats.
• Inter alia, we deliver user education, improved configuration, internal testing and new tools where appropriate.

01: Strategic Report 02: Governance 03: Financial Statements 04: Company Information
Oxford Instruments plc Report and Financial Statements 2017 25
Specific risk 9: Operational riskContext: Business units’ production are typically located at a single site.
Risk Possible impact Control mechanisms Mitigation
• Loss of all or part of a major production facility.
• Delayed shipments leading to lower sales and profitability.
• Business Continuity Plans (“BCPs”) in place.
• Use of contractual protection to mitigate financial consequences of delayed delivery.
• Principal sites have detailed BCPs which include plans to restore or relocate production in the event of a major incident.
• Mechanisms such as clauses for limitation of liability/liability caps/exclusion of consequential losses in sales contracts.
Specific risk 10: PensionsContext: The Group’s calculated pension deficit is sensitive to changes in the actuarial assumptions.
Risk Possible impact Control mechanisms Mitigation
• Movements in the actuarial assumptions may have an appreciable effect on the reported pension deficit.
• Additional cash required by the Group to fund the deficit.
• Reduction in net assets.
• ‘Delivering Shareholder Value’ ‑ Focus on balanced and attractive global markets.
• ‘Liberating Cash’ – Developing a competitive global supply base that supports our growth.
• The Group has closed its defined benefit pension schemes in the UK and US to future accrual.
• The Group has a funding plan in place to reduce the pension deficit over the short to medium term.
Specific risk 11: Foreign exchange volatilityContext: The Group’s sterling cost basis is higher than its sterling revenue sources meaning
that a significant proportion of the Group’s profit is made in foreign currencies.
Risk Possible impact Control mechanisms Mitigation
• Adverse foreign currency movements.
• Reduced profitability. • Natural hedging to offset foreign currency sales through procurement in foreign currencies.
• Hedging programme.
• Strategic procurement in USD, Euros and Yen.
• Short‑term exposure to volatility is managed by hedging programme (forward contracts).
Specific risk 12: Legal/compliance riskContext: The Group operates in a complex technological environment and competitors
may seek to protect their position through intellectual property rights.
Risk Possible impact Control mechanisms Mitigation
• Infringement of a third party’s intellectual property.
• Potential loss of future revenue.
• Financial compensation.
• Formal ‘Freedom to Operate’ assessment to identify potential IP issues during product development.
• Confirmation of ‘Freedom to Operate’ during new product development stage gate process.
26 Oxford Instruments plc Report and Financial Statements 2017
Viability Statement
In accordance with provision C.2.2 of the UK Corporate Governance Code 2014, the Directors have performed an assessment of the Group’s viability over a period longer than the twelve months required for the going concern statement. In keeping with the assessment performed for the first time last year, the assessment covers a three year period. The Directors consider that three years remains an appropriate time frame for assessing the Group’s longer‑term viability, on the basis that there is a well established medium‑term planning process in place which is supported by a strategic plan covering key elements such as product development. Further, we consider that we have good visibility of markets during this period, albeit there are inherent uncertainties relating to Brexit which is expected to occur in March 2019. This year’s assessment, therefore, covers the period from 1 April 2017 to 31 March 2020 (the “Viability Assessment Period”).
Key criteria applied in the assessmentThe Directors consider that the Group’s viability can reasonably be assured if it is able to operate within parameters where net debt is less than three times EBITDA. In such circumstances, the Directors consider that the Group will continue to operate and meet its liabilities as they fall due. Of particular importance in the Viability Assessment Period, the Group’s revolving credit facility falls due for renewal in February 2020. The Directors consider that performance within the parameters set out above should enable the Group to refinance its revolving credit facilities, if necessary.
Methodology and sensitivities appliedThe viability assessment is informed by the principal risks and uncertainties which are faced by the Group and which are disclosed on pages 23 to 25 of this Annual Report. The assessment considered the potential financial impact if the risks identified were to arise and the measures available to the Directors to mitigate their impact. For 2017/18, the sensitivities were applied to the detailed budget for the year and for the two financial years ending 31 March 2019 and 31 March 2020, the reference point was the medium‑term plan (“MTP”).
The most significant risks (in terms of the potential financial impact in the Viability Assessment Period) relate to the potential decline in revenue and potential increases in input costs which would result in a decrease in gross profit/contribution. Reduced gross profit/contribution are potential consequences for risks 1 to 7 as set out in the list of principal risks and uncertainties. While the impact of the loss of a key customer or market in an individual business unit might be severe at the business unit level, these risks at a Group level are mitigated by operating in diverse geographic markets and by not being overly reliant on a single customer or source of funding. Consequently, these risks were modelled in aggregate, at a Group level, rather than by applying sensitivities at an individual business unit level.
The impact of a number of the Group’s principal risks and uncertainties, should they materialise, would likely result in an increase in the level of non‑recurring, overhead costs. This is considered to be a potential consequence for risks 5, 8, 9, 10 and 12 as disclosed. The potential impact of these risks arising is considered in aggregate across the whole Viability Assessment Period by the inclusion of a net contingency against budgeted overhead costs of £11.7 million (before tax) in the first year of the Viability Assessment Period. For the purposes of the assessment, the adverse impact on both cash and EBITDA of this net contingency is assumed to arise in the first year of the Viability Assessment Period.
Over the past ten years, Oxford Instruments has been successfully driving the adoption of nanotechnology by industrial and research communities all over the world.

01: Strategic Report 02: Governance 03: Financial Statements 04: Company Information
Oxford Instruments plc Report and Financial Statements 2017 27
In performing the viability assessment, the Directors also considered the extent to which other downside risks were effectively mitigated in the budget/MTP for the three year period. For example, currency exposure (risk 11) in the first year of the viability assessment is mitigated to a certain extent by the Group’s hedging programme. Therefore, the potential impact on earnings of an adverse exchange rate movement on un‑hedged foreign currency exposure was included against the budget baseline for the first year of the Viability Assessment Period. However, the baseline financial forecasts used in the two years covered by the MTP were based on foreign exchange rates which are considered to be prudent compared to current rates.1 On this basis no sensitivity for adverse foreign exchange movements in those years was considered necessary.
Based on the above, the key sensitivities modelled in the viability assessment relate to a decline in sales revenue and increases to cost of sales which, taken together, would lead to reduced gross margins/contribution. Over the Viability Assessment Period as a whole, the impact of the downside risks modelled resulted in a decrease to the baseline EBITDA of just over 40%.
OutcomeThe outcome of the assessment, by quantifying the financial impact of downside risks, and taking into account mitigating actions available to reduce the impact of those risks on EBITDA and/or net debt, result in the Group staying within the parameters described above (i.e. the ratio of net debt to EBITDA is lower than 3:1 in each year of the Viability Assessment Period).
On the basis of this assessment, which evaluates the potential impact of both the principal risks and uncertainties and the mitigating actions that could be taken, the Board has a reasonable expectation that the Group will be able to continue in operation and meet its liabilities as they fall due over the next three years. This is based on the explicit assumption, set out above, that operating within such parameters will enable the Group to obtain external funding, if required, when the current revolving credit facility falls due for renewal in February 2020.
This assessment supports not only the viability statement above, but also the statement on going concern, set out further below.
Impact of the disposal of Industrial Analysis on the viability assessmentThe viability assessment performed is based on the current Group structure (i.e. including Industrial Analysis) as the disposal is subject to a number of conditions precedent. A high‑level assessment of the impact of the sale of Industrial Analysis shows that completion of the sale would have a positive impact on the viability assessment. This arises because the reduction in net debt arising from the sale would outweigh the reduction in future EBITDA and cash flows in the model.
Going concern statementThe Group’s business activities and factors that are considered likely to affect its performance and position in the future are set out in the Strategic Report on pages 1 to 27. The Finance Review on pages 28 to 33 discloses information relevant to the Group’s financial position, its cash flows, borrowing facilities and liquidity.
The Directors have considered the Group’s current financial position and future prospects and, as set out in the viability statement above, have performed an assessment of longer‑term viability up to 31 March 2020. On this basis, the Directors conclude that there is a reasonable expectation that the Group will continue in operational existence for the foreseeable future and that there are no material uncertainties that may cast significant doubt over its ability to continue as a going concern.
As a result, the Directors continue to prepare the Financial Statements under the going concern basis.
1. For example, against the pound, the one Euro rate was 1.30 and the USD rate was $1.45.

28 Oxford Instruments plc Report and Financial Statements 2017
The Group had a stable performance in 2017 with total adjusted profit in line with expectations. Reported revenue grew by 9.0% to £348.5 million (2016: £319.7 million). Revenue, excluding currency effects, declined by 3.7%, with the movement in average currency exchange rates over the last year positively impacting reported revenue by £40.6 million. At the end of the year the Group’s order book for future deliveries stood at £144.5 million (2016: £132.2 million), growth of 9.3% on a reported basis and 0.5% at constant currency.
Adjusted operating profit from continuing operations increased by 3.2% to £42.5 million (2016: £41.2 million). Adjusted operating profit from continuing operations, excluding currency effects, declined by 5.8%. Adjusted operating margin from continuing operations declined by 70 basis points to 12.2% (2016: 12.9%), with a decline in Service margin more than offsetting an increase in the NanoTechnology Tools margin.
Adjusted profit before tax grew by 7.1% to £36.0 million (2016: £33.6 million). A pre‑tax adjusted profit of £1.3 million from the Superconducting Wire business for the seven months of ownership, prior to its sale in November 2016, is included in discontinued operations. For the twelve months to March 2016 the Superconducting Wire business delivered an operating profit of £3.4 million. Including discontinued operations, the Group achieved reported adjusted profit before tax of £37.1 million (2016: £37.0 million).
Following a decline this year in financial performance from our US Healthcare and Asylum businesses, we have concluded that our projections of future cash flows do not support the level of goodwill and intangibles held on the balance sheet. We have also made a small impairment of acquired intellectual property in Industrial Products and written down inefficient capitalised development costs on the Group’s new ERP system. Consequently, goodwill and intangibles to the value of £37.8 million have been impaired.
In addition, we have written down the carrying value of our investment in the ScientaOmicron joint venture by £8.0 million. The combined impairment of £45.8 million in non‑current assets is a non‑cash adjustment.
Non‑recurring items and acquisition related costs were £3.1 million and the movement in the mark‑to‑market valuation of currency hedges for future years gave rise to a gain of £1.2 million.
Adjusted profit before tax from continuing operations of £36.0 million (2016: £33.6 million) represents a margin of 10.3% (2016: 10.5%). After the impairment of goodwill and intangible assets and other adjusting items, the Group recorded a loss before tax of £25.5 million from continuing operations (2016: profit of £9.7 million).
Finance Review
The Group had a stable performance in 2017 with total adjusted profit in line with expectations.
Summary• Reported revenue up 9.0%,
down 3.7% at constant currency
• Adjusted profit before tax up 7.1%, in line with our expectations
• Adjusted operating margin down 70 basis points, reflecting lower returns in Service and higher returns in NanoTechnology Tools
• Dividend maintained at 13.0p for the full year

01: Strategic Report 02: Governance 03: Financial Statements 04: Company Information
Oxford Instruments plc Report and Financial Statements 2017 29
Continuing adjusted basic earnings per share grew by 5.5% to 47.8 pence (2016: 45.3 pence). Continuing earnings per share were a loss of 44.0 pence (2016: profit of 12.2 pence).
Operating cash flow (as defined in the cash flow section on page 32) decreased by 14.4% to £39.7 million, primarily due to a planned reduction in payables compared to the previous year end. Adjusted operating cash (defined as adjusted EBITDA, less movement in working capital, capitalised development expenditure and capital expenditure) represents 86.1% (2016: 110.4%) of adjusted
operating profit. Net debt decreased from £128.2 million to £109.3 million, representing a net debt to EBITDA ratio (for banking covenant purposes) of 2.1 times, comfortably within our banking covenant of 3.0 times.
During the year the Group disposed of its Superconducting Wire business and this has been treated as a discontinued operation in the Financial Statements. Accordingly, the numbers detailed in the Finance Review exclude the results of Superconducting Wire in both the current and prior periods.
Adjusted operating profit is stated before impairment and amortisation of goodwill and acquired intangibles, non‑recurring items and acquisition‑related costs, and the mark‑to‑market valuation of unexpired currency hedges, as set out in Note 1 to the Financial Statements.
Income StatementThe Group’s Income Statement is summarised below.
Year ended Year ended 31 March 2017 31 March 2016 £m £m Change
Revenue 348.5 319.7 +9.0%
Adjusted gross profit 181.7 155.5 +16.8%
Administrative expenses (139.2) (114.3)
Adjusted operating profit 42.5 41.2 +3.2%
Net finance costs (6.5) (7.6)
Adjusted profit before tax 36.0 33.6 +7.1%
Amortisation of acquired intangibles (13.8) (16.7)
Impairment of goodwill and intangibles (37.8) —
Impairment of investment of associate (8.0) —
Non‑recurring items and acquisition‑related costs (3.1) (4.5)
Mark‑to‑market of currency hedges 1.2 (2.7)
(Loss)/profit before tax (25.5) 9.7
Tax from continuing operations 0.4 (2.7)
(Loss)/profit for the period from continuing operations (25.1) 7.0
Adjusted effective tax rate1 24.1% 22.9%
Continuing adjusted earnings per share – basic 47.8p 45.3p +5.5%
Earnings per share – basic (44.0)p 12.2p
Continuing adjusted earnings per share – diluted 47.7p 45.2p +5.5%
Earnings per share – diluted (44.0)p 12.3p
Dividend per share 13.0p 13.0p 1. The adjusted effective tax rate is calculated excluding impairment of non‑current assets, amortisation on acquired intangibles, non‑recurring items and acquisition related costs and the
mark‑to‑market of financial derivatives.
Revenue
£348.5mGross profit
£181.7mOperating profit
£42.5m

30 Oxford Instruments plc Report and Financial Statements 2017
Finance Review continued
RevenueReported revenue of £348.5 million (2016: £319.7 million) increased by 9.0%. NanoTechnology Tools grew by 11.4%, Industrial Products by 5.0% and Service, 6.1%.
The depreciation of Sterling against the US Dollar, Euro and Japanese Yen has increased reported revenue by £40.6 million. Revenue growth, excluding currency effects, showed a decline of 3.7%, with NanoTechnology Tools falling by 1.2%, Industrial Products by 7.0% and Service by 7.1%.
At constant currency, revenue grew by 7.2% in Asia, with strong growth in China. Revenue in Europe, North America and Rest of World declined by 5.9%, 12.0% and 28.2% respectively.
The transfer of our Omicron business into a joint venture, ScientaOmicron, led to a reduction in revenue of £2.0 million compared to the comparative period as under equity accounting we no longer consolidate the joint venture’s revenue.
Gross profitAdjusted gross profit grew by 16.8% to £181.7 million (2016: £155.5 million), representing an adjusted gross profit margin of 52.1%, an increase of 350 basis points over last year.
Operating profitAdjusted operating profit increased by 3.2% to £42.5 million (2016: £41.2 million), representing an adjusted operating profit margin of 12.2%, a decrease of 70 basis points against last year. The NanoTechnology Tools margin rose by 90 basis points to 12.3% (2016: 11.4%) and the Industrial Products margin rose by 100 basis points to 3.0% (2016: 2.0%). Lower US Healthcare revenue, due to a large fall in equipment sales, led to a fall in Service margin to 18.3% (2016: 24.0%). Adjusted operating profit includes realised losses on the maturity of currency hedges resulting from the devaluation of Sterling against the US Dollar, Euro and Japanese Yen since the inception of the hedges.
Our share of the ScientaOmicron joint venture showed an adjusted loss of £0.8 million in the period, an improvement of £1.0 million against the comparative period (which includes ten months when the joint venture was in operation and two months when Omicron was a fully owned subsidiary of the Group) but below the financial performance envisaged in the investment case. Our share of the ScientaOmicron joint venture loss was £1.4 million after our share of restructuring costs.
Currency effects (including the impact of transactional currency hedging) have increased reported adjusted operating profit by £3.7 million when compared to blended hedged exchange rates for the comparative period, blended hedged exchange rates for the US Dollar, Euro and Japanese Yen against Sterling are all at stronger rates than last year.
At constant currency the adjusted operating profit margin was 12.6%, a decline of 30 basis points.
Operating profit was a loss of £20.0 million (2016: profit of £20.8 million), reflecting an impairment of non‑current assets of £45.8 million, amortisation of acquired intangibles of £13.8 million and non‑financial net adjusting costs of £2.9 million.
Adjusting itemsAmortisation of acquired intangibles of £13.8 million relates to intangible assets identified on acquisitions, being the value of technology, customer relationships and brands.
During the year the financial performance of our Healthcare business in the US deteriorated with business operating profit falling significantly from last year’s level. Performance has been impacted by a lower level of sales of refurbished imaging systems compared to the previous year, which we expect to continue. This has been driven by both a particularly high level of activity in the prior year but also a change in software licensing policy by one of the large original equipment manufacturers. We have revised our financial projections for the business, consistent with a new strategy and the actions and time required to improve profitability and operational efficiency. We concluded that goodwill and acquired intangible assets of £11.2 million could no longer be supported by projected cash flows, resulting in an impairment of the same.
The Group had a stable performance in 2017 with total adjusted profit in line with expectations.
01: Strategic Report 02: Governance 03: Financial Statements 04: Company Information
Oxford Instruments plc Report and Financial Statements 2017 31
During the year the financial performance of our Asylum business deteriorated with the business performing below our expectations. Performance has been impacted by a slowdown in academic funding in US and European markets, resulting in a contraction in the overall scanning probe microscopy market, compounded by delays in new product launches. We have revised our financial projections for the business in light of the trading environment, and planned launch dates of new products. We concluded that goodwill of £22.6 million (of which £10.9 million was apportioned goodwill from the Andor acquisition) could no longer be supported by projected cash flows, resulting in an impairment of the same.
Within our Industrial Analysis division we have impaired acquired intellectual property valued at £1.1 million that has been superseded by new product development. The write‑down of intangible assets also incorporates a £2.2 million charge for inefficient capitalised costs against the Group’s new ERP system and a charge of £0.7 million for the impairment of capitalised development costs in Asylum that had been made at the half year.
An impairment charge of £8.0 million relating to our investment in ScientaOmicron is a consequence of the 2016 financial performance and lower projected cash flows. This has resulted in a reassessment of the joint venture’s expected future business performance and the actions and time required to improve profitability and operational efficiency.
Other net non‑recurring costs and acquisition related items during the period were £3.1 million. These comprise £1.5 million of professional fees relating to the sale of Superconducting Wire and the impending sale of Industrial Analysis and £1.6 million of restructuring and charges relating to the ScientaOmicron venture.
The Group uses derivative products to hedge its exposure to fluctuations in foreign exchange rates. It is Group policy to have in place at the beginning of the financial year hedging instruments to cover 75% of its forecast transactional exposure for that year. The Group has decided that the additional costs of meeting the extensive documentation requirements of IAS 39 to apply hedge accounting to these foreign exchange hedges cannot be justified. Accordingly, the Group does not use hedge accounting for these derivatives.
Net movements on marking‑to‑market derivatives in respect of the next financial year are disclosed in the Income Statement as financial expenditure and excluded from our calculation of adjusted profit before tax.
The mark‑to‑market gain in respect of derivative financial instruments was £1.2 million (2016: £2.7 million loss). This reflects a reduction in the fair value liability on currency derivatives that are hedging future transactional currency exposures for the Group compared to the previous year end. The un‑crystallised balance sheet liability is attributable to a fall in the value of Sterling at the balance sheet date against the US Dollar, Euro and Japanese Yen, against a blended rate achieved on hedges in place for the 2017/18 financial year.
Net finance costsThe Group’s adjusted net finance costs fell by £1.1 million to £6.5 million (2016: £7.6 million) with finance charges falling by £0.3 million to £5.6 million, pension financing charges falling by £0.6 million to £1.1 million and financial income rising to £0.2 million.
Total net finance charges were £5.5 million reflecting the unwind of discount in respect of contingent consideration and mark‑to‑market movements in respect of derivative financial instruments.
Profit before taxContinuing adjusted profit before tax increased by 7.1% to £36.0 million (2016: £33.6 million). The continuing adjusted profit before tax margin decreased by 20 basis points to 10.3% (2016: 10.5%).
A loss before tax of £25.5 million (2016: profit of £9.7 million) is after the impairment of goodwill and acquired intangibles and other adjusting items.
TaxThe adjusted tax charge of £8.7 million (2016: £7.7 million) represents an effective tax rate of 24.1% (2016: 22.9%). The increase is primarily due to a reduction in deferred tax assets (excluding deferred tax on adjusted items) recognised in the US and an increase in specific tax provisions.
The statutory effective tax rate is 1.5%, lower than would be expected due to some impairment charges not deductible for tax purposes.
Earnings per shareContinuing adjusted basic earnings per share and adjusted diluted earnings per share, before adjusting items, both increased by 5.5% to 47.8 pence and 47.7 pence respectively. Continuing basic and diluted earnings per share both decreased to a loss of 44.0 pence.
Undiluted weighted average shares have stayed flat at 57.1 million.
Foreign exchangeThe Group faces transactional and translational currency exposure, most notably against the US Dollar, Euro and Japanese Yen. For the full year, approximately 12% of Group revenue was denominated in Sterling, 54% in US Dollars, 19% in Euros, 10% in Japanese Yen and 5% in other currencies. Translational exposures arise on the consolidation of overseas company results into Sterling. Transactional exposures arise where the currency of sale or purchase transactions differs from the functional currency in which each company prepares its local accounts.
The Group maintains a hedging programme against its net transactional exposure using internal projections of expected currency trading transactions expected to arise over a period extending from 12 to 24 months. As at 31 March 2017 the Group had currency hedges in place extending up to twelve months forward.
DividendThe Group’s policy is to increase the dividend each year in line with the increase in underlying earnings. However, taking into account the impact on the Group of business disposals, currency effects and our progressive strengthening of the balance sheet, the Board has proposed to hold the dividend at last year’s level. This results in a final dividend of 9.3 pence, bringing the total dividend for the year to 13.0 pence. The final dividend will be paid, subject to Shareholder approval, on 19 October 2017 to Shareholders on the register as at 22 September 2017.

32 Oxford Instruments plc Report and Financial Statements 2017
Finance Review continued
Cash flowThe Group cash flow is summarised below. Adjusted operating cash flow excludes rental assets held for resale and profits or losses on disposal of fixed assets, both of which are included within expenditure on tangible and intangible fixed assets.
Year ended Year ended 31 March 2017 31 March 2016 £m £m
Adjusted operating profit 42.5 41.2
Depreciation and amortisation 10.5 9.4
Adjusted EBITDA 53.0 50.6
Working capital movement (4.4) 8.4
Non‑recurring items and acquisition related costs (3.3) (6.5)
Pension scheme payments above charge to operating profit (6.9) (6.7)
Equity settled share schemes 0.5 0.4
Share of loss of associate 0.8 0.2
Adjusted operating cash flow 39.7 46.4
Interest (5.0) (5.6)
Tax (2.1) (3.5)
Capitalised development expenditure (7.9) (8.2)
Expenditure on tangible and intangible assets (4.1) (5.3)
Acquisition of subsidiaries, net of cash acquired (9.8) (27.1)
Proceeds from sale of subsidiary undertaking 12.2 0.6
Increase in long‑term receivables — (3.0)
Dividends paid (7.4) (7.6)
Decrease/(increase) in borrowings (12.8) 4.6
Net increase/(decrease) in cash and cash equivalents from continuing operations 2.8 (8.7)Note: Adjusted EBITDA is earnings before interest, tax, depreciation, intangible amortisation, mark‑to‑market of financial derivatives and other non‑cash adjusting items.
Adjusted operating cash flowAdjusted operating cash flow in the year decreased by 14.4% to £39.7 million (2016: £46.4 million). Adjusted operating cash (defined as adjusted EBITDA, less movement in working capital, capitalised development expenditure and capital expenditure) represents 86.1% (2016: 110.4%) of adjusted operating profit due to an outflow of working capital over the period.
The working capital outflow of £4.4 million reflects an increase in inventories of £1.5 million, a decrease in receivables of £0.6 million and a decrease in payables of £3.5 million. The increase in inventories primarily reflects a build up of refurbished imaging system inventory prior to sale or rental. We have experienced a planned reduction in payables as we move to a smoother phasing of payments compared to the previous year end.
InterestNet interest paid was £5.0 million (2016: £5.6 million). The difference from last year is primarily due to lower financing costs arising from a lower level of average net debt compared to the comparative period.
TaxTax paid was £2.1 million (2016: £3.5 million), the reduction reflecting utilisation of brought forward tax losses in Germany and the UK. Losses in Germany arose from the Omicron business while losses in the UK related to restructuring costs and the roll‑forward of R&D credits.
Investment in research and development (“R&D”)Total cash spend on R&D in the year was £30.3 million, equivalent to 8.7% of sales, (2016: £28.3 million, 8.9% of sales). A reconciliation between the amounts charged to the Income Statement and the cash spent is given below:
Year ended Year ended 31 March 2017 31 March 2016 £m £m
R&D expense charged to the Income Statement 27.8 23.6
Depreciation of R&D related fixed assets (0.1) (0.8)
Amounts capitalised as fixed assets 0.2 1.2
Amortisation and impairment of R&D costs capitalised as intangibles (5.5) (3.9)
Amounts capitalised as intangible assets 7.9 8.2
Total cash spent on R&D during the year 30.3 28.3
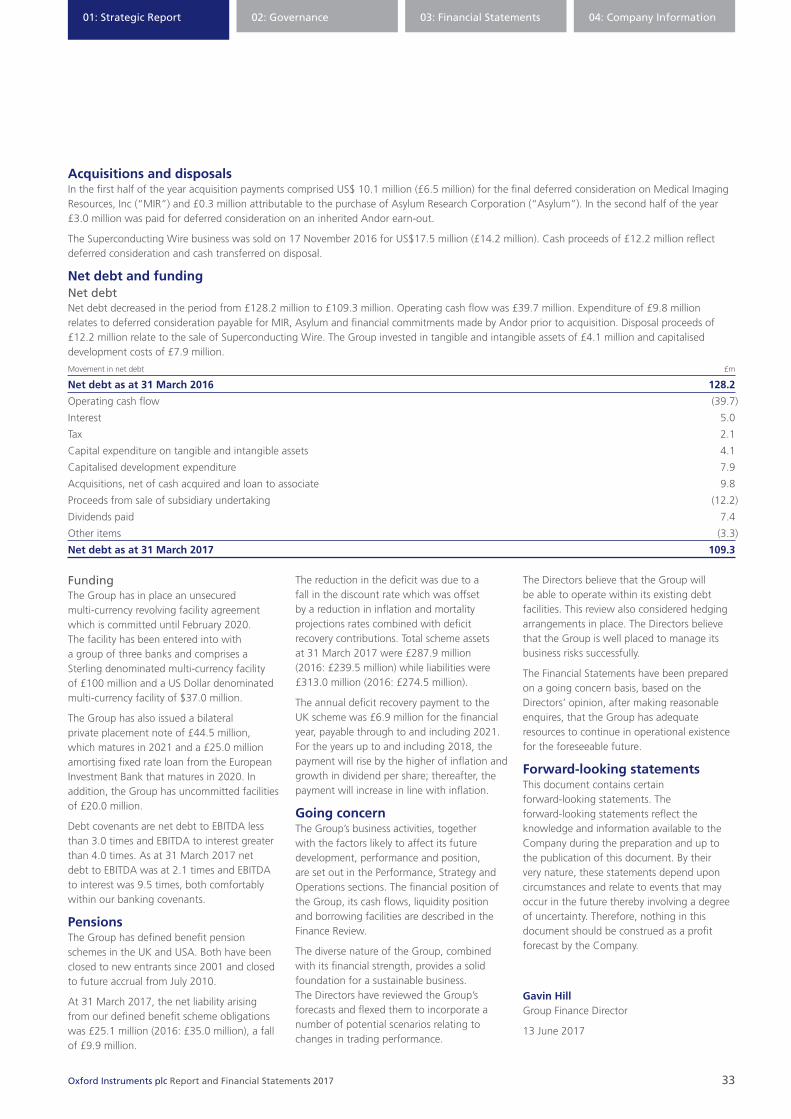
01: Strategic Report 02: Governance 03: Financial Statements 04: Company Information
Oxford Instruments plc Report and Financial Statements 2017 33
Acquisitions and disposalsIn the first half of the year acquisition payments comprised US$ 10.1 million (£6.5 million) for the final deferred consideration on Medical Imaging Resources, Inc (“MIR”) and £0.3 million attributable to the purchase of Asylum Research Corporation (“Asylum”). In the second half of the year £3.0 million was paid for deferred consideration on an inherited Andor earn‑out.
The Superconducting Wire business was sold on 17 November 2016 for US$17.5 million (£14.2 million). Cash proceeds of £12.2 million reflect deferred consideration and cash transferred on disposal.
Net debt and fundingNet debtNet debt decreased in the period from £128.2 million to £109.3 million. Operating cash flow was £39.7 million. Expenditure of £9.8 million relates to deferred consideration payable for MIR, Asylum and financial commitments made by Andor prior to acquisition. Disposal proceeds of £12.2 million relate to the sale of Superconducting Wire. The Group invested in tangible and intangible assets of £4.1 million and capitalised development costs of £7.9 million.
Movement in net debt £m
Net debt as at 31 March 2016 128.2
Operating cash flow (39.7)
Interest 5.0
Tax 2.1
Capital expenditure on tangible and intangible assets 4.1
Capitalised development expenditure 7.9
Acquisitions, net of cash acquired and loan to associate 9.8
Proceeds from sale of subsidiary undertaking (12.2)
Dividends paid 7.4
Other items (3.3)
Net debt as at 31 March 2017 109.3
FundingThe Group has in place an unsecured multi‑currency revolving facility agreement which is committed until February 2020. The facility has been entered into with a group of three banks and comprises a Sterling denominated multi‑currency facility of £100 million and a US Dollar denominated multi‑currency facility of $37.0 million.
The Group has also issued a bilateral private placement note of £44.5 million, which matures in 2021 and a £25.0 million amortising fixed rate loan from the European Investment Bank that matures in 2020. In addition, the Group has uncommitted facilities of £20.0 million.
Debt covenants are net debt to EBITDA less than 3.0 times and EBITDA to interest greater than 4.0 times. As at 31 March 2017 net debt to EBITDA was at 2.1 times and EBITDA to interest was 9.5 times, both comfortably within our banking covenants.
PensionsThe Group has defined benefit pension schemes in the UK and USA. Both have been closed to new entrants since 2001 and closed to future accrual from July 2010.
At 31 March 2017, the net liability arising from our defined benefit scheme obligations was £25.1 million (2016: £35.0 million), a fall of £9.9 million.
The reduction in the deficit was due to a fall in the discount rate which was offset by a reduction in inflation and mortality projections rates combined with deficit recovery contributions. Total scheme assets at 31 March 2017 were £287.9 million (2016: £239.5 million) while liabilities were £313.0 million (2016: £274.5 million).
The annual deficit recovery payment to the UK scheme was £6.9 million for the financial year, payable through to and including 2021. For the years up to and including 2018, the payment will rise by the higher of inflation and growth in dividend per share; thereafter, the payment will increase in line with inflation.
Going concernThe Group’s business activities, together with the factors likely to affect its future development, performance and position, are set out in the Performance, Strategy and Operations sections. The financial position of the Group, its cash flows, liquidity position and borrowing facilities are described in the Finance Review.
The diverse nature of the Group, combined with its financial strength, provides a solid foundation for a sustainable business. The Directors have reviewed the Group’s forecasts and flexed them to incorporate a number of potential scenarios relating to changes in trading performance.
The Directors believe that the Group will be able to operate within its existing debt facilities. This review also considered hedging arrangements in place. The Directors believe that the Group is well placed to manage its business risks successfully.
The Financial Statements have been prepared on a going concern basis, based on the Directors’ opinion, after making reasonable enquires, that the Group has adequate resources to continue in operational existence for the foreseeable future.
Forward-looking statementsThis document contains certain forward‑looking statements. The forward‑looking statements reflect the knowledge and information available to the Company during the preparation and up to the publication of this document. By their very nature, these statements depend upon circumstances and relate to events that may occur in the future thereby involving a degree of uncertainty. Therefore, nothing in this document should be construed as a profit forecast by the Company.
Gavin HillGroup Finance Director
13 June 2017

34 Oxford Instruments plc Report and Financial Statements 2017
Corporate Responsibility
Corporate responsibility is integral to our ongoing business success.
Inclusive:
We listen and engage with customers, colleagues, Shareholders and partners
for mutual success
Trusted:
We build long‑term relationships based on integrity, trust
and respect
Innovative and progressive:
We bring skill, experience and openness to new ideas
to address the needs of the 21st Century
Wholehearted:
We approach what we do with passion, with
care and with pace
Our values:

35Oxford Instruments plc Report and Financial Statements 2017
01: Strategic Report 02: Governance 03: Financial Statements 04: Company Information
Corporate responsibility enables us to adapt to the changing landscapes we operate within and to engage with local communities whilst being mindful of the needs of our customers, employees and investors. By supporting these needs and being aware of our environmental impact we are able to ensure that we continue to operate in a socially responsible manner.
The key areas in which we focus our efforts are:
• brand and employee engagement;
• diversity and inclusion;
• health and safety and environmental monitoring; and
• business ethics, including human rights and business malpractice.
Oxford Instruments is committed to the following guiding principles of corporate responsibility:
• establishing and maintaining long‑term, effective stakeholder relationships;
• offering our people an excellent employment experience;
• strengthening our business through diversity and inclusion; and
• operating in an ethical, sustainable and environmentally responsible manner.
Our stakeholdersInvestorsWe continue to ensure our investors receive regular and transparent communications from Oxford Instruments. In their first year, the Chief Executive and the Group Finance Director have met a number of investors and analysts. In November we hosted over 30 fund managers at our Tubney Woods site, providing them with an overview of the Group and a number of demonstrations from our Industrial Analysis and NanoScience businesses. We also held a site visit for Aviva at our High Wycombe site earlier this year.
We continue to make a recording of our results presentations available on our website. This year we added the ability to watch our results presentation live via a webcast. This allowed our analysts, investors and employees even greater ease of access to this presentation. The investor pages on the Oxford Instruments website continue to provide links to investor‑related materials and to our businesses. www.oxford-instruments.com/investors
An Asylum training session on nanomechanical measurements, which was held at the Massachusetts Institute of Technology.

36 Oxford Instruments plc Report and Financial Statements 2017
Corporate Responsibility continued
CustomersWe have a wide and diverse range of customers across many different industries. It is important that we continue to deliver customer satisfaction and to keep on top of this we measure our net promoter score to see how our customers feel we are doing. The net promoter system asked our customers whether they would recommend Oxford Instruments plc to others. This year we have received our highest score for several years.
We continue to build on this in our new Horizon strategy by ensuring that our customers are the central focus of all we do. By developing a better understanding of our customers’ needs, and, by building deeper relationships, gaining insights into their behaviours, we will be able to anticipate the next set of challenges they may face. This will allow us to create the solutions that our customers will need in the future.
We look to build on our wide range of communication channels, taking advantage of the increasing popularity of social media, to build two‑way communications. Through Horizon, we will offer more personalised and relevant messaging for our customers to ensure they are kept aware of all we offer that is relevant to them.
EmployeesAt Oxford Instruments, our employees are fundamental to our business success. We continually invest in our people, developing the capabilities that we will need to succeed over the longer term. We are committed to being the Company where the best in our sector want to work. We strive to offer the opportunities that will attract, motivate and retain talented employees, enabling them to give their best.
Our people vision is to be proud to be recognised as the leaders in what we do and for the difference we make in the world. Our aim is to retain, attract and enable the best people to perform, creating an inclusive environment and culture, where difference is valued and people are recognised for what they deliver and bring to the team.
To improve the quality, speed and predictability of our people‑related decisions, we are investing in a leading cloud‑based Human Resources Information System. This will provide significant advantages in terms of how we operate across the business and provide an opportunity to standardise, simplify and automate many of our key people‑related processes. The system will provide managers with key metrics and employees will be able to carry out personal transactions, which will deliver efficiencies across the business.
Developing capability To ensure we can deliver our long‑term growth plans, each business has undertaken a capability review. This has allowed them to develop a strategically aligned capability plan, which will ensure that we have the resources required to grow the businesses over the longer term.
A key element of developing capability is our ability to identify key talent. To support this, our talent management activities are moving into a new phase. We are focusing on ensuring that those within our Group that are ready to take on a more complex or higher level role have the opportunities and support to reach their potential. We also continue to make strides in relation to strengthening our succession planning through identifying credible successors for each of our key leadership and technical expert positions.
Our Talent Framework outlines the behaviours and skills that employees should have to be successful at Oxford Instruments. We use this insight to develop our Oxford Instruments Academy portfolio to offer a range of relevant training courses, providing our employees with programmes that can help build their capability and careers. Our flagship Management Development Programme (“MDP”) covers many of the skills needed to be a successful manager in Oxford Instruments. We see the positive impact that the MDP has on our employees, with 99% of participants recommending it to a colleague and 97% reporting a positive impact on their performance.
We are focused on building our communication approaches to ensure that all employees across the Group understand our strategy and how the business is performing.
Management Development Programme (“MDP”)Since June 2014, nine new MDP cohorts have run, including one in Japan. 16% of participants have been promoted after completing the programme.
Highest qualification data
PhD 10.0%
Degree 34.0%
Vocational 18.7%
Masters 15.5%
Diploma 11.8%
School 10.0%
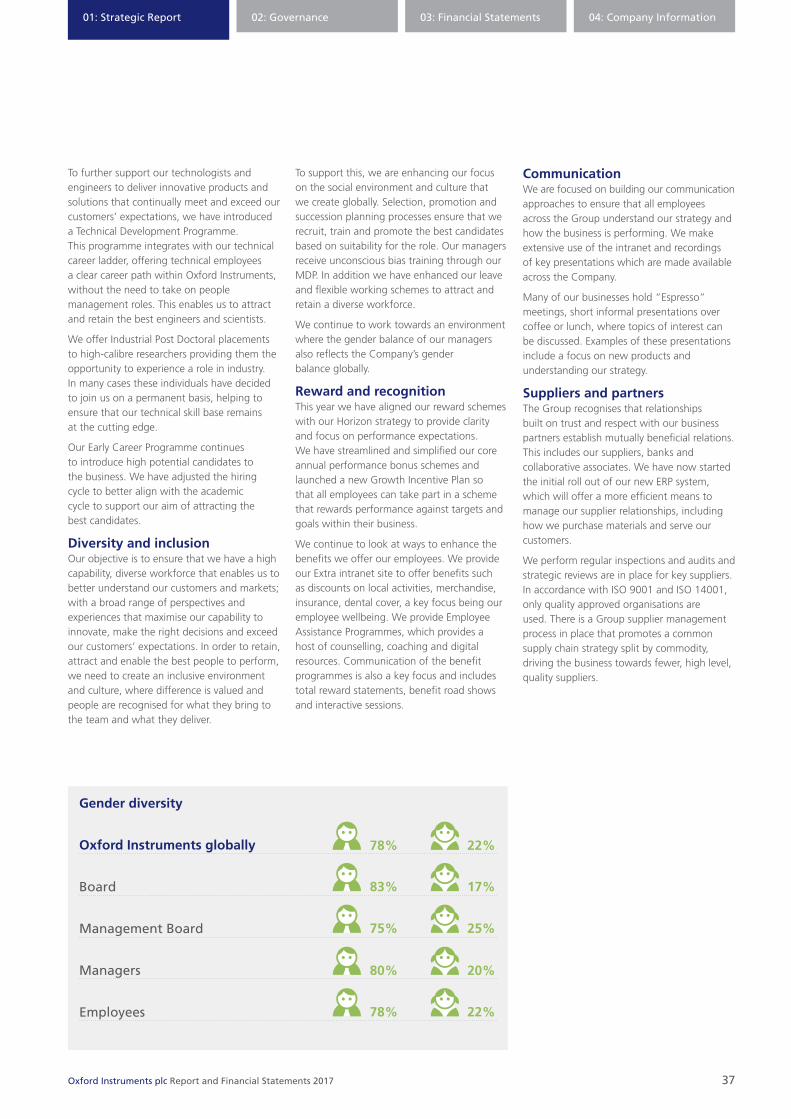
01: Strategic Report 02: Governance 03: Financial Statements 04: Company Information
Oxford Instruments plc Report and Financial Statements 2017 37
To further support our technologists and engineers to deliver innovative products and solutions that continually meet and exceed our customers’ expectations, we have introduced a Technical Development Programme. This programme integrates with our technical career ladder, offering technical employees a clear career path within Oxford Instruments, without the need to take on people management roles. This enables us to attract and retain the best engineers and scientists.
We offer Industrial Post Doctoral placements to high‑calibre researchers providing them the opportunity to experience a role in industry. In many cases these individuals have decided to join us on a permanent basis, helping to ensure that our technical skill base remains at the cutting edge.
Our Early Career Programme continues to introduce high potential candidates to the business. We have adjusted the hiring cycle to better align with the academic cycle to support our aim of attracting the best candidates.
Diversity and inclusionOur objective is to ensure that we have a high capability, diverse workforce that enables us to better understand our customers and markets; with a broad range of perspectives and experiences that maximise our capability to innovate, make the right decisions and exceed our customers’ expectations. In order to retain, attract and enable the best people to perform, we need to create an inclusive environment and culture, where difference is valued and people are recognised for what they bring to the team and what they deliver.
To support this, we are enhancing our focus on the social environment and culture that we create globally. Selection, promotion and succession planning processes ensure that we recruit, train and promote the best candidates based on suitability for the role. Our managers receive unconscious bias training through our MDP. In addition we have enhanced our leave and flexible working schemes to attract and retain a diverse workforce.
We continue to work towards an environment where the gender balance of our managers also reflects the Company’s gender balance globally.
Reward and recognitionThis year we have aligned our reward schemes with our Horizon strategy to provide clarity and focus on performance expectations. We have streamlined and simplified our core annual performance bonus schemes and launched a new Growth Incentive Plan so that all employees can take part in a scheme that rewards performance against targets and goals within their business.
We continue to look at ways to enhance the benefits we offer our employees. We provide our Extra intranet site to offer benefits such as discounts on local activities, merchandise, insurance, dental cover, a key focus being our employee wellbeing. We provide Employee Assistance Programmes, which provides a host of counselling, coaching and digital resources. Communication of the benefit programmes is also a key focus and includes total reward statements, benefit road shows and interactive sessions.
CommunicationWe are focused on building our communication approaches to ensure that all employees across the Group understand our strategy and how the business is performing. We make extensive use of the intranet and recordings of key presentations which are made available across the Company.
Many of our businesses hold “Espresso” meetings, short informal presentations over coffee or lunch, where topics of interest can be discussed. Examples of these presentations include a focus on new products and understanding our strategy.
Suppliers and partnersThe Group recognises that relationships built on trust and respect with our business partners establish mutually beneficial relations. This includes our suppliers, banks and collaborative associates. We have now started the initial roll out of our new ERP system, which will offer a more efficient means to manage our supplier relationships, including how we purchase materials and serve our customers.
We perform regular inspections and audits and strategic reviews are in place for key suppliers. In accordance with ISO 9001 and ISO 14001, only quality approved organisations are used. There is a Group supplier management process in place that promotes a common supply chain strategy split by commodity, driving the business towards fewer, high level, quality suppliers.
Gender diversity
Oxford Instruments globally
Board
Management Board
Managers
Employees
78%
75%
83%
80%
78%
22%
25%
17%
20%
22%

38 Oxford Instruments plc Report and Financial Statements 2017
Corporate Responsibility continued
Local communitiesWe want to help make our local communities better places to work and live in. We recognise the impact we have socially and economically and aim to support those around us in a number of ways. We encourage our sites to support their communities through charity and community activities. This year we have raised money for a range of charities and staff have engaged in a range of fundraising activities, including football matches between sites, bake‑offs and quiz nights.
It is also vitally important to us that we play a role in encouraging the next generation of scientists and engineers. Many of our businesses continue to work with local schools and colleges to help introduce science and engineering to a new audience. We offer work experience to school leavers interested in careers in a Company like Oxford Instruments and continue to offer both summer and gap‑year placements to promising University students.
We also work with several Universities in the UK, USA, Asia and Europe, sponsoring technology prizes and getting involved in career events to open up the opportunities available in a technology Company for Science and Engineering graduates and postgraduates.
EthicsWe have a Code of Business Conduct and Ethics that supports our commitment to operate appropriately and ethically. All employees are made aware of this Code and have full access to it. We endeavour to build a culture of trust and inclusiveness, and expect any person or company who represents us or provides services for us, to act in a way that is consistent with our Code and its principles. We perform regular due diligence on our agents, distributors and suppliers to minimise the risk of any unethical behaviour. Suppliers are required to prove they do not employ workers under the age of 15 or, in those countries subject to the developing country exception of the ILO Convention 138, employ no children under the age of 14.
We take a risk‑based approach to define our anti‑bribery and corruption policies and procedures. All employees are required to complete our anti‑bribery and corruption training, with additional refresher training at appropriate intervals. We do not tolerate any form of bribery, corruption or fraud.
The Board regularly reviews and updates the range of policies in place to support our Code of Conduct. Clear guidelines exist regarding the reporting and management of any perceived risk and all employees are made aware of and regularly reminded about Safecall, a fully independent, confidential service, where they can report any wrongdoing in the business.
Oxford Instruments does not make political donations.
Many of our businesses continue to work with local schools and colleges to help introduce science and engineering to a new audience.
NanoAnalysis staff enjoy a barbecue lunch at work. Andor Technology staff hold a coffee morning to raise funds for Hospice.
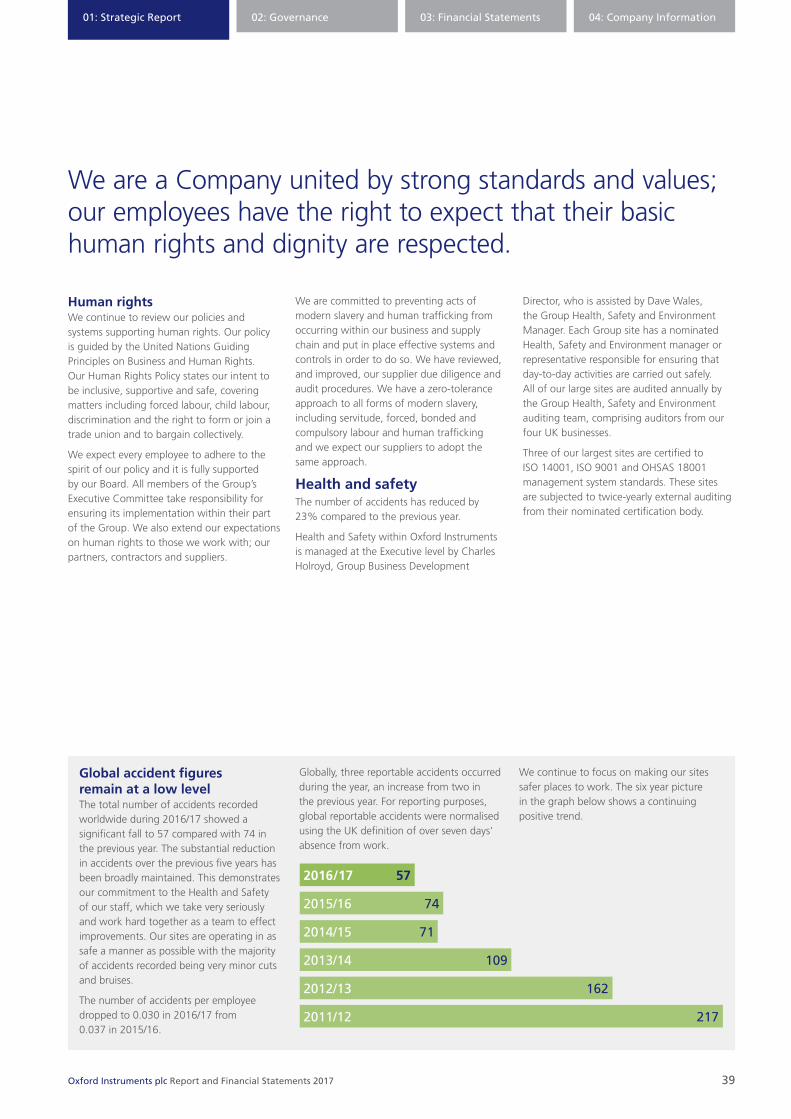
01: Strategic Report 02: Governance 03: Financial Statements 04: Company Information
Oxford Instruments plc Report and Financial Statements 2017 39
We are a Company united by strong standards and values; our employees have the right to expect that their basic human rights and dignity are respected.
Human rightsWe continue to review our policies and systems supporting human rights. Our policy is guided by the United Nations Guiding Principles on Business and Human Rights. Our Human Rights Policy states our intent to be inclusive, supportive and safe, covering matters including forced labour, child labour, discrimination and the right to form or join a trade union and to bargain collectively.
We expect every employee to adhere to the spirit of our policy and it is fully supported by our Board. All members of the Group’s Executive Committee take responsibility for ensuring its implementation within their part of the Group. We also extend our expectations on human rights to those we work with; our partners, contractors and suppliers.
We are committed to preventing acts of modern slavery and human trafficking from occurring within our business and supply chain and put in place effective systems and controls in order to do so. We have reviewed, and improved, our supplier due diligence and audit procedures. We have a zero‑tolerance approach to all forms of modern slavery, including servitude, forced, bonded and compulsory labour and human trafficking and we expect our suppliers to adopt the same approach.
Health and safetyThe number of accidents has reduced by 23% compared to the previous year.
Health and Safety within Oxford Instruments is managed at the Executive level by Charles Holroyd, Group Business Development
Director, who is assisted by Dave Wales, the Group Health, Safety and Environment Manager. Each Group site has a nominated Health, Safety and Environment manager or representative responsible for ensuring that day‑to‑day activities are carried out safely. All of our large sites are audited annually by the Group Health, Safety and Environment auditing team, comprising auditors from our four UK businesses.
Three of our largest sites are certified to ISO 14001, ISO 9001 and OHSAS 18001 management system standards. These sites are subjected to twice‑yearly external auditing from their nominated certification body.
Global accident figures remain at a low level The total number of accidents recorded worldwide during 2016/17 showed a significant fall to 57 compared with 74 in the previous year. The substantial reduction in accidents over the previous five years has been broadly maintained. This demonstrates our commitment to the Health and Safety of our staff, which we take very seriously and work hard together as a team to effect improvements. Our sites are operating in as safe a manner as possible with the majority of accidents recorded being very minor cuts and bruises.
The number of accidents per employee dropped to 0.030 in 2016/17 from 0.037 in 2015/16.
Globally, three reportable accidents occurred during the year, an increase from two in the previous year. For reporting purposes, global reportable accidents were normalised using the UK definition of over seven days’ absence from work.
We continue to focus on making our sites safer places to work. The six year picture in the graph below shows a continuing positive trend.
2011/12 217
2012/13 162
2013/14 109
2014/15 71
2015/16 74
2016/17 57

40 Oxford Instruments plc Report and Financial Statements 2017
Sustainability – protecting the environmentEnergy has been used more efficiently leading to a 17.7% reduction in the global carbon footprint from 11,666 tCO2e to 9,604 tCO2e.
Our overall environmental priority is for our operations around the World to minimise their environmental footprint. Each business has an Energy Champion at a local level who is responsible for monitoring energy use, waste streams, recycling and emissions to air, water and land. They also continuously look for innovative ways to reduce energy consumption.
We monitor our global energy use. During the 2016 calendar year, we saw a significant reduction in the Group Carbon Footprint to 9,604 tonnes of carbon dioxide equivalent (“tCO2e”) from 11,666 tCO2e in 2015. This was due to several factors, including a general improvement in energy efficiency, and the disposal of our Superconducting Wire business in November. This business consumed more energy than our other manufacturing sites.
We also strive to minimise our waste outputs and ensure that as little as possible goes to landfill. Several of our sites are now “zero waste to landfill” where waste is recycled either directly e.g. cardboard, metals, wood, paper and food, or indirectly for non‑recyclable general waste that is sent to waste sites where it can be used to produce energy.
Oxford Instruments consumed 16.73GWh of energy globally in 2016/17. The Company’s measure of energy efficiency was 45.15MWh/£million revenue compared to 58.75 MWh/£million revenue in the previous year.
Oxford Instruments is a full participant in the UK Carbon Reduction Commitment Energy Efficiency Scheme (“CRC”). The Company purchases carbon allowances to cover its emissions from energy generation and burning gas for heating and hot water. For the 2016/17 year, 3,681 carbon allowances were required to meet UK carbon emissions.
Corporate Responsibility continued
Energy consumption
Electric (GWh)Gas (GWh)
2010
20
18
16
14
12
10
8
6
4
2
02011 2012 2013 2014 2015 2016
In accordance with our Energy and Environmental Policies the Group is committed to improving our energy efficiency.
These were purchased in advance and will be surrendered in September. Due to lower consumption, only 3,000 carbon allowances will be purchased in the current year to cover carbon emissions.
Oxford Instruments measures the energy equivalent of employee air travel for its UK and USA operations. Air travel for the 2016/17 financial year totalled 14.85 million kilometres, a 12.5% reduction on the previous year. This equated to a carbon footprint of 2,229 tCO2e based on 80% long haul and 20% short haul flights, as detailed in the chart opposite.
In accordance with our Energy and Environmental Policies the Group is committed to improving our energy efficiency. We continue to invest in energy‑reducing technologies at our sites, such as LED lighting.
The Group complies with all environmental legislation in countries where it operates. This includes European Directives such as the Waste Electronic and Electrical Equipment (“WEEE”) Directive, the Restriction on use of Hazardous Substances (“RoHS”) regulations and the Registration, Evaluation, Authorisation of Chemicals (“REACh”) Directive. From July 2017 all products that are sold into Europe will comply with the RoHS regulations.
As part of the UK Companies Act 2006 (Strategic Report and Directors’ reports) Regulations 2013, Oxford Instruments has a mandatory duty to report greenhouse gas emissions as tonnes of carbon dioxide equivalent (“tCO2e”). The Group’s measure of carbon emissions is tonnes of carbon dioxide equivalent per £million of revenue. This year the global carbon emissions figure is 18.17 tCO2e/£million revenue.

01: Strategic Report 02: Governance 03: Financial Statements 04: Company Information
Oxford Instruments plc Report and Financial Statements 2017 41
Air travel
Greenhouse gas (“GHG”) emissions Oxford Instruments is a global business with operations in many parts of the world. It has been monitoring energy use and carbon emissions since 2008. Emissions from 17 company sites are monitored and are reported as below. Some small sales offices where energy consumption is less than 0.01% of the Group’s total energy consumption are omitted. The amount of recorded hydro-fluorocarbons is below 5kg globally and has therefore not been included in the figures.
Intensity ratioThe Company’s declared intensity ratio for Greenhouse Gas Reporting is tonnes of CO2 equivalent per £million of revenue. With revenues for the year at £348.5 million and the total emissions of carbon dioxide equivalent of 6334 tonnes, this gives an intensity ratio as follows:
Emissions Emissions from purchased electricity, fuel for heating or process purposes (gas and oil) and fugitive emissions from process gases are reported in tonnes of carbon dioxide equivalent.
Purchased Fugitive electricity Secondary emissions Total Region (tCO2e) (tCO2e) (tCO2e) (tCO2e)
UK 3215 340 0 3555
North America 2109 136 0 2245
Europe 218 64 0 282
Asia 252 0 0 252
Total 5794 540 0 6334
Ian BarkshireChief Executive
13 June 2017
million km
Carbon emissions
Revenue
= 24.72 tCO2e
£million revenue
Plasma Technology staff go green with new electric car charging points and an electric bicycle for staff to try out.
2009
2010
2011
2012
2013
2014
2015
2016 14.4
16.9
20.14
21.9
23
15.5
21
8.2

42 Oxford Instruments plc Report and Financial Statements 2017
Board of Directors
Alan ThomsonNon‑Executive Chairman
Ian BarkshireChief Executive
Gavin HillGroup Finance Director
Mary WaldnerIndependent Non‑Executive Director
Committee membershipNomination, ChairmanRemuneration
Committee membershipNone
Committee membershipNone
Committee membershipAudit and Risk, Chairman Nomination Remuneration
Appointed to the BoardJune 2016
Appointed Chairman September 2016
Appointed to the BoardNovember 2015
Appointed Chief Executive May 2016
Appointed to the BoardMay 2016
Appointed to the BoardFebruary 2016
BackgroundHolds a Masters degree from University of Glasgow and is qualified as a Chartered Accountant with the Institute of Chartered Accountants of Scotland.
BackgroundHolds a BSc and DPhil in physics from the University of York and is a Member of the Institute of Physics. Ian has worked for Oxford Instruments since 1997 in a number of senior leadership roles including NanoCharacterisation Divisional Head, Group Technical Director and Chief Operating Officer.
BackgroundHolds a BA in economics and agricultural economics from University of Exeter. He is a Chartered Accountant, a Fellow of the Institute of Chartered Accountants and an Associate Member of the Association of Corporate Treasury.
BackgroundHolds a MA in physics from Oxford University and is a Fellow of the Chartered Institute of Management Accountants. She started her career at Coopers & Lybrand Management Consultancy Services and then went on to hold senior financial positions in a number of major businesses.
External appointmentsChairman: Bodycote PLCHays PLC
Previous experienceChairman:Polypipe Group plc
Senior Independent Director:Johnson Matthey plc
Non‑Executive Director:Laporte plc
Chief Financial Officer:Smiths Group plc
Previous experienceSenior Principal Scientist:GEC Marconi Materials Technology
Research Fellow:University of York
Previous experienceGroup Finance Director:Synergy Health plc
Director, Corporate Finance:Serco Group plc
Senior finance positions:Syngenta AG and AstraZeneca plc
External appointmentsChief Financial Officer:Lloyd’s Register
Previous experienceGroup Finance Director,Ultra Electronics plc
Director, Group Finance:QinetiQ Limited

01: Strategic Report 02: Governance 03: Financial Statements 04: Company Information
43Oxford Instruments plc Report and Financial Statements 2017
Thomas GeitnerIndependent Non‑Executive Director
Professor Sir Richard FriendIndependent Non‑Executive Director
Stephen BlairIndependent Non‑Executive Director and Senior Independent Non‑Executive Director
Appointed to the BoardJanuary 2013
Appointed to the BoardSeptember 2014
To be appointed to the BoardJuly 2017
BackgroundA graduate of the Technische Universität München and holds an INSEAD MBA. Extensive international experience in the technology and engineering sectors, having spent over 30 years in businesses operating across the globe.
BackgroundRichard’s research encompasses the physics, materials science and engineering of semiconductor devices made with carbon‑based semiconductors. He is a Fellow of the Royal Society and of the Royal Academy of Engineering and a Foreign Member of the US National Academy of Engineering.
BackgroundHolds an Engineering degree from University of Sheffield. Extensive experience in established and high growth emerging markets, strategic planning and portfolio development.
External appointmentsChairman:Bibliotheca RFID Library Systems AG Switzerland
Non‑Executive Director:Supervisory Board of Haniel & Cie GmbH Duisburg
Previous experienceExecutive Director:Vodafone Group PlcHenkel AG & Co. KGaARWE AGNon‑Executive Director:BBC Worldwide LimitedConstantia Flexibles GmbH
External appointmentsCavendish Professor of Physics and a Fellow of St. John’s College at the University of Cambridge.Council member:The Engineering and Physical Sciences Research Council.
Non‑Executive Director:Eight19 LtdHeliochrome Limited
Previous experienceChief Executive: e2v
Business Group Director: Spectris plc
Committee membershipAudit and RiskNomination Remuneration, Chairman
Committee membershipAudit and RiskNominationRemuneration
Committee membership(from July 2017)Audit and RiskNominationRemuneration
Susan Johnson-BrettCompany Secretary
Committee membershipSecretary:Audit and RiskNomination Remuneration
BackgroundHolds a BA from the University of Keele and has previously worked in the Secretariats of St. Modwen Properties plc, Hydro Agri (UK) Limited and TSB Group plc.

44 Oxford Instruments plc Report and Financial Statements 2017
Corporate Governance
The Board is committed to conducting business responsibly and maintaining high standards of corporate governance.
Dear ShareholdersI am pleased to introduce the Group’s corporate governance report on behalf of the Board. The corporate governance statement provides an insight into how the Board operated during the year. The Board is committed to conducting business responsibly and maintaining high standards of corporate governance. This will, when underpinned by our business strategy, enhance performance and grow the business of Oxford Instruments. The approach to governance is set by the Board and the Management Board ensures that the approach is effectively implemented across Oxford Instruments’ businesses around the world.
The main Group‑wide governance documents are the Oxford Instruments Code of Business Conduct and Ethics together with the policies which sit within our statement on Corporate and Social Responsibility. These can be found on our website at www.oxford-instruments.com/investors/corporate-and-social-responsibility
These policies and statements set out the values and standards that we expect our employees to meet. These documents, together with our policies, govern how we conduct our business and set the standards that drive performance. Compliance training and, in some areas, standard procedures, help to enforce this. Board oversight, reviews and audits form part of the monitoring and supervision process. Risk processes are embedded and reviewed on an ongoing basis across the organisation.
The last few years’ succession planning for both Executive and Non‑Executive Directors has seen considerable change in the constitution of our Board over the past year. We have welcomed a new executive team with Ian Barkshire, Chief Executive, and Gavin Hill, Group Finance Director. I was brought in to succeed Nigel Keen as Chairman in September 2016. At our AGM in September, we also said goodbye to two of our Non‑Executive Directors, Jock Lennox and Jennifer Allerton.
During the latter half of the year, we started a search for a Non‑Executive Director with skills to complement those already on the Board. On 13 June 2017 we announced that Stephen Blair, until recently Chief Executive of e2v, will be joining the Board. Our Board is now in good shape to guide Oxford Instruments through its next phase of development.
I encourage all Shareholders to attend the AGM which will be held at the Company’s Head Office in Tubney Woods, Oxfordshire, on Tuesday 12 September 2017. This event provides an opportunity for Shareholders to meet the Executive and Non‑Executive Directors.
Alan ThomsonNon‑Executive Chairman
13 June 2017
Alan ThomsonNon‑Executive Chairman

01: Strategic Report 02: Governance 03: Financial Statements 04: Company Information
45Oxford Instruments plc Report and Financial Statements 2017
ComplianceThe Board endorses the main and supporting principles and the provisions set out in the 2014 UK Corporate Governance Code (“the Governance Code”) and considers that, throughout the period under review, the Group has complied with the provisions recommended in the Governance Code save for provision A.4.1. The Board did not designate a Non‑Executive Director as Senior Independent Director after Jock Lennox stood down from the Board after the AGM on 13 September 2016. Instead, the Chairman, Alan Thomson, who was appointed on 12 September 2016, undertook a review of the Board and commenced a search for a new Non‑Executive Director. This has culminated with the appointment of Stephen Blair to the Board on 1 July 2017 as an Independent Non‑Executive Director and he has been designated as Senior Independent Director. The 2016 UK Corporate Governance Code was issued in April 2016 and applies to accounting periods beginning after 16 June 2016.
Taken together with the reports of the Nomination Committee, Audit and Risk Committee, the report on remuneration and the report on corporate responsibility, this Statement explains how Oxford Instruments has applied the principles of good corporate governance as set out in the Governance Code.
Resolutions for the election of all Directors will be put to Shareholders at the Company’s forthcoming AGM. Once passed, this will continue to deliver a Board which meets the requirements of Provision B.1.2 of the Governance Code.
Preservation of valueThe basis on which the Group generates and preserves value over the longer term and the strategy for delivering the objectives of the Group are to be found in the Strategic Report.
Board of Directors and management structureBoard of DirectorsThe Board as at the date of this Report comprises the Chairman, three Non‑Executive Directors (rising to four with effect from 1 July 2017) and two Executive Directors. The Directors’ biographies and details of length of service are shown on pages 42 and 43. All the Directors have written letters of appointment that have been approved by the Board and which are available for inspection at the Company’s Annual General Meeting.
The Chairman is responsible for leadership of the Board and ensuring its effectiveness on all aspects of its role. The division of responsibilities between the role of Chairman and the Chief Executive has been set out in writing and agreed by the Board.
The Board is responsible to Shareholders for good corporate governance, setting the Group’s strategic objectives, values and standards, and ensuring the necessary resources are in place to achieve the objectives.
The Board has delegated Group responsibility for the management of health, safety and the environment to Ian Barkshire and he reports to the Board on these matters at each meeting.
Board members’ length of service
Thomas Geitner 4 years
Richard Friend 3 years
Ian Barkshire 1 year
Mary Waldner 1 year
Gavin Hill 1 year
Alan Thomson 1 year
Management BoardThe Board delegates management of the business to the Chief Executive. To assist in this, the Chief Executive has created a Management Board that consists of the Executive Directors, senior managers with Group‑wide functional responsibilities and the heads of the principal businesses of the Group’s activities.
The Management Board meets monthly either physically or by video or telephone conference and focuses on Group‑wide performance, strategy and risk management.
Operation of the BoardThe Board is responsible to Shareholders for delivering sustainable incremental Shareholder value through entrepreneurial leadership within a framework of controls for managing risk. The Board sets the Group’s strategy, maintains the policy and decision making framework in which this strategy is implemented, verifies that the necessary financial and human resources are in place to meet strategic aims, monitors performance against key financial and non‑financial indicators, oversees the system of risk management and sets values and standards in governance matters.
The details of the way the Board operates, including a schedule of matters reserved to the Board for decision, are set out in the Board Reference File. The Board’s policies and procedures are documented in the Board Reference File, which sets out the roles and delegated authorities applying to the Directors, the Board and the Board Committees. The Board Reference File is reviewed annually by the Board as part of the annual governance review undertaken by the Chairman.
The Board retains control over strategy, investments and capital expenditure, and limits the decisions which can be taken by management in the areas of strategic and financial management and shareholder reporting. The Board also decides on the Group’s capital structure, corporate actions, mergers and acquisitions, major contracts and other commitments, litigation and regulatory proceedings, remuneration and share incentive plans.
Where the Board delegates authority to management it is on a structured basis, which requires that proper management oversight exists at the appropriate level.
The Board meets on a regular basis, at least seven times a year, and otherwise as required. Board meetings are held at a number of Group locations during the year. The Board also held one meeting specifically to discuss the Company’s strategic direction during the year.

46 Oxford Instruments plc Report and Financial Statements 2017
Corporate Governance continued
Board meetings involve reviews of financial and business performance against the plan approved by the Board. Risk management review, both at Group level and also for each of the business units, is embedded in the reporting system. On a rotating basis, the Board receives presentations from the business units and key functional areas enabling it to explore specific issues in more detail. Any matter requiring a decision by the Board will be supported by a pre‑circulated paper analysing all relevant aspects of the proposal and recommending a course of action.
Board papers are distributed in advance of the relevant meeting in sufficient time to allow the Directors to prepare for meetings. Minutes of Committee meetings are circulated to the relevant Directors. In the very few instances when a Director has not been able to attend Board or Committee meetings, his/her comments on the papers to be considered at the meeting are communicated in advance to the relevant Chairman.
The Non‑Executive Directors meet without the Executive Directors at least annually, with the Chairman leading these meetings. The Non‑Executive Directors also meet annually without the Chairman in attendance. The Senior Independent Director chairs these meetings. During the year, whilst a new Senior Independent Director was being recruited, Richard Friend chaired this meeting.
The Company Secretary and the Company Secretary’s office are responsible for implementing Board procedures and for advising the Board on corporate governance matters.
Board balance and independenceThe Governance Code requires the Board should be of sufficient size that the balance of skills and experience is appropriate for the requirements of the business and that there is a balance of Executive and Non‑Executive Directors such that no individual or small group of individuals can dominate the Board’s decision making. The composition of the Board and the combination of diverse backgrounds and expertise of the Non‑Executive Directors meet these principles.
Alan Thomson, Chairman, was appointed to the Board as an Independent Non‑Executive Director on 1 June 2016 and appointed Chairman on 13 September 2016. He has a Masters degree from Glasgow University and is a Member and past President of the Institute of Chartered Accountants of Scotland. He is Chairman of Hays pc and Bodycote plc. On 30 March 2017 Bodycote announced that Alan will be retiring from his role of Chairman but that he will stay on until a successor is found. Previously, he was Chairman of Polypipe Group plc and a Non‑Executive Director of Laporte Plc, Alstom SA and of Johnson Matthey Plc. Earlier in his career, he worked on a variety of audits for Arthur Andersen and Price Waterhouse, followed by senior management positions with Rockwell International plc, Raychem Ltd and Courtaulds plc and was Group Finance Director of Rugby Group plc and then Smiths Group plc.
Alan is Chairman of the Nomination Committee and a member of the Remuneration Committee.
Richard Friend was appointed to the Board as an Independent Non‑Executive Director on 1 September 2014. Richard is a Fellow of the Royal Society and Fellow of the Royal Academy of Engineering. He is also Cavendish Professor of Physics and a Fellow of St. John’s College at the University of Cambridge.
His research encompasses the physics, materials science and engineering of semiconductor devices made with carbon‑based semiconductors. His research advances have shown that these materials have significant applications in LEDs, solar cells, lasers and electronics. He was knighted for services to physics in the Queen’s Birthday Honours List in 2003. He has also been directly involved in the commercialisation of technology through several spin‑out companies from the University of Cambridge.
Richard is a member of the Audit and Risk, Remuneration and Nomination Committees.
Thomas Geitner was appointed to the Board as an Independent Non‑Executive Director on 15 January 2013. He is a graduate of the Technische Universität München and holds an INSEAD MBA.
Thomas has extensive international experience in the technology and engineering sectors, having spent more than 30 years in businesses operating across the globe. Having worked in a number of global companies he understands the importance of remuneration connecting with strategy to appropriately incentivise the executive team.
The Board believes that his skills, experience and knowledge make Thomas well suited to chair the Remuneration Committee. Thomas is also a member of the Audit and Risk and Nomination Committees.
Mary Waldner was appointed to the Board as an Independent Non‑Executive Director on 4 February 2016. She is now Chief Financial Officer at Lloyd’s Register and was Group Finance Director of Ultra Electronics plc until April 2016. She has a masters degree in physics from Oxford University and is a Fellow of the Chartered Institute of Management Accountants.
Mary has a broad range of experience in high technology companies that operate internationally and has worked in a number of senior financial roles with major public limited companies, including Group Finance Director of Ultra Electronics plc until April 2016.
The Board believes that Mary’s background gives her the various insights needed to make her a well qualified Chairman of the Audit and Risk Committee. Mary is also Chairman of the Audit and Risk Committee and a member of the Remuneration and Nomination Committees.
Following the year end and date of this report, it has been announced that Stephen Blair will be joining the Board as an Independent Non‑Executive Director, with effect from 1 July 2017. He will also be designated as Senior Independent Director from the same date.
Stephen was Chief Executive of Teledyne e2v Limited (previously e2v technologies plc), a manufacturer of sensors, radio frequency generators and semiconductors and a listed company until its recent acquisition by Teledyne Technologies in March 2017. Previously he was Business Group Director for Spectris plc. He has broad operational experience and a breadth of experience covering established and high growth emerging markets, strategic planning and portfolio development.

01: Strategic Report 02: Governance 03: Financial Statements 04: Company Information
47Oxford Instruments plc Report and Financial Statements 2017
Independence of Non-Executive DirectorsIn the opinion of the Board, Alan Thomson, Mary Waldner, Thomas Geitner and Richard Friend are independent. Stephen Blair was considered independent on appointment.
The Board considers that they are each independent in character and judgement and do not have relationships which are likely to affect their judgement. This opinion is based on current participation and performance on both the Board and Board Committees including consideration of the length of service at Oxford Instruments plc and for Stephen Blair was demonstrated through the recruitment process.
Term of appointment of Non‑Executive DirectorsEach Non‑Executive Director was appointed for an initial term of three years. In line with provision B.7.1 of the Governance Code, the Board has determined that all Directors of the Board are to be subject to annual re‑election by Shareholders and accordingly the appropriate resolutions will be put to Shareholders at the Company’s forthcoming AGM.
Composition of the BoardIndependent vs. non‑independent
Independent (3)
Non-independent (2) 60%1
1. As at the date of this report and in line with the Governance Code, the Chairman is excluded from these numbers.
Board development and evaluationBoard developmentOn appointment, Directors undertake an induction process which is designed to develop knowledge and understanding of the Group’s businesses through visits to various Group operating sites, discussion of relevant technology, as well as product demonstrations, briefings from management and familiarisation with investor perceptions of the Group. This induction is supported by briefing papers prepared by the Company Secretary.
The operating business units’ senior management teams and functional leaders present to the Board on a regular basis. Non‑Executive Directors are encouraged to meet individual members of the senior management team and have done so during the year under review.
Throughout the year, Non‑Executive Directors attend Oxford Instruments’ events, exhibitions and award presentations.
The Company Secretary and her office act as advisers to the Board on matters concerning governance and ensure compliance with Board procedures. All Directors have access to this advice and a procedure also exists for Directors to take independent professional advice at the Group’s expense. No such advice was sought during the year. The appointment and removal of the Company Secretary are matters for the Board as a whole.
Board evaluationIn light of the provisions of Section B.6.2 of the Governance Code which expects that an externally facilitated evaluation of the Board be carried out at least triennially, in 2014/15 Colin Mayer, the Peter Moores Professor of Management Studies at Said Business School, University of Oxford, and a Board Member of the European Corporate Governance Institute, carried out a thorough review of the way the Board operates. Professor Mayer determined that Oxford Instruments is well governed, well run and a successful company which comfortably fulfils the requirements of the Governance Code in terms of the structure and conduct of its governance. He considered the formal governance and procedures in Oxford Instruments are significantly better than in most companies of a similar size. Professor Mayer suggested a number of areas in which the Company’s governance could be strengthened with a view to promoting its development from a successful medium sized firm to a truly global company of international significance.
This year, the Board carried out its annual effectiveness evaluation exercise, including a specific review of the effectiveness of its principal Committees and members. This was an internal exercise under the control of the Chairman using a detailed questionnaire completed by all Directors in relation to the key areas of Board accountability and the arrangements in place to enable effective focus on these areas. Topics covered included Group strategy, performance, delegation and accountability, success, development and reward, Board and Committee composition, Board induction and training, internal control and risk management. At the individual one‑to‑one interviews which the Chairman holds with each Director, individual performance and the operation of the Board and its Committees have been discussed in more detail. The Chief Executive is also involved in the process by giving his input on the way the Board helps him in his role. Each Committee Chairman also reviewed the effectiveness of his/her committee in a similar way. The output from these evaluations allows the Chairman to review objectively the overall balance and effectiveness of the Board. The Non‑Executive Directors met during the year, chaired by Richard Friend, and appraised the Chairman’s performance.
The Board evaluation covered the activities of the Board and each of its Committees. The Board and its Committees are considered to be working well. Arising from the exercise it was concluded that the Board is working well together and providing good challenge and support to the Executive. The overall conclusion is that the Board and its Committees are performing well and have good governance standards.

48 Oxford Instruments plc Report and Financial Statements 2017
Corporate Governance continued
Attendance at meetingsNo one other than the Committee Chairman and members is entitled to be present at a meeting of the Audit and Risk, Nomination or Remuneration Committees, but others may attend by invitation of the Committee. No Director votes on matters where he or she has a conflict of interest. Further details of the individual Committees’ activities are described below and in the Committee reports.
The following table sets out the frequency of, and attendance at, Board and principal Board Committee meetings for the year to 31 March 2017:
Audit and Risk Remuneration Nomination Board Main Committee Committee Committee
Number of meetings held 10 5 6 4
Alan Thomson2 7 51 5 4
Ian Barkshire 10 5¹ 41 21
Gavin Hill3 7 5¹ — 11
Richard Friend 10 5 6 4
Thomas Geitner 10 5 6 4
Mary Waldner 10 5 6 4
Nigel Keen4 6 31 3 2
Jonathan Flint4 5 2¹ 1¹ —
Jock Lennox4 6 3 3 2
Jennifer Allerton4 6 2 3 21. Attended by invitation.
2. Alan Thomson was appointed to the Board on 1 June 2016. He has attended all Board and Committee meetings since his appointment.
3. Gavin Hill was appointed to the Board on 9 May 2016. He has attended all Board meetings since the date of his appointment.
4. Nigel Keen, Jock Lennox and Jennifer Allerton resigned from the Board with effect from 13 September 2016 and Jonathan Flint resigned from the Board with effect from 31 July 2016. Other than Jennifer Allerton, they attended all meetings until they stepped down from the Board. Jennifer Allerton missed one Audit and Risk Committee meeting.
Board committeesThe Board has formed the following Committees: Audit and Risk, Nomination, Remuneration and Administration.
Membership of Board Committees, which is set out on pages 42 and 43, is determined by the Board and is reviewed regularly. The written terms of reference of the Board Committees are reviewed annually by each Committee and the Board and are available on the Company’s website at www.oxford-instruments.com/investors and from the Company on request. They will be on display at the Annual General Meeting.
Detail on the operation of each of the Audit and Risk, Remuneration and Nomination Committees is to be found within the relevant Committees’ reports.
Nomination CommitteeThe Nomination Committee comprises all the Non‑Executive Directors, under the chairmanship of the Chairman of the Board. The Nomination Committee is responsible for assisting the Board in the formal selection and appointment of Directors and considers succession planning for the Board. The Nomination Committee reviews succession plans annually.
Remuneration CommitteeThe Remuneration Committee comprises all the Independent Non‑Executive Directors and the Chairman of the Board. Thomas Geitner is the Chairman of the Committee. The Board considers that Thomas, with his experience of working at senior levels in global companies, including high technology companies, has an appropriate blend of skills to make a successful Chairman of the Remuneration Committee. The members of the Committee are appointed by the Board.
The Remuneration Committee is responsible for recommending to the Board the remuneration packages for Executive Directors and the bonus and share option strategy for the Group’s executive management.
Independent professional advice is sought when considered necessary. The Chairman and the Executive Directors are responsible for fixing the remuneration of the Non‑Executive Directors and the Remuneration Committee is responsible for fixing the remuneration of the Chairman. No Director is involved in the process that sets his/her own remuneration.
The Chief Executive is invited to attend all or part of Remuneration Committee meetings as deemed appropriate, for example when consideration is being given to the performance of other Executive Directors and on significant Group‑wide changes in salary structure and terms and conditions affecting other employees at senior executive level.
Audit and Risk CommitteeThe Audit and Risk Committee comprises all the Independent Non‑Executive Directors and its Chairman is Mary Waldner. Mary took over from Jock Lennox as Chairman of the Committee on 16 June 2016. Other members of the Board, senior management and the external auditor are invited to attend all or part of any meetings. The Board has determined that Mary, with her background in financial management, will be the designated financial expert from 16 June 2016 and that Jock Lennox, as a Chartered Accountant and former Senior Audit Partner at EY, was the designated financial expert until 16 June 2016.
The Audit and Risk Committee’s main responsibilities are focused on financial reporting, external audit, internal audit, internal controls and risk management.
Full details of the operation and the work of the Audit and Risk Committee are included in the Audit and Risk Committee Report set out on pages 51 to 57.
Administration CommitteeThe Administration Committee consists of a minimum of two Directors and deals with items of a routine and administrative nature. At each of its meetings, the Board receives a summary outlining all matters decided by the Administration Committee since the previous Board Meeting.

01: Strategic Report 02: Governance 03: Financial Statements 04: Company Information
49Oxford Instruments plc Report and Financial Statements 2017
Annual General Meeting (“AGM”)The AGM is an opportunity for the Board to meet Shareholders. At its AGM, the Group complies with the provisions of the Governance Code relating to the disclosure of proxy votes, the separation of resolutions and the attendance of Committee Chairmen. The Group arranges for the Annual Reports and Financial Statements and related papers to be posted on its website and, where Shareholders have elected to receive paper copies, posted to Shareholders so as to allow at least 20 working days for consideration prior to the AGM. The next AGM will be held on 12 September 2017 at the Group’s offices in Tubney Woods, Oxfordshire.
Investor relationsThe Group places considerable importance on regular communications with its Shareholders, with whom it has an ongoing programme of dialogue. All Shareholders are encouraged to participate in the AGM at which the Chairman and Chief Executive present an overview of the Group’s business, review the results and make comments on strategy and current business activity.
The Non‑Executive Directors meet informally with Shareholders both before and after the AGM and respond to Shareholder queries and requests. The Chairman and the Senior Independent Director make themselves available to meet Shareholders as required.
All Group announcements are posted on the Group website, www.oxford-instruments.com/investors, as soon as they are released. The Investor Relations section of the website provides financial and other information on the Group and the website itself carries additional information on the Group’s products, services and markets.
Risk managementWithin the Group there is an ongoing embedded process for identifying, evaluating and managing the significant risks faced by the Group. Day‑to‑day management of this process has been delegated by the Board to the Executive Directors. Detail of the process is set out in the Audit and Risk Committee Report on pages 51 to 57. This process has been in place for the year under review and up to the date of approval of the Annual Report and Financial Statements. It is regularly reviewed by the Board of Directors and accords with the principles of the Governance Code.
The Board has carried out a robust assessment of the principal risks facing the Group, including those which threaten its business model, future performance, solvency and liquidity. Details of all major risks identified, and the mitigating actions in place, are reported to and reviewed by the Board and/or Audit and Risk Committee. The Principal Risks (pages 23 to 25) gives an overview of the major risks and uncertainties faced by the Group. A standard process is in place throughout the Group that requires the senior management of each business to identify significant business risks and to classify them both as to probability and potential impact. Once identified, mitigating action, where possible, is formulated and responsibility within the management team assigned. On a regular basis each business reviews and updates its risk summary which is then reported to the Chief Executive. If a material risk changes or arises, the Managing Director of the business reports this in writing to the Chief Executive at which time there is a discussion on the adequacy of the mitigating actions taken.
In addition, the Board and the Audit and Risk Committee consider risks to the Group’s strategic objectives which are not addressed within the Group’s businesses and develops appropriate actions to manage and mitigate these risks.
Internal audit and assuranceThe Group’s internal audit function has responsibility for independently assessing the adequacy and effectiveness of the management of significant risk areas and provides an oversight view of operational management’s front line and assurance activities. Further details of the internal audit activities are set out in the Audit and Risk Committee Report on pages 51 to 57.
Internal controlThe Board has accountability for reviewing and approving the adequacy and effectiveness of internal controls operated by the Group, including financial, operational and compliance controls and risk management. The management of each business is responsible for risk management and control within their business and, through the Management Board, implementing Board policies on risk and control.
The internal control framework includes central direction, oversight and risk management of the key activities within the Group. As part of this framework there is a financial planning process which includes a three year planning model and the preparation of an annual budget approved by the Board. The results of the business units are reported monthly and compared with the budget. Forecasts are also prepared monthly.
Control activities include policies and practices covering appropriate authorisation and approval of transactions, the application of financial reporting standards and reviews of significant judgements and financial performance. Financial, regulatory and operational controls, procedures and risk activities across the Group are reviewed by the Group’s assurance function.
The internal control framework has been designed to manage rather than eliminate material risks to the achievement of strategic and business objectives and can provide only reasonable, and not absolute, assurance against material misstatement or loss. Because of inherent limitations, internal controls over financial reporting may not prevent or detect all misstatements. There has been no material change to the Group’s internal control framework during the period covered by this Report and Financial Statements.
50 Oxford Instruments plc Report and Financial Statements 2017
Corporate Governance continued
Internal control continuedThe key components designed to provide effective internal control within the Group are as follows:
• there is a formal schedule of matters reserved to the Board for decision; other than these matters, the Board delegates to the Chief Executive and reviews the delegation of authorities throughout the management structure;
• the Group’s management structure is headed up by the Management Board. Its membership comprises the Executive Directors, senior managers with Group‑wide functional responsibilities and the heads of the principal businesses of the Group’s activities. Day‑to‑day responsibility for the management of the Group is delegated to the Management Board. The responsibility is based on the identification of separate businesses for each of the Group’s activities for which there are clearly defined lines of management responsibilities at all levels up to and including the Group Board and the Group’s accounting and reporting functions reflect this organisation;
• financial executives within Group businesses report to their own operational head but there is also a well established and acknowledged functional reporting relationship through to the Group Finance Director;
• the Board reviews strategic issues and options formally once a year during the annual strategic planning process and during the year as appropriate. In addition the Executive Directors maintain a three year planning model of the Group and its individual businesses;
• annual budgets are prepared for each of the Group’s businesses which include monthly figures for turnover, profit, capital expenditure, cash flow and borrowings. The budgets are reviewed through the Group management structure and result in a Group financial budget which is considered and approved by the Board;
• the businesses prepare monthly management accounts which compare the actual operating result with both the budget and the prior year. The businesses also prepare rolling reforecasts for orders, turnover, operating profit and cash. Both are reviewed by the Board at each of its scheduled meetings;
• the Board approves all acquisition and divestment proposals and there are established procedures for the planning, approval and monitoring of capital expenditure;
• for all major investments the performance of at least the first twelve months against the original proposal is reviewed by the Board;
• each Group site, except for representative sales offices, is required to submit a self‑assessment internal control questionnaire annually;
• internal audit is carried out through a system of regular reviews of the financial and non‑financial internal controls at each site and this is further reported on in the Audit and Risk Committee Report on pages 51 to 57. These reviews are coordinated by the Group Internal Audit and Risk Manager;
• the Board receives regular updates on pensions, corporate social responsibility, business ethics and health and safety and the Audit and Risk Committee regular updates on treasury, tax, insurance and litigation;
• authorisation limits are set at appropriate levels throughout the Group; compliance with these limits is monitored by the Group Finance Director and the Group Internal Audit and Risk Manager;
• all requests to quote for substantial fixed price contracts are reviewed by the Chief Executive and/or the Group Finance Director to assess both technical and financial risk and to fix an appropriate balance between risk and reward. However, no procedure can guarantee the avoidance of losses on fixed price contracts of a technical nature; and
• with respect to the UK pension scheme, the Group nominates half of the trustee directors of the corporate trustee to the pension scheme, involves as necessary its own independent actuary with whom actuarial assumptions are reviewed, agrees the investment policy with the trustee, works with the trustee on its investment sub‑committee to deal with day‑to‑day investment matters and to act as a co‑ordinator between the investment advisers, investment managers and the trustee, ensures there is an independent actuarial valuation every three years and agrees funding levels to provide adequate funding to meet the benefit payments of the members as they fall due.
Susan Johnson-BrettCompany Secretary
13 June 2017

01: Strategic Report 02: Governance 03: Financial Statements 04: Company Information
51Oxford Instruments plc Report and Financial Statements 2017
Audit and Risk Committee Report
I am pleased to present the Audit and Risk Committee report having taken over as Chairman of the Committee in June 2016.
Mary WaldnerAudit and Risk Committee Chairman
Dear Shareholder, As part of my handover from my predecessor, Jock Lennox, we discussed key areas of historical importance and potential areas of risk which may require scrutiny in the future. I would like to take the opportunity to thank Jock for his assistance in this transition in particular and also, more broadly, for the work he performed during his tenure as Chairman of this Committee.
The role of the Audit and Risk Committee has remained broadly stable during the year, against a period of change in the Group’s leadership. The appointments of Ian Barkshire as CEO and Gavin Hill as Group Finance Director have brought a new executive team to the Board. Ian brings 20 years of experience within Oxford Instruments, most recently as the sector head of Nano Characterisation and Gavin comes with valuable external perspective, as the former Group Financial Director of Synergy Health plc. Further, in 2016/17 Alan Thomson was appointed as Chairman of the Board.
The Committee has the responsibility for assurance over financial controls as well as over other functions of key importance to the Group such as New Product Innovation, Information Technology and Security, Health Safety and Environment and HR. The Committee is also responsible for reviewing the effectiveness of internal audit, oversees the relationship with the external auditor (including the Group’s policy on the
provision of non‑audit services) and monitors the integrity of the Financial Statements, including the application of significant financial judgements.
During the year the Committee continued to evolve its focus to reflect the risk environment. The Audit and Risk Committee and the new Group Finance Director agreed to focus the internal audit function on the fundamentals of the financial control environment, in order to gain assurance over the effective operation of key financial controls. In addition, the audit programme has maintained a risk based element and has also delivered ad hoc work, to address specific risks, mandated by the Group Finance Director. This approach will continue in 2017/18.
Key areas of activity for the Audit and Risk Committee in the last twelve months have included:
• a review of the Group Risk Register at each meeting of the Committee;
• a detailed review of specific subjects on the Group Risk Register (e.g. IT and cyber security) and of certain business units’ principal risks;
• a review of treasury and tax matters;
• a half‑yearly review of significant litigation;
• a review of the Group’s Viability Statement including the methodology used in the forecasts and key assumptions on which it is based;
• a review of the key financial risks such as adverse movements in foreign exchange and the pension deficit, together with key mitigating strategies (e.g. hedging policy);
• a review of the effectiveness of internal audit;
• an assessment of the effectiveness of the external audit process;
• a review of the statement issued at the Annual General Meeting; and
• a bi‑annual review of the Financial Statements and the significant accounting judgements used in their compilation. (The significant accounting judgements relating to the 2017 Financial Statements are set out on page 54.)
The rest of this report sets out the composition of the Audit and Risk Committee; summarises its role and responsibilities; provides a summary of key activities it has undertaken over the course of the year and the Committee’s view of significant matters related to the Financial Statements. It also explains how the Committee has fulfilled its responsibilities in each area of its remit.
I will be at the AGM in September. In the meantime, if you have any questions or comments I should be delighted to hear from you.
Mary WaldnerAudit and Risk Committee Chairman
13 June 2017

52 Oxford Instruments plc Report and Financial Statements 2017
Audit and Risk Committee Report continued
Composition The members of the Audit and Risk Committee are Mary Waldner, Sir Richard Friend and Thomas Geitner. Mary was appointed as Chairman on 16 June 2016. Jock Lennox and Jennifer Allerton retired from the Committee in September 2016 when they stepped down from the Board.
In keeping with the FRC’s Guidance on Audit Committees, the Audit and Risk Committee’s terms of reference require that at least one member of the Committee has recent and relevant financial experience. Mary Waldner is the current Chief Financial Officer of Lloyd’s Register and has previously held senior financial roles at a number of quoted companies including, most recently, Ultra Electronics plc. On this basis, the Board considers that Mary fulfils the requirement to have recent and relevant financial experience and is also independent. Both Professor Sir Richard Friend and Thomas Geitner bring relevant sector experience to the Committee.
The Committee invites participation from non‑members at its meetings as required. This may include auditors (external and internal); members of the Board; and subject matter experts (e.g. the Chief Information Officer). The Committee has the opportunity to speak with the external auditor without the presence of the executive management at each meeting attended by the external auditor. The Company Secretary acts as secretary to the Committee.
Role and responsibilitiesThe Committee’s key duties are summarised below and are detailed in full in the terms of reference, a copy of which can be found on our website at www.oxford-instruments.com/investors. The main responsibilities of the Committee are focused on the following areas:
Financial reporting • Reviewing and challenging significant
financial reporting judgements and accounting policies and compliance with accounting standards.
• Monitoring the integrity of the Financial Statements and associated announcements.
• Advising the Board on whether the Annual Report and Financial Statements, taken as a whole, are fair, balanced and understandable and whether all material matters such as contingent liabilities have been considered in their preparation.
• Monitoring compliance with relevant statutory and listing requirements.
External audit• Oversight of the external audit relationship.
• Holding regular meetings with the external auditor, including meetings without executive directors, including meetings for audit planning and reporting.
• Reviewing and approving the annual audit plan and audit findings
• Responsible for evaluating the effectiveness of the external audit process and assessing the external auditor’s independence and objectivity.
• Providing recommendations to the Board for the appointment or re‑appointment of the external auditor.
• Reviewing and monitoring the non‑audit services policy and the level of non‑audit services provided.
Effectiveness of the internal control environment• The Audit and Risk Committee considered
information from a number of sources to evaluate the effectiveness of the internal control environment. This included, inter alia, reports from both internal and external audit. Further, on the basis of those reports, the Committee assessed whether internal audit activities were appropriately directed to provide the required level of assurance. The Committee concluded that the cyclical programme of internal financial audits provided an effective mechanism to assess internal controls and, based on the reports received, controls were generally found to be operating effectively.
• Following discussions with the CEO and the Group Finance Director, it was agreed that the delegation of authorities would be updated in order to implement a number of changes arising from the revised risk appetite of the Board and to ensure that revised limits were effectively communicated throughout the Group. The revised delegation of authorities was finalised and distributed in September 2016. Specific tests of adherence are included in the internal audit programme for 2017/18.
Internal audit and risk management• Annual consideration of the resources
required for an effective internal audit and risk management function.
• Approval of internal audit’s annual audit programme.
• Reviewing the Group’s internal control and risk management systems.
• Regular review of the Group’s key risks (both inherent risks and emerging risks) and associated monitoring process, together with a regular review of the output from the Group’s risk management processes.
Business malpractice • Reviewing the adequacy and security of
the Group’s whistle‑blowing arrangements and the provision of proportionate and independent investigation of any matters raised through those channels.
• Reviewing the Group’s procedures for detecting fraud and its processes and controls to prevent bribery.
Reporting • Compilation of a report on its activities,
in accordance with the UK Corporate Governance Code.
• Reporting to the Board on any matter it considers requires action or improvement.
• Advising the Board on Directors’ responsibilities relating to the Financial Statements.
The Committee periodically reviews its terms of reference and its effectiveness and recommends to the Board any changes required as a result of such review.

01: Strategic Report 02: Governance 03: Financial Statements 04: Company Information
53Oxford Instruments plc Report and Financial Statements 2017
Activities of the Audit and Risk Committee in respect of the financial year ended 31 March 2017The Committee has worked largely to a recurring and structured programme of activities developed from its terms of reference and designed to fulfil its responsibilities throughout the financial year. A summary of the items discussed in each meeting is set out in the table below:
June July September November January June Agenda item 2016 2016 2016 2016 2017 2017
Review the integrity of the draft Financial Statements, appropriateness of accounting policies and going concern assumption (reports received from management and KPMG) • •
Review and recommend for approval the half‑year and year‑end announcements, interim management and AGM statements and the Report and Financial Statements • • •
Review of significant financial reporting issues and judgements • • •
Review viability statement requirements and reporting proposal • •
Assess the effectiveness of the external audit process •
Consider the independence and objectivity of the external auditor •
Review internal management representation letters
Review and agree the internal audit plan •
Review the output of the internal audit work • • • •
Review the effectiveness of the Audit and Risk Committee •
Update on changes to accounting standards (taking effect in 2017/18) •
Consideration of paper outlining key IT risks and mitigating actions • •
Review of litigation update • •
Evaluate the effectiveness of the internal audit function •
Review the internal control framework •
Review the risk management processes •
Review the Group Risk Register • • • • •
Annual review of the whistle‑blowing arrangements •
Review systems and controls for detecting fraud and the prevention of bribery and corruption •
Annual review of insurance •
Annual review and approval of policy relating to non‑audit services •
Annual review of treasury arrangements •
Annual review of tax •
The Committee’s remit extends beyond financial risk and considers assurance activities in relation to a number of key, non‑financial areas. These include New Product Innovation (“NPI”), a core area in the Group’s strategy for success, and key enabling functions such as HR (with a particular focus on succession management and potential challenges arising from Brexit) and IT. The Committee has renewed its focus on data/cyber security and breach response as its evaluation of external threats in this domain continues to rise. The Committee also receives reports on the operational audit programme and health and safety, and environmental performance and compliance. The Committee considers these areas provide proportionate coverage and assurance over the most significant areas of potential risk faced by the Group.
In accordance with the 2014 UK Corporate Governance Code, the Board requested that the Committee advise it on whether the Annual Report, taken as a whole, is fair, balanced and understandable and provides the information necessary for Shareholders to assess the Group’s position and performance, business model and strategy. This work formed part of the review of the draft Financial Statements that was undertaken in May and June 2017.

54 Oxford Instruments plc Report and Financial Statements 2017
Audit and Risk Committee Report continued
Significant matters related to the Financial StatementsThe Committee reviews all significant issues concerning the Financial Statements. The principal areas of significant accounting judgement considered in relation to the 2017 Financial Statements were:
Disposal of OST Wire and Industrial AnalysisFollowing its disposal in November 2016, the OST Wire business has been treated as a discontinued operation. As a result, the after‑tax profit of the OST Wire operation has been presented as a single line item at the foot of the Income Statement.
This treatment is considered to be correct because, inter alia, the OST Wire was a significant component of the Group; was disclosed as an operating segment to the Board; had its own management team; had a distinct customer base and business model; and was a separate calculation component within the model which creates the segmental analysis included within the Financial Statements.
With regard to the disposal of Industrial Analysis, the Committee takes the view that as at 31 March 2017, the transaction was not highly probable. At that time, a number of significant commercial issues relating to the disposal were outstanding; there was still a possibility of a material reduction in Hitachi’s offer (which may have made it unattractive to the Board); and the transaction had not been approved by the Board of either company.
Accordingly, the Industrial Analysis business has not been treated as a held for sale asset as at 31 March 2017 and its results are included within continuing operations for the year.
Carrying Value of Acquired Intangible Assets (including Capitalised Goodwill)Intangible assets total £181.0 million (Note 17) of which acquired intangible assets amount to £160.7 million. This comprises capitalised goodwill of £84.5 million and other intangible assets from acquisitions of £76.2 million. The most significant elements of acquired intangibles relate to Andor at £118.4 million (of which £61.4 million relates to goodwill). As set out in Note 17 to the Financial Statements, the carrying value of goodwill for each investment has been assessed for impairment.
Impairment charges were recognised in the year against the carrying value of goodwill in both the Asylum and OI Healthcare businesses amounting to £28.8 million with a further £5.0 million of impairments against other intangibles in these two business units. This arose from a detailed review of the future performance expected from these business units and as a result, management considered it was no longer appropriate to retain any goodwill balance against those acquisitions. The Committee has received detailed explanations and supporting information relating to both the impairment charges recognised and the current carrying value of intangible assets. The Committee is satisfied with the methodology used in assessing the position at 31 March 2017.
Valuation of investment in associate undertakingFollowing the disposal of the Omicron businesses in May 2015 to Scienta Scientific AB, the Group has held a 47% shareholding in the resultant business combination.
The Group has a minority shareholding and appoints two out of five directors to Scienta Scientific AB’s board. On this basis, the Committee is satisfied with management’s assessment that the Group does not control Scienta Scientific AB. Accordingly it has been treated in the Group Financial Statements as an investment in an associate.
The investment in Scienta Scientific AB is accounted for under the equity method of accounting and is assessed for impairment. As set out at Note 7 to the Financial Statements, management performed a review of the carrying value of this investment and determined that an impairment of £8.0 million was required to reduce the value of its equity investment to £3.8 million. The Audit and Risk Committee has reviewed a detailed paper on this impairment and is satisfied that it has been performed appropriately.
Provisions for product warranty and related mattersThe Group faces an inherent risk of potential claims in relation to product quality or intellectual property infringement. Management has presented its analysis of potential exposure to these risks and the Audit and Risk Committee has also discussed the level of provisions recognised in the Financial Statements with KPMG. Given the inherent uncertainty in such matters it is likely that the actual settlement cost arising from any potential claim would vary from the amounts provided. The methodology to estimate potential exposure in this area has been calculated in a manner consistent with the prior year.
UK defined benefit schemeIFRS requires the Group to value its pension deficit at the difference between the net present value of the scheme liabilities and the assets of the scheme as at the balance sheet date. The reported deficit has reduced by £9.5 million to £21.5 million as at 31 March 2017.
IFRS requires the Group to appoint an external actuary to give advice as to suitable assumptions and to calculate the value of the liabilities at the balance sheet date. The Group has appointed Aon Hewitt, the pension scheme‘s actuary, to perform bi‑annual valuations on its behalf for accounting purposes.
01: Strategic Report 02: Governance 03: Financial Statements 04: Company Information
55Oxford Instruments plc Report and Financial Statements 2017
AON Hewitt recommended suitable assumptions which were, except as noted below, in line with previous years. These recommendations were accepted by management and form the basis of the updated valuation.
The valuation of the scheme assets was provided by PSolve (the scheme’s investment manager) in accordance with market practice for valuing investment assets.
In calculating the deficit AON Hewitt used member data from the March 2015 triennial valuation prepared for the scheme’s Trustees.
In respect of the calculation of the discount rate, the actuary has refined the methodology so as to exclude debt issued by universities from the group of borrowers used to establish an AA rated bond yield. The Group considers this more accurately reflects the financing cost of companies which are similar to Oxford Instruments. This change was first adopted at the half year. This change in methodology has the impact of reducing the reported deficit by £6.5 million compared to the previous basis.
Further, the actuary used the latest mortality tables which give lower life expectancies than those used in the past. The impact of this revision was to reduce the reported deficit at 31 March 2017 by £5.6 million.
Tax provisionsThe Group has a number of tax positions where the outcome is uncertain and ultimately depends on the view taken by tax authorities, both in the UK and overseas. The net tax liability reported in the Financial Statements is effectively reduced as a result of tax efficient activities including claims for technology related tax reliefs, benefits from a tax efficient financing structure, and deferred tax assets (e.g. timing differences and carried forward losses). In preparing the provisions, judgement has been exercised by management with the aim of recording assets and liabilities at the fair value of the most likely outcome. The Committee is satisfied that judgement has been applied consistently with prior years.
Adjusted profit and EPSAs explained in Note 1 to the Financial Statements, the Group applies adjustments to the statutory definition of profit and EPS to present adjusted profitability and earnings as the Board believes they present a clearer picture of the financial performance of the Group. In the year ended 31 March 2017, adjustments before taxation totalled £61.5 million of which £48.7 million relate to the amortisation and impairment of acquired intangible assets. A further £8.0 million relates to the impairment charge against the investment in the Scienta Omicron joint venture and impairments against other intangible assets amounted to £2.9 million. Other adjustments arose from non‑recurring and acquisition and disposal related activities (together a charge of £3.1 million) and a mark‑to‑market gain of £1.2 million on derivative financial instruments. The Committee has received a detailed analysis from management to demonstrate that the Group’s definitions have been consistently applied. These items involve careful judgement and the Committee is satisfied that they have been rigorously considered by management and appropriately disclosed.
MisstatementsManagement reported to the Committee that they were not aware of any material misstatements or immaterial misstatements made intentionally to achieve a particular presentation. The auditor reported a schedule of unadjusted audit differences to the Committee. Following discussion with management and the auditor, the Committee were satisfied that the adjustments were not material to the Financial Statements and therefore remained unadjusted. The Committee concluded that it was satisfied that the auditor had fulfilled its responsibilities with diligence and professional scepticism.
After reviewing the presentations and reports from management, and after consulting, where necessary, with the external auditor the Committee was satisfied that the Financial Statements appropriately addressed the critical judgements and key estimates (both in respect to the amounts reported and the disclosures). The Committee was also satisfied that the significant assumptions used for determining the value of assets and liabilities, including the pension commitments of the Group, had been appropriately scrutinised and challenged.
External auditorThe Committee monitors the performance, objectivity and independence of the external auditor. It also recommends the appointment of the external auditor to the Board and is responsible for approval of its fees.
At the Audit and Risk Committee meeting in January 2017, KPMG, the external auditor, set out its plan for undertaking the external audit. KPMG’s audit planning memorandum set out its proposed audit methodology, scope and draft materiality for its audit of the Financial Statements for the year ended 31 March 2017. It was compiled following meetings with, inter alia, the Group Finance Director, Chairman of the Board and Chairman of the Audit and Risk Committee. Further, it covered KPMG’s assessment of key areas of audit risk and its planned approach for addressing them. After due consideration, the Committee approved KPMG’s audit strategy and planning memorandum.
The Committee assesses the effectiveness of the audit process through the reporting received from KPMG at the half year and year end and through feedback from key stakeholders at all levels across Oxford Instruments. Its assessment of the effectiveness of the process for the year ended 31 March 2017 will take place in July 2017.
KPMG was reappointed as auditor following a tender process in 2014. Under the rules for audit tendering and rotation implemented in June 2016, the Group shall be required to replace KPMG as auditor by no later than 31 March 2021. In the meantime, the Committee shall monitor the reappointment of KPMG on an annual basis and will arrange for a tender process when it considers it is appropriate to do so.

56 Oxford Instruments plc Report and Financial Statements 2017
Audit and Risk Committee Report continued
Auditor independence In its assessment of the independence of the auditor the Committee receives confirmation of any relationships between the Group and KPMG that may have a bearing on its independence and receives confirmation that it is independent of the Group.
To further safeguard the objectivity and independence of the external auditor and to mitigate the risk of the external auditor firm’s independence becoming compromised, the Committee has a formal policy governing the engagement of the external auditor to provide non‑audit services. In light of changes to the Corporate Governance Code that took effect in June 2016, all non‑audit related engagements over £50,000 require formal advance approval by the Committee. The details of the audit fees for the year, together with fees for non‑audit services, are set out in Note 4 (page 100) to the Financial Statements. In the year ended 31 March 2017, audit fees paid to KPMG were £421,000 and non‑audit fees were £142,000. This represents a non‑audit to audit fee ratio of 0.34:1.
Internal auditThe Audit and Risk Committee seeks assurance over the effective design and operation of internal controls from the internal audit function. This is delivered through the annual internal audit programme which includes a core focus on internal financial controls. These financial controls audits are performed at business units on a rotational basis and are complemented by a number of risk based audit topics which are typically performed across all operational business units. The internal audit methodology for financial audits was updated in the first half of 2016/17 and delivery of the updated programme commenced in the second half of the financial year.
In the course of the second half of 2016/17, the revised internal financial audit programme was delivered at three operational business units (NanoAnalysis, NanoScience and Plasma Technology) and at the German Federal Office. The internal audit plan for 2017/18 includes coverage of five further operational business units and two Federal Offices.
The current internal audit strategy is to focus on the fundamentals of financial controls and governance, to establish whether there is an effective control environment at a business unit level and to identify potential opportunities for improvement. In addition to the audits performed at business units, the audit programme will be delivered across the principal Federal Offices.
The internal audit plan for 2017/18 was approved by the Audit and Risk Committee in January 2017. It considered whether the scope of the plan was sufficient to address the key requirements of the audit strategy. Factors that were considered included the levels of risk, other assurance activities and findings from previous audits (both internal and external).
The Chairman of the Audit and Risk Committee and the Group Internal Audit and Risk Manager have regular meetings during the year. The latter has a direct reporting line to the Chairman of the Audit and Risk Committee and also meets regularly with the external auditor, independently from senior management, to discuss areas of potential risk and audit focus. All financial internal audit reports are provided to the Audit and Risk Committee and the external auditor on a timely basis once finalised, in addition to the relevant business unit/Federal Office and the Group Finance Director.
The Committee monitors the resources and scope of work of the Group internal audit function to ensure that its activities are directed to the most appropriate areas, taking into account the requirements of corporate governance and specific risks identified from the risk management process.
Internal control and risk managementThe maintenance of effective internal controls and risk management systems are critical to mitigating the risks faced by the Group. As both the Group and the external environment change, we are required to respond and consider whether existing mechanisms are sufficient to provide the assurance required. During the year, the Audit and Risk Committee has evaluated the effectiveness of internal audit and the mechanisms used for risk management. The Board has also considered its approach to risk, setting its risk appetite and the means used to cascade this throughout the Group. The Audit and Risk Committee maintains a critical role in its oversight of the risk agenda and the operation of internal controls.
The Group risk register is a key output of risk management activities. It consolidates and aggregates risks identified within the various business units and overlays those business unit risks with risks that materialise at a Group level (e.g. financing risks). The CEO and Group Finance Director hold a meeting with the Head of Internal Audit and Risk Management every quarter to review and update the Group Risk Register. Once complete, this document forms the basis for discussions on risk at Board level and is reviewed at each meeting of the Audit and Risk Committee. On occasions, the Board instructs a review/audit of key risks identified in the Group Risk Register to evaluate existing mechanisms for mitigating the risk and to identify areas for improvement.

01: Strategic Report 02: Governance 03: Financial Statements 04: Company Information
57Oxford Instruments plc Report and Financial Statements 2017
Following the result of the UK referendum in June 2016, the Board instructed the creation of a Brexit Committee to identify and report on key risks to the Group arising from Brexit. The Committee meets on a monthly basis and reports to the Management Board. A detailed list of Brexit‑related risks has been identified and reported. Where relevant, mitigating actions have been identified and are being monitored.
The Committee reviewed the system of internal financial control on behalf of the Board and satisfied itself that the Group is meeting the required standards both for the year ended 31 March 2017 and up to the date of approval of this Report and Financial Statements. No concerns were raised with the Committee in the year about possible improprieties in matters of financial reporting.
In coming to these conclusions, the Committee reviewed reports from internal audit and from the external auditor on internal control findings. It obtained reviews into the control environment and risk management process and considered the outputs from other assurance activities relating to operations, health and safety, NPI, human resources and IT.
Whistle-blowingThe Group’s Business Malpractice Policy comprises an internal process that has been communicated directly to all employees by which employees can raise a concern, including concerns relating to fraud, bribery and/or corruption, damage to the environment, criminal activity or danger to health and safety, in the knowledge that it will be taken seriously, treated as confidential and that no action will be taken against the employee raising the concern. Reporting channels include an independent third party provider that provides summary reports to the Group Compliance Team (comprising the Director of Legal Affairs and the Group Internal Audit and Risk Manager). There is also provision within the policy for employees to raise concerns directly with the Senior Independent Director. This policy is reviewed annually by the Committee. The Head of Internal Audit and Risk Management maintains a log of all matters reported through the confidential third‑party provider and their resolution. No serious matters were reported during the year ended 31 March 2017.
SummaryThe Committee has concluded that, as a result of its work during the year, it has acted in accordance with its terms of reference and fulfilled its responsibilities. I will be available at the AGM to answer any questions.
Mary WaldnerAudit and Risk Committee Chairman
13 June 2017

58 Oxford Instruments plc Report and Financial Statements 2017
Nomination Committee Report
The Committee supports the Board in operating a formal, rigorous and transparent process for the appointment of new Directors to the Board.
Alan ThomsonChairman of the Nomination Committee
Dear Shareholder,I am pleased to introduce the Nomination Committee report for 2016/17. The Committee’s key objective is to support the Board in fulfilling its responsibilities to ensure there is a formal, rigorous and transparent process for the appointment of new Directors to the Board and to ensure that effective succession planning processes are in place across the Group.
There have been a number of changes to the membership of the Board over the last 18 months, culminating with three Directors, including Nigel Keen, Chairman, and Jock Lennox, Senior Independent Director, stepping down at the AGM in September 2016. After my appointment as Chairman I undertook a review of the composition of the Board and determined with the Committee that the
Board would benefit from the appointment of a further Non‑Executive Director who could also potentially serve as Senior Independent Director. With the help of the Zygos Partnership, we have undertaken such a search and have met with a number of interested candidates. We are pleased to report that Stephen Blair has agreed to join our Board as a Non‑Executive Director and Senior Independent Director with effect from 1 July 2017.
The Committee will continue to focus on ensuring that the present and future composition of the Board is appropriate for the delivery of the Group’s strategy and that all relevant Governance Code requirements continue to be met.
Alan ThomsonChairman of the Nomination Committee
13 June 2017

01: Strategic Report 02: Governance 03: Financial Statements 04: Company Information
59Oxford Instruments plc Report and Financial Statements 2017
The Nomination Committee The Nomination Committee comprises all the Non‑Executive Directors, under the chairmanship of the Chairman of the Board.
• The Committee is responsible for assisting the Board in the formal selection and appointment of Directors. It considers potential candidates and recommends appointments of new Directors to the Board.
• The appointments are based on merit and against objective criteria including time available and the commitment that will be required of the potential Director.
• There is a formal, rigorous and transparent procedure for the appointment of new Non‑Executive Directors to the Board, the prime responsibility for which is delegated to the Nomination Committee. Each appointment process begins with an evaluation of the balance of skills, knowledge and experience existing on the Board that is effected through a series of meetings between the Committee Chairman and Directors.
• The Nomination Committee takes external advice when considered appropriate.
• The Committee also considers succession planning for the Board and the top level of senior management.
Principal activities of the Committee during the yearConstitution of the Board• Jennifer Allerton advised the Committee
that she was not putting herself forward for re‑election as a Non‑Executive Director at the 2016 AGM. As reported last year,
Jock Lennox and Nigel Keen stood down at the 2016 AGM and successors for Chairman of the Audit and Risk Chairman and Chairman to the Board had already been identified and are now in place.
• After the AGM, the Committee carried out a review of the constitution of the Board. With the changes to the Board in 2016, and taking into account the skills, knowledge and experience on the Board, it decided that a further Non‑Executive Director be appointed.
• The Committee evaluated the balance of skills, knowledge and experience on the Board and used the output of this evaluation to identify the skills it would like introduced to the Board. The Committee, with the help of executive search consultants, the Zygos Partnership, drew up a description of the role and desired capabilities for candidates and, taking into account both diversity within, and the balance of skills on, the Board, developed a shortlist of qualifying candidates.
• Candidates met with the Chairman and Chief Executive and the proposed candidate met several Directors individually.
• Following these meetings, the Nomination Committee considered each Director’s feedback and made a final recommendation to the Board of the appointment of an Independent Non‑Executive Director who also had the experience necessary to be an appropriately qualified Senior Independent Director.
• Following this process, it has been announced that Stephen Blair will be appointed to the Board as an Independent Non‑Executive Director with effect from 1 July 2017 and will be appointed Senior Independent Director from the same date.
All Directors of the Board are put forward for re‑appointment by Shareholders each year at the AGM and this includes those appointed during the year. The Committee, taking into account the performance and value that each Director brings to the Board, has considered whether each of the Non‑Executive and Executive Director appointments should be renewed for a further year and has confirmed that this is indeed the case and accordingly a resolution to reappoint each Director will be put to Shareholders at the Company’s forthcoming AGM.
Succession planning• The Group HR Director and the Chief
Executive presented the work that had been carried out within the business on succession planning, talent management, and leadership, including at Management Board and Executive Director level.
• The Chairman updated the Board’s succession plan for Non‑Executive Directors.
Other• The Nomination Committee also carried
out its annual review of the performance of the Chief Executive and it, excluding the Chairman, also reviewed the performance of the Chairman.
Attendance at meetings year ended 31 March 2017 Date of Nomination appointment Committee to Committee
Number of meetings held 4
Number of meetings attended:
Alan Thomson (Chairman from 13 September 2016) 4 1 June 2016
Richard Friend 4 1 September 2014
Thomas Geitner 4 15 January 2013
Mary Waldner 4 4 February 2016
Nigel Keen1 (Chairman to 12 September 2016) 2 25 February 1999
Jennifer Allerton1 2 11 June 2013
Jock Lennox1 2 1 April 2009
Number of meetings in attendance:
Ian Barkshire 2
Gavin Hill 1 1. Nigel Keen, Jennifer Allerton and Jock Lennox resigned from the Board on 13 September 2016. They each attended all meetings prior to that date.
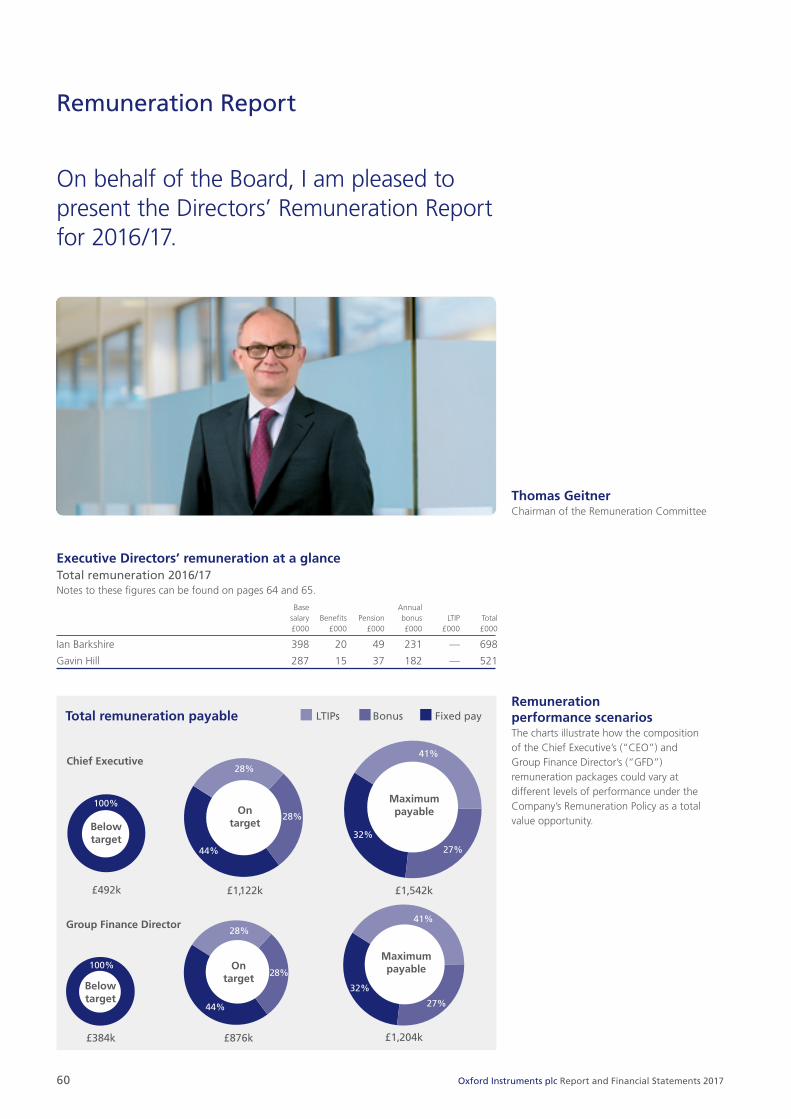
60 Oxford Instruments plc Report and Financial Statements 2017
Executive Directors’ remuneration at a glanceTotal remuneration 2016/17Notes to these figures can be found on pages 64 and 65.
Base Annual salary Benefits Pension bonus LTIP Total £000 £000 £000 £000 £000 £000
Ian Barkshire 398 20 49 231 — 698
Gavin Hill 287 15 37 182 — 521
Remuneration Report
On behalf of the Board, I am pleased to present the Directors’ Remuneration Report for 2016/17.
Thomas GeitnerChairman of the Remuneration Committee
Group Finance Director
Chief Executive
28%
28%
44%
On target
£876k
100%
£384k
Below target 27%
32%
41%
£1,204k
Maximumpayable
28%
28%
44%
On target
£1,122k
100%
£492k
Below target
27%
32%
41%
£1,542k
Maximumpayable
LTIPs Bonus Fixed payTotal remuneration payableRemuneration performance scenariosThe charts illustrate how the composition of the Chief Executive’s (“CEO”) and Group Finance Director’s (“GFD”) remuneration packages could vary at different levels of performance under the Company’s Remuneration Policy as a total value opportunity.
01: Strategic Report 02: Governance 03: Financial Statements 04: Company Information
61Oxford Instruments plc Report and Financial Statements 2017
Dear Shareholder,It has been another busy year for the Remuneration Committee. On top of the usual standing agenda items this year the Committee’s time has been spent reviewing the Directors’ remuneration policy in preparation for our 2017 AGM, which has coincided with the appointment of our new CEO and GFD and their review of the Group’s overall business strategy.
The former CEO and GFD left during 2016/17. Their remuneration arrangements on cessation were determined and disclosed in last year’s Remuneration Report. Salary, benefits and pension were paid to the date of cessation with no annual bonus for the period of employment during 2016/17 and all long‑term incentive awards lapsing on cessation.
Corporate performance and annual bonus payments for 2016/17The annual bonus for 2016/17 is determined by a combination of cash, sales and profit financial targets, and non‑financial strategic targets. As in previous years, the Committee set stretching performance targets which were clearly linked to the strategy and financial performance of the Group. Group performance has overall been in line with expectations with the organic sales and cash conversion targets being met and profit before tax just above threshold performance. In relation to the strategic targets set for a small part of the bonus, the Committee carefully reviewed performance against the objectives and scored the CEO at 95% and the GFD at 100%, noting the strong performance of our new Executive Directors in driving the strategic repositioning of the Group. Full details of the annual bonus outturn of 56.25% of maximum for the CEO and 57% of maximum for the GFD are set out in the Annual Report on Remuneration.
There were no long‑term incentive awards with performance periods ending during the year under review.
Review of Remuneration Policy Shareholders must approve our Directors’ Remuneration Policy at least every three years. Our current Policy was approved in 2014 and re‑approval is therefore required at our 2017 AGM.
The Remuneration Committee reviewed the current policy carefully in light of the evolving strategy and concluded that no fundamental changes are required to the current quantum and structure of pay. Accordingly, limited changes will be made as follows:
• greater flexibility to select performance conditions for the Performance Share Plan (“PSP”) which are best aligned to the business strategy, rather than as currently having specific measures (EPS and TSR) bound into the Policy;
• adding a two‑year holding period on vested PSP awards and increasing shareholding guidelines for Executive Directors from 100% to 150% of base salary, which will bring the policy into line with current investor expectations;
• a harder PSP award limit so that, other than in truly exceptional circumstances such as recruitment, there is a cap of 150% of salary, which is aligned to the current grant level. Previously the PSP limit could be exceeded in normal circumstances, up to 250% of salary, with shareholder consultation; and
• all incentive payments will ultimately be at the discretion of the Committee, which may override the formulaic outturn of the annual bonus or PSP if, for example, it fails to represent the shareholder experience of performance over the performance period.
Implementation of Policy for 2017/18Executive DirectorsEffective from 1 July 2017, the Executive Directors’ salaries will be increased by 2.5%, in line with general workforce increases. Annual bonus and PSP award levels are unchanged at 100% and 150% of salary respectively.
As explained in more detail in our Strategy section on pages 12 and 13, our strategy focuses on improving the profitability of the Group, its capital efficiency and the business portfolio to develop higher margin and growth businesses. To this end, the performance metrics for the incentive awards are being adjusted to better mirror these objectives.
Small changes are being made to the weighting of metrics for the 2017/18 annual bonus with profit before tax (45%), revenue growth (10%), cash flow (20%) and strategic objectives (25%). This represents a slight shift in weighting from revenue (‑10%) to strategic objectives (+10%) to link more of the bonus to clear and defined strategic objectives as the Company undergoes a period of transition. There is still significant emphasis on revenue, profit and cash to retain a strong focus on improving financial performance at the same time as strategically repositioning the business. Appropriately stretching sliding scales will be set for each financial metric, with full disclosure of targets and performance against them being made in next year’s Report and Financial Statements.
For the FY2018 PSP awards a ROCE target will be set for 50% of the award in place of the current TSR metric. This will provide a tighter link to the business strategy over the next few years to support and incentivise management to make the changes needed to our business portfolio by ensuring that there is efficient redeployment of our capital into higher margin and growth businesses.

62 Oxford Instruments plc Report and Financial Statements 2017
Remuneration Report continued
Implementation of Policy for 2017/18 continued
Executive Directors continuedEPS growth targets will be set for the other 50% of the award reflecting the continued importance of growth in profitability. The Committee considered retaining an element of TSR so that there are three metrics but this would make the PSP overly complex. The two‑year holding period for PSP awards and enhanced share ownership requirements will ensure that there is a strong long term alignment of interest between executives and Shareholders, particularly in the absence of a TSR measure.
The targets set for the annual bonus and PSP awards take into account the impact of the recently announced disposal of our Industrial Analysis business and the EPS and ROCE targets for the 2017/18 PSP awards are set out in the Annual Report on Remuneration.
Non‑Executive Directors’ feesFollowing a Board review, the Non‑Executive Director fees, which were last reviewed in July 2014, will be increased by 8% from 1 July 2017. The Chairman’s fee will increase by 2.5%, in line with the salary increases for the general workforce. In addition, the additional fee for the role of Senior Independent Director will increase from £5,000 to £7,500. The additional fee for chairing the Remuneration and Audit and Risk Committees remains at £7,500.
ConclusionTwo resolutions on remuneration will be brought to Shareholders at our AGM to be held on 12 September 2017. The first is the binding vote to approve our new Policy and the second is the annual advisory vote to approve the Annual Report on Remuneration, which sets out the remuneration outcomes for the year under review and how the policy will be implemented for the year ahead.
I hope that you will be supportive of both resolutions. If you have any queries in the meantime I will be pleased to engage with you either at the AGM or beforehand.
Yours sincerely
Thomas GeitnerChairman of the Remuneration Committee
13 June 2017

01: Strategic Report 02: Governance 03: Financial Statements 04: Company Information
63Oxford Instruments plc Report and Financial Statements 2017
Part A: Directors’ Remuneration PolicyThis part of the Remuneration Report sets out the Group’s remuneration policy for its Directors. As it is three years since our last policy vote, a revised Policy will be submitted to a binding Shareholder vote at our AGM on 12 September 2017. Subject to shareholder approval the new Policy will take effect from that date and, unless changed with Shareholders’ prior agreement, will stay in place until September 2020.
Summary of the changes to the current Remuneration PolicyThe Committee is proposing some changes to the current Policy to bring it in line with latest investor guidance and to provide a little more flexibility in its operation. There are no changes proposed to actual quantum or structure.
The changes are as follows:
• the normal Performance Share Plan award limit is reduced from 250% of base salary to 150% of base salary. This lower limit reflects the current PSP grant level and our needs for the policy period. Awards can only be made to the 250% of salary limit in truly exceptional circumstances;
• there will be flexibility to choose a broader range of performance metrics for the Performance Share Plan than the current policy of just EPS and TSR;
• there will be an explicit provision for the Committee to be able to over‑ride the formulaic outturn of any incentive payment if, for example, there are circumstances where such a payment fails to reflect wider company performance and shareholder experience;
• there will be a two‑year holding period applied to vested PSP awards for awards granted in 2017/18 onwards; and
• share ownership guidelines will be increased from 100% to 150% of base salary.
Policy overviewThe remuneration Policy promotes the delivery of the Group’s strategy and seeks to align the interests of Directors and Shareholders. The Committee regularly reviews the link between its incentive structures and strategy to ensure that remuneration packages are appropriate to attract, motivate and retain the high calibre Executives that are needed to deliver the Group’s strategy.
The Company seeks to reward Executives fairly and responsibly based on Group performance and their individual contribution. The Company has a strategy aimed at delivering significant, balanced and sustainable long‑term growth and it is important for motivation and retention that the remuneration of the Executives reflects this.
The Committee considers carefully the motivational effects of the incentive structure in order to ensure that it is effective and does not have any unintentionally negative impact on matters such as governance, environmental or social issues. More generally, the Committee ensures that the overall Remuneration Policy does not encourage inappropriate risk taking.
Other matters taken into consideration in determining policy The Committee reviews the Executive Directors’ packages periodically, taking account of the level of remuneration paid for comparable positions in similar companies. Comparative pay data is used carefully recognising the potential for an upward ratchet in remuneration caused by over‑reliance on such data.
In determining the remuneration of the Executive Directors, the Committee also takes into account the general trends in pay and conditions across the Group as a whole. The Committee seeks to ensure that the underlying principles which form the basis for decisions on Directors’ pay are consistent with those on which pay decisions for the rest of the workforce are taken. Employees are not currently consulted on Executive pay. However, the Committee will keep this under review.
The Committee considers feedback from Shareholders received at each AGM, together with any feedback from additional meetings, as part of any review of Executive Director remuneration. In addition, the Committee engages proactively with Shareholders where any material changes to the remuneration policy are proposed.

64 Oxford Instruments plc Report and Financial Statements 2017
Remuneration Report continued
Remuneration PolicyThe following table summarises the key features of our Remuneration Policy.
Element of pay Purpose and link to strategy Operation Maximum opportunity
Base salary • To provide a competitive and appropriate level of basic fixed pay to recruit and retain superior talent and avoid excessive risk taking that might otherwise result from an over‑reliance on variable remuneration.
• Reflects the experience, performance and responsibilities of the individual.
• Reviewed annually with any increase usually effective 1 July.
• Takes account of experience, performance and responsibilities as well as the performance of the Company, the complexity of the role within the Group and salary increases for employees generally.
• Set with regard to market data for comparable positions in similar companies in terms of size, internationality, business model, structure and complexity, including within the industry.
• There is no maximum or maximum annual increase.
• Higher increases than the average percentage for the workforce may be appropriate, for example, where an individual changes role, where the complexity of the Group changes, where an individual is materially below market comparators or is appointed on a below market salary with the expectation that his/her salary will increase with experience and performance.
Benefits • Provided on a market‑competitive basis, aids retention and follows reward structure for all employees.
• Currently include but are not limited to the cost of:
• life assurance;• private medical;• company car benefit (car, driver,
car allowance); and/or• overnight hotel accommodation
where necessary to enable the executive to carry out his duties efficiently at the Head Office and other Company sites.
• The benefits provided may be subject to amendment from time to time by the Committee within this policy.
• Relocation costs and other incidental expenses may be provided as necessary and reasonable.
• Benefits are not part of pensionable earnings.
• The value of benefits varies from year to year depending on the cost to the Company and is not subject to a specific cap. Benefit costs are monitored and controlled and represent a small element of total remuneration costs.
Pension • To provide a market‑competitive benefit for retirement.
• Company contributions to a money purchase pension scheme; or
• Salary supplement where HMRC annual or lifetime allowances are exceeded.
• 14% of base salary.
Annual bonus • Drives and rewards the successful achievement of annual targets set at the start of the year.
• Performance targets based on the key performance indicators and strategic objectives of the business.
• At least 70% of the bonus based on financial metrics and the balance on non‑financial strategic metrics.
• Clawback provisions apply for misstatement, error or misconduct.
• 75% of salary at year end payable at target performance.
• 100% of salary at year end payable for maximum performance.
• Bonuses start to be earned from 0% of salary for achieving threshold performance.

01: Strategic Report 02: Governance 03: Financial Statements 04: Company Information
65Oxford Instruments plc Report and Financial Statements 2017
Element of pay Purpose and link to strategy Operation Maximum opportunity
Long-term incentives
• To incentivise the Executives and reward them for meeting stretching targets in the long term which accrue substantial value to and align the Directors’ interests with Shareholders’.
• Facilitates share ownership to provide further alignment with Shareholders.
• Annual awards under the 2014 Performance Share Plan of performance shares (or nil‑cost options) with vesting subject to achievement of performance targets. Both the vesting and performance period will be over a minimum of three years.
• The Committee will set targets each year based on long‑term financial performance and/or a stock market based metric.
• 25% of the awards will vest at threshold performance under each performance condition.
• Clawback may be applied for misstatement, error or misconduct.
• For PSP awards granted from 2017/18, vested awards must be held for a further two years before sale of the shares (other than to pay tax).
• The maximum normal award limit is 150% of salary. This limit may be exceeded in exceptional circumstances e.g. recruitment, up to the limit in the PSP rules of 250% of base salary.
• Dividend equivalents may accrue on the PSP awards over the vesting period and for awards granted from 2018 to the end of the post vesting holding period and be paid out either as cash or as shares on vesting or at the end of the holding period as appropriate and in respect of the number of shares that have vested.
All-employee share schemes
• To encourage employee share participation.
• The Company may from time to time operate tax‑approved share schemes (such as the HMRC‑approved Share Incentive Plan (“SIP”)) for which executive Directors could be eligible.
• The SIP is open to all UK permanent staff employed for at least six months.
• The schemes are subject to the limits set by tax authorities.
Shareholding guideline
• To further align Executive Directors’ interests with Shareholders’.
• The Committee has established shareholding guidelines which encourage the Executive Directors to build and retain a holding of Company shares equivalent to 150% of base salary.
• Until the guideline is met in full, Executive Directors are expected to retain or acquire shares equivalent to the value of 50% of the net amount realised from exercise/ vesting of share awards as appropriate after allowing for tax payable.
• Not applicable.
Non-Executive Director fees
• To remunerate the Chairman and Non‑Executive Directors.
• Reviewed annually.
• Determined and reviewed taking into account time commitment, experience, knowledge and responsibilities of the role as well as market data for similar roles in other companies of a similar size and/or business to Oxford Instruments.
• Out of pocket expenses including travel may be reimbursed by the Company in accordance with the Company’s expenses policy including tax thereon “grossed up” as appropriate.
• There is no prescribed maximum or maximum annual increase.

66 Oxford Instruments plc Report and Financial Statements 2017
Remuneration Report continued
Differences in the Remuneration Policy of the Executive Directors and the general employeesThere are no material differences in the structure of remuneration arrangements for the Executive Directors and senior management population, aside from quantum and participation levels in incentive schemes, which reflect the fact that a greater emphasis is placed on performance‑related pay for Executive Directors and the most senior individuals in the management team. Outside the senior management team, the Company aims to provide remuneration structures for employees which reflect market norms.
Choice of performance measures and approach to setting targetsThe Committee selects financial and strategic measures for the annual bonus that are key performance indicators for the business over the short term. For the long‑term incentives, the Committee will select a combination of measures that provide a good focus on the outcomes of the Company strategy together with sustainable improvements in long‑term profitability.
The Committee sets appropriate and demanding targets for variable pay in the context of the Company’s trading environment and strategic objectives. The targets for the annual bonus plan will be set each year with reference to the Company’s budget and business and strategic plan. The Committee will review the performance conditions and targets for awards under the PSP each year prior to awards being made taking account of the Company’s internal financial planning, market forecasts and the business environment.
Discretions retained by the Committee in operating its incentive plansThe Committee may adjust the formula‑driven outturn for an annual bonus or PSP performance condition in the event that the Committee considers that the quantum would be inappropriate in light of wider Company performance or overall shareholder experience. Any such use of discretion would be detailed in the Annual Report on Remuneration in Part B.
The Committee operates the Group’s various incentive plans according to their respective rules and in accordance with HMRC rules where relevant. To ensure the efficient administration of these plans, the Committee may apply certain operational discretions. These include the following:
• select the participants in the plans;
• determine the timing of grants and/or payments;
• determine the quantum of grants and/or payments;
• determine the extent of vesting based on the assessment of performance;
• determine “good leaver” status, and where relevant, the extent of vesting in the case of the share‑based plans;
• where relevant determine the extent of vesting in the case of share‑based plans in the event of a change of control;
• making the appropriate adjustments required in certain circumstances (e.g. rights issues, corporate restructuring events, variation of capital and special dividends); and
• the annual review of weighting of performance measures, and setting targets for annual bonus plan and discretionary share plans from year to year.
The Committee may adjust the targets and/or set different measures and alter weightings for existing annual bonus plan and share‑based awards only if an event occurs which causes the Committee to reasonably consider that the performance conditions would not without alteration achieve its original purpose and the varied conditions are no less difficult to satisfy than the original conditions. Any changes, and the rationale for those changes, will be set out clearly in the Annual Report on Remuneration in respect of the year in which they are made.
Legacy arrangementsIn approving this Directors’ Remuneration Policy, authority is given to the Company to honour any commitments entered into with current or former Directors (such as the payment of a pension or the vesting or exercise of past share awards) that have been disclosed to and approved by Shareholders in previous remuneration reports. Details of any payments to former Directors will be set out in the Annual Report on Remuneration as they arise.
Remuneration scenarios for Executive DirectorsThe charts below show the level of remuneration potentially payable to Executive Directors under different performance scenarios for the financial year 2017/18 (see notes for assumptions):
LTIPsAnnual bonusFixed pay
£492
100%
Below target
Target
44%
28%
28%
£1,122
Maximum
32%
27%
41%
£1,542
Belowtarget
100%
£384
Target
44%
28%
28%
£876
Maximum
32%
27%
41%
£1,204
0
200
400
600
800
1,000
1,200
1,400
1,600
£(000s)Chief Executive (“CEO”)
Remuneration scenarios
Group Finance Director (“GFD”)
Assumptions for charts above:1. Fixed pay comprises salary levels as at 1 July 2017, pension contribution of 14% and the value of benefits received in
2016/17.
2. The on‑target level of bonus is 75% of the maximum opportunity, i.e. 75% of salary.
3. The on‑target level of vesting under the annual PSP is taken to be 50% of the face value of the award at grant, i.e. 75% of salary.
4. The maximum level of bonus and vesting under the PSP is 100% of the bonus opportunity and 100% of the face value of the PSP award at grant, i.e. 100% and 150% of salary respectively.
5. No share price appreciation has been assumed for the PSP awards and for simplicity SIP awards, as well as dividend equivalents, are excluded.

01: Strategic Report 02: Governance 03: Financial Statements 04: Company Information
67Oxford Instruments plc Report and Financial Statements 2017
Recruitment and promotion policy for Executive DirectorsIn setting total remuneration levels and in considering quantum for each element of the package for a new Executive Director, the Committee takes into account the skills and experience of the individual, the market rate for a candidate of that experience and the importance of securing the relevant individual.
The Company seeks to align the remuneration package with the Remuneration Policy approved by Shareholders, including the maximum plan limit for the long‑term incentives and an annual bonus entitlement in line with that of the other Executive Directors. Salary is provided at such a level as required to secure the most appropriate candidate. For new appointments base salary and total remuneration may be set initially at below normal market rates on the basis that it may be increased once expertise and performance has been proven and sustained.
Specific variable remuneration performance targets can be introduced for an individual where necessary for the first year of appointment if it is appropriate to do so to reflect the individual’s responsibilities and the point in the year in which he or she joined the Board.
Flexibility is retained to offer additional cash and/or share‑based payments on appointment in respect of deferred remuneration or benefit arrangements forfeited on leaving a previous employer. The Committee would look to replicate the arrangements being forfeited as closely as possible and in doing so, will take account of relevant factors including the nature of the deferred remuneration, performance conditions, attributed expected value and the time over which they would have vested or been paid. Such awards may be made under the terms of the PSP or as permitted under the Listing Rules.
For an internal appointment, any variable pay element awarded in respect of the prior role may be allowed to pay out according to its terms, adjusted as relevant to take into account the appointment. In addition, any other ongoing remuneration obligations existing prior to appointment may continue.
For external and internal appointments, the Committee may agree that the Company will meet certain relocation, legal and any other incidental expenses as appropriate.
Executive Directors’ service contracts and policy on cessationDetails of the service contracts of the Executive Directors, available for inspection at the Company’s registered office and at the Company’s AGM, are as follows:
Unexpired Contract date term of contract
Ian Barkshire 11 May 2016 Rolling contract
Gavin Hill 9 February 2016 Rolling contract
Details of contractual terms and the policy on cessation of employment are summarised in the table below.
Contractual provision Detailed terms
Notice period Twelve months by the Company or by the Director.
Termination payment
A Director’s service contract may be terminated without notice and without any further payment or compensation, except for sums accrued up to the date of termination, in the event of gross misconduct.
For termination in other circumstances, the Company has a right to pay salary in lieu of the notice period (or part thereof) if it so determines.
In addition, any statutory entitlements in connection with the termination would be paid as necessary, and at the Committee’s discretion if deemed necessary and appropriate outplacement, legal fees and settlement of claims or potential compensation claims.
Remuneration entitlements
Pro‑rata bonus may also become payable for the period of active service along with vesting for outstanding share awards (in certain circumstances – see below).
Change of control
No Executive Director’s contract contains additional provisions in respect of a change of control.
Any share‑based entitlements granted to an Executive Director under the Company’s share plans will be determined based on the relevant plan rules. The default treatment for existing awards is that any unvested awards lapse on cessation of employment. However, in certain prescribed circumstances, such as death, injury, ill health, disability, retirement or other circumstances at the discretion of the Committee, “good leaver” status may be applied. For good leavers, under the ESOS awards will vest at cessation to the extent the performance condition is satisfied, but with the Committee having discretion to vest on the normal vesting date if appropriate and to waive the performance condition. Under the 2014 PSP, awards to good leavers will vest on the normal vesting date, subject to the satisfaction of the relevant performance conditions at that time and be scaled back to reflect the proportion of the performance period actually served. The Committee has discretion in exceptional circumstances to disapply time pro‑rating and/or to measure performance to and vest awards at the date of cessation. Vesting at cessation would be the default position where a participant dies.
In the event of a takeover, awards vest to the extent the performance condition is satisfied and are scaled back to reflect the actual period of service with the Committee having the discretion, acting fairly and reasonably, not to scale back.

68 Oxford Instruments plc Report and Financial Statements 2017
Remuneration Report continued
External appointmentsThe Board encourages Executive Directors to accept appropriate external Non‑Executive appointments provided the aggregate commitment is compatible with their duties as Executive Directors. The Executive Director concerned may retain fees paid for these services, which will be subject to approval by the Board. Currently, Executive Directors do not hold any outside Directorships.
Non-Executive Directors For the appointment of a new Chairman or Non‑Executive Director, the fee arrangement would be in accordance with the approved remuneration policy in place at the time.
Non‑Executive Directors do not have service contracts but are appointed under letters of appointment for an initial period of three years with subsequent reviews. Non‑Executive Director appointments are now renewed for periods of one year terminating at the next AGM. Their appointment can be terminated without notice and with no compensation payable on termination, other than accrued fees and expenses.
Date of last appointment Notice period
Alan Thomson 5 May 2016 6 months
Richard Friend 1 Sept 2014 None
Thomas Geitner 13 Mar 2017 None
Mary Waldner 4 Feb 2016 None
PART B: Annual Report on Remuneration The financial information in this part of the report has been audited where indicated.
The Remuneration Committee (unaudited)The Remuneration Committee (the “Committee”) is responsible for recommending to the Board the remuneration packages for Executive Directors and has oversight of the bonus and share incentive strategy for the Group’s executive management. The Chairman and the Executive Directors are responsible for determining the remuneration of the Non‑Executive Directors, and the Remuneration Committee, with the exception of the Chairman, is responsible for determining the remuneration of the Chairman.
The role of the Committee includes:
• considering and determining the remuneration policy for the Executive Directors;
• within this agreed policy, considering and determining the various elements and total remuneration packages of each Executive Director of the Company;
• approving the design and performance targets for all performance‑related plans for Executives as well as the overall total payments made under such plans;
• reviewing and noting remuneration trends across the Group and considering these in terms of the Executive Directors’ remuneration; and
• determining the policy for pension arrangements, service agreements, recruitment terms and termination payments to Executive Directors.
The members of the Committee are appointed by the Board and currently comprise all the Independent Non‑Executive Directors: Thomas Geitner, Richard Friend, Mary Waldner; and the Chairman of the Board, Alan Thomson. Thomas Geitner is the Chairman of the Committee.
All members served throughout the year except for Alan Thomson who joined the Board and the Committee on 1 June 2016. Nigel Keen, Jennifer Allerton and Jock Lennox served on the Committee until they ceased to be Directors of the Company on 13 September 2016.
The Chief Executive, the Group HR Director and other Executives are invited to attend Committee meetings as deemed appropriate. For example the Chief Executive is able to make a significant contribution when considering the performance of other Executive Directors and to discuss the wider Group remuneration policy and structure and terms and conditions affecting other employees. However, no Executive Director is present when the Committee is determining his or her remuneration.
Attendance at meetings year ended 31 March 2017 Remuneration Date of appointment Committee to Committee
Number of meetings held 6
Number of meetings attended:
Thomas Geitner, Chairman 6 15 January 2013
Richard Friend 6 1 September 2014
Alan Thomson1 5 1 June 2016
Mary Waldner 6 4 February 2016
Nigel Keen2 3 25 February 1999
Jennifer Allerton2 3 11 June 2013
Jock Lennox2 3 1 April 20091. Alan Thomson has attended all meetings since his appointment to the Committee.
2. Nigel Keen, Jennifer Allerton and Jock Lennox attended all meetings until their appointments ceased on 13 September 2016.
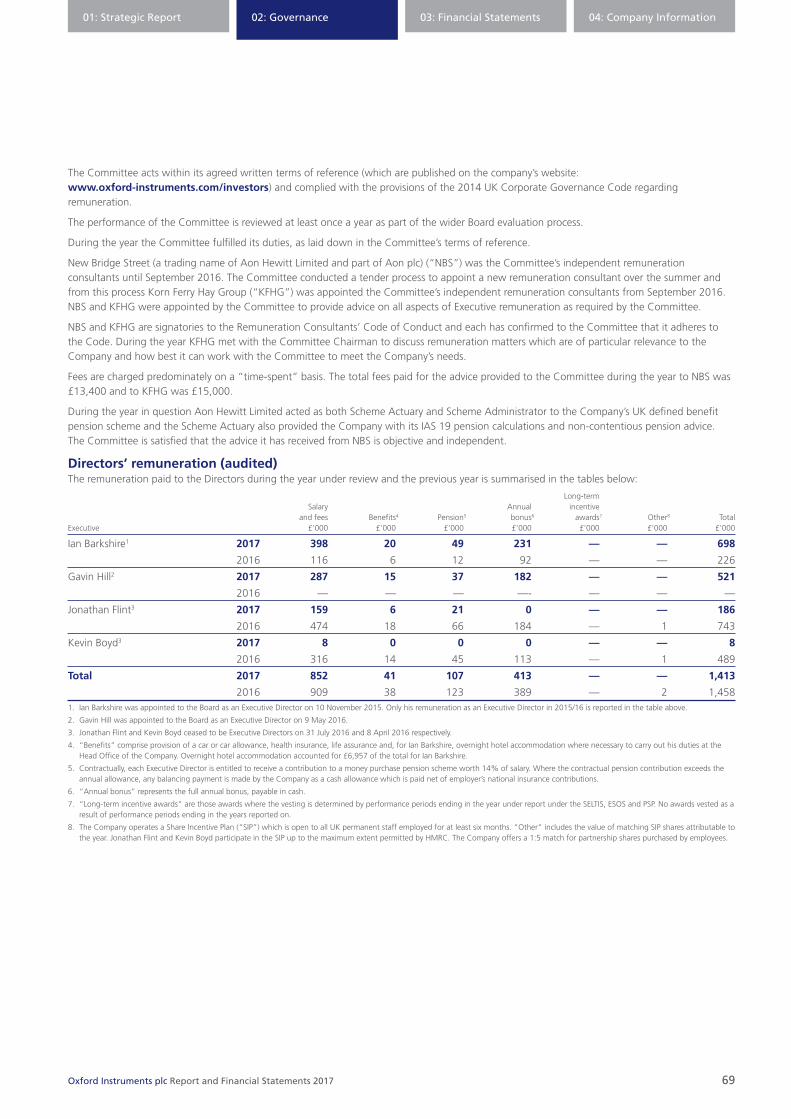
01: Strategic Report 02: Governance 03: Financial Statements 04: Company Information
69Oxford Instruments plc Report and Financial Statements 2017
The Committee acts within its agreed written terms of reference (which are published on the company’s website: www.oxford-instruments.com/investors) and complied with the provisions of the 2014 UK Corporate Governance Code regarding remuneration.
The performance of the Committee is reviewed at least once a year as part of the wider Board evaluation process.
During the year the Committee fulfilled its duties, as laid down in the Committee’s terms of reference.
New Bridge Street (a trading name of Aon Hewitt Limited and part of Aon plc) (“NBS”) was the Committee’s independent remuneration consultants until September 2016. The Committee conducted a tender process to appoint a new remuneration consultant over the summer and from this process Korn Ferry Hay Group (“KFHG”) was appointed the Committee’s independent remuneration consultants from September 2016. NBS and KFHG were appointed by the Committee to provide advice on all aspects of Executive remuneration as required by the Committee.
NBS and KFHG are signatories to the Remuneration Consultants’ Code of Conduct and each has confirmed to the Committee that it adheres to the Code. During the year KFHG met with the Committee Chairman to discuss remuneration matters which are of particular relevance to the Company and how best it can work with the Committee to meet the Company’s needs.
Fees are charged predominately on a “time‑spent” basis. The total fees paid for the advice provided to the Committee during the year to NBS was £13,400 and to KFHG was £15,000.
During the year in question Aon Hewitt Limited acted as both Scheme Actuary and Scheme Administrator to the Company’s UK defined benefit pension scheme and the Scheme Actuary also provided the Company with its IAS 19 pension calculations and non‑contentious pension advice. The Committee is satisfied that the advice it has received from NBS is objective and independent.
Directors’ remuneration (audited)The remuneration paid to the Directors during the year under review and the previous year is summarised in the tables below:
Long‑term Salary Annual incentive and fees Benefits4 Pension5 bonus6 awards7 Other8 Total Executive £’000 £’000 £’000 £’000 £’000 £’000 £’000
Ian Barkshire1 2017 398 20 49 231 — — 698
2016 116 6 12 92 — — 226
Gavin Hill2 2017 287 15 37 182 — — 521
2016 — — — —‑ — — —
Jonathan Flint3 2017 159 6 21 0 — — 186
2016 474 18 66 184 — 1 743
Kevin Boyd3 2017 8 0 0 0 — — 8
2016 316 14 45 113 — 1 489
Total 2017 852 41 107 413 — — 1,413
2016 909 38 123 389 — 2 1,4581. Ian Barkshire was appointed to the Board as an Executive Director on 10 November 2015. Only his remuneration as an Executive Director in 2015/16 is reported in the table above.
2. Gavin Hill was appointed to the Board as an Executive Director on 9 May 2016.
3. Jonathan Flint and Kevin Boyd ceased to be Executive Directors on 31 July 2016 and 8 April 2016 respectively.
4. “Benefits” comprise provision of a car or car allowance, health insurance, life assurance and, for Ian Barkshire, overnight hotel accommodation where necessary to carry out his duties at the Head Office of the Company. Overnight hotel accommodation accounted for £6,957 of the total for Ian Barkshire.
5. Contractually, each Executive Director is entitled to receive a contribution to a money purchase pension scheme worth 14% of salary. Where the contractual pension contribution exceeds the annual allowance, any balancing payment is made by the Company as a cash allowance which is paid net of employer’s national insurance contributions.
6. “Annual bonus” represents the full annual bonus, payable in cash.
7. “Long‑term incentive awards” are those awards where the vesting is determined by performance periods ending in the year under report under the SELTIS, ESOS and PSP. No awards vested as a result of performance periods ending in the years reported on.
8. The Company operates a Share Incentive Plan (“SIP”) which is open to all UK permanent staff employed for at least six months. “Other” includes the value of matching SIP shares attributable to the year. Jonathan Flint and Kevin Boyd participate in the SIP up to the maximum extent permitted by HMRC. The Company offers a 1:5 match for partnership shares purchased by employees.
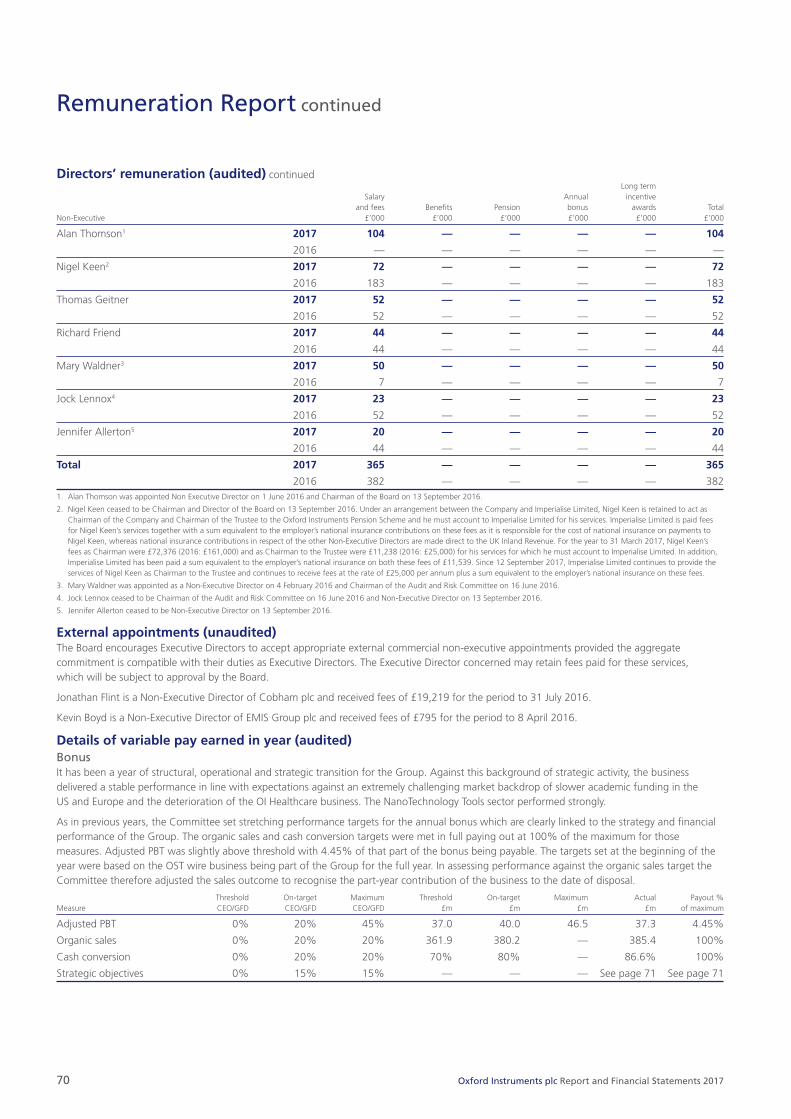
70 Oxford Instruments plc Report and Financial Statements 2017
Remuneration Report continued
Directors’ remuneration (audited) continued Long term Salary Annual incentive and fees Benefits Pension bonus awards Total Non‑Executive £’000 £’000 £’000 £’000 £’000 £’000
Alan Thomson1 2017 104 — — — — 104
2016 — — — — — —
Nigel Keen2 2017 72 — — — — 72
2016 183 — — — — 183
Thomas Geitner 2017 52 — — — — 52
2016 52 — — — — 52
Richard Friend 2017 44 — — — — 44
2016 44 — — — — 44
Mary Waldner3 2017 50 — — — — 50
2016 7 — — — — 7
Jock Lennox4 2017 23 — — — — 23
2016 52 — — — — 52
Jennifer Allerton5 2017 20 — — — — 20
2016 44 — — — — 44
Total 2017 365 — — — — 365
2016 382 — — — — 3821. Alan Thomson was appointed Non Executive Director on 1 June 2016 and Chairman of the Board on 13 September 2016.
2. Nigel Keen ceased to be Chairman and Director of the Board on 13 September 2016. Under an arrangement between the Company and Imperialise Limited, Nigel Keen is retained to act as Chairman of the Company and Chairman of the Trustee to the Oxford Instruments Pension Scheme and he must account to Imperialise Limited for his services. Imperialise Limited is paid fees for Nigel Keen’s services together with a sum equivalent to the employer’s national insurance contributions on these fees as it is responsible for the cost of national insurance on payments to Nigel Keen, whereas national insurance contributions in respect of the other Non‑Executive Directors are made direct to the UK Inland Revenue. For the year to 31 March 2017, Nigel Keen’s fees as Chairman were £72,376 (2016: £161,000) and as Chairman to the Trustee were £11,238 (2016: £25,000) for his services for which he must account to Imperialise Limited. In addition, Imperialise Limited has been paid a sum equivalent to the employer’s national insurance on both these fees of £11,539. Since 12 September 2017, Imperialise Limited continues to provide the services of Nigel Keen as Chairman to the Trustee and continues to receive fees at the rate of £25,000 per annum plus a sum equivalent to the employer’s national insurance on these fees.
3. Mary Waldner was appointed as a Non‑Executive Director on 4 February 2016 and Chairman of the Audit and Risk Committee on 16 June 2016.
4. Jock Lennox ceased to be Chairman of the Audit and Risk Committee on 16 June 2016 and Non‑Executive Director on 13 September 2016.
5. Jennifer Allerton ceased to be Non‑Executive Director on 13 September 2016.
External appointments (unaudited)The Board encourages Executive Directors to accept appropriate external commercial non‑executive appointments provided the aggregate commitment is compatible with their duties as Executive Directors. The Executive Director concerned may retain fees paid for these services, which will be subject to approval by the Board.
Jonathan Flint is a Non‑Executive Director of Cobham plc and received fees of £19,219 for the period to 31 July 2016.
Kevin Boyd is a Non‑Executive Director of EMIS Group plc and received fees of £795 for the period to 8 April 2016.
Details of variable pay earned in year (audited)Bonus It has been a year of structural, operational and strategic transition for the Group. Against this background of strategic activity, the business delivered a stable performance in line with expectations against an extremely challenging market backdrop of slower academic funding in the US and Europe and the deterioration of the OI Healthcare business. The NanoTechnology Tools sector performed strongly.
As in previous years, the Committee set stretching performance targets for the annual bonus which are clearly linked to the strategy and financial performance of the Group. The organic sales and cash conversion targets were met in full paying out at 100% of the maximum for those measures. Adjusted PBT was slightly above threshold with 4.45% of that part of the bonus being payable. The targets set at the beginning of the year were based on the OST wire business being part of the Group for the full year. In assessing performance against the organic sales target the Committee therefore adjusted the sales outcome to recognise the part‑year contribution of the business to the date of disposal.
Threshold On‑target Maximum Threshold On‑target Maximum Actual Payout % Measure CEO/GFD CEO/GFD CEO/GFD £m £m £m £m of maximum
Adjusted PBT 0% 20% 45% 37.0 40.0 46.5 37.3 4.45%
Organic sales 0% 20% 20% 361.9 380.2 — 385.4 100%
Cash conversion 0% 20% 20% 70% 80% — 86.6% 100%
Strategic objectives 0% 15% 15% — — — See page 71 See page 71
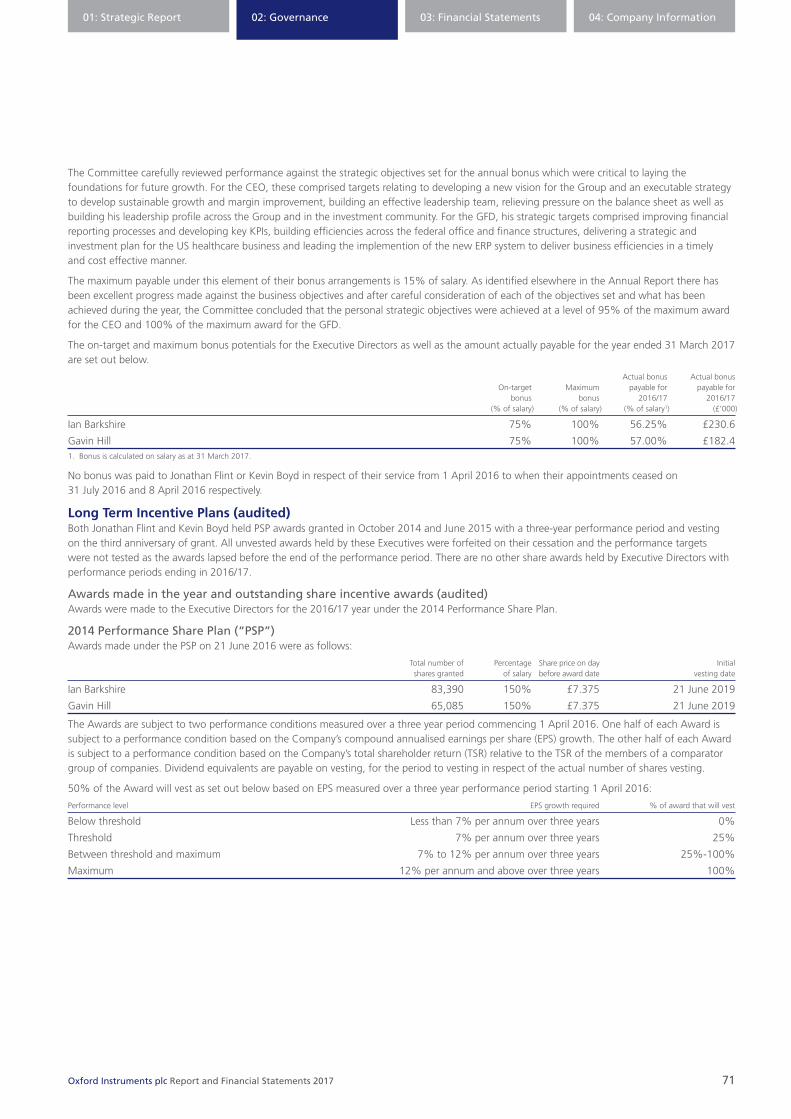
01: Strategic Report 02: Governance 03: Financial Statements 04: Company Information
71Oxford Instruments plc Report and Financial Statements 2017
The Committee carefully reviewed performance against the strategic objectives set for the annual bonus which were critical to laying the foundations for future growth. For the CEO, these comprised targets relating to developing a new vision for the Group and an executable strategy to develop sustainable growth and margin improvement, building an effective leadership team, relieving pressure on the balance sheet as well as building his leadership profile across the Group and in the investment community. For the GFD, his strategic targets comprised improving financial reporting processes and developing key KPIs, building efficiencies across the federal office and finance structures, delivering a strategic and investment plan for the US healthcare business and leading the implemention of the new ERP system to deliver business efficiencies in a timely and cost effective manner.
The maximum payable under this element of their bonus arrangements is 15% of salary. As identified elsewhere in the Annual Report there has been excellent progress made against the business objectives and after careful consideration of each of the objectives set and what has been achieved during the year, the Committee concluded that the personal strategic objectives were achieved at a level of 95% of the maximum award for the CEO and 100% of the maximum award for the GFD.
The on‑target and maximum bonus potentials for the Executive Directors as well as the amount actually payable for the year ended 31 March 2017 are set out below.
Actual bonus Actual bonus On‑target Maximum payable for payable for bonus bonus 2016/17 2016/17 (% of salary) (% of salary) (% of salary1) (£’000)
Ian Barkshire 75% 100% 56.25% £230.6
Gavin Hill 75% 100% 57.00% £182.41. Bonus is calculated on salary as at 31 March 2017.
No bonus was paid to Jonathan Flint or Kevin Boyd in respect of their service from 1 April 2016 to when their appointments ceased on 31 July 2016 and 8 April 2016 respectively.
Long Term Incentive Plans (audited)Both Jonathan Flint and Kevin Boyd held PSP awards granted in October 2014 and June 2015 with a three‑year performance period and vesting on the third anniversary of grant. All unvested awards held by these Executives were forfeited on their cessation and the performance targets were not tested as the awards lapsed before the end of the performance period. There are no other share awards held by Executive Directors with performance periods ending in 2016/17.
Awards made in the year and outstanding share incentive awards (audited)Awards were made to the Executive Directors for the 2016/17 year under the 2014 Performance Share Plan.
2014 Performance Share Plan (“PSP”) Awards made under the PSP on 21 June 2016 were as follows:
Total number of Percentage Share price on day Initial shares granted of salary before award date vesting date
Ian Barkshire 83,390 150% £7.375 21 June 2019
Gavin Hill 65,085 150% £7.375 21 June 2019
The Awards are subject to two performance conditions measured over a three year period commencing 1 April 2016. One half of each Award is subject to a performance condition based on the Company’s compound annualised earnings per share (EPS) growth. The other half of each Award is subject to a performance condition based on the Company’s total shareholder return (TSR) relative to the TSR of the members of a comparator group of companies. Dividend equivalents are payable on vesting, for the period to vesting in respect of the actual number of shares vesting.
50% of the Award will vest as set out below based on EPS measured over a three year performance period starting 1 April 2016:
Performance level EPS growth required % of award that will vest
Below threshold Less than 7% per annum over three years 0%
Threshold 7% per annum over three years 25%
Between threshold and maximum 7% to 12% per annum over three years 25%‑100%
Maximum 12% per annum and above over three years 100%
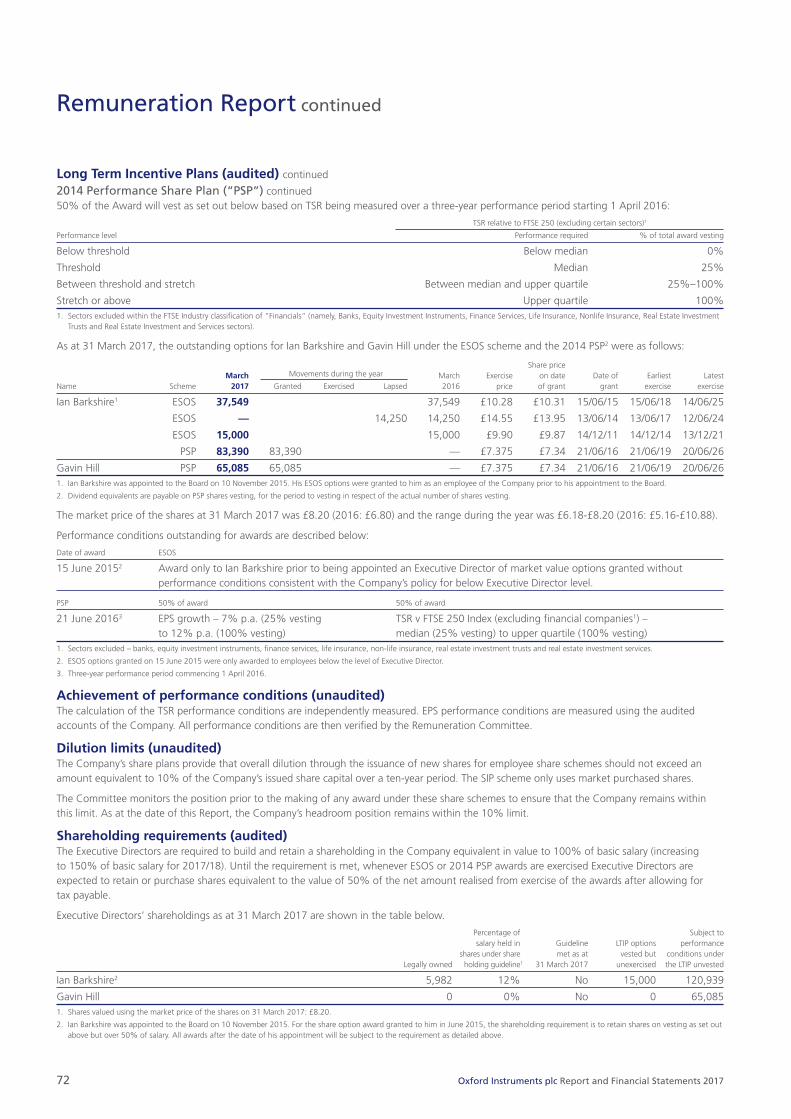
72 Oxford Instruments plc Report and Financial Statements 2017
Remuneration Report continued
Long Term Incentive Plans (audited) continued
2014 Performance Share Plan (“PSP”) continued50% of the Award will vest as set out below based on TSR being measured over a three‑year performance period starting 1 April 2016:
TSR relative to FTSE 250 (excluding certain sectors)1
Performance level Performance required % of total award vesting
Below threshold Below median 0%
Threshold Median 25%
Between threshold and stretch Between median and upper quartile 25%–100%
Stretch or above Upper quartile 100%1. Sectors excluded within the FTSE Industry classification of “Financials” (namely, Banks, Equity Investment Instruments, Finance Services, Life Insurance, Nonlife Insurance, Real Estate Investment
Trusts and Real Estate Investment and Services sectors).
As at 31 March 2017, the outstanding options for Ian Barkshire and Gavin Hill under the ESOS scheme and the 2014 PSP2 were as follows:
Movements during the year Share price March March Exercise on date Date of Earliest Latest Name Scheme 2017 Granted Exercised Lapsed 2016 price of grant grant exercise exercise
Ian Barkshire1 ESOS 37,549 37,549 £10.28 £10.31 15/06/15 15/06/18 14/06/25
ESOS — 14,250 14,250 £14.55 £13.95 13/06/14 13/06/17 12/06/24
ESOS 15,000 15,000 £9.90 £9.87 14/12/11 14/12/14 13/12/21
PSP 83,390 83,390 — £7.375 £7.34 21/06/16 21/06/19 20/06/26
Gavin Hill PSP 65,085 65,085 — £7.375 £7.34 21/06/16 21/06/19 20/06/261. Ian Barkshire was appointed to the Board on 10 November 2015. His ESOS options were granted to him as an employee of the Company prior to his appointment to the Board.
2. Dividend equivalents are payable on PSP shares vesting, for the period to vesting in respect of the actual number of shares vesting.
The market price of the shares at 31 March 2017 was £8.20 (2016: £6.80) and the range during the year was £6.18‑£8.20 (2016: £5.16‑£10.88).
Performance conditions outstanding for awards are described below:
Date of award ESOS
15 June 20152 Award only to Ian Barkshire prior to being appointed an Executive Director of market value options granted without performance conditions consistent with the Company’s policy for below Executive Director level.
PSP 50% of award 50% of award
21 June 20163 EPS growth – 7% p.a. (25% vesting TSR v FTSE 250 Index (excluding financial companies1) – to 12% p.a. (100% vesting) median (25% vesting) to upper quartile (100% vesting)
1. Sectors excluded – banks, equity investment instruments, finance services, life insurance, non‑life insurance, real estate investment trusts and real estate investment services.
2. ESOS options granted on 15 June 2015 were only awarded to employees below the level of Executive Director.
3. Three‑year performance period commencing 1 April 2016.
Achievement of performance conditions (unaudited)The calculation of the TSR performance conditions are independently measured. EPS performance conditions are measured using the audited accounts of the Company. All performance conditions are then verified by the Remuneration Committee.
Dilution limits (unaudited)The Company’s share plans provide that overall dilution through the issuance of new shares for employee share schemes should not exceed an amount equivalent to 10% of the Company’s issued share capital over a ten‑year period. The SIP scheme only uses market purchased shares.
The Committee monitors the position prior to the making of any award under these share schemes to ensure that the Company remains within this limit. As at the date of this Report, the Company’s headroom position remains within the 10% limit.
Shareholding requirements (audited)The Executive Directors are required to build and retain a shareholding in the Company equivalent in value to 100% of basic salary (increasing to 150% of basic salary for 2017/18). Until the requirement is met, whenever ESOS or 2014 PSP awards are exercised Executive Directors are expected to retain or purchase shares equivalent to the value of 50% of the net amount realised from exercise of the awards after allowing for tax payable.
Executive Directors’ shareholdings as at 31 March 2017 are shown in the table below.
Percentage of Subject to salary held in Guideline LTIP options performance shares under share met as at vested but conditions under Legally owned holding guideline1 31 March 2017 unexercised the LTIP unvested
Ian Barkshire2 5,982 12% No 15,000 120,939
Gavin Hill 0 0% No 0 65,0851. Shares valued using the market price of the shares on 31 March 2017: £8.20.
2. Ian Barkshire was appointed to the Board on 10 November 2015. For the share option award granted to him in June 2015, the shareholding requirement is to retain shares on vesting as set out above but over 50% of salary. All awards after the date of his appointment will be subject to the requirement as detailed above.

01: Strategic Report 02: Governance 03: Financial Statements 04: Company Information
73Oxford Instruments plc Report and Financial Statements 2017
Pension arrangements Executive Director Pension Arrangements (audited)Under the terms of their service contracts, Executive Directors can ask the Company to contribute to a pension plan of their choice. The Company contributes a maximum of 14% of base salary. Only base salary is pensionable and contributions are not included in the calculation of bonus and share award entitlements. Where the Company’s pension contribution exceeds the annual allowance a balancing payment is paid by the Company to the Director, which is taxed as income. In line with the policy for all UK employees, this cash payment is reduced by 12.12% to cover employer’s national insurance costs.
During the year, the Company contributed £7,478 (2016: £11,786) into the Company’s Group Personal Pension Plan in respect of Ian Barkshire and £9,167 (2016: n/a) into a personal defined contribution plan in respect of Gavin Hill. Balancing payments to 14% of base salary (net of employer’s national insurance contributions) were paid as cash.
Ian Barkshire is a deferred member of the defined benefit scheme and is no longer accruing benefits in the scheme. In accordance with the rules of the Scheme his deferred benefits are subject to increases in line with statutory revaluation. The transfer value of his accrued benefits at 31 March 2017 was £579,101 (2016: £444,608).
Payments for loss of office (audited)Kevin Boyd, Group Finance Director, and Jonathan Flint, Chief Executive, left the Company on 8 April 2016 and 31 July 2016 respectively. Messrs Boyd and Flint received the following remuneration:
• base salary, benefits and pension to the date of cessation;
• annual bonus for the financial year ended 31 March 2016 determined in accordance with the financial and non‑financial performance targets set at the beginning of the year and as disclosed in last year’s report and paid in June 2016;
• no annual bonus will be awarded for the part of the year 2016/17 for which they were with the Company; and
• all outstanding long‑term incentive awards lapsed on the date of cessation.
On 13 September, Nigel Keen, Chairman, Jock Lennox and Jennifer Allerton ceased to be Non‑Executive Directors of the Company. They each received fees to the date of cessation.
Nigel Keen continues to be Chairman of the Trustee of the Oxford Instruments Pension Scheme.
Performance graph and CEO’s remuneration (unaudited)The graph below shows for the nine years ended 31 March 2017 the Total Shareholder Return (“TSR”) on a holding of the Company’s ordinary shares compared with a hypothetical holding of shares made up of shares of the same kind and number as those by reference to which the FTSE SmallCap, FTSE Techmark and FTSE 350 Electronic and Electrical Equipment indices are calculated. These indices have been chosen as they are considered to be the most appropriate comparator groups for the Company. TSR has been calculated by reference to the relevant share price for each constituent company assuming dividends are reinvested.
This graph shows the value, by 31 March 2017, of £100 invested in Oxford Instruments plc on 31 March 2009 compared with the value of £100 invested in the FTSE SmallCap, FTSE250, FTSE Techmark and FTSE 350 Electronic and Electrical Equipment indices. The other points plotted are the values at intervening financial year ends.
Source: Thomson Reuters
31 March2009
31 March2010
31 March2011
31 March2012
31 March2013
31 March2014
31 March2015
31 March2016
31 March2017
Value (£)
0
200
400
600
800
1,000
1,200
1,400
1,600
1,800Oxford Instruments
FTSE 350 E&EE
FTSE Techmark
FTSE SmallCap

74 Oxford Instruments plc Report and Financial Statements 2017
Remuneration Report continued
Performance graph and CEO’s remuneration (unaudited) continuedThe total remuneration of the CEO over the last seven years is shown in the table below. The annual bonus payout and LTIP vesting level as a percentage of the maximum opportunity is also shown.
DJF IRB Year ending 31 March 2011 2012 2013 2014 2015 2016 2017 2017
Total remuneration (£’000) 2,596 3,464 2,348 1,179 579 743 64 620
Annual bonus outcome (%) 100% 100% 69.1% 15.0% 7.5% 38.6% 0% 56.3%
ESOS vesting (%) 100% 100% 100% 100% 0% 0% 0% 0%
SELTIS/PSP vesting (%) 50% 100% 100% 100% 0% 0% 0% 0%1. 2016/17 financial year: remuneration shown separately for Jonathan Flint (“DJF”) who was CEO from 1 April to 11 May 2016 and Ian Barkshire (“IRB”) who was CEO from 12 May 2016 to
31 March 2017.
Percentage change in the remuneration of the Chief Executive (unaudited)The table below shows the percentage change in each of the CEO’s salary, taxable benefits and annual bonus earned between 2015/16 and 2016/17, compared to that for the average UK‑based employee of the Group (on a per capita basis).
CEO1 Average employee2
£’000 2016/17 2015/16 % change 2016/17 2015/16 % change
Salary 397.9 473.9 ‑16% 41.4 41.7 0.7%
Benefits 20.0 18.3 9% 1.9 1.8 6%
Bonus3 230.6 184.3 25% 1.3 2.2 ‑41%1. The CEO remuneration for 2016/17 is that for Ian Barkshire (who was paid a salary of £300,000 p.a. to 11 May 2016 when he was appointed CEO and for the remainder of the year
£410,000 p.a.) and the comparative year, 2015/16, is that of the previous CEO, Jonathan Flint.
2. Average employee includes all UK employees in service on 1 April 2015 and 31 March 2017 but excludes those who were on maternity or long‑term sick leave.
3. The value of the average employee bonus for the year ended 31 March 2017 (to be paid at the end of June 2017) was not known at the time the Report and Financial Statements were approved and has been subsequently included.
Relative importance of the spend on payThe following table shows the Group’s employee costs relative to dividends and share buybacks:
Year ended Year ended 31 March 31 March 2017 2016 % change
Employee costs (£m) 114.3 104.7 9%
Dividends (£m) 7.4 7.6 ‑3%
Share buybacks (£m) 0.0 0.0 0.0%
Statement of Shareholder voting (unaudited)At last year’s AGM, the Directors’ Remuneration Policy Report and Annual Report on Remuneration received the following votes from Shareholders:
Votes Votes marked Resolution Votes for discretionary Votes against % for % against as abstain
To approve the Directors’ Report on Remuneration 43,295,222 3,106,493 136,505 99.6 0.4 5,769
How the policy will be applied in 2017/18 (unaudited)Base salariesIn line with the general workforce, the Executive Directors will receive salary increases of 2.5% for 2017/18 effective from 1 July 2017. The CEO’s salary as a result of the increase will be £420,250 and the GFD’s £328,000.
Benefits and pensionThese will be made in accordance with the approved policy. Benefits will be in line with those received in 2016/17. The Committee has authorised that the CEO may use the services of a chauffeur for travel to and from work to enable him to make best use of his travelling time.
Annual bonusThe maximum opportunity under the annual bonus plan for 2017/18 will be 100% of base salary for both the CEO and GFD.

01: Strategic Report 02: Governance 03: Financial Statements 04: Company Information
75Oxford Instruments plc Report and Financial Statements 2017
A combination of financial (75%) and non‑financial strategic (25%) metrics will be used to determine the level of payment under the annual bonus and as detailed in the table below:
Weighting as a % of opportunity
Measure CEO GFD
Organic sales (£m) 10% 10%
Profit (£m) 45% 45%
Cash generation (£m) 20% 20%
Strategic objectives 25% 25%
Non‑financial strategic objectives have been agreed and are broadly linked to the development and implementation of the Horizon strategy.
The Committee has chosen not to disclose, in advance, the performance targets for the forthcoming year as these include matters which the Committee considers commercially sensitive. Retrospective disclosure of the performance against them will be made in next year’s Annual Report on Remuneration to the extent the targets are not commercially sensitive at that time.
Long‑term incentives in respect of the 2017/18 financial yearThe 2017/18 PSP awards will be over shares with a market value at grant of 150% of salary for the CEO and GFD. Vesting will be subject to the performance conditions as set out below measured over a three‑year performance period commencing 1 April 2017.
Half of the award Half of the award
EPS growth – 4% p.a. (25% vesting) to 10% p.a. (100% vesting) ROCE 13.0% in the final year of the performance period over three financial years commencing with the 2017/18 financial year. (2019/20 financial year) (25% vesting) to 15.5% (100% vesting).
The EPS and ROCE targets are based on the underlying business performance (excluding the disposal of the Industrial Analysis (“IA”) business). The Committee is comfortable that these targets remain equivalently stretching as prior to the disposal. However, the Committee has agreed to review the targets once the transaction has completed and all necessary adjustments have been made to the Financial Statements to exclude the effect of IA. If, on its review at that time, the Committee concludes that the targets set are not as stretching as prior to the IA disposal then an appropriate adjustment will be made at that time. Any subsequent adjustments to the base year or actual targets, as appropriate to take account of the IA disposal, will be disclosed in next year’s Remuneration Report.
Non‑Executive Directors’ feesThe Committee and the Board, as appropriate, have reviewed the fees for the Chairman and Non‑Executive Directors. The Non‑Executive Director fee levels have not been reviewed since 1 July 2014. The following increases were agreed with effect from 1 July 2017:
Annualised 2016/173 2017/183 % increase2 increase
Board Chairman1 £165,000 £169,125 2.5% 2.5%
Additional fee Deputy Chairman £5,000 £5,000 0% 0%
Basic fee2 £44,000 £47,500 8.0% 2.6%
Additional fee for Senior Independent Director £5,000 £7,500 50.0% 14.5%
Additional fee for Committee Chairman £7,500 £7,500 0% 0%1. The Chairman fee for 2016/17 and 2017/18 is the annual fee payable to Alan Thomson who was appointed Chairman from 13 September 2016. The total of the pro‑rated fees for 2016/17
payable to the former Chairman, Nigel Keen, and Alan Thomson was £163,190.
2. Fees for Non‑Executive Directors were last increased on 1 July 2014.
3. The fees shown for 2016/17 and 2017/18 are the annualised rates as at 1 July 2016 and 1 July 2017 respectively.
ApprovalThis report was adopted by the Committee on 13 June 2017 and has been approved subsequently by the Board for submission to Shareholders at the Annual General Meeting to be held on 12 September 2017.
Thomas Geitner Chairman of the Remuneration Committee
13 June 2017
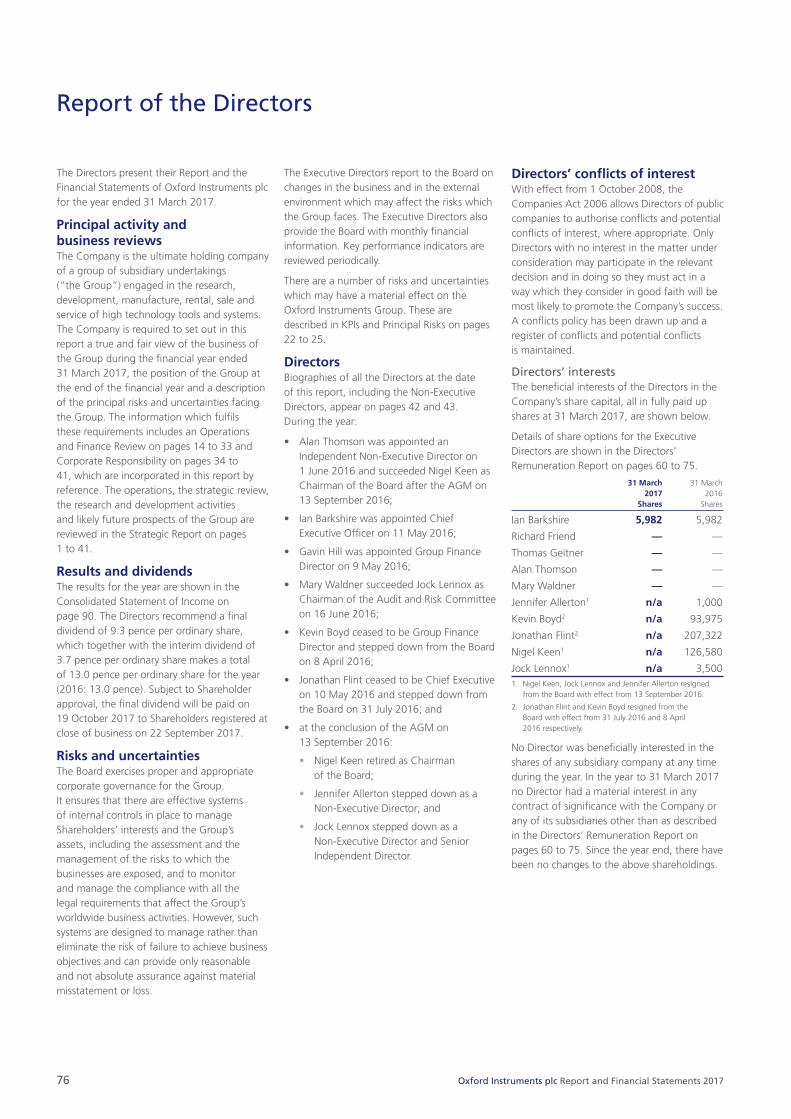
76 Oxford Instruments plc Report and Financial Statements 2017
Report of the Directors
The Directors present their Report and the Financial Statements of Oxford Instruments plc for the year ended 31 March 2017.
Principal activity and business reviewsThe Company is the ultimate holding company of a group of subsidiary undertakings (“the Group”) engaged in the research, development, manufacture, rental, sale and service of high technology tools and systems. The Company is required to set out in this report a true and fair view of the business of the Group during the financial year ended 31 March 2017, the position of the Group at the end of the financial year and a description of the principal risks and uncertainties facing the Group. The information which fulfils these requirements includes an Operations and Finance Review on pages 14 to 33 and Corporate Responsibility on pages 34 to 41, which are incorporated in this report by reference. The operations, the strategic review, the research and development activities and likely future prospects of the Group are reviewed in the Strategic Report on pages 1 to 41.
Results and dividendsThe results for the year are shown in the Consolidated Statement of Income on page 90. The Directors recommend a final dividend of 9.3 pence per ordinary share, which together with the interim dividend of 3.7 pence per ordinary share makes a total of 13.0 pence per ordinary share for the year (2016: 13.0 pence). Subject to Shareholder approval, the final dividend will be paid on 19 October 2017 to Shareholders registered at close of business on 22 September 2017.
Risks and uncertaintiesThe Board exercises proper and appropriate corporate governance for the Group. It ensures that there are effective systems of internal controls in place to manage Shareholders’ interests and the Group’s assets, including the assessment and the management of the risks to which the businesses are exposed, and to monitor and manage the compliance with all the legal requirements that affect the Group’s worldwide business activities. However, such systems are designed to manage rather than eliminate the risk of failure to achieve business objectives and can provide only reasonable and not absolute assurance against material misstatement or loss.
The Executive Directors report to the Board on changes in the business and in the external environment which may affect the risks which the Group faces. The Executive Directors also provide the Board with monthly financial information. Key performance indicators are reviewed periodically.
There are a number of risks and uncertainties which may have a material effect on the Oxford Instruments Group. These are described in KPIs and Principal Risks on pages 22 to 25.
DirectorsBiographies of all the Directors at the date of this report, including the Non‑Executive Directors, appear on pages 42 and 43. During the year:
• Alan Thomson was appointed an Independent Non‑Executive Director on 1 June 2016 and succeeded Nigel Keen as Chairman of the Board after the AGM on 13 September 2016;
• Ian Barkshire was appointed Chief Executive Officer on 11 May 2016;
• Gavin Hill was appointed Group Finance Director on 9 May 2016;
• Mary Waldner succeeded Jock Lennox as Chairman of the Audit and Risk Committee on 16 June 2016;
• Kevin Boyd ceased to be Group Finance Director and stepped down from the Board on 8 April 2016;
• Jonathan Flint ceased to be Chief Executive on 10 May 2016 and stepped down from the Board on 31 July 2016; and
• at the conclusion of the AGM on 13 September 2016:
• Nigel Keen retired as Chairman of the Board;
• Jennifer Allerton stepped down as a Non‑Executive Director; and
• Jock Lennox stepped down as a Non‑Executive Director and Senior Independent Director.
Directors’ conflicts of interestWith effect from 1 October 2008, the Companies Act 2006 allows Directors of public companies to authorise conflicts and potential conflicts of interest, where appropriate. Only Directors with no interest in the matter under consideration may participate in the relevant decision and in doing so they must act in a way which they consider in good faith will be most likely to promote the Company’s success. A conflicts policy has been drawn up and a register of conflicts and potential conflicts is maintained.
Directors’ interestsThe beneficial interests of the Directors in the Company’s share capital, all in fully paid up shares at 31 March 2017, are shown below.
Details of share options for the Executive Directors are shown in the Directors’ Remuneration Report on pages 60 to 75.
31 March 31 March 2017 2016 Shares Shares
Ian Barkshire 5,982 5,982
Richard Friend — —
Thomas Geitner — —
Alan Thomson — —
Mary Waldner — —
Jennifer Allerton1 n/a 1,000
Kevin Boyd2 n/a 93,975
Jonathan Flint2 n/a 207,322
Nigel Keen1 n/a 126,580
Jock Lennox1 n/a 3,5001. Nigel Keen, Jock Lennox and Jennifer Allerton resigned
from the Board with effect from 13 September 2016.
2. Jonathan Flint and Kevin Boyd resigned from the Board with effect from 31 July 2016 and 8 April 2016 respectively.
No Director was beneficially interested in the shares of any subsidiary company at any time during the year. In the year to 31 March 2017 no Director had a material interest in any contract of significance with the Company or any of its subsidiaries other than as described in the Directors’ Remuneration Report on pages 60 to 75. Since the year end, there have been no changes to the above shareholdings.

01: Strategic Report 02: Governance 03: Financial Statements 04: Company Information
77Oxford Instruments plc Report and Financial Statements 2017
Insurance cover and Directors’ indemnitiesFor a number of years, the Group has purchased insurance to cover its Directors and Officers against their costs in defending themselves in legal proceedings taken against them in that capacity and in respect of damages resulting from the unsuccessful defence of any proceedings. In addition, to the extent permitted by UK law, the Group indemnifies its Directors and Officers for liabilities arising from such proceedings.
Neither the insurance nor the indemnity provides cover for situations where the Director has acted fraudulently or dishonestly.
Share capitalThe Company only has one class of share capital which comprises ordinary shares of 5 pence each. All shares forming part of the ordinary share capital have the same rights and carry one vote each. There are no unusual restrictions on the transfer of a share. The full rights and obligations attaching to the Company’s ordinary shares, as well as the powers of the Directors, are set out in the Company’s Articles of Association, a copy of which is available on the Company’s website. These can also be obtained from Companies House or by writing to the Company Secretary.
During the year to 31 March 2017 the issued share capital was increased by 0.03% with the issue of 17,005 ordinary shares (2016: 7,575) following the exercise of options under the Company’s share option schemes. At 31 March 2017, the issued share capital of the Company was therefore 57,315,916 ordinary shares of 5 pence each. In connection with the Company’s equity incentive plans, a separately administered trust held 183,145 ordinary shares at 31 March 2017 (representing 0.3% of the total issued share capital of the Company). No shares in the Company were acquired by the Company during the year (2016: nil). Details of the share capital and options outstanding as at 31 March 2017 are set out in Notes 24 and 13 respectively to the Financial Statements.
At this year’s Annual General Meeting, the Directors propose to renew the authorities granted to them at last year’s AGM to:
a) allot ordinary shares up to an aggregate nominal value of one‑third of the Company’s issued share capital and, where full pre‑emption rights are applied, up to an aggregate nominal value of two‑thirds of the Company’s issued share capital;
b) allot ordinary shares up to an aggregate nominal value of 10% of the Company’s issued share capital without first offering them to existing Shareholders; and
c) buy back up to 10% of the Company’s issued share capital.
Shareholders will be requested to renew these authorities at the AGM, details of which are set out in the notice of the meeting.
Substantial shareholdingsThe following are beneficial interests of 3% or more (where the holding is direct), or of 5% or more (where the holding is indirect), which have been notified to the Directors of the Company, in accordance with Chapter 5 of the Disclosure and Transparency Rules, of the Company’s issued ordinary share capital, the only class of voting capital, at 5 June 2017:
Direct/ Shares % of indirect 000 total
Ameriprise Indirect Financial /direct 7,539,411 13.2
Aberdeen Asset Managers Limited Indirect 5,717,089 10.0
Sir MF and Lady KA Wood Direct 3,105,530 5.4
Baillie Gifford & Co Indirect 2,917,516 5.1
Payment of suppliersThe Group does not follow a standard payment practice but agrees terms and conditions for its business transactions with each of its suppliers. Payment is then made in accordance with these terms. At 31 March 2017 trade creditors of the Company and the Group’s UK subsidiaries were equivalent to 5 days (2016: 26) and 64 days (2016: 74) of purchases respectively, based on the amounts invoiced by suppliers during the year and the amounts owed to trade creditors at the end of the year.
Charitable donationsDuring the year, the Group made charitable donations of £8,585 (2016: £2,542). There have been no political donations during the year.
Fixed assetsWhilst the market value of some fixed assets may differ from book value, the Directors believe that the differences are not material.
Disclosure of information to auditorPursuant to Section 418(2) of the Companies Act 2006 the Directors who held office at the date of approval of this Directors’ Report confirm that, so far as they are each aware, there is no relevant audit information of which the Company’s auditor is unaware; and each Director has taken all the steps that he or she might reasonably have been expected to have taken as a Director to make himself or herself aware of any relevant audit information and to establish that the Company’s auditor is aware of that information.
Annual General MeetingThe Notice of the Annual General Meeting to be held on 12 September 2017 is set out in a letter to Shareholders together with explanatory notes relating to the resolutions.
A resolution to re‑appoint KPMG LLP as Auditor and to authorise the Directors to set their remuneration will be proposed at the Annual General Meeting.
Change of control arrangementsThere are a number of agreements that take effect, alter or terminate upon a change of control of the Company following a takeover, such as banking agreements and company share plans. On a change of control, the Company’s committed credit facilities may be cancelled by lenders by giving not less than three days’ notice. It is also possible that pension plan funding arrangements would need to be changed following a change of control if that resulted in a weakening of the employer covenant.
Corporate governanceThe Board reviews its work on corporate governance in Corporate Governance on pages 44 to 51.

78 Oxford Instruments plc Report and Financial Statements 2017
Report of the Directors continued
Financial risk managementDetails of the Group’s financial risk management objectives and policies, including the exposure to price, credit and liquidity risk are set out in Note 22 to the Financial Statements.
Diversity and inclusionThe Board recognises that its employees are fundamental to the Group’s success. The Group’s aim is to ensure there are equal opportunities for all employees and that there is an inclusive culture where differences are valued and people are given the environment in which they can do their best work. Corporate Responsibility on pages 34 to 41 further describes how diversity and inclusion is managed within Oxford Instruments.
Greenhouse gas emissionsTo meet the requirements of the Companies Act 2006 (Strategic and Directors’ Report) Regulations 2013, CO2 emissions are reported on as part of our reporting on greenhouse gas emissions in Corporate Responsibility on pages 34 to 41.
Material eventsSince the year end, on 26 April 2017, the Board announced that it has agreed to sell its Industrial Analysis business to Hitachi High‑Technologies Corporation for a consideration of £80 million. The transaction is subject to regulatory approval in Austria, a share transfer filing in China and completion of a pre‑sale reorganisation to carve out the relevant businesses. Assuming satisfaction of these conditions, the transaction is expected to close in the second quarter of the 2017/18 fiscal year. Further details on the announcement can be found at www.oxford-instruments.com/investors. There were no other material events since 31 March 2017 to report.
By order of the Board
Susan Johnson-BrettCompany Secretary
13 June 2017

01: Strategic Report 02: Governance 03: Financial Statements 04: Company Information
79Oxford Instruments plc Report and Financial Statements 2017
The Directors are responsible for preparing the Annual Report and the Group and Parent Company Financial Statements in accordance with applicable law and regulations.
Company law requires the Directors to prepare Group and Parent Company Financial Statements for each financial year. Under that law they are required to prepare the Group Financial Statements in accordance with IFRSs as adopted by the EU and applicable law and have elected to prepare the Parent Company Financial Statements in accordance with UK Accounting Standards, including FRS 101 Reduced Disclosure Framework.
Under company law, the Directors must not approve the Financial Statements unless they are satisfied that they give a true and fair view of the state of affairs of the Group and Parent Company and of their profit or loss for that period. In preparing each of the Group and Parent Company Financial Statements, the Directors are required to:
• select suitable accounting policies and then apply them consistently;
• make judgements and estimates that are reasonable and prudent;
• for the Group financial statements, state whether they have been prepared in accordance with IFRSs as adopted by the EU;
• for the Parent Company Financial Statements, state whether applicable UK Accounting Standards have been followed, subject to any material departures disclosed and explained in the Parent Company Financial Statements; and
• prepare the Financial Statements on the going concern basis unless it is inappropriate to presume that the Group and the Parent Company will continue in business.
The Directors are responsible for keeping adequate accounting records that are sufficient to show and explain the Parent Company’s transactions and disclose with reasonable accuracy at any time the financial position of the Parent Company and enable them to ensure that its financial statements comply with the Companies Act 2006. They have general responsibility for taking such steps as are reasonably open to them to safeguard the assets of the Group and to prevent and detect fraud and other irregularities.
Under applicable law and regulations, the Directors are also responsible for preparing a Strategic Report, Directors’ Report, Directors’ Remuneration Report and Corporate Governance Statement that comply with that law and those regulations.
The Directors are responsible for the maintenance and integrity of the corporate and financial information included on the Company’s website. Legislation in the UK governing the preparation and dissemination of financial statements may differ from legislation in other jurisdictions.
Responsibility statement of the Directors in respect of the annual financial reportWe confirm that to the best of our knowledge:
• the Financial Statements, prepared in accordance with the applicable set of accounting standards, give a true and fair view of the assets, liabilities, financial position and profit or loss of the Company and the undertakings included in the consolidation taken as a whole; and
• the Strategic Report/Directors’ Report include a fair review of the development and performance of the business and the position of the issuer and the undertakings included in the consolidation taken as a whole, together with a description of the principal risks and uncertainties that they face.
We consider the annual report and accounts, taken as a whole, is fair, balanced and understandable and provides the information necessary for Shareholders to assess the Group’s position and performance, business model and strategy.
Signed on behalf of the Board
Ian Barkshire Gavin HillChief Executive Group Finance Director
13 June 2017
Directors’ Responsibilities in relation to the Report and Financial Statements
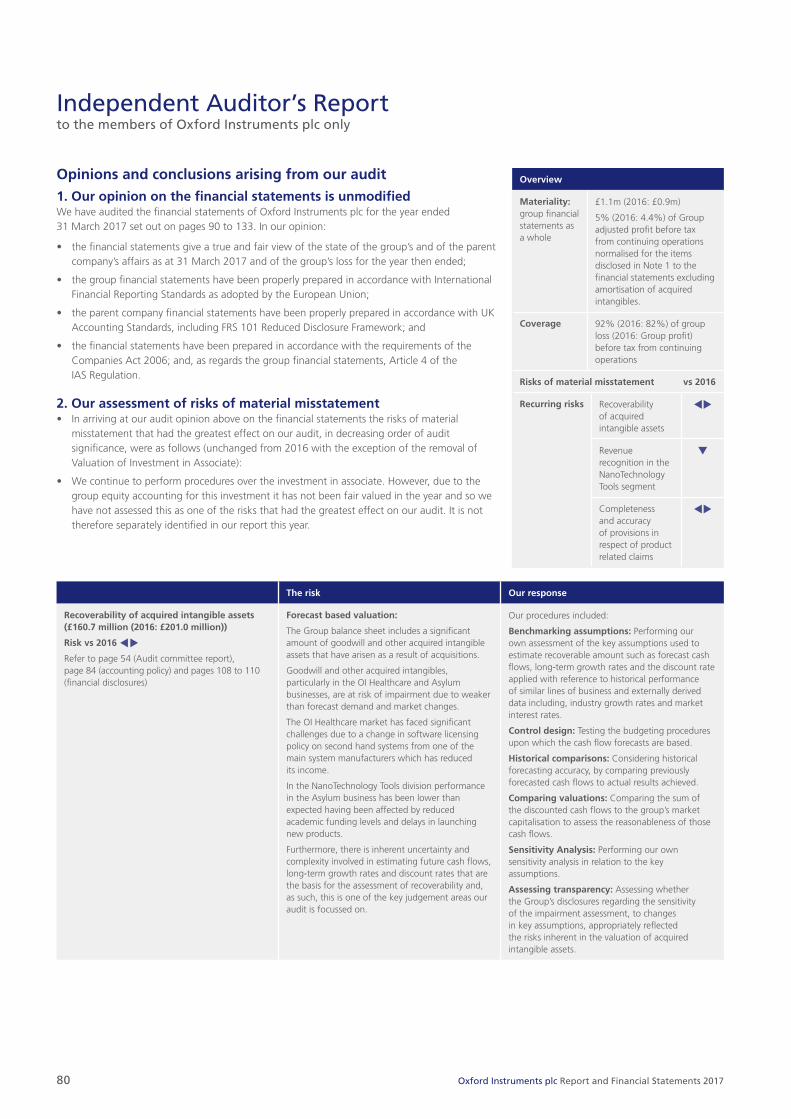
80 Oxford Instruments plc Report and Financial Statements 2017
Independent Auditor’s Report to the members of Oxford Instruments plc only
Opinions and conclusions arising from our audit1. Our opinion on the financial statements is unmodifiedWe have audited the financial statements of Oxford Instruments plc for the year ended 31 March 2017 set out on pages 90 to 133. In our opinion:
• the financial statements give a true and fair view of the state of the group’s and of the parent company’s affairs as at 31 March 2017 and of the group’s loss for the year then ended;
• the group financial statements have been properly prepared in accordance with International Financial Reporting Standards as adopted by the European Union;
• the parent company financial statements have been properly prepared in accordance with UK Accounting Standards, including FRS 101 Reduced Disclosure Framework; and
• the financial statements have been prepared in accordance with the requirements of the Companies Act 2006; and, as regards the group financial statements, Article 4 of the IAS Regulation.
2. Our assessment of risks of material misstatement• In arriving at our audit opinion above on the financial statements the risks of material
misstatement that had the greatest effect on our audit, in decreasing order of audit significance, were as follows (unchanged from 2016 with the exception of the removal of Valuation of Investment in Associate):
• We continue to perform procedures over the investment in associate. However, due to the group equity accounting for this investment it has not been fair valued in the year and so we have not assessed this as one of the risks that had the greatest effect on our audit. It is not therefore separately identified in our report this year.
The risk Our response
Recoverability of acquired intangible assets (£160.7 million (2016: £201.0 million))
Risk vs 2016 tuRefer to page 54 (Audit committee report), page 84 (accounting policy) and pages 108 to 110 (financial disclosures)
Forecast based valuation:
The Group balance sheet includes a significant amount of goodwill and other acquired intangible assets that have arisen as a result of acquisitions.
Goodwill and other acquired intangibles, particularly in the OI Healthcare and Asylum businesses, are at risk of impairment due to weaker than forecast demand and market changes.
The OI Healthcare market has faced significant challenges due to a change in software licensing policy on second hand systems from one of the main system manufacturers which has reduced its income.
In the NanoTechnology Tools division performance in the Asylum business has been lower than expected having been affected by reduced academic funding levels and delays in launching new products.
Furthermore, there is inherent uncertainty and complexity involved in estimating future cash flows, long-term growth rates and discount rates that are the basis for the assessment of recoverability and, as such, this is one of the key judgement areas our audit is focussed on.
Our procedures included:
Benchmarking assumptions: Performing our own assessment of the key assumptions used to estimate recoverable amount such as forecast cash flows, long-term growth rates and the discount rate applied with reference to historical performance of similar lines of business and externally derived data including, industry growth rates and market interest rates.
Control design: Testing the budgeting procedures upon which the cash flow forecasts are based.
Historical comparisons: Considering historical forecasting accuracy, by comparing previously forecasted cash flows to actual results achieved.
Comparing valuations: Comparing the sum of the discounted cash flows to the group’s market capitalisation to assess the reasonableness of those cash flows.
Sensitivity Analysis: Performing our own sensitivity analysis in relation to the key assumptions.
Assessing transparency: Assessing whether the Group’s disclosures regarding the sensitivity of the impairment assessment, to changes in key assumptions, appropriately reflected the risks inherent in the valuation of acquired intangible assets.
Overview
Materiality: group financial statements as a whole
£1.1m (2016: £0.9m)
5% (2016: 4.4%) of Group adjusted profit before tax from continuing operations normalised for the items disclosed in Note 1 to the financial statements excluding amortisation of acquired intangibles.
Coverage 92% (2016: 82%) of group loss (2016: Group profit) before tax from continuing operations
Risks of material misstatement vs 2016
Recurring risks Recoverability of acquired intangible assets
tu
Revenue recognition in the NanoTechnology Tools segment
q
Completeness and accuracy of provisions in respect of product related claims
tu

01: Strategic Report 02: Governance 03: Financial Statements 04: Company Information
81Oxford Instruments plc Report and Financial Statements 2017
The risk Our response
Revenue recognition in the NanoTechnology Tools segment (Revenue: £208.6 million (2016: £187.3 million))
Risk vs 2016 qThe risk has decreased in significance in comparison to the prior year as a result of a no bill and hold transactions being recorded at the period end.
Refer to page 84 (accounting policy) and pages 97 to 99 (financial disclosures)
2017/2018 sales:
There is a risk that revenue is recognised on sales of individual products produced by the Group’s NanoTechnology Tools segment before the significant risks and rewards of ownership have passed.
Given the complex nature of the products, judgement is required in determining whether the risks and rewards have passed by assessing a number of factors, notably, whether shipping terms have been met, customer acceptance of the product received and the complexity of any installation element of the sale. As such there is a risk that, revenue is recognised in the incorrect period.
Furthermore, due to the seasonality of the business, a significant proportion of NanoTechnology Tools divisional revenue is recognised in period 12 resulting in an increased risk of revenue being recognised in the incorrect period.
Consequently this is one of the key areas our audit is focussed on.
Our procedures included:
Tests of details
Testing, on a sample basis, whether specific revenue transactions around the year end had been recognised in the appropriate period by assessing whether the significant rewards of ownership had passed, with reference to, nature of products, the terms of sale within the associated contracts, the status of customer acceptance of the product and the relative complexity of product installation.
Considering whether a sample of credit notes issued after the year end should reduce revenue in the period and challenging those that were not by obtaining evidence.
Assessing a sample of year end deferred and accrued income against contractual terms and evidence of transfer of risks and rewards to determine whether revenue for this sample has been recognised in the correct period.
Completeness and accuracy of provisions in respect of product related claims
Risk vs 2016 tuRefer to page 54, page 84 (accounting policy) and page 121 (financial disclosures)
Omitted exposure:
The Group designs and builds customised, high technology products, notably in the NanoTechnology Tools segment, and as such there is a risk that the Group is subject to customer claims in respect of products not meeting contractual specifications.
In addition, since the Group’s products incorporate specific complex design features and intellectual property there is a risk that the Group inadvertently infringes the intellectual property belonging to third parties.
This could result in a material unrecorded provision for compensation required to be paid to customers or third parties respectively.
Subjective estimate:
The estimation of any provision required for product related claims is inherently subjective based on the wide range of potential outcomes.
Omitted exposure procedures:
Management enquiry: Enquiring with Group management and Group’s internal legal counsel regarding new and previously unrecorded product related claims and the likelihood of the claims.
Compliance data scrutiny: Inspecting the Group’s litigation register for unrecorded claims and assessing whether a provision is required for these claims.
Considering the specific circumstances around claims which have arisen by inspecting correspondence between the Group and other parties, such as legal advisors and customers.
Subjective estimate procedures:
Our sector experience: Challenging the reasonableness of the key assumptions made by the Group, such as potential royalty rates payable in respect of intellectual property claims, estimates of amounts payable to customers in respect of claims relating to a failure to meet bespoke product specification and likelihood of an outflow of resources, against our own expectations based on our historical knowledge, experience, and understanding.
Personnel interviews: Evaluating assumptions through discussion of claims with internal legal counsel and relevant management.
Benchmarking assumptions: Assessing the level of provisions held against the nature and status of claims, range of possible outcomes and likelihood discussed in the correspondence between the Group and legal advisors and customers.

82 Oxford Instruments plc Report and Financial Statements 2017
Independent Auditor’s Report continuedto the members of Oxford Instruments plc only
3. Our application of materiality and an overview of the scope of our auditThe materiality for the financial statements as a whole was set at £1.1 million (2016: £0.9 million). This has been determined with reference to a benchmark of group profit before tax from continuing operations normalised for the items disclosed in Note 1 to the financial statements, excluding amortisation of acquired intangibles, of £22.2 million, of which it represents 5.0% (2016: same basis, 4.4%).
We report to the audit committee any corrected or uncorrected misstatements exceeding £55,000 (2016: £45,000), in addition to other identified misstatements that warranted reporting on qualitative grounds.
Of the Group’s 70 (2016: 65) reporting components, 15 (2016: 17) were subject to audit procedures for group reporting
purposes. The components within the scope of our work accounted for 93% (2016: 93%) of total group revenue; 92% (2016: 82%) of group loss before taxation from continuing operations; and 89% (2016: 89%) of total group assets.
For the remaining components, we performed analysis at an aggregated group level to re-examine our assessment that there were no significant risks of material misstatement within these. The Group audit team instructed component auditors as to the significant areas to be covered, including the relevant risks detailed above and the information to be reported back. The Group audit team approved each component teams audit materiality, which ranged from £0.6 million to £0.8 million (2016: £0.4 million to £0.7 million), having regard to the size and risk profile of the Group across the components.
The Group audit team visited 12 (2016: 19) component locations in the UK, United States, Germany and Sweden (2016: UK, United States and Germany). The work performed for the US components was undertaken by the Group audit team. Telephone conference meetings were also held with the component auditors in China (2016: China and Japan). At these visits and meetings, the findings reported to the Group audit team were discussed in more detail, and any further work required by the Group audit team was then performed by the component auditor. The Group audit team reviewed the significant risk areas of the component audit files for individually financially significant components.
The group team performed procedures on the items excluded from normalised group profit before tax.
£1,100,000Whole financial statements materiality(2016: £900,000)
£825,000Range of materiality at 15 components (£0.6m to £0.8m) (2016: £0.4m to £0.7m)
£55,000Misstatements reported to the audit committee (2016: £45,000)
1 Normalised for the items noted in Note 1 to the financial statements, excluding amortisation of acquired intangibles.
Group PBT1
Group materiality
Group profit before tax1
£22.2m (2016: £20.3m)Materiality£1.1m (2016: £0.9m)
93%(2016: 93%)
Group revenue
In scope for Group audit purposes 2017
In scope for Group audit purposes 2016
Residual components
92%(2016: 82%)
Group loss before tax from continuing operations
89%(2016: 89%)
Group total assets

01: Strategic Report 02: Governance 03: Financial Statements 04: Company Information
83Oxford Instruments plc Report and Financial Statements 2017
4. Our opinion on other matters prescribed by the Companies Act 2006 is unmodifiedIn our opinion:
• the part of the Directors’ Remuneration Report to be audited has been properly prepared in accordance with the Companies Act 2006; and
• the information given in the Strategic Report and the Directors’ Report for the financial year is consistent with the financial statements.
Based solely on the work required to be undertaken in the course of the audit of the financial statements and from reading the Strategic Report and the Directors’ Report:
• we have not identified material misstatements in those reports; and
• in our opinion, those reports have been prepared in accordance with the Companies Act 2006.
5. We have nothing to report on the disclosures of principal risksBased on the knowledge we acquired during our audit, we have nothing material to add or draw attention to in relation to:
• the directors’ statement of viability assessment on pages 26 and 27, concerning the principal risks, their management, and, based on that, the directors’ assessment and expectations of the group’s continuing in operation over the 3 years to March 2020; or
• the disclosures on page 27 concerning the use of the going concern basis of accounting.
6. We have nothing to report in respect of the matters on which we are required to report by exceptionUnder ISAs (UK and Ireland) we are required to report to you if, based on the knowledge we acquired during our audit, we have identified other information in the annual report that contains a material inconsistency with either that knowledge or the financial statements, a material misstatement of fact, or that is otherwise misleading.
In particular, we are required to report to you if:
• we have identified material inconsistencies between the knowledge we acquired during our audit and the directors’ statement that they consider that the annual report and financial statements taken as a whole is fair, balanced and understandable and provides the information necessary for shareholders to assess the group’s position and performance, business model and strategy; or
• the Audit Committee Report does not appropriately address matters communicated by us to the audit committee.
Under the Companies Act 2006 we are required to report to you if, in our opinion:
• adequate accounting records have not been kept by the parent company, or returns adequate for our audit have not been received from branches not visited by us; or
• the parent company financial statements and the part of the Directors’ Remuneration Report to be audited are not in agreement with the accounting records and returns; or
• certain disclosures of directors’ remuneration specified by law are not made; or
• we have not received all the information and explanations we require for our audit.
Under the Listing Rules we are required to review:
• the directors’ statements, set out on pages 26 and 27, in relation to going concern and longer-term viability; and
• the part of the Corporate Governance Statement on page 44 relating to the company’s compliance with the eleven provisions of the 2014 UK Corporate Governance Code specified for our review.
We have nothing to report in respect of the above responsibilities.
Scope and responsibilitiesAs explained more fully in the Directors’ Responsibilities Statement set out on page 79, the directors are responsible for the preparation of the financial statements and for being satisfied that they give a true and fair view. A description of the scope of an audit of financial statements is provided on the Financial Reporting Council’s website at www.frc.org.uk/auditscopeukprivate. This report is made solely to the Company’s members as a body and is subject to important explanations and disclaimers regarding our responsibilities, published on our website at www.kpmg.com/uk/auditscopeukco2014a, which are incorporated into this report as if set out in full and should be read to provide an understanding of the purpose of this report, the work we have undertaken and the basis of our opinions.
Greg Watts (Senior Statutory Auditor)for and on behalf of KPMG LLP, Statutory Auditor Chartered Accountants
One Snowhill Snowhill Queensway Birmingham B4 6GH
13 June 2017

84 Oxford Instruments plc Report and Financial Statements 2017
Oxford Instruments plc (the “Company”) is a company incorporated and domiciled in the UK.
The Group Financial Statements have been prepared and approved by the Directors in accordance with International Financial Reporting Standards as adopted by the EU (“Adopted IFRS”). The Company has elected to prepare its Parent Company Financial Statements in accordance with FRS 101; these are presented on pages 124 to 133.
The accounting policies set out below have, unless otherwise stated, been applied consistently to all periods presented in these Group Financial Statements.
The Financial Statements have been prepared on a going concern basis based on the Directors’ opinion, after making reasonable enquiries, that the Group has adequate resources to continue in operational existence for the foreseeable future.
The Group’s business activities, together with the factors likely to affect its future development, performance and position, are set out in the Strategy section on pages 11 to 13. The financial position of the Group, its cash flows, liquidity position and borrowing facilities are described in the Finance Review on pages 28 to 33.
The relatively diverse nature of the Group together with its current financial strength provides a solid foundation. The Directors have reviewed the Group’s forecasts and flexed them to incorporate a number of potential scenarios relating to changes in trading performance and believe that the Group will be able to operate within its existing debt facilities which expire between February 2021 and March 2022. This review also considered hedging arrangements in place. As a consequence, the Directors believe that the Group is well placed to manage its business risks successfully. Further information can be found in the Viability Statement on page 26.
The Financial Statements were authorised for issuance on 13 June 2017.
(a) New accounting standardsThe following standards and interpretations are applicable to the Group and have been adopted as they are mandatory for the year ended 31 March 2017:
• Amendments to IFRS 2 – Share-based Payments;
• Amendments to IFRS 3 – Business Combinations;
• Amendments to IFRS 8 – Operating Segments;
• Amendments to IFRS 13 – Fair Value Measurement;
• Amendments to IAS 16 – Property, Plant and Equipment;
• Amendments to IAS 24 – Related Party Disclosures; and
• Amendments to IAS 38 – Intangible Assets.
The adoption of these standards has not had a material impact on the financial statements. There are no other new standards, amendments to standards or interpretations mandatory for the first time for the year ended 31 March 2017.
(b) Basis of preparationThe Financial Statements are presented in Sterling, rounded to the nearest £0.1m and are prepared on the historical cost basis except as described on page 85 under the heading “Financial instruments”.
The preparation of Financial Statements in conformity with adopted IFRSs requires management to make judgements, estimates and assumptions that affect the application of policies and reported amounts of assets and liabilities, income and expenses. The estimates and associated assumptions are based on historical experience and various other factors that are believed to be reasonable under the circumstances, the results of which form the basis of making the judgements about carrying values of assets and liabilities that are not readily apparent from other sources. Actual results may differ from these estimates.
The estimates and underlying assumptions are reviewed on an ongoing basis. The most significant judgements and estimates made in applying the Group accounting policies relate to:
Impairment of intangible assets (including goodwill), tangible assets and investment in associateGoodwill is held at cost and tested annually for impairment. Amortised intangibles, tangible assets and the Group’s investment in associate are tested for impairment where there are indications of impairment. These impairment tests require the Group to make an estimate of the expected cash flows and to select suitable discount rates. These require an estimation of the value in use of these assets (see Notes 7 and 17).
ProvisionsProvisions are recognised in the period when it becomes probable that there will be a future outflow of funds resulting from past expectations or events which can be reasonably estimated. The timing of recognition requires the application of judgement to existing facts and circumstances which can be subject to change. Amounts provided represent the Group’s best estimate of exposure based on currently available information.
Key assumptions surrounding estimation uncertainty relate to future warranty costs of the Group’s products, which are based on historical return rates and any known product quality issue; as well as estimating potential royalty or profit sharing rates surrounding any product-related intellectual property claims.
Revenue recognitionRevenue is recognised when, in the opinion of the Group, the significant risks and rewards of ownership have transferred to the buyer. The complex technical nature of the Group’s products, particularly in the NanoTechnology Tools sector, means that the application of judgement is required in determining whether those risks and rewards have passed by assessing a number of factors, notably whether shipping terms have been met, customer acceptance of the product received and the complexity of any installation element of the sale.
Accounting Policies

01: Strategic Report 02: Governance 03: Financial Statements 04: Company Information
85Oxford Instruments plc Report and Financial Statements 2017
The following other significant judgements and estimates were made in applying the Group accounting policies:
Measurement of defined benefit scheme liabilitiesThe Group recognises and measures costs relating to defined benefit pension schemes in accordance with IAS 19 (Revised) Employee Benefits. In applying IAS 19 (Revised) the costs are assessed in accordance with the advice of independent qualified actuaries. This requires the exercise of judgement in relation to the estimation of future changes in salaries and inflation, as well as mortality rates, expected returns on plan assets and the selection of suitable discount rates. Further detail is provided in Note 26.
Capitalised development costsCapitalised development costs involve judgements around the future economic benefits that will flow from the associated development activity and in particular the Group’s assessment of the technical and commercial feasibility of the product to be developed.
Deferred tax assetsA deferred tax asset is recognised in the period if it is probable that future taxable profits will be available against which the asset can be utilised. This requires the exercise of judgement in relation to the estimation of future taxable profit.
Revisions to accounting estimates are recognised in the period in which the estimate is revised if the revision affects only that period or in the period of the revision and future periods if the revision affects both current and future periods. The key areas where estimates have been used and assumptions applied are in the calculation of provisions, the valuation of acquired intangible assets, the impairment testing of goodwill and the estimation of defined benefit pension plan liabilities.
Contingent purchase consideration Contingent purchase consideration is measured at fair value at the date of acquisition and tested annually against the criteria for payment, with movements in fair value being recorded in the Income Statement. The key judgements involved are the estimation of future cash flows and profitability of the acquired business and the selection of a suitable discount rate.
Fair value measurements on business combinations (prior year risk only)The measurement of fair values on a business combination requires the recognition and measurement of the identifiable assets, liabilities and contingent liabilities. The key judgements involved are:
• the identification and valuation of intangible assets which require the estimation of future cash flows and the selection of a suitable discount rate (see Note 17); and
• the initial valuation of investment in Scienta Scientific AB which required the estimation of future cash flows and the selection of a suitable discount rate (see Note 7).
(c) Basis of consolidationThe Group Financial Statements include the accounts of Oxford Instruments plc and its subsidiary companies adjusted to eliminate intra-Group balances and any unrealised gains and losses or income and expenses arising from intra-Group transactions.
Subsidiaries are entities controlled by the Group. Control exists when the Group is exposed to or has rights to variable returns from its investment with the investee and has the ability to affect those returns through its power over the investee. In assessing control, potential voting rights that are currently exercisable or convertible are taken into account. The results of subsidiary companies are included in the consolidated Financial Statements from the date that control commences until the date that control ceases. The acquisition method is used to account for the acquisition of subsidiaries.
Associates are those entities in which the Group holds more than 20% of the shares and voting rights and has significant influence, but not control, over the financial and operating policies.
The Group financial information includes the Group’s share of the total comprehensive income of the associate on an equity accounted basis, from the date that significant influence commences until the date that significant influence ceases. When the Group’s share of losses exceeds its interest in associate, the Group’s carrying amount is reduced to £nil and recognition of further losses is discontinued except to the extent that the Group has incurred legal or constructive obligations or made payments on behalf of an associate.
The assets and liabilities of foreign operations, including goodwill and fair value adjustments arising on consolidation, are translated into Sterling at exchange rates ruling at the end of the reporting period. Income statements and cash flows of foreign operations are translated into Sterling at average monthly exchange rates which approximate foreign exchange rates at the date of the transaction. Foreign exchange differences arising on retranslation are recognised directly in a separate translation reserve.
(d) Foreign currencyAn individual entity’s transactions in foreign currencies are translated at the foreign exchange rate ruling at the date of the transaction. Monetary assets and liabilities denominated in foreign currencies at the reporting date are translated at the foreign exchange rate ruling at that date. Foreign exchange differences arising on translation are recognised in profit or loss. Non-monetary assets and liabilities that are measured in terms of historical cost in a foreign currency are translated using the exchange rate at the date of the transaction.
(e) Financial instrumentsFinancial assets and liabilities are recognised in the Group’s Consolidated Statement of Financial Position when the Group becomes a party to the contractual provisions of the instrument. Derivative financial instruments of the Group are used to hedge its exposure to interest rate, foreign currency and commodity pricing risks arising from operational, financing and investment activities. The Group does not hold or issue derivative financial instruments for trading purposes. All derivatives are initially recognised at fair value; attributable transaction costs are recognised in profit or loss as incurred. Derivatives comprising interest rate swaps, foreign exchange contracts and options and metal futures contracts are classified as “fair value through profit and loss” under IAS 39, unless designated as hedges. Subsequent to initial recognition, derivatives are measured at fair value and gains or losses on the settlement of such derivatives are recognised in operating expenses. Where such derivatives relate to the following year’s exposure, any gains or losses resulting from the change in fair value are taken to the mark-to-market gains/(losses) line within financial income or expense.

86 Oxford Instruments plc Report and Financial Statements 2017
Accounting Policies continued
(e) Financial instruments continuedChanges in the fair value of the derivative hedging instruments designated as cash flow hedges are recognised in equity to the extent that the hedge is effective. To the extent that the hedge is ineffective, changes in fair value are recognised in the Consolidated Statement of Income. If the hedging instrument no longer meets the criteria for hedge accounting, expires or is sold, terminated or exercised, then hedge accounting is discontinued prospectively. The cumulative gain or loss previously recognised in equity remains there until the forecast transaction occurs. When the hedged item is a non-financial asset, the amount recognised in equity is transferred to the carrying amount of the asset when it is recognised. In other cases the amount recognised in equity is transferred to the Consolidated Statement of Income in the same period that the hedged item affects profit or loss.
The fair value of interest rate swaps is based on broker quotes. Those quotes are tested for reasonableness by discounting estimated future cash flows based on the terms and maturity of each contract and using market interest rates for a similar instrument at the measurement date.
The fair value of forward exchange contracts is their market price at the Consolidated Statement of Financial Position date, being the present value of the forward price. The gain or loss on remeasurement to fair value of forward exchange contracts is recognised immediately in the Consolidated Statement of Income.
Contingent purchase consideration is measured at fair value at the date of acquisition and subsequently carried at fair value, with movements recognised in the Income Statement.
Interest-bearing borrowings are recognised initially at fair value less attributable transaction costs. Subsequent to initial recognition, interest-bearing borrowings are stated at amortised cost with any difference between cost and redemption value being recognised in profit or loss over the period of the borrowing on an effective interest basis.
(f) Property, plant and equipmentProperty, plant and equipment is stated at historical cost less provisions for impairment (see accounting policy l) and depreciation which, with the exception of freehold land which is not depreciated and rental assets (see below), is provided on a straight-line basis over each asset’s estimated economic life. Depreciation is provided based on historical cost less estimated residual value. The principal estimated economic lives used for this purpose are:
• Freehold buildings, long 50 years leasehold land and buildings
• Leasehold improvements Period (less than 50 years’ duration) of lease
• Furniture and fittings 10 years
• Machinery and other 5 to 10 equipment years
• Computer equipment 4 years
• Vehicles 4 years
Fixed assets held for rental as part of the Group’s service business are depreciated using the reducing balance method at a rate of 3% per month.
Proceeds on disposal of rental assets which have been refurbished by the Group are recorded as revenue with associated costs recorded in cost of sales. Otherwise gains and losses on disposal of an item of property, plant and equipment are determined by comparing the proceeds from disposal with the carrying amount of property, plant and equipment and are recognised in the Income Statement.
(g) Intangible assets(i) GoodwillAll business combinations are accounted for by applying the acquisition method. Goodwill represents amounts arising on acquisition of subsidiaries. In respect of business acquisitions that have occurred since 31 March 2004, goodwill represents the difference between the cost of the acquisition and the fair value of the assets, liabilities and contingent liabilities acquired. In respect of acquisitions prior to this date, goodwill is included on the basis of its deemed cost, which represents the amount recorded under previous GAAP.
The Group expenses transaction costs associated with its acquisitions and movements in liabilities relating to contingent consideration within the Income Statement in conformity with IFRS 3.
Goodwill arising on acquisitions is stated at cost less any accumulated impairment losses and allocated to cash generating units that are anticipated to benefit from the combination. It is not amortised but is tested annually for impairment (see accounting policy l), or more frequently when there is an indicator that the unit may be impaired.
(ii) Development costsResearch and Development costs are charged to the Consolidated Statement of Income in the year in which they are incurred unless development expenditure is applied to a plan or design for the production of new or substantially improved products, in which case they are capitalised. The criteria for capitalisation include demonstration of the technical feasibility of completing a new intangible asset that will be available for sale and that the asset will generate probable future economic benefits. Where expenditure meets the criteria, development costs are capitalised and amortised through the Consolidated Statement of Income over their useful economic lives.
(iii) Acquired intangible assetsAn intangible asset acquired with a subsidiary undertaking is recognised as an intangible asset if it is separable from the acquired business or arises from contractual or legal rights, is expected to generate future economic benefits and its fair value can be reliably measured. The asset is amortised through the Consolidated Statement of Income over it useful economic life.
(iv) AmortisationAmortisation of intangible assets is charged to the Consolidated Statement of Income on a systematic basis in proportion to the use of the assets over their estimated useful economic lives as follows:
• Capitalised development 3 to 5 costs years
• Technology related 5 to 12 acquired intangibles years
• Customer related 6 months acquired intangibles to 15 years
• Development costs 10 years acquired intangibles
• Software 10 years

01: Strategic Report 02: Governance 03: Financial Statements 04: Company Information
87Oxford Instruments plc Report and Financial Statements 2017
(h) Trade and other receivablesTrade and other receivables are initially recognised at fair value and subsequently stated at their amortised cost less appropriate allowances for amounts which are expected to be non-recoverable.
(i) InventoriesInventories are stated at the lower of cost and net realisable value. Cost includes materials, direct labour, an attributable proportion of production overheads based on normal operating capacity and all other expenditure incurred in acquiring the inventories and bringing them to their existing location and condition. Net realisable value is the estimated selling price in the ordinary course of business, less the estimated costs of completion and selling expenses.
Provision is made for obsolete, slow-moving and defective stock where appropriate in light of recent usage, expected future requirements, new product introduction plans and likely realisable values.
(j) Cash and cash equivalentsCash and cash equivalents are carried in the Statement of Financial Position at amortised cost.
Cash and cash equivalents comprise cash balances and call deposits and are carried at amortised cost. Bank overdrafts that are repayable on demand and form an integral part of the Group’s cash management are included as a component of cash and cash equivalents for the purpose of the Statement of Cash Flows.
(k) Non-current assets held for saleA non-current asset is classified as held for sale if its carrying amount will be recovered principally through sale rather than through continuing use, it is available for immediate sale and sale is highly probable within one year.
Immediately before classification as held for sale, the measurement of the assets is brought up-to-date in accordance with applicable IFRS. Then, on initial classification as held for sale, non-current assets are recognised at the lower of their carrying amount and fair value less costs to sell.
Impairment losses on initial classification as held for sale are included in the Consolidated Statement of Income, even when the asset has previously been revalued. The same applies to gains and losses on subsequent remeasurement.
(l) Impairment of non-current assetsAll non-current assets are tested for impairment whenever events or circumstances indicate that their carrying value may be impaired. Additionally, goodwill is subject to an annual impairment review.
For the purposes of impairment testing assets are grouped together into the smallest group of assets that generates cash flows from continuing use that are largely independent of the cash inflows from other groups of assets.
An impairment loss is recognised in the Consolidated Statement of Income as under the administration and shared services heading, to the extent that an asset’s carrying value, or a cash generating unit’s carrying value, exceeds its recoverable amount, which represents the higher of its net realisable value and its value in use. Value in use is the present value of the future cash flows expected to be derived from the asset or from the cash generating unit to which it relates. The present value is calculated using a discount rate that reflects the current market assessment of the time value of money and the risks specific to the asset concerned.
Impairment losses recognised in previous periods for an asset other than goodwill are reversed if there has been a change in estimates used to determine the asset’s recoverable amount, but only to the extent that the carrying amount of the asset does not exceed its carrying amount had the impairment loss not been recognised in previous periods. Impairment losses in respect of goodwill are not reversed.
Impairment losses recognised in respect of cash generating units are allocated first to reduce the carrying amount of any goodwill allocated to cash generating units and then to reduce the carrying amount of the other assets in the unit.
(m) Employee benefitsThe Group operates a number of defined benefit and defined contribution plans which require contributions to be made to independent trustee-administered funds.
(i) Defined contribution plansObligations for contributions to defined contribution pension plans are recognised as an expense in the Consolidated Statement of Income as incurred.
(ii) Defined benefit plansThe Group’s net obligation in respect of defined benefit pension plans is calculated separately for each plan by estimating the amount of future benefit that current and past employees have earned in return for their service in prior periods. That benefit is discounted to determine its present value and the fair value of any plan assets is deducted. The calculation is performed by a qualified actuary using the projected unit credit method.
All actuarial gains and losses in calculating the Group’s net obligation are recognised in the Consolidated Statement of Comprehensive Income in the year.
The charge to the Consolidated Statement of Income reflects the current service cost. The interest expense or income is calculated on the net defined benefit liability by applying the discount rate to the net defined benefit liability, and is included within financial expenditure or financial income in the Consolidated Statement of Income respectively.
(iii) Share-based payment transactionsThe fair value of equity-settled share option programmes is measured at grant date and charged to the Consolidated Statement of Income, with a corresponding increase in equity, on a straight-line basis over the period during which the employees become unconditionally entitled to the options. The fair value of the options granted is measured using an option valuation model, taking into account the terms and conditions upon which the options were granted.
The amount recognised as an expense is adjusted to reflect the actual number of share options that vest, except where forfeiture is only due to market performance conditions not being met.
88 Oxford Instruments plc Report and Financial Statements 2017
Accounting Policies continued
(n) ProvisionsA provision is recognised in the Consolidated Statement of Financial Position when the Group has a present legal or constructive obligation as a result of a past event and it is probable that an outflow of economic benefits will be required to settle the obligation. A provision for warranty and product related liability is recognised when the underlying products are sold. A provision for restructuring is recognised when the Group has approved a detailed and formal restructuring plan and the restructuring has either commenced or has been announced publicly. A provision for onerous contracts is recognised when the expected benefits to be derived by the Group from a contract are lower than the unavoidable cost of meeting its obligations under the contract. A provision for a claim or dispute is made when it is considered probable that an adverse outcome will occur and the amount of the loss can be reasonably estimated.
Contractual and other provisions represent the Directors’ best estimate of the cost of settling future obligations where the Directors, taking into account professional advice received, assess that it is more likely than not that such proceedings may be successful.
If the effect is material, provisions are determined by discounting the expected future cash flows at a pre-tax rate that reflects current market assessments of the time value of money and, where appropriate, the risks specific to the liabilities.
(o) Trade and other payablesTrade and other payables are initially recognised at their fair value and subsequently stated at amortised cost.
(p) Government grantsGrants from Governments are recognised at their fair value where there is a reasonable assurance that the grant will be received and the Group will comply with all attached conditions.
Government grants relating to costs are deferred and recognised in the Income Statement over the period necessary to match them with the costs they are intended to compensate. Government grants relating to property, plant and equipment are included in other current liabilities and are credited to the Income Statement on a straight-line basis over the expected useful economic lives of the related assets.
(q) Interest-bearing borrowingsInterest-bearing borrowings are recognised initially at fair value less attributable transaction costs. Subsequent to initial recognition, interest-bearing borrowings are stated at amortised cost with any difference between cost and redemption value being recognised in the Income Statement over the period of the borrowings on an effective interest basis.
(r) RevenueRevenue is recognised in the Consolidated Statement of Income when the significant risks and rewards of ownership have transferred to the buyer. In the Industrial Products segment this is generally considered to be on dispatch, as products have a low level of customisation, are manufactured on a routine basis and typically have no installation requirement. In the NanoTechnology Tools segment products are generally bespoke and customer contracts more complex. As such, there are a number of conditions which must be satisfied before revenue can be recognised. These can include: legal; contractual ownership; passing internal quality control testing; dispatch from manufacturing sites; installation at customer sites; customer inspection both before and after installation; and/or, ultimately, customer acceptance. Given these conditions, a greater degree of consideration is given as to whether the terms of sale have been met and whether revenue can be recognised for each product. In the Service segment, revenue for maintenance and support is recognised on a pro-rata basis over the length of the contract period. Revenue relating to the rental of machinery is recognised on a straight-line basis over the life of the lease. Where the Service segment makes asset sales, similar considerations as those set out for the NanoTechnology Tools segment are applied. Revenue excludes value added tax and similar sales-based taxes and is stated before commission payable to agents.
(s) Income taxIncome tax on the profit or loss for the year comprises current and deferred tax. Income tax is recognised in profit or loss except to the extent that it relates to items recognised directly in equity, in which case it is recognised in equity.
Current tax is the expected tax payable on the taxable income for the year, using tax rates enacted or substantively enacted at the reporting date, and any adjustment to tax payable in respect of previous years.
Deferred tax is recognised in respect of temporary differences between the carrying amounts of assets and liabilities for financial reporting purposes and the amounts used for taxation purposes. The following temporary differences are not provided for: the initial recognition of goodwill; the initial recognition of assets or liabilities that affect neither accounting nor taxable profit; and differences relating to investments in subsidiaries to the extent that they will probably not reverse in the future.
The amount of deferred tax provided is based on the expected manner of realisation or settlement of the carrying amount of assets and liabilities, using tax rates enacted or substantively enacted at the Statement of Financial Position date.
A deferred tax asset is recognised only to the extent that it is probable that future taxable profits will be available against which the asset can be utilised. Deferred tax assets are reduced to the extent that it is no longer probable that the related tax benefit will be realised.
Additional income taxes that arise from the distribution of dividends are recognised at the same time as the liability to pay the related dividend.
(t) Lease paymentsPayments made under operating leases are recognised in profit or loss on a straight-line basis over the term of the lease. Lease incentives received are recognised in the Income Statement as an integral part of the total lease expense.

01: Strategic Report 02: Governance 03: Financial Statements 04: Company Information
89Oxford Instruments plc Report and Financial Statements 2017
(u) Segment reportingAn operating segment is a distinguishable component of the Group that engages in business activities from which it may earn revenues and incur expenses, including any revenues and expenses that relate to transactions with any of the Group’s other components. Operating components are combined into aggregated operating segments to the extent that they have similar economic characteristics. Aggregated operating segments’ operating results are reviewed regularly by the Group’s Board of Directors to make decisions about resources to be allocated to the segment and to assess its performance, for which discrete financial information is available. Segment results that are reported to the Board include items directly attributable to a segment as well as those that can be allocated on a reasonable basis.
A reportable segment is an aggregated operating segment in respect of which revenue or profit exceeds 10% of the Group total. Discrete financial information is disclosed for each reportable segment.
(v) DividendsInterim and final dividends are recognised as a liability when they are no longer at the discretion of the Company.
(w) New standards and interpretations not yet adoptedA number of new standards, amendments to standards and interpretations have been issued by the IASB and endorsed by the EU and are effective for annual periods beginning after 1 April 2016. They have not been applied in preparing these consolidated Financial Statements. None of these standards are expected to have a significant impact on the Group Financial Statements.
A number of other new standards, amendments to standards and interpretations have been issued by the IASB, although they are not yet endorsed by the EU, and are effective for annual periods beginning after 1 April 2016. They have not been applied in preparing these consolidated Financial Statements. The standards which may be relevant to the Group are set out below:
• IAS 7 Statement of Cash Flows: which becomes mandatory for the Group’s consolidated Financial Statements for the annual period beginning on 1 April 2017. This standard is not expected to have a significant impact on the Group Financial Statements;
• IAS 12 Income Taxes: which becomes mandatory for the Group’s consolidated Financial Statements for the annual period beginning on 1 April 2017. This standard is not expected to have a significant impact on the Group Financial Statements;
• IFRS 9 Financial Instruments: which becomes mandatory for the Group’s consolidated Financial Statements for the annual period beginning on 1 April 2018 and could change the classification and measurement of financial assets;
• IFRS 15 Revenue from Contracts with Customers: which becomes mandatory for the Group’s consolidated Financial Statements for the annual period beginning 1 April 2018. The potential impact on the Group of the new standard is still being assessed; and
• IFRS 16 Leases: which becomes mandatory for the Group’s consolidated Financial Statements for the annual period beginning 1 April 2019. The potential impact on the Group of the new standard is still being assessed.

90 Oxford Instruments plc Report and Financial Statements 2017
Consolidated Statement of Income year ended 31 March 2017
2017 2016 Adjusting Adjusting Adjusted1 items1 Total Adjusted items1 Total Notes £m £m £m £m £m £m
Revenue 3 348.5 — 348.5 319.7 — 319.7
Cost of sales (166.8) — (166.8) (164.2) (1.0) (165.2)
Gross profit 181.7 — 181.7 155.5 (1.0) 154.5
Research and Development 5 (27.1) (0.7) (27.8) (23.6) — (23.6)
Selling and marketing (66.3) — (66.3) (59.4) — (59.4)
Administration and shared services (32.9) (53.4) (86.3) (31.8) (23.0) (54.8)
Share of loss of associate, net of tax 7 (0.8) (8.4) (9.2) (0.2) (1.3) (1.5)
Other operating income — — — — 4.9 4.9
Foreign exchange (12.1) — (12.1) 0.7 — 0.7
Operating profit/(loss) 42.5 (62.5) (20.0) 41.2 (20.4) 20.8
Other financial income 9 0.2 1.2 1.4 — — —
Financial income 0.2 1.2 1.4 — — —
Interest charge on pension scheme net liabilities 26 (1.1) — (1.1) (1.7) — (1.7)
Other financial expenditure 10 (5.6) (0.2) (5.8) (5.9) (3.5) (9.4)
Financial expenditure (6.7) (0.2) (6.9) (7.6) (3.5) (11.1)
Profit/(loss) before income tax 36.0 (61.5) (25.5) 33.6 (23.9) 9.7
Income tax (expense)/credit 14 (8.7) 9.1 0.4 (7.7) 5.0 (2.7)
Profit/(loss) for the year from continuing operations 27.3 (52.4) (25.1) 25.9 (18.9) 7.0
Profit/(loss) from discontinued operations after tax 8 0.7 4.1 4.8 1.9 (1.9) —
Profit/(loss) for the year attributable to equity Shareholders of the parent 28.0 (48.3) (20.3) 27.8 (20.8) 7.0
pence pence pence pence
Earnings per share
Basic earnings per share 2
From continuing operations 47.8 (44.0) 45.3 12.2
From discontinued operations 1.2 8.4 3.4 —
From profit/(loss) for the year 49.0 (35.6) 48.7 12.2
Diluted earnings per share 2
From continuing operations 47.7 (44.0) 45.2 12.3
From discontinued operations 1.2 8.4 3.4 —
From profit/(loss) for the year 48.9 (35.6) 48.6 12.3
Dividends per share
Dividends paid 15 13.0 13.0
Dividends proposed 15 13.0 13.01. Adjusted numbers are stated to give a better understanding of the underlying business performance. Details of adjusting items can be found in Note 1 to the Financial Statements.
The attached notes form part of the Financial Statements.

01: Strategic Report 02: Governance 03: Financial Statements 04: Company Information
91Oxford Instruments plc Report and Financial Statements 2017
Consolidated Statement of Comprehensive Income year ended 31 March 2017
2017 2016 Notes £m £m
(Loss)/profit for the year (20.3) 7.0
Other comprehensive income/(expense):
Items that may be reclassified subsequently to profit or loss
Gain/(loss) on effective portion of changes in fair value of cash flow hedges, net of amounts recycled 0.1 (0.1)
Foreign exchange translation differences 18.8 5.6
Net cumulative foreign exchange (gain)/loss on disposal of subsidiaries recycled to the Income Statement (5.7) 1.2
Items that will not be reclassified subsequently to profit or loss
Remeasurement gain in respect of post-retirement benefits 26 4.4 13.6
Tax on items that will not be reclassified to profit or loss 14 (0.9) (2.6)
Total other comprehensive income 16.7 17.7
Total comprehensive (expense)/income for the year attributable to equity Shareholders of the parent (3.6) 24.7

92 Oxford Instruments plc Report and Financial Statements 2017
Consolidated Statement of Financial Position as at 31 March 2017
2017 2016 Notes £m £m
Assets
Non-current assets
Property, plant and equipment 16 32.5 35.2
Intangible assets 17 181.0 220.8
Investment in associate 7 3.9 13.1
Long-term receivables 3.6 3.4
Deferred tax assets 18 26.0 19.0
247.0 291.5
Current assets
Inventories 19 53.9 61.1
Trade and other receivables 20 81.1 77.5
Current income tax recoverable 4.2 2.7
Derivative financial instruments 23 0.6 1.5
Cash and cash equivalents 27.2 21.8
167.0 164.6
Total assets 414.0 456.1
Equity
Capital and reserves attributable to the Company’s equity Shareholders
Share capital 24 2.9 2.9
Share premium 61.5 61.5
Other reserves 0.2 0.1
Translation reserve 22.8 9.7
Retained earnings 45.1 68.8
132.5 143.0
Liabilities
Non-current liabilities
Bank loans and overdrafts 25 129.6 147.0
Retirement benefit obligations 26 25.1 35.0
Deferred tax liabilities 18 5.6 5.7
160.3 187.7
Current liabilities
Bank loans and overdrafts 25 6.9 3.0
Trade and other payables 27 93.0 102.4
Current income tax payables 6.5 2.1
Derivative financial instruments 23 5.0 5.8
Provisions 28 9.8 12.1
121.2 125.4
Total liabilities 281.5 313.1
Total liabilities and equity 414.0 456.1
The Financial Statements were approved by the Board of Directors on 13 June 2017 and signed on its behalf by:
Ian Barkshire Gavin HillDirector Director
Company number: 775598

01: Strategic Report 02: Governance 03: Financial Statements 04: Company Information
93Oxford Instruments plc Report and Financial Statements 2017
Consolidated Statement of Changes in Equity year ended 31 March 2017
Foreign Share exchange Share premium Other translation Retained capital account reserves reserve earnings Total £m £m £m £m £m £m
Balance at 1 April 2016 2.9 61.5 0.1 9.7 68.8 143.0
Total comprehensive income/(expense):
Loss for the year — — — — (20.3) (20.3)
Other comprehensive income:
– Foreign exchange translation differences — — — 18.8 — 18.8
– Net foreign exchange gain on disposal of subsidiaries recycled to the Income Statement — — — (5.7) — (5.7)
– Gain on effective portion of changes in fair value of cash flow hedges, net of amounts recycled — — 0.1 — — 0.1
– Remeasurement gain in respect of post-retirement benefits — — — — 4.4 4.4
– Tax on items recognised directly in other comprehensive income — — — — (0.9) (0.9)
Total comprehensive income/(expense) attributable to equity Shareholders of the parent — — 0.1 13.1 (16.8) (3.6)
Transactions with owners recorded directly in equity:
– Charge in respect of employee service costs settled by award of share options — — — — 0.5 0.5
– Dividends paid — — — — (7.4) (7.4)
Total transactions with owners recorded directly in equity — — — — (6.9) (6.9)
Balance at 31 March 2017 2.9 61.5 0.2 22.8 45.1 132.5
Foreign Share exchange Share premium Other translation Retained capital account reserves reserve earnings Total £m £m £m £m £m £m
Balance at 1 April 2015 2.9 61.5 0.2 2.9 58.0 125.5
Total comprehensive income:
Profit for the year — — — — 7.0 7.0
Other comprehensive income:
– Foreign exchange translation differences — — — 5.6 — 5.6
– Net foreign exchange loss on disposal of subsidiaries taken to the Income Statement — — — 1.2 — 1.2
– Loss on effective portion of changes in fair value of cash flow hedges, net of amounts recycled — — (0.1) — — (0.1)
– Remeasurement gain in respect of post-retirement benefits — — — — 13.6 13.6
– Tax on items recognised directly in other comprehensive income — — — — (2.6) (2.6)
Total comprehensive income/(expense) attributable to equity Shareholders of the parent — — (0.1) 6.8 18.0 24.7
Transactions with owners recorded directly in equity:
– Charge in respect of employee service costs settled by award of share options — — — — 0.4 0.4
– Dividends paid — — — — (7.6) (7.6)
Total transactions with owners recorded directly in equity — — — — (7.2) (7.2)
Balance at 31 March 2016 2.9 61.5 0.1 9.7 68.8 143.0
Other reserves comprise the capital redemption reserve, which represents the nominal value of shares repurchased and then cancelled during the year ended 31 March 1999, and the hedging reserve in respect of the effective portion of changes in value of commodity contracts.
The foreign exchange translation reserve comprises all foreign exchange differences arising since 1 April 2004 from the translation of the Group’s net investments in foreign subsidiaries into Sterling.
The Group holds 183,145 (2016: 183,145) of its own shares in an employee benefit trust. The cost of these shares is included within retained earnings. There was no movement in the shares held by the trust during the year.

94 Oxford Instruments plc Report and Financial Statements 2017
Consolidated Statement of Cash Flows year ended 31 March 2017
2017 2016 £m £m
(Loss)/profit for the year from continuing operations (25.1) 7.0
Adjustments for:
Income tax expense (0.4) 2.7
Net financial expense 5.5 11.1
Acquisition related fair value adjustments to inventory — 0.2
Acquisition related fair value adjustments to property, plant and equipment — 0.8
Acquisition related costs 1.5 2.5
Restructuring costs 0.6 2.9
Restructuring costs – relating to associate 0.4 1.3
Impairment of capitalised development costs 0.7 —
Loss on disposal of subsidiary 0.4 0.9
Contingent consideration deemed no longer payable — (4.9)
Impairment of investment in associate 8.0 —
Amortisation and impairment of acquired intangibles 48.7 16.7
One off impairment of capitalised intangible software costs 2.2 —
Depreciation of property, plant and equipment 5.7 5.5
Amortisation of capitalised development costs 4.8 3.9
Adjusted earnings before interest, tax, depreciation and amortisation 53.0 50.6
Loss on disposal of property, plant and equipment 0.5 0.1
Cost of equity settled employee share schemes 0.5 0.4
Share of loss from associate 0.8 0.2
Acquisition related costs paid (1.2) (1.8)
Restructuring costs paid (1.3) (4.7)
Foreign currency loss on intra-Group dividends (0.8) —
Cash payments to the pension scheme more than the charge to operating profit (6.9) (6.7)
Operating cash flows before movements in working capital 44.6 38.1
(Increase)/decrease in inventories (1.5) 1.1
Decrease in receivables 0.6 7.4
(Decrease)/increase in payables and provisions (4.5) 2.2
Increase/(decrease) in customer deposits 1.0 (2.3)
Purchase of rental assets held for subsequent sale (1.0) (3.0)
Cash generated from operations 39.2 43.5
Interest paid (5.0) (5.6)
Income taxes paid (2.1) (3.5)
Net cash from operating activities 32.1 34.4
Cash flows from investing activities
Acquisition of subsidiaries, net of cash acquired (9.8) (27.1)
Acquisition of property, plant and equipment (3.5) (2.2)
Acquisition of intangible assets (0.1) (0.2)
Net cash flow on disposal of subsidiary 12.2 0.6
Capitalised development expenditure (7.9) (8.2)
Net cash used in investing activities (9.1) (37.1)
Cash flows from financing activities
Increase in long-term receivables — (3.0)
(Decrease)/increase in borrowings (12.8) 4.6
Dividends paid (7.4) (7.6)
Net cash from financing activities (20.2) (6.0)
Net increase/(decrease) in cash and cash equivalents from continuing operations 2.8 (8.7)
Increase in cash from discontinued operations 1.4 4.9
Cash and cash equivalents at beginning of the year 20.4 25.1
Effect of exchange rate fluctuations on cash held 1.9 (0.9)
Cash and cash equivalents at end of the year 26.5 20.4

01: Strategic Report 02: Governance 03: Financial Statements 04: Company Information
95Oxford Instruments plc Report and Financial Statements 2017
Reconciliation of changes in cash and cash equivalents to movement in net debt 2017 2016 £m £m
Increase/(decrease) in cash and cash equivalents 4.2 (3.8)
Effect of foreign exchange rate changes on cash and cash equivalents 1.9 (0.9)
6.1 (4.7)
Cash outflow/(inflow) from decrease/increase in debt 12.8 (4.6)
Movement in net debt in the year 18.9 (9.3)
Net debt at start of the year (128.2) (118.9)
Net debt at the end of the year (109.3) (128.2)

96 Oxford Instruments plc Report and Financial Statements 2017
Notes to the Financial Statements year ended 31 March 2017
1 Non-GAAP measures The Directors present the following non-GAAP measures as they consider that they give a better indication of the underlying performance of the business.
Reconciliation between profit before income tax and adjusted profit from continuing operations
2017 2016 (Loss)/profit Operating before Operating Profit before (loss)/profit income tax profit income tax £m £m £m £m
Statutory measure from continuing operations (20.0) (25.5) 20.8 9.7
Reversal of acquisition related fair value adjustments to inventory — — 0.2 0.2
Reversal of acquisition related fair value adjustments to property, plant and equipment — — 0.8 0.8
Acquisition related costs 1.5 1.5 2.5 2.5
Restructuring costs 0.6 0.6 2.9 2.9
Restructuring costs – relating to associate 0.4 0.4 1.3 1.3
Loss on disposal of subsidiary 0.4 0.4 0.9 0.9
Contingent consideration deemed no longer payable — — (4.9) (4.9)
Unwind of discount in respect of contingent consideration and acquisition related accruals — 0.2 — 0.8
Non-recurring and acquisition related items 2.9 3.1 3.7 4.5
Impairment of acquired intangibles 34.9 34.9 — —
Impairment of investment in associate 8.0 8.0 — —
Impairment of capitalised development costs 0.7 0.7 — —
Impairment of capitalised software costs 2.2 2.2 — —
Amortisation of acquired intangibles 13.8 13.8 16.7 16.7
Mark-to-market (gain)/loss in respect of derivative financial instruments — (1.2) — 2.7
Adjusted measure from continuing operations 42.5 36.0 41.2 33.6
Share of taxation — (8.7) — (7.7)
Adjusted profit for the year from continuing operations — 27.3 — 25.9
Acquisition related costs comprise professional fees incurred in relation to mergers and acquisitions activity and any consideration which, under IFRS 3 (revised), falls to be treated as a post-acquisition employment expense.
Restructuring costs comprise one-off costs in respect of the cost reduction programme which began in March 2015. Restructuring costs relating to the Group’s associate relate to exceptional costs incurred by the associate arising from the merger of the Scienta and Omicron businesses.
During the year the Group settled various claims totalling £0.4m relating to the disposal of its Omicron business in the prior year. In the prior year the Group made a loss on disposal of £0.9m in respect of the disposal on Omicron.
In order to assist with comparability between peers, adjusted profit excludes the non-cash amortisation and impairment of acquired intangible assets and goodwill and the unwind of discounts in respect of contingent consideration relating to business combinations.
During the year the Group recognised an impairment of £8.0m relating to its equity accounted associate investment. See Note 7 for further details
The one off impairment of capitalised development costs relates to a specific internal systems project that has been stopped as the Group focuses and directs resources so as to accelerate key projects.
The one off impairment of capitalised software costs has been carried out following a reassessment of the future value expected to be derived from internally developed software.
The Group reports ineffectiveness of its hedging as an adjusting item. In the current year this includes losses on certain contracts relating to the hedging of the Japanese Yen which were not required for ordinary trading and which were re-allocated for use against the remittance of net income of the Group’s Japan operations. Additionally, under IAS 39, all derivative financial instruments are recognised initially at fair value. Subsequent to initial recognition, they are also measured at fair value. In respect of instruments used to hedge foreign exchange risk and interest rate risk the Group does not take advantage of the hedge accounting rules provided for in IAS 39 since that standard requires certain stringent criteria to be met in order to hedge account, which, in the particular circumstances of the Group, are considered by the Board not to bring any significant economic benefit. Accordingly, the Group accounts for these derivative financial instruments at fair value through profit or loss. To the extent that instruments are hedges of future transactions, adjusted profit for the year is stated before changes in the valuation of these instruments so that the underlying performance of the Group can be more clearly seen.

01: Strategic Report 02: Governance 03: Financial Statements 04: Company Information
97Oxford Instruments plc Report and Financial Statements 2017
In the prior year:
• the reversal of acquisition related fair value adjustments to inventory and property, plant and equipment were excluded from adjusted profit to provide a measure that includes results from acquired businesses on a consistent basis over time to assist comparison of performance; and
• £4.9m was released relating to contingent consideration on the acquisition of Asylum Research Corporation following the end of the earnout period.
2 Earnings per shareThe calculation of basic and adjusted earnings per share is based on the profit for the year as shown in the Consolidated Statement of Income and the adjusted profit for the year as shown in Note 1 respectively. Basic and adjusted earnings are divided by the weighted average number of ordinary shares outstanding during the year, excluding shares held by the Employee Share Ownership Trust.
2017 2016 £m £m
Basic (loss)/earnings from continuing operations (25.1) 7.0
Basic earnings from discontinued operations 4.8 —
Basic (loss)/earnings (20.3) 7.0
Adjusted earnings (Note 1) 28.0 27.8
Weighted average number of shares 57.1 57.1
2017 2016 pence pence
Basic (loss)/earnings per share from continuing operations (44.0) 12.2
Basic earnings per share from discontinued operations 8.4 —
Basic (loss)/earnings per share (35.6) 12.2
Adjusted earnings per share 49.0 48.6
The weighted average number of shares used in the calculation excludes shares held by the Employee Share Ownership Trust, as follows:
2017 2016 Shares Shares million million
Weighted average number of shares outstanding 57.3 57.3
Less shares held by Employee Share Ownership Trust (0.2) (0.2)
Weighted average number of shares used in calculation of basic earnings per share 57.1 57.1
The following table shows the effect of share options on the calculation of diluted earnings per share:
2017 2016 Shares Shares million million
Weighted average number of ordinary shares per basic earnings per share calculations 57.1 57.1
Effect of shares under option 0.1 0.1
Weighted average number of ordinary shares per diluted earnings per share calculations 57.2 57.2
Adjusted diluted earnings per share has been calculated in a manner consistent with previous periods.
3 Segment informationThe Group has seven operating segments. These operating segments have been combined into three aggregated operating segments to the extent that they have similar economic characteristics, with relevance to products and services, type and class of customer, methods of sale and distribution and the regulatory environment in which they operate. Each of these three aggregated operating segments is a reportable segment.
The Group’s internal management structure and financial reporting systems differentiate the three aggregated operating segments on the basis of the economic characteristics discussed below:
• the NanoTechnology Tools segment contains a group of businesses, supplying similar products, characterised by a high degree of customisation and high unit prices. These are the Group’s highest technology products serving research customers in both the public and private sectors;
• the Industrial Products segment contains a group of businesses supplying high technology products and components manufactured in medium volume for industrial customers; and
• the Service segment contains the Group’s service, rental and refurbished asset sales business as well as service revenues from other parts of the Group.
Reportable segment results include items directly attributable to a segment as well as those which can be allocated on a reasonable basis. Inter-segment pricing is determined on an arm’s length basis. The operating results of each are regularly reviewed by the Chief Operating Decision Maker, which is deemed to be the Board of Directors. Discrete financial information is available for each segment and used by the Board of Directors for decisions on resource allocation and to assess performance. No asset information is presented below as this information is not presented in reporting to the Group’s Board of Directors.

98 Oxford Instruments plc Report and Financial Statements 2017
Notes to the Financial Statements continued year ended 31 March 2017
3 Segment information continued
a) Analysis by business NanoTechnology Industrial Results from continuing operations Tools Products Service Total Year to 31 March 2017 £m £m £m £m
External revenue 208.6 56.7 83.2 348.5
Inter-segment revenue 0.1 — —
Total segment revenue 208.7 56.7 83.2
Segment adjusted operating profit from continuing operations 25.6 1.7 15.2 42.5
NanoTechnology Industrial Results from continuing operations Tools Products Service Total Year to 31 March 2016 £m £m £m £m
External revenue 187.3 54.0 78.4 319.7
Inter-segment revenue 0.1 — —
Total segment revenue 187.4 54.0 78.4
Segment adjusted operating profit from continuing operations 21.3 1.1 18.8 41.2
The adjusted loss after tax of £0.8m (2016: £0.2m) from the Group’s associate is reported within the NanoTechnology Tools segment.
Included in the Service sector is revenue from equipment sales of £5.6m (2016: £13.8m) and from equipment leasing of £9.0m (2016: £8.1m).
Reconciliation of reportable segment profit NanoTechnology Industrial Unallocated Tools Products Service Group items Total Year to 31 March 2017 £m £m £m £m £m
Adjusted profit for reportable segments from continuing operations 25.6 1.7 15.2 — 42.5
Acquisition related costs (0.3) (1.2) — — (1.5)
Restructuring costs — (0.2) (0.4) — (0.6)
Restructuring costs – relating to associate (0.4) — — — (0.4)
Impairment of capitalised development costs (0.7) — — — (0.7)
Loss on disposal of subsidiary (0.4) — — — (0.4)
Impairment of investment in associate (8.0) — — — (8.0)
Impairment of capitalised software costs — — — (2.2) (2.2)
Amortisation of acquired intangibles (10.6) (1.3) (1.9) — (13.8)
Impairment of acquired intangibles (22.6) (1.1) (11.2) — (34.9)
Financial income — — — 1.4 1.4
Financial expenditure — — — (6.9) (6.9)
(Loss)/profit before income tax on continuing operations (17.4) (2.1) 1.7 (7.7) (25.5)
NanoTechnology Industrial Unallocated Tools Products Service Group items Total Year to 31 March 2016 £m £m £m £m £m
Adjusted profit for reportable segments from continuing operations 21.3 1.1 18.8 — 41.2
Reversal of acquisition related fair value adjustments to inventory — — (0.2) — (0.2)
Reversal of acquisition related fair value adjustments to property, plant and equipment — — (0.8) — (0.8)
Acquisition related costs (1.7) (0.1) (0.7) — (2.5)
Restructuring costs (2.5) (0.1) (0.3) — (2.9)
Restructuring costs – relating to associate (1.3) — — — (1.3)
Loss on disposal of subsidiary (0.9) — — — (0.9)
Contingent consideration deemed no longer payable 4.9 — — — 4.9
Amortisation of acquired intangibles (10.8) (4.0) (1.9) — (16.7)
Financial income — — — — —
Financial expenditure — — — (11.1) (11.1)
Profit/(loss) before income tax on continuing operations 9.0 (3.1) 14.9 (11.1) 9.7
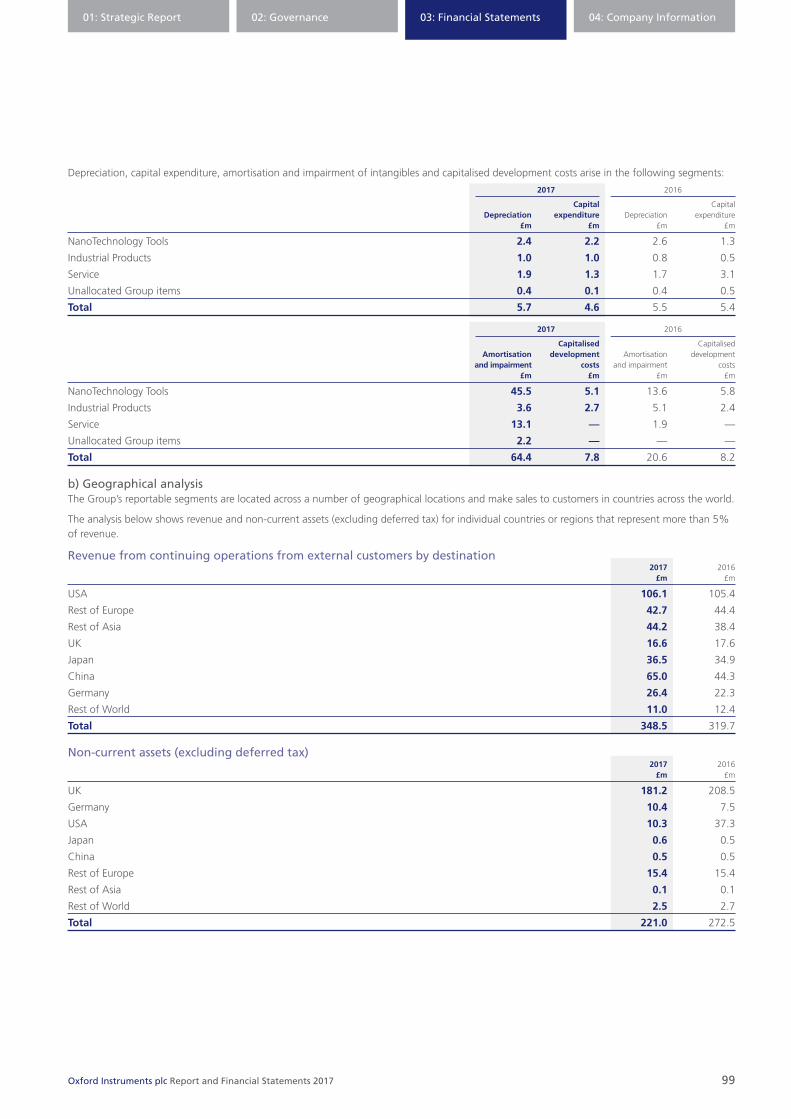
01: Strategic Report 02: Governance 03: Financial Statements 04: Company Information
99Oxford Instruments plc Report and Financial Statements 2017
Depreciation, capital expenditure, amortisation and impairment of intangibles and capitalised development costs arise in the following segments:
2017 2016 Capital Capital Depreciation expenditure Depreciation expenditure £m £m £m £m
NanoTechnology Tools 2.4 2.2 2.6 1.3
Industrial Products 1.0 1.0 0.8 0.5
Service 1.9 1.3 1.7 3.1
Unallocated Group items 0.4 0.1 0.4 0.5
Total 5.7 4.6 5.5 5.4
2017 2016 Capitalised Capitalised Amortisation development Amortisation development and impairment costs and impairment costs £m £m £m £m
NanoTechnology Tools 45.5 5.1 13.6 5.8
Industrial Products 3.6 2.7 5.1 2.4
Service 13.1 — 1.9 —
Unallocated Group items 2.2 — — —
Total 64.4 7.8 20.6 8.2
b) Geographical analysisThe Group’s reportable segments are located across a number of geographical locations and make sales to customers in countries across the world.
The analysis below shows revenue and non-current assets (excluding deferred tax) for individual countries or regions that represent more than 5% of revenue.
Revenue from continuing operations from external customers by destination 2017 2016 £m £m
USA 106.1 105.4
Rest of Europe 42.7 44.4
Rest of Asia 44.2 38.4
UK 16.6 17.6
Japan 36.5 34.9
China 65.0 44.3
Germany 26.4 22.3
Rest of World 11.0 12.4
Total 348.5 319.7
Non-current assets (excluding deferred tax) 2017 2016 £m £m
UK 181.2 208.5
Germany 10.4 7.5
USA 10.3 37.3
Japan 0.6 0.5
China 0.5 0.5
Rest of Europe 15.4 15.4
Rest of Asia 0.1 0.1
Rest of World 2.5 2.7
Total 221.0 272.5

100 Oxford Instruments plc Report and Financial Statements 2017
Notes to the Financial Statements continued year ended 31 March 2017
4 Auditor’s remuneration 2017 2016 £’000 £’000
Audit of these Financial Statements 140 150
Amounts received by the auditor and its associates in respect of:
– Audit of Financial Statements of subsidiaries pursuant to legislation 281 287
– Taxation compliance services 25 14
– Audit related services 27 27
– Services related to corporate finance transactions 90 —
Total fees paid to the auditor and its associates 563 478
5 Research and Development (“R&D”)The total R&D spend by the Group is as follows: 2017 2016 NanoTechnology Industrial NanoTechnology Industrial Tools Products Total Tools Products Total £m £m £m £m £m £m
R&D expense charged to the Consolidated Statement of Income 21.0 6.8 27.8 17.6 6.0 23.6
Less: depreciation of R&D related fixed assets (0.1) — (0.1) — (0.8) (0.8)
Add: amounts capitalised as fixed assets 0.1 0.1 0.2 0.1 1.1 1.2
Less: amortisation and impairment of R&D costs previously capitalised as intangibles (4.3) (1.2) (5.5) (2.8) (1.1) (3.9)
Add: amounts capitalised as intangible assets 5.3 2.6 7.9 5.8 2.4 8.2
Total cash spent on R&D during the year 22.0 8.3 30.3 20.7 7.6 28.3
In the prior year, a £0.6m impairment of capitalised development costs was included within administration and shared services in the Consolidated Statement of Income relating to the refocusing of the Plasma Technology business.
6 Acquisitions – prior period onlyMedical Imaging Resources, IncOn 1 May 2015 the Group acquired 100% of the issued share capital of Medical Imaging Resources, Inc (“MIR”) for a net cash consideration of £8.7m. Further contingent consideration of up to £6.3m was payable based on the performance of the Oxford Instruments Healthcare business in the year to 31 March 2016. MIR specialises in the build, lease, service and sale of mobile medical imaging labs.
The book and fair values of the assets and liabilities acquired are given in the table below. Fair value adjustments have been made to better align the accounting policies of the acquired business with the Group accounting policies and to reflect the fair value of assets and liabilities acquired. The business was acquired for the purpose of integrating into the Oxford Instruments Healthcare business where it was believed that a number of synergies could be obtained. Book value Adjustments Fair value £m £m £m
Intangible fixed assets — 5.7 5.7
Tangible fixed assets 3.8 0.5 4.3
Inventories 1.4 0.1 1.5
Trade and other receivables 0.9 — 0.9
Trade and other payables (1.7) — (1.7)
Deferred tax 0.2 (0.4) (0.2)
Net debt (2.6) — (2.6)
Net assets acquired 2.0 5.9 7.9
Goodwill 4.5
Total consideration 12.4
Net debt acquired 2.6
Contingent consideration at acquisition (6.3)
Net cash outflow relating to the acquisition 8.7
The goodwill arising is not tax deductible and is considered to represent the value of the acquired workforce and synergistic benefits expected to arise from the acquisition. No deferred tax liability was recognised relating to the fair value of acquired intangibles due to the Company making a Section 338 election in the USA to treat this acquisition as a trade and assets purchase for tax purposes.

01: Strategic Report 02: Governance 03: Financial Statements 04: Company Information
101Oxford Instruments plc Report and Financial Statements 2017
Contingent consideration of £6.5m was paid during May 2016 based on the performance of the Oxford Instruments Healthcare business in the year to 31 March 2016. The difference of £0.2m between contingent consideration provided at acquisition and that paid in May 2016 was due to foreign currency movements.
The book value of receivables in the tables above represents the gross contractual amounts receivable.
7 Investment in associateDuring the prior year the Group entered into a strategic alliance with GD Intressenter AB of Sweden (“GDI”) to create the world’s largest company in the highly specialised ultra high vacuum surface science field. The alliance comprised Oxford Instruments’ Omicron Nanotechnology GmbH (“Omicron”) and associated subsidiaries and GDI’s Scienta Scientific AB (“Scienta”) and associated subsidiaries. Scienta Scientific AB is registered and has its principal place of business in Sweden.
In consideration for new shares in Scienta, Oxford Instruments transferred all of its shares in the capital of Omicron to Scienta. Oxford Instruments holds a 47% interest in the ordinary share capital of Scienta and GDI holds 53%. The investment has been accounted for as an associate taking into account the following factors:
• the Group holds substantial, but minority, voting rights (47%). All other rights are controlled by a single shareholder;
• the Group has a minority number of Non-Executive Board seats (two of five), with the remaining seats held by representatives of GDI; and
• whilst the Group has certain veto rights in respect of certain decisions, it cannot unilaterally direct the activities of the Scienta Group.
The book value of the net assets disposed of was £14.9m. The value of the shareholding acquired in Scienta was considered to be £14.6m and as a result an £0.3m loss on disposal arose on the transaction in 2015/16.
During the current year the Group:
• settled various claims totalling £0.4m relating to the disposal of its Omicron business in the prior year.; and
• recognised an impairment charge of £8.0m in respect of its investment in Scienta.
The Group’s share of loss in its equity accounted associate for the year was £1.2m (2016: £1.5m). The Group did not receive any dividends from the associate in either period. 2017 2016 £m £m
Carrying value at 1 April 2016 13.1 —
Addition — 14.6
Share of loss of associate (net of tax) (1.2) (1.5)
Impairment charge (8.0) —
Dividends received — —
Carrying value at 31 March 2017 3.9 13.1
During the year the Group recognised an impairment charge of £8.0m relating to its investment in ScientaOmicron due to the associate’s financial performance for the year ended 31 December 2016 and lower projected cash flows. This resulted in a reassessment of ScientaOmicron’s expected future business performance and the actions and time required to improve profitability and operational efficiency.
The £8.0m impairment has been reported in the results of the NanoTechnology Tools segment. As at 31 March 2017, the estimate of the recoverable amount of the Group’s investment in ScientaOmicron, being its value in use, was calculated as £3.9m. The pre-tax discount rate used to arrive at this estimate was 15.5%.
Summary financial information for the equity accounted associate is as follows: 2017 2016 £m £m
Non-current assets 3.5 3.2
Current assets 25.0 27.0
Total assets 28.5 30.2
Current liabilities (21.7) (21.4)
Non-current liabilities (3.6) (4.0)
Total liabilities (25.3) (25.4)
Net assets 3.2 4.8
Income 50.8 34.0
Expenses (53.3) (37.2)
Loss for the year (2.5) (3.2)
Group’s share of net assets 1.5 2.3
Group’s share of loss (1.2) (1.5)
According to the terms of the transaction, no dividend could be paid by the associate until 27 May 2017. Following that date, any dividend paid must be agreed by both Oxford Instruments plc and GD Intressenter AB, up to a maximum of 50% of the previous year’s profit after tax. At the date of signing these Financial Statements no dividend has been declared or paid.

102 Oxford Instruments plc Report and Financial Statements 2017
Notes to the Financial Statements continued year ended 31 March 2017
8 Disposal of subsidiary and discontinued operationsOn 17 November 2016 the Group disposed of its Superconducting Wire business for a final consideration of £14.0m. In the prior year, on 23 November 2015, the Group disposed of its Austin Scientific business for a final consideration of £0.6m.
Effect of disposal on the financial position of the Group Superconducting Wire Austin Scientific 2017 2016 £m £m
Other intangible assets — (1.7)
Property, plant and equipment (3.1) (0.2)
Inventory (12.6) (1.4)
Trade and other receivables (6.5) (0.5)
Cash and cash equivalents (0.3) —
Trade and other payables 6.6 0.3
Provisions 0.1 —
Net assets divested (15.8) (3.5)
Consideration receivable 14.0 0.6
Deferred consideration (1.0) —
Consideration received, satisfied in cash 13.0 0.6
Cash disposed of (0.3) —
Transaction expenses (0.5) (0.1)
Net cash inflow 12.2 0.5
Carrying value of net assets disposed of (excluding cash and cash equivalents) (15.5) (3.5)
Deferred consideration 1.0 —
Impairment of net assets to fair value less costs to sell — 2.8
Recognition of provision on disposal (0.2) —
Currency translation differences transferred from translation reserve 5.7 0.7
Gain on disposal before impairment 3.2 0.5
Less impairment loss — (2.8)
Gain/(loss) on disposal 3.2 (2.3)
Tax credit on gain/loss on disposal 0.9 0.4
Gain/(loss) on disposal net of tax 4.1 (1.9)
Discontinued operationsIn the year to 31 March 2017 the Group’s Superconducting Wire business was classified as a discontinued operation; and in the year to 31 March 2016 the Group’s Austin Scientific business was classified as a discontinued operation. They were considered major classes of business on the basis that they were previously operating segments and referred to in the Group Strategic Report.
The 2016 Financial Statements have been re-presented to reflect the classification of the Group’s Superconducting Wire business as a discontinued operation.
Results of discontinued operations – Superconducting Wire 2017 2016 £m £m
Revenue 22.2 41.9
Expenses (20.9) (38.5)
Adjusted profit from operating activities before income tax 1.3 3.4
Income tax charge (0.4) (1.2)
Adjusted profit from operating activities after tax 0.9 2.2
Profit on disposal 3.2 —
Tax on profit on disposal 0.9 —
Profit from discontinued operations after tax 5.0 2.2

01: Strategic Report 02: Governance 03: Financial Statements 04: Company Information
103Oxford Instruments plc Report and Financial Statements 2017
Results of discontinued operations – Austin Scientific 2017 2016 £m £m
Revenue — 2.3
Expenses (0.2) (2.8)
Adjusted loss from operating activities before income tax (0.2) (0.5)
Income tax credit — 0.2
Adjusted loss from operating activities after tax (0.2) (0.3)
Loss on disposal — (2.3)
Tax on loss on disposal — 0.4
Loss from discontinued operations after tax (0.2) (2.2)
Earnings per share from discontinued operations 2017 2016 pence pence
Adjusted basic earnings per share 1.2 3.4
Adjusted diluted earnings per share 1.2 3.4
Total basic earnings per share 8.4 —
Total diluted earnings per share 8.4 —
Cash flows from discontinued operations 2017 2016 £m £m
Net cash generated from operating activities 1.4 5.2
Net cash used in investing activities — (0.3)
Net cash used in financing activities — —
Net cash flows 1.4 4.9
9 Financial income 2017 2016 £m £m
Interest receivable 0.2 —
Fair value movement on derivative financial instruments 1.2 —
1.4 —
10 Financial expenditure 2017 2016 £m £m
Interest payable 5.6 5.9
Interest charge on pension scheme net liabilities 1.1 1.7
Unwind of discount on contingent consideration 0.2 0.6
Unwind of discount on accrued expenses — 0.2
Fair value movement on derivative financial instruments — 2.7
6.9 11.1
11 Personnel costs 2017 2016 £m £m
Wages and salaries 98.7 90.6
Social security costs 10.8 9.3
Contributions to defined contribution pension plans 4.3 4.4
Charge in respect of employee share options 0.5 0.4
114.3 104.7
Directors’ emoluments are disclosed in the Remuneration Report on pages 60 to 75 of this Report and Financial Statements.
Included in the total above is £4.9m (2016: £9.6m) relating to discontinued operations.

104 Oxford Instruments plc Report and Financial Statements 2017
Notes to the Financial Statements continued year ended 31 March 2017
12 Employees The average number of people employed by the Group (including Directors and temporary employees) during the year was as follows:
2017 2016 Number Number
Production 797 905
Sales and marketing 488 501
Research and Development 410 390
Administration and shared services 279 281
Total average number of employees 1,974 2,077
13 Share option schemesThe Group operates three share option schemes:
All employee Share Incentive Plan (“SIP”)All UK employees are eligible to participate in the Group’s HM Revenue and Customs approved SIP. Participating employees make a cash contribution to the plan each month. The Group contributes a further amount equal to 20% of the employee’s contribution. Independent trustees then purchase matching shares in the market on behalf of the employees. The matching shares vest on the completion by the participating employee of a further three years’ service and can be withdrawn from the plan tax-free after five years’ service.
Executive Share Option Scheme (“ESO”)Options awarded under the Executive Share Option Scheme are made annually to certain senior managers. The exercise prices are determined according to the mid-market closing share price on the day before the date of grant. Options have a life of ten years and a vesting period of three years.
Senior Executive Long Term Incentive Scheme (“SELTIS”)Options awarded under the Senior Executive Long Term Incentive Scheme are made annually to certain senior managers. The exercise prices are nil. Options have a life of seven years and a vesting period of three years.
Both the Executive Share Option Scheme and Senior Executive Long Term Incentive Scheme are subject to performance conditions which can be found in the Remuneration Report on pages 60 to 75.
Performance Share Plan Scheme (“PSP”)Under the Performance Share Plan awards of performance shares (or nil-cost options) are made annually to certain senior managers. Awards have a life of ten years with vesting subject to achievement of performance targets and a vesting period of a minimum of three years (but may be up to five years).
Administrative expenses include a charge of £0.5m (2016: £0.4m) in respect of the cost of providing share-based remuneration. The cost of share options is calculated by estimating the fair value of the option at grant date and spreading that amount over the vesting period after adjusting for an expectation of non-vesting.
Fair values are determined using an internal valuation model based on a modified Black-Scholes model. Expected volatility has been based on historical volatility over a period of time of the same length as the expected option life and ending on the grant date. Half of the ESO options issued before 2009, half of the PSP options and all SELTIS options use total shareholder return (“TSR”) as a performance condition. As TSR is a market-based performance condition, the accounting treatment differs from that for options subject to non-market performance conditions. This means that the TSR performance conditions have been incorporated into the calculation of the fair value as a discount in calculating the fair value.
For options granted in the years ended 31 March 2017 and 2016, the fair value per option granted and the assumptions used in the calculation are as follows:
Executive Performance Executive Performance Executive Share Option Share Plan Share Option Share Plan Share Option Scheme Scheme Scheme Scheme Scheme November 2016 June 2016 June 2016 June 2015 June 2015
Fair value at measurement date £2.02 £4.92 £2.54 £6.96 £3.57
Share price at grant date £6.23 £7.38 £7.38 £10.28 £10.28
Exercise price £6.23 £nil £7.38 £nil £10.28
Expected volatility 41.8% 36.9% 42.7% 38.5% 39.1%
Expected option life (expressed as weighted average life used in the modelling) 6 years 3 years 6 years 3 years 6 years
Expected dividend yield 2.1% 1.8% 1.8% 1.3% 1.3%
Risk free interest rate 0.7% 0.5% 0.9% 1.0% 1.6%

01: Strategic Report 02: Governance 03: Financial Statements 04: Company Information
105Oxford Instruments plc Report and Financial Statements 2017
The options existing at the year end were as follows:
2017 2016 Number Exercise Number of shares price Period when exercisable of shares
Options subsisting at the year end on unissued ordinary shares:
Executive Share Option Schemes
July 2006 — £2.10 15/07/09-14/07/16 9,500
September 2007 6,000 £2.32 28/08/10-27/09/17 6,000
December 2008 8,339 £1.35 16/12/11-15/12/18 12,839
December 2009 11,000 £2.04 17/12/12-16/12/19 20,562
January 2011 82,675 £7.05 07/01/14-06/01/21 100,075
December 2011 169,650 £9.90 14/12/14-13/12/21 330,540
December 2012 — £13.88 19/12/15-18/12/22 —
June 2013 — £14.55 12/06/16-11/06/23 2,250
March 2014 — £12.89 20/03/17-19/03/24 92,000
June 2014 — £14.15 13/06/17-12/06/24 338,400
July 2014 — £12.61 08/07/17-07/07/24 16,375
June 2015 536,362 £10.28 15/06/18-14/06/25 599,562
June 2016 36,000 £7.38 21/06/19-20/06/26 —
November 2016 163,321 £6.27 29/11/19-28/11/26 —
Total options subsisting on existing ordinary shares 1,013,347 1,528,103
Percentage of issued share capital 1.8% 2.7%
Performance Share Plan
October 2014 — £nil 10/10/17-09/10/21 120,325
June 2015 — £nil 15/06/18-14/06/22 112,718
June 2016 148,475 £nil 21/06/19-20/06/23 —
Total options subsisting on existing ordinary shares 148,475 233,043
Percentage of issued share capital 0.3% 0.4%
Options subsisting at the year end on existing ordinary shares held in trust:
Senior Executive Long Term Incentive Scheme
January 2011 15,500 £nil 07/01/14-06/01/18 15,500
June 2014 — £nil 19/12/15-18/12/19 21,400
Total options subsisting on existing ordinary shares held in trust 15,500 36,900
Percentage of issued share capital 0.0% 0.1%
The number and weighted average exercise prices of those options are as follows:
2017 2016 Weighted Weighted average Number average Number exercise price of options exercise price of options
Outstanding at the beginning of the period £9.25 1,798,046 £10.46 1,558,368
Granted during the year £3.69 347,796 £8.67 720,880
Forfeited during the year £6.40 (574,883) £12.45 (35,675)
Exercised during the year £3.55 (17,005) £4.78 (7,575)
Lapsed during the year £12.92 (376,632) £12.40 (437,952)
Outstanding at the year end £7.91 1,177,322 £9.25 1,798,046
Exercisable at the year end £7.88 293,164 £8.22 495,016
The weighted average share price at the time of exercise of the options was £7.75 (2016: £9.36).

106 Oxford Instruments plc Report and Financial Statements 2017
Notes to the Financial Statements continued year ended 31 March 2017
14 Income tax expense Recognised in the Consolidated Statement of Income 2017 2016 £m £m
Current tax expense
Current year 6.5 3.6
Adjustment in respect of prior years (2.2) (0.2)
4.3 3.4
Deferred tax expense
Origination and reversal of temporary differences (5.6) (1.3)
Adjustment in respect of prior years 0.9 0.6
(4.7) (0.7)
Total tax (credit)/expense (0.4) 2.7
Reconciliation of effective tax rate
(Loss)/profit before income tax (25.5) 9.7
Income tax using the weighted average statutory tax rate of 22% (2016: 20%) (5.6) 1.9
Effect of:
Tax rates other than the weighted average statutory rate (0.5) 1.7
Change in rate at which deferred tax recognised (0.2) (0.4)
Loss on disposal of held for sale assets — 0.3
Transaction costs, deferred consideration and impairments not deductible for tax 5.7 —
Non-taxable income and expenses 1.4 (0.4)
Tax incentives not recognised in the Consolidated Statement of Income (0.4) (0.8)
Recognition of deferred tax not previously recognised — (0.1)
Movement in unrecognised deferred tax 0.6 0.3
Adjustment in respect of prior years (1.4) 0.2
Total tax (credit)/expense (0.4) 2.7
Taxation charge recognised in other comprehensive income
Deferred tax – relating to employee benefits 0.9 2.6
0.9 2.6
Taxation charge recognised directly in equity
Deferred tax – relating to share options — —
A reduction in the UK corporation tax rate from 21% to 20% (effective from 1 April 2015) was substantively enacted on 2 July 2013. Further reductions to 19% (effective from 1 April 2017) and to 18% (effective from 1 April 2020) were substantively enacted on 26 October 2015, and an additional reduction to 17% (effective from 1 April 2020) was substantively enacted on 6 September 2016. This will reduce the Company’s future current tax charge accordingly. The UK deferred tax liability at 31 March 2017 has been calculated based on those rates. The Group carries tax provisions in relation to uncertain tax provisions arising from the possible outcome of negotiations with tax authorities. Such provisions are a reflection of the geographical spread of the Group’s operations and the variety of jurisdictions in which it carries out its activities.
15 Dividends per shareThe following dividends per share were paid by the Group:
2017 2016 pence Pence
Previous year interim dividend 3.7 3.7
Previous year final dividend 9.3 9.3
13.0 13.0
The following dividends per share were proposed by the Group in respect of each accounting year presented:
2017 2016 pence pence
Interim dividend 3.7 3.7
Final dividend 9.3 9.3
13.0 13.0
The interim dividend was not provided for at the year end and was paid on 7 April 2017. The final proposed dividend of 9.3 pence per share (2016: 9.3 pence) was not provided at the year end and will be paid on 19 October 2017 subject to authorisation by the Shareholders at the forthcoming Annual General Meeting.

01: Strategic Report 02: Governance 03: Financial Statements 04: Company Information
107Oxford Instruments plc Report and Financial Statements 2017
16 Property, plant and equipment Land and Plant and Fixtures and buildings equipment fittings Total £m £m £m £m
Cost
Balance at 1 April 2015 24.6 50.1 10.5 85.2
Additions – business combinations — 4.3 — 4.3
Additions – other 0.1 5.2 0.2 5.5
Disposals (0.2) (4.4) (0.8) (5.4)
Transfer from inventory — 0.5 — 0.5
Effect of movements in foreign exchange rates 0.7 1.2 0.1 2.0
Balance at 31 March 2016 25.2 56.9 10.0 92.1
Balance at 1 April 2016 25.2 56.9 10.0 92.1
Additions – business combinations — — — —
Additions – other 0.3 3.8 0.5 4.6
Disposals — (10.7) (0.1) (10.8)
Effect of movements in foreign exchange rates 1.5 3.7 0.2 5.4
Balance at 31 March 2017 27.0 53.7 10.6 91.3
Depreciation and impairment losses
Balance at 1 April 2015 7.5 37.0 7.6 52.1
Depreciation charge for the year 0.6 5.2 0.5 6.3
Disposals (0.2) (1.7) (0.5) (2.4)
Effect of movements in foreign exchange rates 0.2 0.7 — 0.9
Balance at 31 March 2016 8.1 41.2 7.6 56.9
Balance at 1 April 2016 8.1 41.2 7.6 56.9
Depreciation charge for the year 0.7 4.9 0.5 6.1
Disposals — (7.0) (0.1) (7.1)
Effect of movements in foreign exchange rates 0.7 2.1 0.1 2.9
Balance at 31 March 2017 9.5 41.2 8.1 58.8
Carrying amounts
At 1 April 2015 17.1 13.1 2.9 33.1
At 31 March 2016 and 1 April 2016 17.1 15.7 2.4 35.2
At 31 March 2017 17.5 12.5 2.5 32.5
At 31 March 2017, the net book value of plant and equipment included £0.3m (2016: £0.2m) of assets under construction.
Included in the depreciation charge for the year is £0.4m (2016: £nil) relating to discontinued operations.

108 Oxford Instruments plc Report and Financial Statements 2017
Notes to the Financial Statements continued year ended 31 March 2017
17 Intangible assets Customer Technology Development Development related related costs costs acquired acquired acquired internally Goodwill intangibles intangibles intangibles generated Software Total £m £m £m £m £m £m £m
Cost
Balance at 1 April 2015 107.6 48.1 123.7 5.9 50.3 1.9 337.5
Additions – business combinations 4.5 5.7 — — — — 10.2
Additions – internally generated — — — — 8.2 0.2 8.4
Disposals (2.1) (3.8) (15.1) (4.1) (2.7) — (27.8)
Effect of movements in foreign exchange rates 1.2 1.4 3.4 — 1.0 — 7.0
Balance at 31 March 2016 111.2 51.4 112.0 1.8 56.8 2.1 335.3
Balance at 1 April 2016 111.2 51.4 112.0 1.8 56.8 2.1 335.3
Additions – internally generated — — — — 7.8 0.1 7.9
Effect of movements in foreign exchange rates 3.3 5.2 6.5 — 1.7 — 16.7
Balance at 31 March 2017 114.5 56.6 118.5 1.8 66.3 2.2 359.9
Amortisation and impairment losses
Balance at 1 April 2015 1.4 29.1 37.4 4.1 34.2 — 106.2
Amortisation charge for the year — 3.6 12.9 0.2 4.5 — 21.2
Disposals (0.4) (3.8) (8.2) (3.9) (0.5) — (16.8)
Effect of movements in foreign exchange rates 0.1 0.9 2.0 — 0.9 — 3.9
Balance at 31 March 2016 1.1 29.8 44.1 0.4 39.1 — 114.5
Balance at 1 April 2016 1.1 29.8 44.1 0.4 39.1 — 114.5
Amortisation charge for the year — 3.6 10.0 0.2 4.8 — 18.6
Impairment charge for the year 28.8 5.0 1.1 — 0.7 2.2 37.8
Effect of movements in foreign exchange rates 0.1 3.5 3.0 — 1.4 — 8.0
Balance at 31 March 2017 30.0 41.9 58.2 0.6 46.0 2.2 178.9
Carrying amounts
At 1 April 2015 106.2 19.0 86.3 1.8 16.1 1.9 231.3
At 31 March 2016 and 1 April 2016 110.1 21.6 67.9 1.4 17.7 2.1 220.8
At 31 March 2017 84.5 14.7 60.3 1.2 20.3 — 181.0
The following intangible assets are considered material by the Directors as they represent 88% (2016: 78%) of total acquired intangible assets:
2017 2016 Remaining Amortisation amortisation period period £m Years Years £m
Trademarks – Andor 9.7 15.0 11.8 10.2
Technology, know-how and patents – Andor:
– Product related 37.6 12.0 8.8 41.6
– Software related 7.7 10.0 6.8 7.9
Technology, know-how and patents – Asylum 11.7 12.0 7.7 11.5

01: Strategic Report 02: Governance 03: Financial Statements 04: Company Information
109Oxford Instruments plc Report and Financial Statements 2017
Goodwill acquired in a business combination is allocated, at acquisition, to the cash generating units (“CGUs”) that are expected to benefit from that business combination. The carrying amount of goodwill was allocated to individual CGUs as follows:
2017 2016 £m £m
NanoTechnology Tools
NanoScience 6.7 6.5
NanoAnalysis 9.9 9.6
Asylum — 21.1
Andor 61.4 61.4
Industrial Products
Industrial Analysis 4.2 3.9
Magnetic Resonance 2.3 2.3
Service
OI Healthcare — 5.3
84.5 110.1
The Group tests goodwill annually for impairment, or more frequently if there are indications that goodwill might be impaired.
Accounting standards require an impairment test to be carried out by determining the recoverable amount of each CGU which contains goodwill. The recoverable amount is calculated as the higher of the fair value less costs to sell or the value in use of the CGU. In the Group’s case the recoverable amount is based on value in use calculations. Value in use is calculated by discounting expected future cash flows and in particular (except as noted below) Board-approved five year cash flow forecasts, prepared by the management of each CGU, are used together with 3% per annum growth for the subsequent 20 years. These rates are considered to be at or below long-term market trends for the Group’s businesses.
During the year the Group made impairments in respect of intangible assets as follows:
• £22.6m in respect of the Goodwill of the Asylum CGU;
• £6.2m in respect of the Goodwill of the OI Healthcare CGU;
• £5.0m in respect of Customer Relationships which arose on the acquisition of MIR in 2015;
• £2.2m in respect of bespoke software development;
• £1.1m in respect of a technology related acquired intangible which was superseded by a new product; and
• £0.7m in respect of a development project which was stopped in order to allow the Group to focus and direct resources so as to accelerate key projects.
During the year the financial performance of the Group’s Asylum CGU deteriorated with the business performing below expectations. Performance has been impacted by a slowdown in academic funding in US and European markets, resulting in a contraction of the overall scanning probe microscopy market, compounded by delays in new product launches. The Group has revised its financial projections for the business and planned launch dates for new products in light of the trading environment.
The financial performance of the Group’s Healthcare business also deteriorated in the US during the year, with business operating profit falling significantly from last year’s level. Performance has been impacted by a lower level of sales of refurbished imaging systems compared to the previous year, which is expected to continue. This has been driven by both a particularly high level of activity in the prior year but also a change in software licensing policy by one of the large original equipment manufacturers. The Group has revised its financial projections for the business, consistent with a new strategy and the actions and time required to improve profitability and operational efficiency.
The Asylum and OI Healthcare CGUs are business operations and the goodwill and acquired intangible assets relating to each are held in the NanoTechnology Tools and Service segments respectively. As at 31 March 2017, the estimates of the recoverable amounts of the Asylum and OI Healthcare CGUs, being their value in use, were calculated as £16.0m and £9.0m respectively. The discount rates used in arriving at these estimates were 13.2% for Asylum and 15.5% for OI Healthcare.
In respect of the impairment tests for Asylum and OI Healthcare, specific forecasts were prepared for the purpose of the impairment test taking into account the latest available information regarding business and market conditions.
The £2.2m impairment of software costs represents inefficient capitalised costs relating to the Group’s new ERP system and has been reported as part of unallocated central costs in the segmental disclosure. The £1.1m impairment of technology related acquired intangible assets represents the write down of intellectual property obtained as part of a previous acquisition that has since been superseded by a new product. The asset belonged to the Industrial Products segment.
The £0.7m impairment of capitalised development costs arose as a result of the termination of a specific project that was stopped in order to focus and direct resources so as to accelerate key projects. The impaired capitalised development costs were held in the NanoTechnology Tools segment.

110 Oxford Instruments plc Report and Financial Statements 2017
Notes to the Financial Statements continued year ended 31 March 2017
17 Intangible assets continued
Key assumptionsThe key assumptions are those regarding discount rates, growth rates, expected selling volumes and prices and direct costs during the period.
The growth rates are based on industry growth factors. Changes in selling prices and direct costs are based on past practices and expectations of future changes in the market.
The pre-tax weighted average costs of capital used for NanoTechnology Tools, Industrial Products and Service in impairment testing are 12.8%-13.6% (2016: 12.1%-12.9%), 12.4%-13.1% (2016: 13.0%-13.4%) and 15.5% (2016: 13.3%) respectively in line with the risk associated with each of the business segments. Management have estimated these discount rates by reference to past experience and an industry average weighted cost of capital as adjusted for appropriate risk factors reflecting current economic circumstances and the risk profiles of each CGU.
Sensitivity analysisSince impairments have been made in respect of the Asylum and OI Healthcare CGUs, any further adverse change in assumptions would result in a further impairment to the remaining acquired intangible assets held by these two CGUs. There is no remaining goodwill allocated to these businesses. A sensitivity analysis has been performed in respect of the other CGUs as follows.
The Group’s estimate of impairments is most sensitive to changes in the discount rate and forecast growth rate. Sensitivity analysis has been carried out by reference to both of these assumptions and demonstrated that large headroom remained across the businesses even after significant changes to both the discount rate and forecast growth rate assumptions.
18 Deferred taxMovements in deferred tax assets and liabilities were as follows:
Property, plant and Employee Intangible equipment Inventory benefits assets Tax losses Other Total £m £m £m £m £m £m £m
Balance at 31 March 2015 (0.8) 2.9 12.5 (11.1) 4.9 5.5 13.9
Reclassification
Recognised in income 1.5 0.3 (1.4) 1.7 (0.7) (0.8) 0.6
Recognised in other comprehensive income — — (2.6) — — — (2.6)
Recognised directly in equity — — — — — — —
Acquisitions (0.3) — — — — 0.2 (0.1)
Disposals 0.1 — — 1.4 (0.4) (0.1) 1.0
Foreign exchange 0.1 0.1 0.1 (0.1) 0.3 — 0.5
Balance at 31 March 2016 0.6 3.3 8.6 (8.1) 4.1 4.8 13.3
Reclassification
Recognised in income 0.4 (0.7) (1.0) 7.1 0.6 (0.8) 5.6
Recognised in other comprehensive income — — (0.9) — — — (0.9)
Recognised directly in equity — — — — — — —
Acquisitions — — — — — — —
Disposals — — — — — — —
Foreign exchange (0.1) 0.4 0.4 0.9 0.3 0.5 2.4
Balance 31 March 2017 0.9 3.0 7.1 (0.1) 5.0 4.5 20.4
Certain deferred tax assets and liabilities have been offset as follows:
Assets Liabilities Net 2017 2016 2017 2016 2017 2016 £m £m £m £m £m £m
Gross assets/(liabilities) 33.4 33.6 (13.0) (20.3) 20.4 13.3
Offset (7.4) (14.6) 7.4 14.6 — —
Net assets/(liabilities) 26.0 19.0 (5.6) (5.7) 20.4 13.3

01: Strategic Report 02: Governance 03: Financial Statements 04: Company Information
111Oxford Instruments plc Report and Financial Statements 2017
Deferred tax assets have not been recognised in respect of the following items:
2017 2016 £m £m
Deductible temporary differences 1.7 1.0
Tax losses 9.8 9.1
11.5 10.1
The tax losses and the deductible temporary differences do not expire under current tax legislation. Deferred tax assets have not been recognised in respect of these items as it is not probable that future taxable profits will be available in the subsidiaries concerned against which the Group can utilise the brought forward tax losses.
No deferred tax liability has been recognised in respect of £25.7m (2016: £33.1m) of undistributed earnings of overseas subsidiaries since the majority of such distributions would not be taxable. In other cases the Group considers that it is able to control the timing of remittances so that any tax is not expected to arise in the foreseeable future.
19 Inventories 2017 2016 £m £m
Raw materials and consumables 19.5 19.7
Work in progress 14.5 20.6
Finished goods 19.9 20.8
53.9 61.1
The amount of inventory recognised as an expense was £147.1m (2016: £143.6m). In the ordinary course of business, the Group makes impairment provisions for slow-moving, excess and obsolete inventory as appropriate. Inventory is stated after charging impairments of £0.4m in the current period (2016: £1.9m). In the current year, £0.2m (2016: £0.2m) was reversed relating to previous impairments. Impairments are included within gross profit.
Inventory carried at fair value less costs to sell is £nil (2016: £nil).
20 Trade and other receivables 2017 2016 £m £m
Trade receivables 73.0 69.2
Less provision for impairment of receivables (2.4) (2.0)
Net trade receivables 70.6 67.2
Prepayments 2.9 4.3
Accrued income 2.4 0.7
Other receivables 5.2 5.3
81.1 77.5
Trade receivables are non-interest-bearing. Standard credit terms provided to customers differ according to business and country and are typically between 30 and 60 days.
The maximum exposure to credit risk for trade and other receivables by geographic region was:
2017 2016 £m £m
UK 9.0 6.8
China 11.4 10.7
Japan 11.7 10.3
USA 18.6 17.0
Germany 1.8 3.2
Rest of Europe 16.3 17.1
Rest of Asia 10.3 6.6
Rest of World 2.7 4.4
Total 81.8 76.1

112 Oxford Instruments plc Report and Financial Statements 2017
Notes to the Financial Statements continued year ended 31 March 2017
20 Trade and other receivables continuedThe ageing of financial assets comprising net trade receivables and other receivables at the reporting date was:
2017 2016 £m £m
Current (not overdue) 61.1 51.0
Less than 31 days overdue 9.8 15.2
More than 30 days but less than 91 days overdue 6.5 6.0
More than 90 days overdue 4.4 3.9
81.8 76.1
In both periods presented the entire provision against trade receivables relates to balances more than 90 days overdue.
The movement in the allowance for impairment of trade receivables during the year was as follows:
2017 2016 £m £m
Balance at start of year 2.0 2.3
Increase/(decrease) in allowance 0.4 (0.3)
Balance at end of year 2.4 2.0
Valuation allowances are used to record provisions for credit losses. The valuation allowance is reduced and the asset impaired when the customer is in liquidation.
Long-term receivables relate to amounts due from the Group’s associated undertaking.
21 Cash and cash equivalents 2017 2016 £m £m
Cash balances 27.2 21.8
Bank overdraft (0.7) (1.4)
Cash and cash equivalents in the Consolidated Statement of Cash Flows 26.5 20.4
All cash and cash equivalents are available for use by the Group.
22 Financial risk managementThe Group’s multinational operations and debt financing expose it to a variety of financial risks. In the course of its business, the Group is exposed to foreign currency risk, interest rate risk, liquidity risk, commodity risk and credit risk. Financial risk management policies are set by the Board of Directors. These policies are implemented by a central treasury function that has formal procedures to manage foreign exchange risk, interest rate risk and liquidity risk, including, where appropriate, the use of derivative financial instruments. Commodity risk is managed locally by the operating businesses. The Group has clearly defined authority and approval limits.
In accordance with its treasury policy, the Group does not hold or use derivative financial instruments for trading or speculative purposes. Such instruments are only used to manage the risks arising from operating or financial assets or liabilities or highly probable future transactions.
The Group uses derivative financial instruments to hedge its exposure to fluctuations in foreign exchange rates, interest rates and certain commodity prices.
The Group has adopted hedge accounting for a limited number of related commodity contracts as outlined below. However, in common with a number of other companies, the Group has decided that the additional costs of meeting the extensive documentation requirements of IAS 39 to apply hedge accounting to derivative financial instruments used for hedging exposure to foreign currency and interest rate volatility cannot be justified. Accordingly, the Group does not use hedge accounting for such derivatives.
Foreign currency riskForeign currency risk arises both where sale or purchase transactions are undertaken in currencies other than the respective functional currencies of Group companies (transactional exposures) and where the results of overseas companies are consolidated into the Group’s reporting currency of Sterling (translational exposures). The Group has operations around the world which record their results in a variety of different local functional currencies. In countries where the Group does not have operations, it invariably has some customers or suppliers that transact in a foreign currency. The Group is therefore exposed to the changes in foreign currency exchange rates between a number of different currencies but the Group’s primary exposures relate to the US Dollar, the Euro and the Japanese Yen. To reduce uncertainty, the Group maintains a rolling hedge of forward contracts equivalent of to 75% (2016: 80%) of the exposure expected to arise over the following twelve months. The remaining 25% is sold on the spot market. The fair value of outstanding currency contracts recognised as a liability as at 31 March 2017 amount to £5.0m (2016: £5.8m) and those recognised as an asset amount to £0.6m (2016: £1.5m).
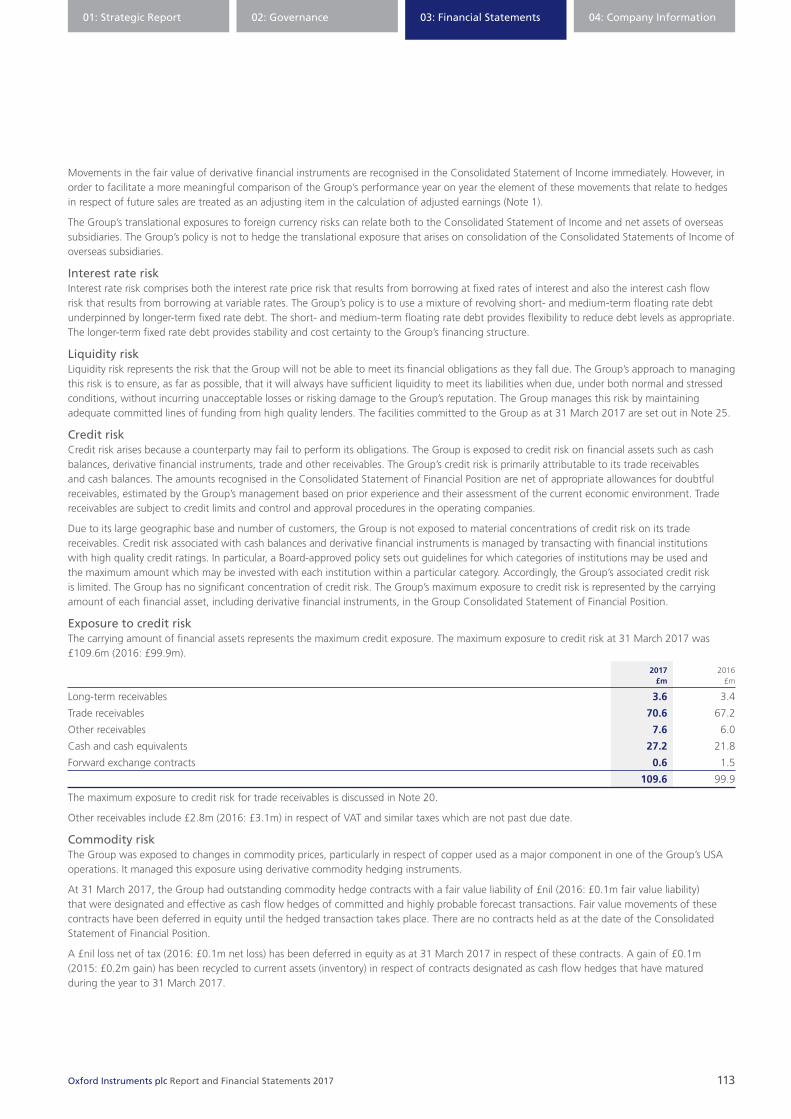
01: Strategic Report 02: Governance 03: Financial Statements 04: Company Information
113Oxford Instruments plc Report and Financial Statements 2017
Movements in the fair value of derivative financial instruments are recognised in the Consolidated Statement of Income immediately. However, in order to facilitate a more meaningful comparison of the Group’s performance year on year the element of these movements that relate to hedges in respect of future sales are treated as an adjusting item in the calculation of adjusted earnings (Note 1).
The Group’s translational exposures to foreign currency risks can relate both to the Consolidated Statement of Income and net assets of overseas subsidiaries. The Group’s policy is not to hedge the translational exposure that arises on consolidation of the Consolidated Statements of Income of overseas subsidiaries.
Interest rate riskInterest rate risk comprises both the interest rate price risk that results from borrowing at fixed rates of interest and also the interest cash flow risk that results from borrowing at variable rates. The Group’s policy is to use a mixture of revolving short- and medium-term floating rate debt underpinned by longer-term fixed rate debt. The short- and medium-term floating rate debt provides flexibility to reduce debt levels as appropriate. The longer-term fixed rate debt provides stability and cost certainty to the Group’s financing structure.
Liquidity riskLiquidity risk represents the risk that the Group will not be able to meet its financial obligations as they fall due. The Group’s approach to managing this risk is to ensure, as far as possible, that it will always have sufficient liquidity to meet its liabilities when due, under both normal and stressed conditions, without incurring unacceptable losses or risking damage to the Group’s reputation. The Group manages this risk by maintaining adequate committed lines of funding from high quality lenders. The facilities committed to the Group as at 31 March 2017 are set out in Note 25.
Credit riskCredit risk arises because a counterparty may fail to perform its obligations. The Group is exposed to credit risk on financial assets such as cash balances, derivative financial instruments, trade and other receivables. The Group’s credit risk is primarily attributable to its trade receivables and cash balances. The amounts recognised in the Consolidated Statement of Financial Position are net of appropriate allowances for doubtful receivables, estimated by the Group’s management based on prior experience and their assessment of the current economic environment. Trade receivables are subject to credit limits and control and approval procedures in the operating companies.
Due to its large geographic base and number of customers, the Group is not exposed to material concentrations of credit risk on its trade receivables. Credit risk associated with cash balances and derivative financial instruments is managed by transacting with financial institutions with high quality credit ratings. In particular, a Board-approved policy sets out guidelines for which categories of institutions may be used and the maximum amount which may be invested with each institution within a particular category. Accordingly, the Group’s associated credit risk is limited. The Group has no significant concentration of credit risk. The Group’s maximum exposure to credit risk is represented by the carrying amount of each financial asset, including derivative financial instruments, in the Group Consolidated Statement of Financial Position.
Exposure to credit riskThe carrying amount of financial assets represents the maximum credit exposure. The maximum exposure to credit risk at 31 March 2017 was £109.6m (2016: £99.9m).
2017 2016 £m £m
Long-term receivables 3.6 3.4
Trade receivables 70.6 67.2
Other receivables 7.6 6.0
Cash and cash equivalents 27.2 21.8
Forward exchange contracts 0.6 1.5
109.6 99.9
The maximum exposure to credit risk for trade receivables is discussed in Note 20.
Other receivables include £2.8m (2016: £3.1m) in respect of VAT and similar taxes which are not past due date.
Commodity riskThe Group was exposed to changes in commodity prices, particularly in respect of copper used as a major component in one of the Group’s USA operations. It managed this exposure using derivative commodity hedging instruments.
At 31 March 2017, the Group had outstanding commodity hedge contracts with a fair value liability of £nil (2016: £0.1m fair value liability) that were designated and effective as cash flow hedges of committed and highly probable forecast transactions. Fair value movements of these contracts have been deferred in equity until the hedged transaction takes place. There are no contracts held as at the date of the Consolidated Statement of Financial Position.
A £nil loss net of tax (2016: £0.1m net loss) has been deferred in equity as at 31 March 2017 in respect of these contracts. A gain of £0.1m (2015: £0.2m gain) has been recycled to current assets (inventory) in respect of contracts designated as cash flow hedges that have matured during the year to 31 March 2017.

114 Oxford Instruments plc Report and Financial Statements 2017
Notes to the Financial Statements continued year ended 31 March 2017
22 Financial risk management continued
Capital managementThe Board considers capital to comprise share capital, reserves and the net cash or net debt position of the Company. The Company was in a net debt position at the year end. Total capital at the end of the current year totalled £241.8m (2016: £271.2m).
The Board’s long-term objective is to have an efficient capital structure by maintaining a balance between the higher returns that might be possible with higher levels of borrowings and the advantages and security afforded by a sound capital position. This is monitored by reference to the ratio of net debt to earnings before interest, tax, depreciation and amortisation (“EBITDA”) and the Board has set itself internal limits, which are well inside any covenants the Group has with lenders. The Group maintains the right to purchase its own shares in the market; the timing of these purchases would depend on market prices. Buy and sell decisions are made on a specific transaction basis by the Board.
The Board carefully considers dividend payments and the Company moved from a fixed dividend policy to a progressive one in the year ended March 2011. In doing this, the Board will look to increase dividends as adjusted earnings per share increase although there will not be a direct correlation. The Board does not have a policy to pay a fixed dividend yield or to maintain a fixed rate of dividend cover, but assess both of these metrics together with dividends paid by peers when assessing what dividend to recommend.
As set out in the Chief Executive’s Statement, the Group will actively manage its portfolio of businesses and products, selecting those markets with long term growth drivers where we can maintain or grow leading positions. We will focus on those markets where nanotechnology has the potential to address some of the world’s most complex and pressing challenges and where we can deliver unique solutions and service excellence. In line with the objective of maintaining a balance between borrowings and equity, the Group would seek to finance organic growth (e.g. through investment in Research and Development) and smaller “bolt-on” acquisitions from operating cash flow thus maintaining balance sheet efficiency. Larger acquisitions would be financed either by equity or a mixture of equity and debt so as to ensure the Group has a manageable ratio of net debt to EBITDA.
The Board encourages employees to hold shares in the Company. As well as various share option plans (full details of which are given in Note 13), from April 2008 all UK employees have been offered the opportunity to take part in a Share Incentive Plan (“SIP”). Under this plan, employees are able to invest up to £1,500 each tax year in shares in the Company. The Company awards one additional free share (a matching share) for every five shares bought by each employee.
There were no changes to the Group’s approach to capital management during the year. Neither the Company nor any of its subsidiaries are subject to externally imposed capital requirements.
23 Financial instrumentsFair values of financial assets and liabilitiesThe fair values of financial assets and liabilities together with the carrying amounts shown in the Consolidated Statement of Financial Position are as follows:
2017 2016 Fair Carrying Fair Carrying Fair value amount value amount value hierarchy £m £m £m £m
Assets carried at amortised cost
Long-term receivables 3.6 3.6 3.4 3.4
Trade receivables 70.6 70.6 67.2 67.2
Other receivables 7.6 7.6 6.0 6.0
Cash and cash equivalents 27.2 27.2 21.8 21.8
Assets carried at fair value
Derivative financial instruments:
– Foreign currency contracts 2 0.6 0.6 1.5 1.5
Liabilities carried at fair value
Derivative financial instruments:
– Foreign currency contracts 2 (5.0) (5.0) (5.8) (5.8)
– Copper hedging contracts (designated as an IAS 39 hedge) 2 — — (0.1) (0.1)
Contingent consideration 3 — — (6.6) (6.6)
(5.0) (5.0) (12.5) (12.5)
Liabilities carried at amortised cost
Trade and other payables (66.7) (66.7) (82.4) (82.4)
Bank overdraft (0.7) (0.7) (1.4) (1.4)
Borrowings (135.8) (135.8) (148.6) (148.6)

01: Strategic Report 02: Governance 03: Financial Statements 04: Company Information
115Oxford Instruments plc Report and Financial Statements 2017
The following summarises the major methods and assumptions used in estimating the fair values of financial instruments reflected in the above table.
Derivative financial instrumentsDerivative financial instruments are marked to market using market prices.
Fixed and floating rate borrowingsThe fair value of fixed and floating rate borrowings is estimated by discounting the future contracted principal and interest cash flows using the market rate of interest at the reporting date.
Trade and other receivables/payablesFor receivables/payables with a remaining life of less than one year, the carrying amount is deemed to reflect the fair value. All other receivables/payables are discounted to determine their fair value. Advances received are excluded from other payables above as these are not considered to be financial liabilities.
Contingent considerationThe fair value of contingent consideration is estimated based on the forecast future performance of the acquired business over a timeframe determined as part of the acquisition agreement, discounted as appropriate. Key assumptions include growth rates, expected selling volumes and prices and direct costs during the period.
Fair value hierarchy The table above gives details of the valuation method used in arriving at the fair value of financial instruments. The different levels have been identified as follows:
• Level 1: quoted prices (unadjusted) in active markets for identical assets and liabilities;
• Level 2: inputs other than quoted prices included within Level 1 that are observable for the asset or liability, either directly (i.e. as prices) or indirectly (i.e. derived from prices); and
• Level 3: inputs for the asset or liability that are not based on observable market data.
There have been no transfers between levels during the year.
Maturity of financial liabilities Carrying Contractual Due within Due one to amount cash flows one year five years 31 March 2017 £m £m £m £m
Trade and other payables 66.7 66.7 66.7 —
Contingent consideration — — — —
Foreign exchange contracts 5.0 5.0 5.0 —
Bank overdraft 0.7 0.7 0.7 —
Borrowings 135.8 137.6 6.8 130.8
208.2 210.0 79.2 130.8
Carrying Contractual Due within Due one to amount cash flows one year five years 31 March 2016 £m £m £m £m
Trade and other payables 82.4 82.4 82.4 —
Contingent consideration 6.6 6.6 6.6 —
Foreign exchange contracts 5.8 5.8 5.8 —
Bank overdraft 1.4 1.4 1.4 —
Borrowings 148.6 148.6 1.6 147.0
244.8 244.8 97.8 147.0
At the reporting date the interest rate profile of the Group’s interest-bearing financial instruments was:
Carrying Carrying amount amount 2017 2016 £m £m
Variable rate instruments
Financial assets 27.2 21.8
Financial liabilities (70.3) (80.7)
Fixed rate instruments
Financial liabilities (66.2) (69.3)

116 Oxford Instruments plc Report and Financial Statements 2017
Notes to the Financial Statements continued year ended 31 March 2017
23 Financial instruments continued
Sensitivity analysisThe Group has estimated the impact on the Consolidated Statement of Income and on Equity of the following changes in market conditions at the balance sheet date:
• one percentage point increase in interest rates;
• ten percentage point weakening in the value of Sterling against all currencies; and
• ten percentage point strengthening in the value of Sterling against all currencies.
The sensitivities above represent the Directors’ view of reasonably possible changes in each risk variable, not worst case scenarios or stress tests. The outputs from the sensitivity analysis are estimates of the impact of market risk assuming that the specified changes occur at the year end and are applied to the risk exposures at that date. Accordingly, they show the impact on the balance sheet of an instantaneous shock. The calculations include all hedges in place at the year end.
Actual results in the future may differ materially from these estimates due to commercial actions taken to mitigate any potential losses from such rate movements, to the interaction of more than one sensitivity occurring and to further developments in global financial markets. As such, this table should not be considered as a projection of likely future gains and losses.
1% 10% 10% increase in weakening strengthening interest rates in Sterling1 in Sterling2 £m £m £m
At 31 March 2017
Impact on Consolidated Statement of Income — (5.4) 5.4
Impact on equity — 6.5 (6.4)
At 31 March 2016
Impact on Consolidated Statement of Income — (7.6) 7.6
Impact on equity — 5.9 (5.6)1. Of the effect on the Consolidated Statement of Income, £6.1m (2016: £8.2m) would have been recognised on the “mark-to-market” line (Note 1).
2. Of the effect on the Consolidated Statement of Income, £6.1m (2016: £8.2m) would have been recognised on the “mark-to-market” line (Note 1).
24 Called up share capitalIssued and fully paid ordinary shares:
2017 2016 Number Number of shares of shares
At the beginning of the year 57,298,911 57,291,336
Issued for cash 17,005 7,575
At the end of the year 57,315,916 57,298,911
2017 2016 Number Number of shares £m of shares £m
Allotted, called up and fully paid
Ordinary shares of 5p each 57,315,916 2.9 57,298,911 2.9
Number Aggregate Consideration of shares nominal value per share
New issues of ordinary shares of 5p each during the year
Exercise of executive share options 9,813 £491 £1.35-£7.05
Exercise of executive share options – share appreciation rights 7,192 £360 £2.04-£7.05
The total consideration received from exercise of share options in the year was £nil (2016: £nil).
The holders of the ordinary shares are entitled to receive dividends as declared, a proportionate amount of capital on a winding up of the Company and one vote per share at meetings of the Company.

01: Strategic Report 02: Governance 03: Financial Statements 04: Company Information
117Oxford Instruments plc Report and Financial Statements 2017
25 Borrowings Earlier of Effective repricing date or 2017 2016 Current interest rate maturity date £m £m
Bank overdrafts On demand 0.7 1.4
European Investment Bank Loan – unsecured 3.30% August 2020 6.2 1.6
6.9 3.0
Earlier of Effective repricing date or 2017 2016 Non-current interest rate maturity date £m £m
Revolving credit facility – unsecured 2.26% April 2017 69.6 79.3
European Investment Bank Loan – unsecured 3.30% August 2020 15.6 23.3
Loan Notes – unsecured 5.10% March 2021 44.4 44.4
129.6 147.0
The Group’s undrawn committed facilities available at 31 March 2017 were £59.6m comprising the undrawn portion of the Group’s £129.6m revolving credit facility. This facility expires on 28 February 2020.
The European Investment Bank loan is repayable in equal quarterly instalments commencing November 2016 with the final maturity in August 2020.
26 Retirement benefit obligationsThe Group operates defined benefit plans in the UK and USA; both offer pensions in retirement and death in service benefit to members. Pension benefits are related to members’ final salary at retirement and their length of service. Both schemes have been closed to new members since 2001 and closed to future accrual since 2010.
The amounts recognised in the Consolidated Statement of Financial Position are:
2017 2016 UK USA Total UK USA Total £m £m £m £m £m £m
Present value of funded obligations 304.0 9.0 313.0 266.0 8.5 274.5
Fair value of plan assets (282.5) (5.4) (287.9) (235.0) (4.5) (239.5)
Recognised liability for defined benefit obligations 21.5 3.6 25.1 31.0 4.0 35.0
Reconciliation of the opening and closing balances of the present value of the defined benefit obligation
2017 2016 UK USA Total UK USA Total £m £m £m £m £m £m
Benefit obligation at the beginning of the year 266.0 8.5 274.5 283.8 8.3 292.1
Interest on defined benefit obligation 9.1 0.3 9.4 9.5 0.3 9.8
Benefits paid (13.6) (0.6) (14.2) (6.1) (0.5) (6.6)
Remeasurement loss/(gain) on obligation 42.5 (0.2) 42.3 (21.2) 0.1 (21.1)
Exchange rate adjustment — 1.0 1.0 — 0.3 0.3
Benefit obligation at the end of the year 304.0 9.0 313.0 266.0 8.5 274.5
Reconciliation of the opening and closing balances of the fair value of plan assets
2017 2016 UK USA Total UK USA Total £m £m £m £m £m £m
Fair value of plan assets at the beginning of the year 235.0 4.5 239.5 233.9 4.7 238.6
Interest on plan assets 8.1 0.2 8.3 8.0 0.1 8.1
Contributions by employers 6.9 0.6 7.5 6.8 0.4 7.2
Benefits paid (13.6) (0.6) (14.2) (6.1) (0.5) (6.6)
Administrative expenses (0.5) (0.1) (0.6) (0.4) (0.1) (0.5)
Actual return on assets excluding interest income 46.6 0.1 46.7 (7.2) (0.3) (7.5)
Exchange rate adjustment — 0.7 0.7 — 0.2 0.2
Fair value of plan assets at the end of the year 282.5 5.4 287.9 235.0 4.5 239.5

118 Oxford Instruments plc Report and Financial Statements 2017
Notes to the Financial Statements continued year ended 31 March 2017
26 Retirement benefit obligations continued
Expense recognised in the Consolidated Statement of Income 2017 2016 £m £m
Total – defined benefit expense 1.1 1.7
Contributions to defined contribution schemes 4.3 4.4
5.4 6.1
The Group has agreed a basis for deficit recovery payments with the trustees of the UK pension scheme. The annual deficit recovery payment to the UK scheme was £6.9m (2016: £6.8m) for the financial year, payable through to and including 2021. For the years up to and including 2018, the payment will rise by the higher of inflation and growth in dividend per share; thereafter, the payment will increase in line with inflation. The weighted average durations of the UK and US defined benefit obligations at 31 March 2017 were 19 years and 16 years respectively (2016: 20 years and 16 years).
The Group has considered the requirements of IFRIC14 and concluded that there is no impact on the amounts recognised in respect of retirement benefit obligations.
The Group expects to contribute approximately £7.6m to defined benefit plans in the next financial year.
The pension costs are recorded in the following lines of the Consolidated Statement of Income:
2017 2016 £m £m
Cost of sales 1.1 1.5
Selling and marketing costs 1.0 1.0
Administration and shared services 1.1 1.0
Research and Development 1.1 0.9
Financial expenditure 1.1 1.7
5.4 6.1
Remeasurement gains and losses shown in the Consolidated Statement of Comprehensive Income 2017 2016 £m £m
Actual return on assets excluding interest income 46.7 (7.5)
Experience gain on scheme obligations 3.7 15.6
Changes in assumptions underlying the present value of scheme obligations:
– Financial (51.6) 5.0
– Demographic 5.6 0.5
Cumulative actuarial losses reported in the Consolidated Statement of Comprehensive Income since 1 April 2004, the transition date to IFRS, are £31.5m (2016: £35.9m cumulative actuarial losses).
Sensitivity analysisThe table below shows the sensitivity of the Consolidated Statement of Financial Position to changes in the significant pension assumptions:
Balance at Discount rate Inflation rate Life expectancy 31 March 2017 (-0.1% p.a.) (+0.1% p.a.) (+one year) £m £m £m £m
Value of funded obligations 313.0 318.7 318.6 325.2
Fair value of plan assets (287.9) (287.9) (287.9) (287.9)
Deficit 25.1 30.8 30.7 37.3
The valuation of defined benefit liabilities is most sensitive to changes in the discount rate, inflation rate and mortality rate. The sensitivities have been calculated by running the liability calculations in full using the alternative assumptions. In each case, only the indicated assumption has changed by the amount stated. For the inflation sensitivity, the impact on the assumptions that are based on RPI inflation, such as CPI inflation and the inflation-linked pension increases, has been included.

01: Strategic Report 02: Governance 03: Financial Statements 04: Company Information
119Oxford Instruments plc Report and Financial Statements 2017
Defined benefit scheme – UKA full actuarial valuation of the UK plan was carried out as at 31 March 2015 and has been updated to 31 March 2017 by a qualified independent actuary. The major assumptions used by the actuary for the purposes of IAS 19 were (in nominal terms):
As at As at 31 March 31 March 2017 2016 % %
Discount rate 2.7% 3.5%
Rate of increase in pensions in payment (“3LPI”) 2.5% 2.4%
Rate of increase in pensions in payment (“5LPI”) 3.1% 2.9%
Rate of inflation (“CPI”) 2.1% 1.9%
Mortality – pre- and post-retirement 93% of S2PA tables (96%for females) 93% of S2PA tables (96% for females) – males and females future improvement in line with CMI 2016 future improvement in line with CMI 2015 with 1.25% long-term trend with 1.25% long-term trend
The mortality assumptions imply the following expected future lifetime from age 65:
2017 2016 years years
Pre-retirement – males 24.0 24.5
Pre-retirement – females 25.7 26.4
Post-retirement – males 22.6 22.7
Post-retirement – females 24.2 24.5
The assumptions have been chosen by the Directors from a range of possible actuarial assumptions, which, due to the timescales covered, may not be borne out in practice.
The assets in the plan were:
Value at Value at 31 March 31 March 2017 2016 £m £m
Equities 107.9 92.2
Corporate and Emerging Market Bonds 46.6 47.2
Gilts 47.0 37.6
Property 3.7 3.2
Commodities 5.8 5.0
Insurance-linked funds 14.8 8.4
Credit and global loan funds 12.6 5.1
Hedge funds 15.3 7.7
Absolute return fixed income fund 5.8 —
Cash 23.0 28.6
282.5 235.0

120 Oxford Instruments plc Report and Financial Statements 2017
Notes to the Financial Statements continued year ended 31 March 2017
26 Retirement benefit obligations continued
Defined benefit scheme – USAA full actuarial valuation of the USA plan was carried out as at 31 December 2014, which for reporting purposes has been updated to 31 March 2017 by a qualified independent actuary. The major assumptions used by the actuary for the purposes of IAS 19 were (in nominal terms):
As at As at 31 March 31 March 2017 2016 % %
Discount rate 4.00% 3.75%
Rate of increase to pensions in payment 0.00% 0.00%
Rate of inflation 2.00% 2.25%
Mortality – pre- and post-retirement RP-2014 with projection RP-2014 with projection Scale MP-2016 (fully generational), Scale MP-2015 (fully generational) male and female male and female
The assets in the plan were:
Value at Value at 31 March 31 March 2017 2016 £m £m
Equities 2.4 1.8
Bonds 3.0 2.7
5.4 4.5
Defined contribution schemesIn the UK employees are offered participation in the defined contribution Oxford Instruments Stakeholder Plan. The Company contribution rate and employee contribution rate varies between grades and whether the individual had previously been in the defined benefit scheme. The Company contribution ranges between 4% and 14% of base salary. The Group also operates a 401k defined distribution plan in the USA. Details of pension schemes contributions made in respect of Directors can be found in the Remuneration Report on pages 60 to 75.
27 Trade and other payables 2017 2016 £m £m
Trade payables 32.0 33.7
Customer deposits 13.2 13.4
Social security and other taxes 2.5 2.5
Accrued expenses and deferred income 40.6 43.3
Contingent consideration due within one year — 6.6
Other creditors 4.7 2.9
93.0 102.4
Contingent consideration relates to amounts payable in respect of acquisitions. It is reassessed at the end of each year to its fair value.
Contingent consideration £m
Balance at 1 April 2016 6.6
Contingent consideration paid (7.2)
Effect of movement in foreign exchange 0.6
Balance at 31 March 2017 —

01: Strategic Report 02: Governance 03: Financial Statements 04: Company Information
121Oxford Instruments plc Report and Financial Statements 2017
28 Provisions for other liabilities and charges Warranties Restructuring Other Total £m £m £m £m
Balance at 1 April 2016 6.3 1.9 3.9 12.1
Provisions made during the year 2.8 0.5 0.5 3.8
Provisions used during the year (1.8) (0.8) (0.8) (3.4)
Provisions released during the year (3.0) — (0.2) (3.2)
Effect of movement in foreign exchange 0.2 0.2 0.1 0.5
Balance at 31 March 2017 4.5 1.8 3.5 9.8
Warranty provisionsProduct warranty provisions reflect commitments made to customers on the sale of goods in the ordinary course of business and included within the Group companies’ standard terms and conditions. Warranty commitments typically apply for a twelve-month period. The provision represents the Directors’ best estimate of the Group’s liability based on past experience.
Restructuring provisionThe Restructuring provision relates to amounts provided as a result of the cost reduction programme initiated during 2015/16. The remaining provision relates principally to onerous leases arising as a result of the restructuring programme. The provision represents the Directors’ best estimate of the liability arising. The Directors believe these amounts may have to be settled within the next twelve months.
Other provisionsOther provisions relate to various obligations including obligations in respect of onerous leases, obligations to employees in Japan on termination of their employment and claims and disputes such as intellectual property claims arising against the Group in the ordinary course of business.
The Company has on occasion been required to take legal or other actions to defend itself against proceedings brought by other parties. Provisions are made for the expected costs associated with such matters, based on past experience of similar items and other known factors, taking into account professional advice received, and represent the Directors’ best estimate of the likely outcome. The timing of utilisation of these provisions is frequently uncertain reflecting the complexity of issues and the outcome of various court proceedings and negotiations. Contractual and other provisions represent the Directors’ best estimate of the cost of settling future obligations and reflect the Directors’ assessment of the likely settlement method, which may change over time. However, no provision is made for proceedings which have been, or might be brought by other parties against Group companies unless the Directors, taking into account professional advice received, assesses that it is more likely than not that such proceedings may be successful. The Group’s expectation is that the other provisions are likely to be utilised within a twelve-month period.
29 Operating leasesLeasesNon-cancellable future total minimum operating lease rentals are payable as follows:
2017 2016 £m £m
Within one year 3.8 3.2
Between one and five years 9.5 5.4
Over five years 1.6 2.1
14.9 10.7
During the year ended 31 March 2017, £4.5m was recognised as an expense in the Consolidated Statement of Income in respect of operating leases (2016: £3.0m).
The majority of operating leases relate to properties occupied by the Group in the course of its business. There are no material contingent rent payment arrangements, purchase options or escalation clauses. It is expected that most leases could be renewed on the existing or similar terms. The leases do not impose any material restrictions in respect of dividends, additional debt requirements or further leasing.

122 Oxford Instruments plc Report and Financial Statements 2017
Notes to the Financial Statements continued year ended 31 March 2017
30 Capital commitmentsDuring the year ended 31 March 2017, the Group entered into contracts to purchase property, plant and equipment which are expected to be settled in the following financial year for £nil (2016: £nil).
31 ContingenciesIn an international group of companies, a variety of legal claims arise from time to time. The Board, having taken legal advice, are of the opinion that any ongoing actions and investigations will not have a material impact on the Group’s financial position.
32 Related partiesTransactions between the Company and its subsidiaries, which are related parties, have been eliminated on consolidation and are not disclosed in this Note.
The remuneration of key management personnel is as follows:
2017 2016 £m £m
Short-term employee benefits 1.7 1.5
Post-employment benefits 0.1 0.2
Share-based payment credit (0.2) —
Total 1.6 1.7
Short-term employee benefits comprise salary and benefits earned during the year and bonuses awarded for the year.
The share-based payment credit of £0.2m (2016: £nil) arose due to the reversal of the share option charge relating to options previously issued to Jonathan Flint.
During the year the Company paid £0.1m (2016: £0.2m) to Imperialise Limited, a company for which Nigel Keen is a Director. The payment was for his services as Chairman of the Group. The liability due to Imperialise Limited at the year end was £nil (2016: £nil).
During the year, the Group supplied services and materials to, and purchased services and materials from, its associate on an arm’s length basis. It had the following transactions with its associate during the year:
Revenue Purchases Receivables Payables 2017 £m £m £m £m
Scienta Omicron GmbH 0.1 — 3.6 —
Revenue Purchases Receivables Payables 2016 £m £m £m £m
Scienta Omicron GmbH 2.0 — 3.6 —
33 Subsequent eventsThe interim dividend of 3.7p per share (total cost £2.1m) was paid after the year end. In addition on 13 June 2017, the Directors proposed a final dividend of 9.3p per ordinary share (total cost £5.3m). The total amount of £5.3m has not been provided for and there are no income tax consequences.
On 26 April 2017, the Group announced that it had agreed to sell its Industrial Analysis business to Hitachi High-Technologies Corporation (“HHT”) for a consideration of £80m on a cash and debt-free basis. HHT will acquire the companies, assets and liabilities that comprise the Industrial Analysis business.
The transaction is expected to close in the second quarter of the 2017/18 financial year. Proceeds will be used to reduce existing borrowings. The current Industrial Analysis management team will transfer with the business.

01: Strategic Report 02: Governance 03: Financial Statements 04: Company Information
123Oxford Instruments plc Report and Financial Statements 2017
34 Exchange rates The principal exchange rates to Sterling used were:
Year-end rates 2017 2016
US Dollar 1.25 1.44
Euro 1.17 1.26
Yen 139 162
Average translation rates 2017 US Dollar Euro Yen
April 1.45 1.27 159
May 1.46 1.30 159
June 1.41 1.27 150
July 1.35 1.21 138
August 1.32 1.18 134
September 1.31 1.16 132
October 1.26 1.13 130
November 1.23 1.14 134
December 1.24 1.17 142
January 1.25 1.17 144
February 1.25 1.18 142
March 1.25 1.18 140
Average translation rates 2016 US Dollar Euro Yen
April 1.50 1.37 180
May 1.52 1.37 186
June 1.55 1.40 192
July 1.57 1.41 194
August 1.55 1.39 190
September 1.53 1.36 184
October 1.53 1.38 184
November 1.53 1.41 186
December 1.49 1.39 181
January 1.45 1.33 175
February 1.40 1.29 165
March 1.41 1.27 160

124 Oxford Instruments plc Report and Financial Statements 2017
2017 2016 Notes £m £m
Assets
Non-current assets
Intangible assets d — 2.1
Tangible assets c 1.2 1.3
Investments in subsidiary undertakings e 320.5 320.2
Debtors f 3.6 3.4
Deferred tax assets h 1.7 1.9
327.0 328.9
Current assets
Debtors f 62.5 101.0
Current income tax recoverable 0.6 1.3
Cash at bank and in hand 2.5 1.4
65.6 103.7
Total assets 392.6 432.6
Equity
Capital and reserves attributable to the Company’s equity Shareholders
Share capital 2.9 2.9
Share premium account 61.5 61.5
Capital redemption reserve 0.1 0.1
Other reserves 7.6 7.6
Profit and loss account 114.3 126.2
186.4 198.3
Liabilities
Non-current liabilities
Long-term loans 129.6 147.0
Retirement benefit obligations 4.9 7.1
Provisions for liabilities h 0.4 0.4
134.9 154.5
Current liabilities
Bank loans and overdrafts 22.1 30.1
Other creditors g 49.2 49.7
71.3 79.8
Total liabilities 206.2 234.3
Total liabilities and equity 392.6 432.6
The Financial Statements were approved by the Board of Directors on 13 June 2017 and signed on its behalf by:
Ian Barkshire Gavin HillDirector Director
Company number: 775598
Parent Company Statement of Financial Position as at 31 March 2017

01: Strategic Report 02: Governance 03: Financial Statements 04: Company Information
125Oxford Instruments plc Report and Financial Statements 2017
Statement of Changes in Equity year ended 31 March 2017
Share Capital Profit Share premium redemption Other and loss capital account reserve reserves account Total £m £m £m £m £m £m
Balance at 1 April 2015 (restated) 2.9 61.5 0.1 7.6 135.3 207.4
Loss for the year — — — — (5.4) (5.4)
Other comprehensive income:
Remeasurement of defined benefit liability, net of tax — — — — 3.5 3.5
Total comprehensive income for the year — — — — (1.9) (1.9)
Proceeds from shares issued — — — — — —
Share options awarded to employees — — — — 0.3 0.3
Share options awarded to employees of subsidiaries — — — — 0.1 0.1
Dividends paid — — — — (7.6) (7.6)
Balance at 31 March 2016 2.9 61.5 0.1 7.6 126.2 198.3
Loss for the year — — — — (6.7) (6.7)
Other comprehensive income:
Remeasurement of defined benefit liability, net of tax — — — — 1.7 1.7
Total comprehensive income for the year — — — — (5.0) (5.0)
Proceeds from shares issued — — — — — —
Share options awarded to employees — — — — 0.2 0.2
Share options awarded to employees of subsidiaries — — — — 0.3 0.3
Dividends paid — — — — (7.4) (7.4)
Balance at 31 March 2017 2.9 61.5 0.1 7.6 114.3 186.4
Details of issued, authorised and allotted share capital are included in Note 24 to the Group Financial Statements.
Details of treasury shares held by the Company are included as a Note to the Consolidated Statement of Changes in Equity.
Details of the Group’s share option schemes are included in Note 13 to the Group Financial Statements.
Details of the Group’s defined benefit pension scheme are included in Note 26 to the Group Financial Statements.
Details of dividends paid are included in Note 15 to the Group Financial Statements.
Other reserves relates to premium on shares issued as part of acquisitions made in the year to 31 March 1987.

126 Oxford Instruments plc Report and Financial Statements 2017
Notes to the Parent Company Financial Statementsyear ended 31 March 2017
(a) Accounting policiesOxford Instruments plc is a company incorporated and domiciled in the UK.
These Financial Statements were prepared in accordance with Financial Reporting Standard 101 Reduced Disclosure Framework (“FRS 101”). The amendments to FRS 101 (2013/14 Cycle) issued in July 2015 and effective immediately have been applied.
In preparing these Financial Statements, the Company applies the recognition, measurement and disclosure requirements of International Financial Reporting Standards as adopted by the EU (“Adopted IFRS”), but makes amendments where necessary in order to comply with Companies Act 2006 and has set out below where advantage of the FRS 101 disclosure exemptions has been taken.
In these Financial Statements, the Company has applied the exemptions available under FRS 101 in respect of the following disclosures:
• a Cash Flow Statement and related notes;
• comparative period reconciliations for share capital, tangible fixed assets, intangible assets and investment properties;
• disclosures in respect of transactions with wholly owned subsidiaries;
• disclosures in respect of capital management;
• the effects of new but not yet effective IFRS; and
• disclosures in respect of the compensation of key management personnel.
As the consolidated Financial Statements of Oxford Instruments plc include the equivalent disclosures, the Company has also taken the exemptions under FRS 101 available in respect of the following disclosures:
• IFRS 2 Share-based Payments in respect of Group settled share-based payments;
• certain disclosures required by IAS 36 Impairment of Assets in respect of the impairment of goodwill and indefinite life intangible assets; and
• certain disclosures required by IFRS 13 Fair Value Measurement and the disclosures required by IFRS 7 Financial Instrument Disclosures.
The accounting policies set out below have, unless otherwise stated, been applied consistently to all periods presented in these Financial Statements.
Measurement conventionThe Financial Statements are prepared on the historical cost basis except that the following assets and liabilities are stated at their fair value: derivative financial instruments.
Going concernThe Financial Statements have been prepared on a going concern basis, based on the Directors’ opinion, after making reasonable enquiries, that the Company has adequate resources to continue in operational existence for the foreseeable future.
TaxationIncome tax on the profit or loss for the year comprises current and deferred tax. Income tax is recognised in profit or loss except to the extent that it relates to items recognised directly in equity, in which case it is recognised in equity.
Current tax is the expected tax payable on the taxable income for the year, using tax rates enacted or substantively enacted at the reporting date, and any adjustment to tax payable in respect of previous years.
Deferred tax is recognised in respect of temporary differences between the carrying amounts of assets and liabilities for financial reporting purposes and the amounts used for taxation purposes. The following temporary differences are not provided for: the initial recognition of goodwill; the initial recognition of assets or liabilities that affect neither accounting nor taxable profit; and differences relating to investments in subsidiaries to the extent that they will probably not reverse in the future.
The amount of deferred tax provided is based on the expected manner of realisation or settlement of the carrying amount of assets and liabilities, using tax rates enacted or substantively enacted at the Balance Sheet date.
A deferred tax asset is recognised only to the extent that it is probable that future taxable profits will be available against which the asset can be utilised. Deferred tax assets are reduced to the extent that it is no longer probable that the related tax benefit will be realised.
Additional income taxes that arise from the distribution of dividends are recognised at the same time as the liability to pay the related dividend.
Non-derivative financial instrumentsNon-derivative financial instruments comprise trade and other debtors, cash and cash equivalents, loans and borrowings, and trade and other creditors.
Trade and other debtors Trade and other debtors are recognised initially at fair value. Subsequent to initial recognition they are measured at amortised cost using the effective interest method, less any impairment losses.
Trade and other creditors Trade and other creditors are recognised initially at fair value. Subsequent to initial recognition they are measured at amortised cost using the effective interest method.
Cash and cash equivalentsCash and cash equivalents comprise cash balances and call deposits.
Interest-bearing borrowingsInterest-bearing borrowings are recognised initially at fair value less attributable transaction costs. Subsequent to initial recognition, interest-bearing borrowings are stated at amortised cost using the effective interest method, less any impairment losses. Details of the Group’s interest-bearing borrowings are included in Note 25 to the Group Financial Statements.
Intra-Group lendingThe Company has lent funds to and from its UK subsidiaries on interest-free terms. These amounts are repayable on demand. They are stated at cost less any impairment losses.
Derivative financial instrumentsThe Company’s accounting policies for financial instruments are the same as the Group’s accounting policies under IFRS, namely IAS 32 Financial Instruments: Presentation, IAS 39 Financial Instruments: Recognition and Measurement and IFRS 7 Financial Instruments: Disclosures. These policies are set out in accounting policy “(e) Financial instruments” in the Group accounting policies, on pages 85 and 86.
Tangible fixed assetsTangible fixed assets are stated at cost less accumulated depreciation and accumulated impairment losses.
Where parts of an item of tangible fixed assets have different useful lives, they are accounted for as separate items of tangible fixed assets.

01: Strategic Report 02: Governance 03: Financial Statements 04: Company Information
127Oxford Instruments plc Report and Financial Statements 2017
Depreciation is charged to the profit and loss account on a straight-line basis over the estimated useful lives of each part of an item of tangible fixed assets. The estimated useful lives are as follows:
• Computer equipment 4 years
• Motor vehicles 4 years
Depreciation methods, useful lives and residual values are reviewed at each balance sheet date.
Intangible assets Intangible assets represents internally developed software. Amortisation is charged to the profit and loss account on a straight-line basis over the estimated useful lives of intangible assets unless such lives are indefinite. Intangible assets are amortised from the date they are available for use. The estimated useful lives are as follows:
• Computer software 10 years
Impairment excluding deferred tax assetsFinancial assets (including trade and other debtors)The Company assesses at each Balance Sheet reporting date whether there is any objective evidence that a financial asset, or group of financial assets, is impaired. A financial asset, or group of financial assets, is deemed to be impaired if, and only if, there is objective evidence of impairment as a result of one or more events that have occurred after the initial recognition of the asset (an incurred “loss event”) and that loss event has an impact on the estimated future cash flows of the financial asset or group of financial assets that can be reliably estimated.
Non-financial assetsThe carrying amounts of the Company’s non-financial assets, other than deferred tax assets, are reviewed at each reporting date to determine whether there is any indication of impairment. If any such indication exists, then the asset’s recoverable amount is estimated.
The recoverable amount of an asset or cash generating unit is the greater of its value in use and its fair value less costs to sell. In assessing value in use, the estimated future cash flows are discounted to their present value using a pre-tax discount rate that reflects current market assessments of the time value of money and the risks specific to the asset. For the purpose of impairment testing, assets that cannot be tested individually are grouped
together into the smallest group of assets that generates cash inflows from continuing use that are largely independent of the cash inflows of other assets or groups of assets (the “cash generating unit” or “CGU”).
An impairment loss is recognised if the carrying amount of an asset or its CGU exceeds its estimated recoverable amount. Impairment losses are recognised in profit or loss. Impairment losses recognised in respect of CGUs are allocated first to reduce the carrying amount of any goodwill allocated to the units, and then to reduce the carrying amounts of the other assets in the unit (group of units) on a pro-rata basis.
Impairment losses recognised in prior periods are assessed at each reporting date for any indications that the loss has decreased or no longer exists. An impairment loss is reversed if there has been a change in the estimates used to determine the recoverable amount. An impairment loss is reversed only to the extent that the asset’s carrying amount does not exceed the carrying amount that would have been determined, net of depreciation or amortisation, if no impairment loss had been recognised.
Employee benefitsDefined contribution plansA defined contribution plan is a post-employment benefit plan under which the Company pays fixed contributions into a separate entity and will have no legal or constructive obligation to pay further amounts. Obligations for contributions to defined contribution pension plans are recognised as an expense in the profit and loss account in the periods during which services are rendered by employees.
Defined benefit plansA defined benefit plan is a post-employment benefit plan other than a defined contribution plan. The Company’s net obligation in respect of defined benefit pension plans is calculated by estimating the amount of future benefit that employees have earned in return for their service in the current and prior periods; that benefit is discounted to determine its present value, and the fair value of any plan assets (at bid price) are deducted. The Company determines the net interest on the net defined benefit liability/(asset) for the period by applying the discount rate used to measure the defined benefit obligation at the beginning of the annual period to the net defined benefit liability/(asset).
The discount rate is the yield at the reporting date on bonds that have a credit rating of at least AA that have maturity dates approximating the terms of the Company’s obligations and that are denominated in the currency in which the benefits are expected to be paid.
Remeasurements arising from defined benefit plans comprise actuarial gains and losses, the return on plan assets (excluding interest) and the effect of the asset ceiling (if any, excluding interest). The Company recognises them immediately in other comprehensive income and all other expenses related to defined benefit plans in employee benefit expenses in profit or loss.
The calculation of the defined benefit obligations is performed by a qualified actuary using the projected unit credit method. When the calculation results in a benefit to the Company, the recognised asset is limited to the present value of benefits available in the form of any future refunds from the plan or reductions in future contributions and takes into account the adverse effect of any minimum funding requirements.
The Company is the sponsoring employer of a Group-wide defined benefit pension plan. The net defined benefit cost of the plans is charged to participating entities on the basis of the proportion of scheme membership attributable to each legal entity at the reporting date. The contributions payable by the participating entities are determined using an agreed ratio which has been in place for approximately ten years.
Short-term benefitsShort-term employee benefit obligations are measured on an undiscounted basis and are expensed as the related service is provided. A liability is recognised for the amount expected to be paid under short-term cash bonus or profit-sharing plans if the Company has a present legal or constructive obligation to pay this amount as a result of past service provided by the employee and the obligation can be estimated reliably.
128 Oxford Instruments plc Report and Financial Statements 2017
Notes to the Parent Company Financial Statements continued year ended 31 March 2017
(a) Accounting policies continued
Termination benefitsTermination benefits are recognised as an expense when the Company is demonstrably committed, without realistic possibility of withdrawal, to a formal detailed plan to either terminate employment before the normal retirement date, or to provide termination benefits as a result of an offer made to encourage voluntary redundancy. Termination benefits for voluntary redundancies are recognised as an expense if the company has made an offer of voluntary redundancy, it is probably that the offer will be accepted, and the number of acceptances can be estimated reliably. If benefits are payable more than twelve months after the reporting date, then they are discounted to their present value.
Share-based payment transactionsThe grant date fair value of share-based payments awards granted to employees is recognised as an employee expense, with a corresponding increase in equity, over the period in which the employees become unconditionally entitled to the awards. The fair value of the awards granted is measured using an option valuation model, taking into account the terms and conditions upon which the awards were granted. The amount recognised as an expense is adjusted to reflect the actual number of awards for which the related service and non-market vesting conditions are expected to be met, such that the amount ultimately recognised as an expense is based on the number of awards that do meet the related service and non-market performance conditions at the vesting date. For share-based payment awards with non-vesting conditions, the grant date fair value of the share-based payment is measured to reflect such conditions and there is no true-up for differences between expected and actual outcomes.
Where the Company grants options over its own shares to the employees of its subsidiaries it recognises, in its individual Financial Statements, an increase in the cost of investment in its subsidiaries equivalent to the equity settled share-based payment charge recognised in its consolidated Financial Statements with the corresponding credit being recognised directly in equity. Amounts recharged to the subsidiary are recognised as a reduction in the cost of investment in subsidiary. If the amount recharged exceeds the increase in the cost of investment the excess is recognised as a dividend.
Own shares held by ESOP trustTransactions of the Company-sponsored ESOP trust are treated as being those of the Company and are therefore reflected in the Company Financial Statements. In particular, the trust’s purchases and sales of shares in the Company are debited and credited directly to equity.
ProvisionsA provision is recognised in the Balance Sheet when the Company has a present legal or constructive obligation as a result of a past event, that can be reliably measured and it is probable that an outflow of economic benefits will be required to settle the obligation. Provisions are determined by discounting the expected future cash flows at a pre-tax rate that reflects risks specific to the liability.
LeasesPayments (excluding costs for services and insurance) made under operating leases are recognised in the profit and loss account on a straight-line basis over the term of the lease. Lease incentives received are recognised in the profit and loss account as an integral part of the total lease expense.
Foreign currenciesThe Company enters into forward exchange contracts and options to mitigate the currency exposures that arise on sales and purchases denominated in foreign currencies. Transactions in foreign currencies are converted into Sterling at the rate ruling on the date of the transaction. Monetary assets and liabilities denominated in foreign currencies are translated at the rates ruling at the Balance Sheet date or at the appropriate forward contract rates. Exchange profits and losses arising from the above are dealt with in the profit and loss account.
Own shares held by Employee Benefit Trust (“EBT”)Transactions of the Group-sponsored EBT are included in the Group Financial Statements. In particular, the trust’s purchase of shares in the Company are debited directly to equity.
InvestmentsInvestments in subsidiaries are stated at cost, less any provision for impairment, where appropriate.
ProvisionsProvisions are recognised in the period when it becomes probable that there will be a future outflow of funds resulting from past expectations or events which can be reasonably estimated. The timing of recognition requires the application of judgement to existing facts and circumstances which can be subject to change. Amounts provided represent the Group’s best estimate of exposure based on currently available information.
Dividends on shares presented within Shareholders’ fundsDividends unpaid at the Balance Sheet date are only recognised as a liability at that date to the extent that they are appropriately authorised and are no longer at the discretion of the Company. Unpaid dividends that do not meet these criteria are disclosed in the notes to the Financial Statements.
Financial guarantee contractsWhere the Company enters into financial guarantee contracts to guarantee the indebtedness of other companies within its Group, the Company considers these to be insurance arrangements and accounts for them as such. In this respect, the Company treats the guarantee contract as a contingent liability until such time as it becomes probable that the Company will be required to make a payment under the guarantee.
(b) Loss for the yearThe Company’s loss for the financial year was £6.7m (2016: loss of £5.4m). Other Comprehensive Income in the year was £1.7m (2016: £3.5m). The expense will not subsequently be reclassified to profit or loss.
The auditor’s remuneration comprised £140,000 (2016: £150,000) for the statutory audit.
The average number of people employed by the Company (including Directors) during the year was 51 (2016: 51). All of these individuals were involved in administration.
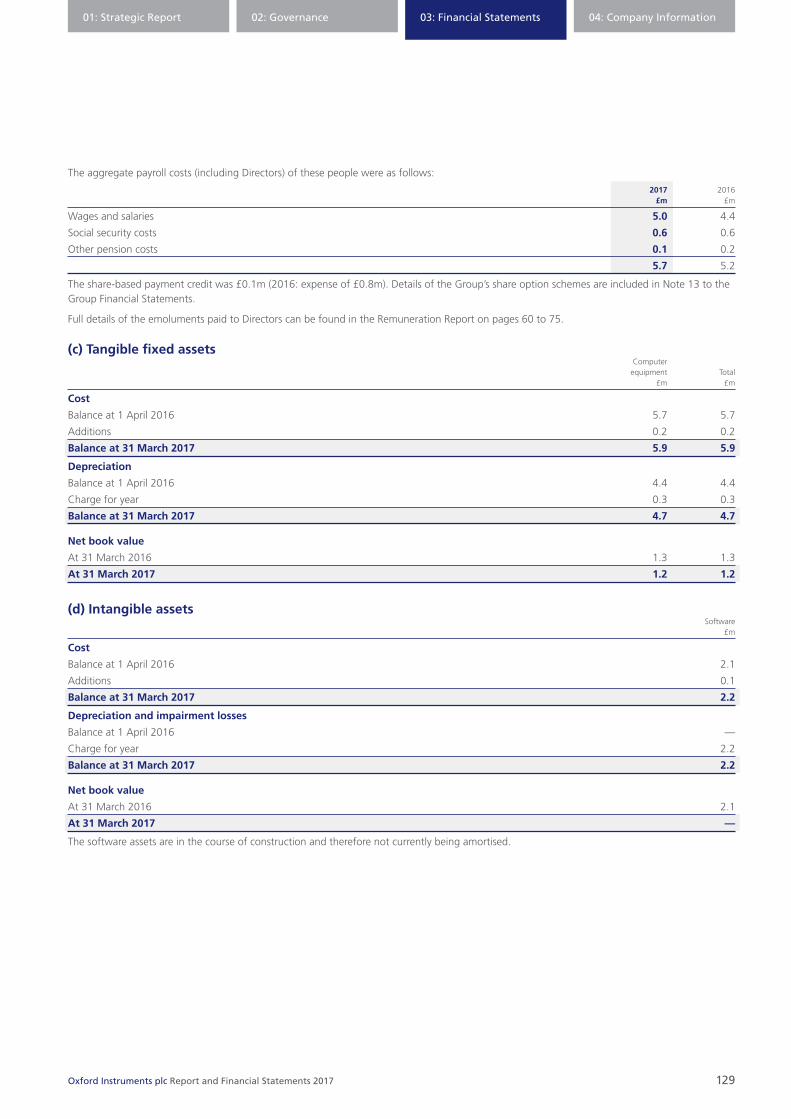
01: Strategic Report 02: Governance 03: Financial Statements 04: Company Information
129Oxford Instruments plc Report and Financial Statements 2017
The aggregate payroll costs (including Directors) of these people were as follows:
2017 2016 £m £m
Wages and salaries 5.0 4.4
Social security costs 0.6 0.6
Other pension costs 0.1 0.2
5.7 5.2
The share-based payment credit was £0.1m (2016: expense of £0.8m). Details of the Group’s share option schemes are included in Note 13 to the Group Financial Statements.
Full details of the emoluments paid to Directors can be found in the Remuneration Report on pages 60 to 75.
(c) Tangible fixed assets Computer equipment Total £m £m
Cost
Balance at 1 April 2016 5.7 5.7
Additions 0.2 0.2
Balance at 31 March 2017 5.9 5.9
Depreciation
Balance at 1 April 2016 4.4 4.4
Charge for year 0.3 0.3
Balance at 31 March 2017 4.7 4.7
Net book value
At 31 March 2016 1.3 1.3
At 31 March 2017 1.2 1.2
(d) Intangible assets Software £m
Cost
Balance at 1 April 2016 2.1
Additions 0.1
Balance at 31 March 2017 2.2
Depreciation and impairment losses
Balance at 1 April 2016 —
Charge for year 2.2
Balance at 31 March 2017 2.2
Net book value
At 31 March 2016 2.1
At 31 March 2017 —
The software assets are in the course of construction and therefore not currently being amortised.

130 Oxford Instruments plc Report and Financial Statements 2017
(e) Investments Investments in subsidiary undertakings £m
Cost or valuation
Balance at 1 April 2016 338.9
Expense in respect of share options transferred to subsidiary undertakings 0.3
Balance at 31 March 2017 339.2
Impairment
Balance at 1 April 2016 and 31 March 2017 18.7
Net book value
At 31 March 2016 320.2
At 31 March 2017 320.5
The following is a full list of the subsidiaries and associates and their country of registration as at 31 March 2017. This information is provided in accordance with Section 409 of the Companies Act 2006.
Unless otherwise stated, entities listed below are wholly owned by either the Company or a subsidiary of the Company.
Registered Country of office address incorporation
Subsidiaries
NanoTechnology Tools Limited Tubney Woods, Abingdon, Oxon, OX13 5QX UK
Oxford Instruments Analytical Limited Tubney Woods, Abingdon, Oxon, OX13 5QX UK
Oxford Instruments Superconductivity Limited Tubney Woods, Abingdon, Oxon, OX13 5QX UK
Oxford Instruments Innovation Limited Tubney Woods, Abingdon, Oxon, OX13 5QX UK
Oxford Instruments NanoScience Limited Tubney Woods, Abingdon, Oxon, OX13 5QX UK
Oxford Magnet Technology Limited Tubney Woods, Abingdon, Oxon, OX13 5QX UK
Oxford Instruments Industrial Analysis Limited Tubney Woods, Abingdon, Oxon, OX13 5QX UK
Oxford Instruments Industrial Products Holdings Limited Tubney Woods, Abingdon, Oxon, OX13 5QX UK
Oxford Instruments Industrial Products Limited Tubney Woods, Abingdon, Oxon, OX13 5QX UK
RMG Technology Limited Tubney Woods, Abingdon, Oxon, OX13 5QX UK
Oxford Instruments NanoAnalysis Limited Tubney Woods, Abingdon, Oxon, OX13 5QX UK
Oxford Instruments NanoTechnology Tools Holdings Limited Tubney Woods, Abingdon, Oxon, OX13 5QX UK
Andor Technology Limited 7 Millennium Way, Springvale Business Park, Belfast, NI, BT12 7AL UK
Andor U.S. Holdings, Inc 425 Sullivan Avenue, Suite 3, South Windsor, CT 06074 USA
Apogee Imaging Systems Inc 425 Sullivan Avenue, Suite 3, South Windsor, CT 06074 USA
Bitplane AG Badenerstrasse 682, 8048, Zürich Switzerland
Bitplane Inc 425 Sullivan Avenue, Suite 3, South Windsor, CT 06074 USA
Spectral Applied Research Inc 199 Bay Street, Suite 5300, Commerce Court West, Toronto ON M5L 1B9 Canada
Oxford Instruments Molecular Biotools Limited Tubney Woods, Abingdon, Oxon, OX13 5QX UK
Resonance Instruments Limited Tubney Woods, Abingdon, Oxon, OX13 5QX UK
Oxford Instruments NanoTechnology Tools Limited Tubney Woods, Abingdon, Oxon, OX13 5QX UK
Link Analytical Limited Tubney Woods, Abingdon, Oxon, OX13 5QX UK
Oxbridge Instruments Limited Tubney Woods, Abingdon, Oxon, OX13 5QX UK
Oxford Instruments AFM Limited Tubney Woods, Abingdon, Oxon, OX13 5QX UK
Oxford Instruments Plasma Technology Limited Tubney Woods, Abingdon, Oxon, OX13 5QX UK
Plasma Technology (UK) Limited Tubney Woods, Abingdon, Oxon, OX13 5QX UK
Oxford Instruments Overseas Holdings Limited Tubney Woods, Abingdon, Oxon, OX13 5QX UK
Notes to the Parent Company Financial Statements continued year ended 31 March 2017
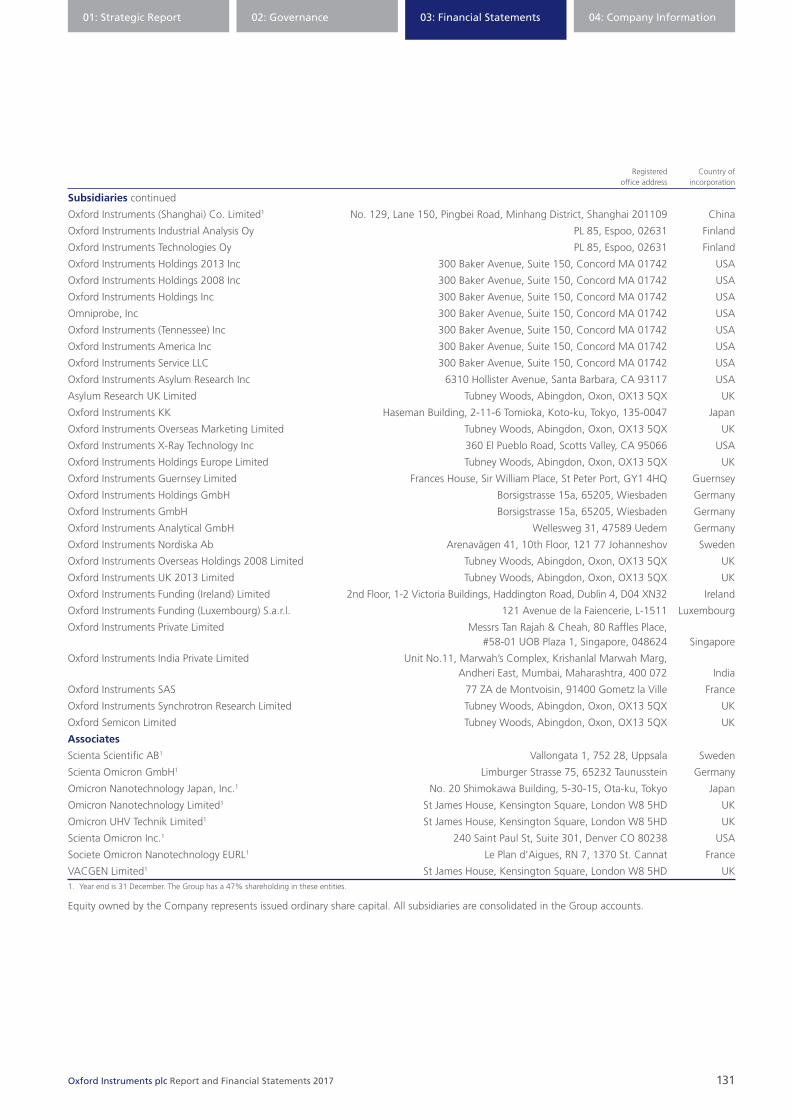
01: Strategic Report 02: Governance 03: Financial Statements 04: Company Information
131Oxford Instruments plc Report and Financial Statements 2017
Registered Country of office address incorporation
Subsidiaries continued
Oxford Instruments (Shanghai) Co. Limited1 No. 129, Lane 150, Pingbei Road, Minhang District, Shanghai 201109 China
Oxford Instruments Industrial Analysis Oy PL 85, Espoo, 02631 Finland
Oxford Instruments Technologies Oy PL 85, Espoo, 02631 Finland
Oxford Instruments Holdings 2013 Inc 300 Baker Avenue, Suite 150, Concord MA 01742 USA
Oxford Instruments Holdings 2008 Inc 300 Baker Avenue, Suite 150, Concord MA 01742 USA
Oxford Instruments Holdings Inc 300 Baker Avenue, Suite 150, Concord MA 01742 USA
Omniprobe, Inc 300 Baker Avenue, Suite 150, Concord MA 01742 USA
Oxford Instruments (Tennessee) Inc 300 Baker Avenue, Suite 150, Concord MA 01742 USA
Oxford Instruments America Inc 300 Baker Avenue, Suite 150, Concord MA 01742 USA
Oxford Instruments Service LLC 300 Baker Avenue, Suite 150, Concord MA 01742 USA
Oxford Instruments Asylum Research Inc 6310 Hollister Avenue, Santa Barbara, CA 93117 USA
Asylum Research UK Limited Tubney Woods, Abingdon, Oxon, OX13 5QX UK
Oxford Instruments KK Haseman Building, 2-11-6 Tomioka, Koto-ku, Tokyo, 135-0047 Japan
Oxford Instruments Overseas Marketing Limited Tubney Woods, Abingdon, Oxon, OX13 5QX UK
Oxford Instruments X-Ray Technology Inc 360 El Pueblo Road, Scotts Valley, CA 95066 USA
Oxford Instruments Holdings Europe Limited Tubney Woods, Abingdon, Oxon, OX13 5QX UK
Oxford Instruments Guernsey Limited Frances House, Sir William Place, St Peter Port, GY1 4HQ Guernsey
Oxford Instruments Holdings GmbH Borsigstrasse 15a, 65205, Wiesbaden Germany
Oxford Instruments GmbH Borsigstrasse 15a, 65205, Wiesbaden Germany
Oxford Instruments Analytical GmbH Wellesweg 31, 47589 Uedem Germany
Oxford Instruments Nordiska Ab Arenavägen 41, 10th Floor, 121 77 Johanneshov Sweden
Oxford Instruments Overseas Holdings 2008 Limited Tubney Woods, Abingdon, Oxon, OX13 5QX UK
Oxford Instruments UK 2013 Limited Tubney Woods, Abingdon, Oxon, OX13 5QX UK
Oxford Instruments Funding (Ireland) Limited 2nd Floor, 1-2 Victoria Buildings, Haddington Road, Dublin 4, D04 XN32 Ireland
Oxford Instruments Funding (Luxembourg) S.a.r.l. 121 Avenue de la Faiencerie, L-1511 Luxembourg
Oxford Instruments Private Limited Messrs Tan Rajah & Cheah, 80 Raffles Place, #58-01 UOB Plaza 1, Singapore, 048624 Singapore
Oxford Instruments India Private Limited Unit No.11, Marwah’s Complex, Krishanlal Marwah Marg, Andheri East, Mumbai, Maharashtra, 400 072 India
Oxford Instruments SAS 77 ZA de Montvoisin, 91400 Gometz la Ville France
Oxford Instruments Synchrotron Research Limited Tubney Woods, Abingdon, Oxon, OX13 5QX UK
Oxford Semicon Limited Tubney Woods, Abingdon, Oxon, OX13 5QX UK
Associates
Scienta Scientific AB1 Vallongata 1, 752 28, Uppsala Sweden
Scienta Omicron GmbH1 Limburger Strasse 75, 65232 Taunusstein Germany
Omicron Nanotechnology Japan, Inc.1 No. 20 Shimokawa Building, 5-30-15, Ota-ku, Tokyo Japan
Omicron Nanotechnology Limited1 St James House, Kensington Square, London W8 5HD UK
Omicron UHV Technik Limited1 St James House, Kensington Square, London W8 5HD UK
Scienta Omicron Inc.1 240 Saint Paul St, Suite 301, Denver CO 80238 USA
Societe Omicron Nanotechnology EURL1 Le Plan d’Aigues, RN 7, 1370 St. Cannat France
VACGEN Limited1 St James House, Kensington Square, London W8 5HD UK1. Year end is 31 December. The Group has a 47% shareholding in these entities.
Equity owned by the Company represents issued ordinary share capital. All subsidiaries are consolidated in the Group accounts.

132 Oxford Instruments plc Report and Financial Statements 2017
(f) Debtors 2017 2016 £m £m
Amounts falling due after one year:
Amounts owed by associate undertakings 3.6 3.4
Amounts falling due within one year:
Amounts owed by subsidiary undertakings 57.5 98.0
Other debtors 4.7 2.7
Prepayments and accrued income 0.3 0.3
66.1 104.4
(g) Other creditors 2017 2016 £m £m
Trade creditors 0.1 0.6
Amounts owed to subsidiary undertakings 38.6 40.5
Tax, social security and sales related taxes 1.2 1.2
Other financial liabilities 6.7 5.8
Accruals and deferred income 2.6 1.6
49.2 49.7
(h) Provisions for liabilities Restructuring provision
Balance at 1 April 2016 0.4
Provisions made during the year —
Provisions used during the year —
Balance at 31 March 2017 0.4
Deferred tax asset 2017 2016 £m £m
Balance at 1 April 1.9 3.1
Profit and loss credit/(debit) 0.2 (1.2)
Other comprehensive income (debit)/credit (0.4) —
Balance at 31 March 1.7 1.9
The amounts of deferred tax assets are as follows:
Recognised
2017 2016 £m £m
Excess of depreciation over corresponding capital allowances 0.6 0.5
Tax losses — —
Provisions — 0.1
Employee benefits – pension and share schemes 1.1 1.3
1.7 1.9
The Company recognises deferred tax assets only to the extent that there will be suitable taxable profits from which the future reversal of the underlying timing differences can be deducted.
Notes to the Parent Company Financial Statements continued year ended 31 March 2017
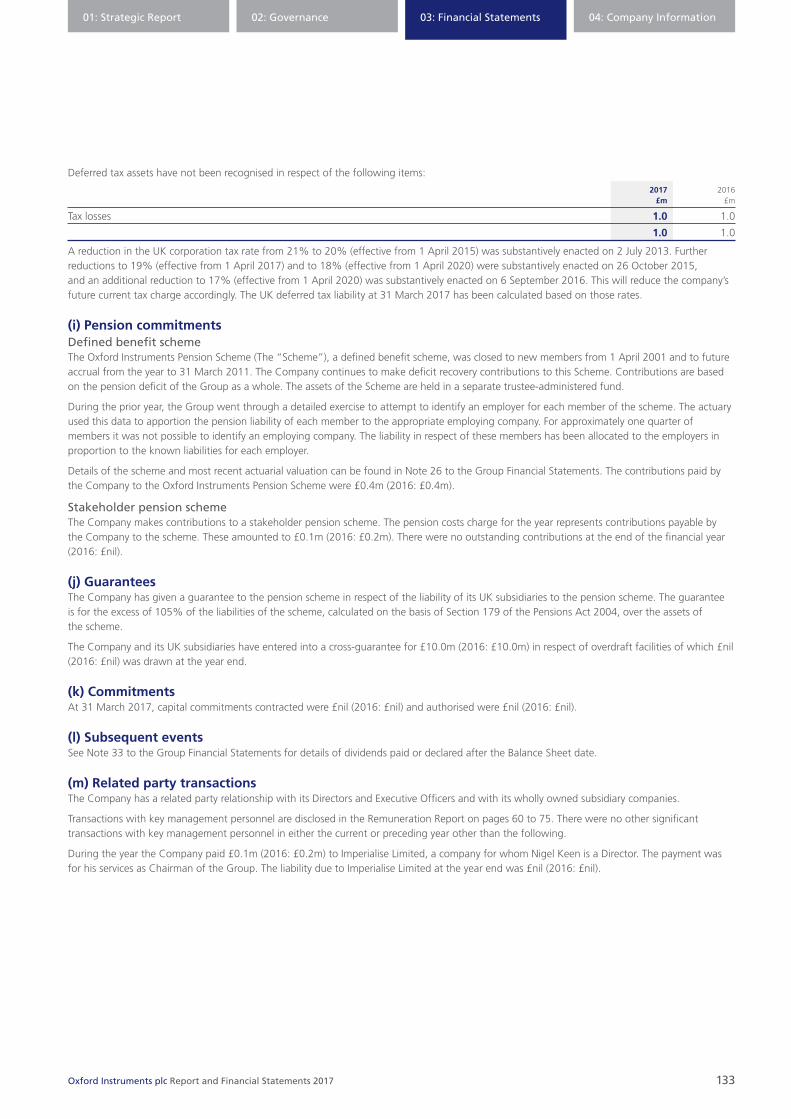
01: Strategic Report 02: Governance 03: Financial Statements 04: Company Information
133Oxford Instruments plc Report and Financial Statements 2017
Deferred tax assets have not been recognised in respect of the following items:
2017 2016 £m £m
Tax losses 1.0 1.0
1.0 1.0
A reduction in the UK corporation tax rate from 21% to 20% (effective from 1 April 2015) was substantively enacted on 2 July 2013. Further reductions to 19% (effective from 1 April 2017) and to 18% (effective from 1 April 2020) were substantively enacted on 26 October 2015, and an additional reduction to 17% (effective from 1 April 2020) was substantively enacted on 6 September 2016. This will reduce the company’s future current tax charge accordingly. The UK deferred tax liability at 31 March 2017 has been calculated based on those rates.
(i) Pension commitmentsDefined benefit schemeThe Oxford Instruments Pension Scheme (The “Scheme”), a defined benefit scheme, was closed to new members from 1 April 2001 and to future accrual from the year to 31 March 2011. The Company continues to make deficit recovery contributions to this Scheme. Contributions are based on the pension deficit of the Group as a whole. The assets of the Scheme are held in a separate trustee-administered fund.
During the prior year, the Group went through a detailed exercise to attempt to identify an employer for each member of the scheme. The actuary used this data to apportion the pension liability of each member to the appropriate employing company. For approximately one quarter of members it was not possible to identify an employing company. The liability in respect of these members has been allocated to the employers in proportion to the known liabilities for each employer.
Details of the scheme and most recent actuarial valuation can be found in Note 26 to the Group Financial Statements. The contributions paid by the Company to the Oxford Instruments Pension Scheme were £0.4m (2016: £0.4m).
Stakeholder pension schemeThe Company makes contributions to a stakeholder pension scheme. The pension costs charge for the year represents contributions payable by the Company to the scheme. These amounted to £0.1m (2016: £0.2m). There were no outstanding contributions at the end of the financial year (2016: £nil).
(j) GuaranteesThe Company has given a guarantee to the pension scheme in respect of the liability of its UK subsidiaries to the pension scheme. The guarantee is for the excess of 105% of the liabilities of the scheme, calculated on the basis of Section 179 of the Pensions Act 2004, over the assets of the scheme.
The Company and its UK subsidiaries have entered into a cross-guarantee for £10.0m (2016: £10.0m) in respect of overdraft facilities of which £nil (2016: £nil) was drawn at the year end.
(k) CommitmentsAt 31 March 2017, capital commitments contracted were £nil (2016: £nil) and authorised were £nil (2016: £nil).
(l) Subsequent eventsSee Note 33 to the Group Financial Statements for details of dividends paid or declared after the Balance Sheet date.
(m) Related party transactionsThe Company has a related party relationship with its Directors and Executive Officers and with its wholly owned subsidiary companies.
Transactions with key management personnel are disclosed in the Remuneration Report on pages 60 to 75. There were no other significant transactions with key management personnel in either the current or preceding year other than the following.
During the year the Company paid £0.1m (2016: £0.2m) to Imperialise Limited, a company for whom Nigel Keen is a Director. The payment was for his services as Chairman of the Group. The liability due to Imperialise Limited at the year end was £nil (2016: £nil).
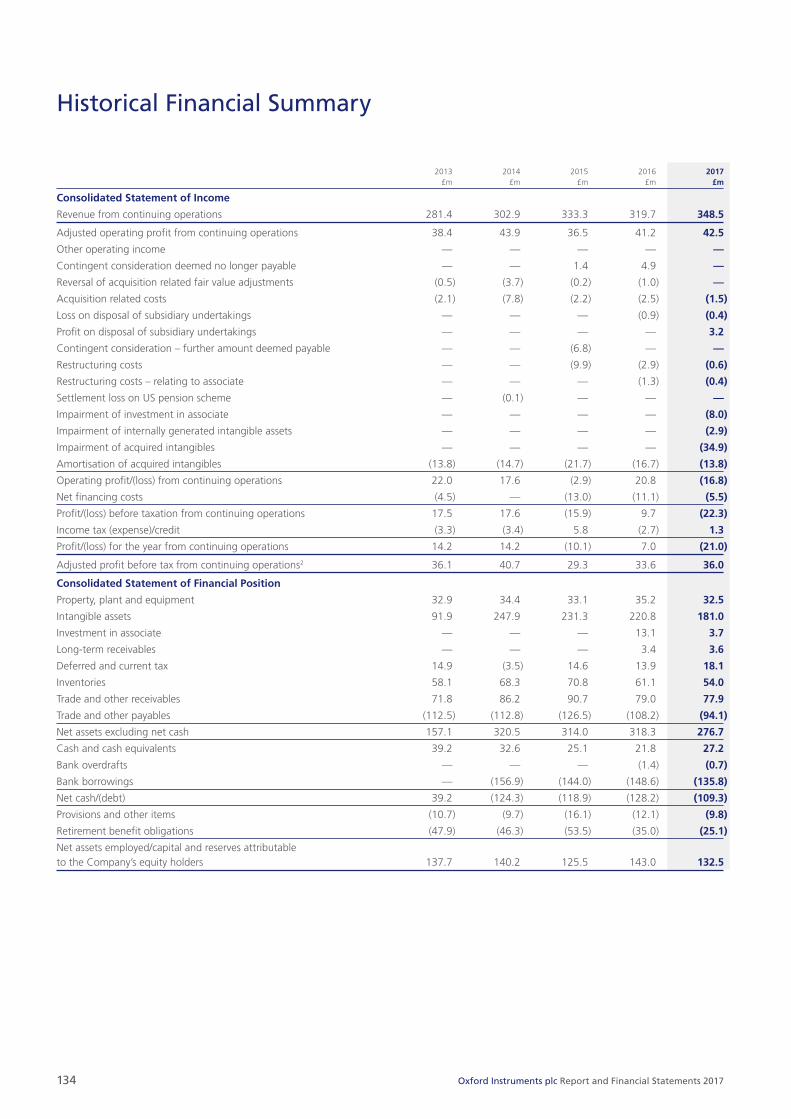
134 Oxford Instruments plc Report and Financial Statements 2017
2013 2014 2015 2016 2017 £m £m £m £m £m
Consolidated Statement of Income
Revenue from continuing operations 281.4 302.9 333.3 319.7 348.5
Adjusted operating profit from continuing operations 38.4 43.9 36.5 41.2 42.5
Other operating income — — — — —
Contingent consideration deemed no longer payable — — 1.4 4.9 —
Reversal of acquisition related fair value adjustments (0.5) (3.7) (0.2) (1.0) —
Acquisition related costs (2.1) (7.8) (2.2) (2.5) (1.5)
Loss on disposal of subsidiary undertakings — — — (0.9) (0.4)
Profit on disposal of subsidiary undertakings — — — — 3.2
Contingent consideration – further amount deemed payable — — (6.8) — —
Restructuring costs — — (9.9) (2.9) (0.6)
Restructuring costs – relating to associate — — — (1.3) (0.4)
Settlement loss on US pension scheme — (0.1) — — —
Impairment of investment in associate — — — — (8.0)
Impairment of internally generated intangible assets — — — — (2.9)
Impairment of acquired intangibles — — — — (34.9)
Amortisation of acquired intangibles (13.8) (14.7) (21.7) (16.7) (13.8)
Operating profit/(loss) from continuing operations 22.0 17.6 (2.9) 20.8 (16.8)
Net financing costs (4.5) — (13.0) (11.1) (5.5)
Profit/(loss) before taxation from continuing operations 17.5 17.6 (15.9) 9.7 (22.3)
Income tax (expense)/credit (3.3) (3.4) 5.8 (2.7) 1.3
Profit/(loss) for the year from continuing operations 14.2 14.2 (10.1) 7.0 (21.0)
Adjusted profit before tax from continuing operations2 36.1 40.7 29.3 33.6 36.0
Consolidated Statement of Financial Position
Property, plant and equipment 32.9 34.4 33.1 35.2 32.5
Intangible assets 91.9 247.9 231.3 220.8 181.0
Investment in associate — — — 13.1 3.7
Long-term receivables — — — 3.4 3.6
Deferred and current tax 14.9 (3.5) 14.6 13.9 18.1
Inventories 58.1 68.3 70.8 61.1 54.0
Trade and other receivables 71.8 86.2 90.7 79.0 77.9
Trade and other payables (112.5) (112.8) (126.5) (108.2) (94.1)
Net assets excluding net cash 157.1 320.5 314.0 318.3 276.7
Cash and cash equivalents 39.2 32.6 25.1 21.8 27.2
Bank overdrafts — — — (1.4) (0.7)
Bank borrowings — (156.9) (144.0) (148.6) (135.8)
Net cash/(debt) 39.2 (124.3) (118.9) (128.2) (109.3)
Provisions and other items (10.7) (9.7) (16.1) (12.1) (9.8)
Retirement benefit obligations (47.9) (46.3) (53.5) (35.0) (25.1)
Net assets employed/capital and reserves attributable to the Company’s equity holders 137.7 140.2 125.5 143.0 132.5
Historical Financial Summary

01: Strategic Report 02: Governance 03: Financial Statements 04: Company Information
135Oxford Instruments plc Report and Financial Statements 2017
2013 2014 2015 2016 2017 £m £m £m £m £m
Cash flow
Net cash from operating activities 33.1 12.7 16.7 34.4 32.1
Net cash used in investing activities (28.8) (177.6) (13.7) (37.1) (9.1)
Net cash from financing activities (5.2) 151.3 (19.8) (6.0) (20.2)
Net (decrease)/increase in cash equivalents from continuing operations (0.9) (13.6) (16.8) (8.7) 2.8
pence pence pence pence pence
Per ordinary share
Earnings – continuing 24.9 24.9 (17.7) 12.2 (36.8)
Adjusted earnings1 53.5 60.3 41.3 45.3 47.8
Dividends 11.2 12.4 13.0 13.0 13.0
Employees
Average number of employees 1,927 2,050 2,420 2,077 1,9741. Adjusted numbers are stated to give a better understanding of the underlying business performance. Details of adjusting items can be found in Note 1 to the Group Financial Statements.
2. Comparative figures have been restated to account for the disposal of the Group’s Superconducting Wire business.

136 Oxford Instruments plc Report and Financial Statements 2017
Financial calendar9 March 2017 Ordinary shares quoted
ex-dividend
10 March 2017 Record date for interim dividend
12 March 2017 Dividend reinvestment (“DRIP”) last date for election
31 March 2017 Financial year end
7 April 2017 Payment of interim dividend
13 June 2017 Announcement of preliminary results
13 June 2017 Announcement of final dividend
July 2017 Publication of Annual Report
12 September 2017 Annual General Meeting
21 September 2017 Ordinary shares quoted ex-dividend
23 September 2017 Record date for final dividend
25 September 2017 DRIP date
20 October 2017 Payment of final dividend
15 November 2017 Announcement of half-year results
March 2018 Ordinary shares quoted ex-dividend
March 2018 DRIP last date for election
March 2018 Record date for interim dividend
31 March 2018 Financial year end
Administrative enquiries concerning shareholdingsYou may view your shareholding and dividend history, register to receive your dividends direct to your bank account or elect to re-invest your dividends and register a change of address online at www.capitashareportal.com. To register to use this facility you will need your Investor code (IVC), which can be found on your share certificate, dividend tax voucher or proxy card.
Administrative enquiries concerning shareholdings in Oxford Instruments plc, such as the loss of a share certificate, dividend payments, or a change of address should be directed, in the first instance, to the Registrar, Capita Asset Services. The Registry, 34 Beckenham Road, Beckenham, Kent BR3 4TU.
Tel: +44 (0)871 664 0300 (calls cost 12 pence per minute plus your phone company’s access charge. Calls outside the United Kingdom will be charged at the applicable international rate. Lines are open between 09:00 – 17:30, Monday to Friday excluding public holidays in England and Wales).
Email: [email protected] Website: www.capitaassetservices.com
Correspondence should refer to Oxford Instruments plc and state clearly the registered name and address of the Shareholder. Please notify the Registrar promptly of any change of address.
Dividend bank mandatesIf you wish dividends to be paid directly into a bank or building society account and notification to be sent to your Shareholder register address, please contact the Company’s Registrar at the address given above for a dividend mandate form. Overseas holders can also choose to receive payment directly into their bank account, or can be sent a draft in local currency. Further details on international payments are available from Capita Asset Services at the contact details below.
Tel: +44 (0)871 664 0385 (calls cost 12 pence per minute plus your phone company’s access charge. Calls outside the United Kingdom will be charged at the applicable international rate. We are open between 09:00 – 17:30, Monday to Friday excluding public holidays in England and Wales).
Website: http://international.capitaregistrars.com
Duplicate share register accountsIf you are receiving more than one copy of our report, it may be that your shares are registered in two or more accounts on our register of members. If that was not your intention you might consider merging them into one single entry. Please contact Capita Asset Services, which will be pleased to carry out your instructions.
Shareholder communicationsUnless you have elected to continue to receive Shareholder communications by post, you will be notified by post or, where you have given us an email address for electronic notification, by email that Shareholder communications are available for viewing on the Company’s website at www.oxford-instruments.com/investors. The Company reserves the right to distribute any communication in hard copy if it deems this necessary.
Shareholder enquiriesShareholders who have questions relating to the Group’s business or who wish to have additional copies of the Report and Financial Statements should apply to:
Company SecretaryOxford Instruments plc Tubney Woods, Abingdon, Oxfordshire OX13 5QX
Tel: 01865 393200 Fax: 01865 393442
Email: [email protected] Website: www.oxford-instruments.com
Company registrationRegistered office: Tubney Woods, Abingdon Oxfordshire OX13 5QX
Registered in England number: 775598 Website: www.oxford-instruments.com
Oxford Instruments has an extensive website which gives details of all its products and services, contact information, vacancies and latest news announcements. An interactive investor relations section gives information on recent trading reports, share price data and forthcoming events.
Shareholder Information

01: Strategic Report 02: Governance 03: Financial Statements 04: Company Information
137Oxford Instruments plc Report and Financial Statements 2017
Capita Share Dealing ServicesA quick and easy share dealing service to either sell or buy shares in many leading UK companies is provided by Capita Share Dealing Services. An online and telephone facility is available, providing our Shareholders with an easy to access and simple to use service. There’s no need to pre-register and there are no complicated forms to fill in. The online and telephone dealing service allows you to trade “real time” at a known price which will be given to you at the time you give your instruction. To deal online or by telephone all you need is your surname, Investor Code (“IVC”) reference number, full postcode and your date of birth. Your Investor Code can be found on a recent share certificate, statement or tax voucher. Should you not be able to locate your IVC number, please contact Capita Asset Services on +44 (0)871 664 0300 (calls cost 12 pence per minute plus your phone company’s access charge. Calls outside the United Kingdom will be charged at the applicable international rate. We are open between 09:00 – 17:30, Monday to Friday excluding public holidays in England and Wales). Please have the appropriate documents to hand when you log on or call, as this information will be needed before you can buy or sell shares.
Analysis of Shareholders as at 31 March 2017 Number of Size of shareholding holders % of total Total holding % of total
Up to 5,000 shares 2,219 87.8 1,456,305 2.5
5,001 to 50,000 shares 179 7.1 2,893,098 5.1
50,001 to 200,000 shares 75 3.0 8,088,334 14.1
Over 200,000 shares 52 2.1 44,861,174 78.3
Total 2,523 100 57,298,911 100
For further information on this service, or to buy and sell shares, please contact www.capitadeal.com (online dealing) or +44 (0)371 664 0445 (telephone dealing). Calls are charged at the standard geographic rate and will vary by provider. Calls outside the United Kingdom will be charged at the applicable international rate. We are open between 09:00 – 17:30, Monday to Friday
excluding public holidays in England and Wales). Full terms, conditions and risks apply and are available on request or by visiting www.capitadeal.com.
This is not a recommendation to buy or sell shares. Remember the price of shares can go down as well as up, and you are not guaranteed to get back the amount that you originally invested.

138 Oxford Instruments plc Report and Financial Statements 2017
Company/address Descriptor Country Telephone Fax Email
Oxford Instruments Head Office Tubney Woods, Abingdon UK +44 (0) 1865 393200 +44 (0) 1865 393333 [email protected] Oxfordshire OX13 5QX, UK
NanoTechnology Tools
NanoCharacterisation
Oxford Instruments NanoAnalysis Halifax Road, High Wycombe Systems for materials UK +44 (0) 1494 442255 +44 (0) 1494 524129 [email protected] Buckinghamshire HP12 3SE, UK analysis at the nanoscale
Arenavägen 41, 10th floor Systems for materials Sweden +46 8 5448 1550 +46 8 5448 1558 [email protected] 121 77 Johanneshov, Sweden analysis at the nanoscale
Asylum Research 6310 Hollister Ave, Santa Barbara Systems for materials USA +1 (805) 696 6466 +1 (805) 696 6444 [email protected] CA 93117, USA analysis at the nanoscale
Hauptstrasse 161, DE-68259 Germany +49 621 762117 0 +49 621 762117 11 [email protected] Mannheim, Germany
3-4 Shaochuan Street, Kaohsiung City Taiwan +886 9 3837 4589 +886 2 2794 2757 [email protected] 80441, Taiwan, R.O.C.
Halifax Road, High Wycombe UK +44 (0) 1494 442255 +44 (0) 1494 524129 [email protected] Buckinghamshire HP12 3SE, UK
Andor/Bitplane/Spectral 7 Millennium Way Scientific imaging cameras, UK +44 (0) 28 9023 7126 +44 (0) 28 9031 0792 [email protected] Springvale Business Park spectroscopy solutions Belfast, BT12 7AL, UK and microscopy systems
Badenerstrasse 682, Switzerland +41 44 430 11 00 +41 44 430 11 01 [email protected] CH-8048 Zürich
9078 Leslie St., Unit 11, Richmond Hill Canada +1 (905) 326 5040 +1 (905) 326 5041 [email protected] Ontario, Canada L4B 3L8
NanoSolutions
Oxford Instruments Plasma Technology North End, Yatton Tools for nanotechnology UK +44 (0) 1934 837000 +44 (0) 1934 837001 [email protected] Bristol BS49 4AP, UK fabrication
Oxford Instruments NanoScience Tubney Woods, Abingdon Advanced tools for UK +44 (0) 1865 393200 +44 (0) 1865 393333 [email protected] Oxfordshire OX13 5QX, UK applied research
Industrial Products
Oxford Instruments Industrial Analysis Tubney Woods, Abingdon Tools for QC/QA, UK +44 (0) 1865 393200 +44 (0) 1865 393333 [email protected] Oxfordshire OX13 5QX, UK environmental and compliance testing
Derby Business Park Finland +358 932 9411 +358 932 9413 [email protected] Tarvonsalmenkatu 17 FI-02600 Espoo, Finland
Wellesweg 31, 47589 Uedem Germany +49 2825 93830 +49 2825 9383100 [email protected] Germany
8403 Cross Park Drive, Suite 3F USA +1 (512) 339 0640 +1 (512) 339 0620 [email protected] Austin, TX 78754, USA
Oxford X-Ray Technology360 El Pueblo Road, Scotts Valley X-ray tubes and detectors USA +1 (831) 439 9729 +1 (831) 439 6051 [email protected] CA 95066, USA
Service
OiService CT & MR 1027 SW 30th Avenue, USA +1 (954) 596 4945 +1 (954) 596 4946 [email protected] Deerfield Beach, FL 33442, USA
64 Union Way, Vacaville USA +1 (707) 469 1320 +1 (707) 469 1318 [email protected] CA 95687, USA
120 Enterprise Drive, Ann Arbor USA +1 (888) 323 1316 +1 (734) 822 1011 [email protected] MI 48103, USA [email protected]
Oxford Instruments Directory

01: Strategic Report 02: Governance 03: Financial Statements 04: Company Information
139Oxford Instruments plc Report and Financial Statements 2017
Company/address Descriptor Country Telephone Fax Email
Regional Sales and Service Offices
Oxford Instruments/Canada/ Latin America 300 Baker Avenue, Suite 150 USA +1 (978) 369 9933 +1 (978) 369 8287 [email protected] Concord, MA 01742, USA
Oxford Instruments China Unit 1, Building A China +86 (0) 40 0621 5191 +86 (0) 10 8271 9055 [email protected] No. 66 Zhufang Road Haidian District, Beijing, 100085, China
Floor 1, Building 60, No.461 China +86 21 6127 3858 +86 21 6127 3828 [email protected] Hongcao Road, Shanghai, 200233, China
No. 129, Lane 150, Pingbei Road China +86 (0) 21 6490 8580 +86 (0) 21 6490 4042 [email protected] Xinzhuang Industrial Area Minhang District, Shanghai, 201109, China
Room 2112, Bai Hui Plaza China +86 (0) 20 8364 9990 +86 (0) 20 8364 9996 [email protected] 193 Zhong Shan Wu Road Guangzhou 510030, China
Room 1909, Huamin Empire Plaza China +86 (0) 28 8670 3596 +86 (0) 28 8670 3595 [email protected] No.1, Fu Xing Street, Chengdu, China
Oxford Instruments Czech Republic Velvarska 13, CZ-160 00 Praha Czech +420 233 343 264 +420 234 311 724 [email protected] Czech Republic Republic
Oxford Instruments France 77 ZA de Montvoisin France +33 1 69 85 25 25 +33 1 69 41 46 80 [email protected] 91400 Gometz la Ville, France
Oxford Instruments Germany Borsigtrasse 15a, 65205 Wiesbaden, Germany +49 6122 9370 +49 6122 937100 [email protected] Germany
Oxford Instruments India 11, Marwah’s Complex, Krishanlal Marwah Marg India +91 224 4253 5100 +91 224 4253 5110 [email protected] Andheri East, Mumbai 400 072, India
Oxford Instruments Japan IS Building 3-32-42, Higashi-Shinagawa Japan +81 (0) 3 6732 8961 +81 (0) 3 6732 8937 [email protected] Shinagawa-ku Tokyo 140-0002, Japan
Oxford Instruments Korea No. 8-S 26, 8F., 10 Chungmin-ro Republic +82 2 2008 4500 +82 2 2008 4555 [email protected] Songpa-gu, Seoul 138-962 Korea (Republic of) of Korea
Oxford Instruments Russia Denisovskiy per. 26, Moscow 105005 Russia +7 (095) 933 51 23 +7 (095) 933 51 24 [email protected] Russian Federation
Oxford Instruments Singapore 10 Ubi Crescent, #04-81 Ubi TechPark Lobby E Singapore +65 6337 6848 +65 6337 6286 [email protected] Singapore 408564, Republic of Singapore
Oxford Instruments Taiwan 2F-1, No. 27, Kuang-Hsin Road,Hsin-Chu Taiwan +886 3 5788696 +886 3 5789993 [email protected] Taiwan 300, Taiwan, R.O.C.

140 Oxford Instruments plc Report and Financial Statements 2017
Directors and Advisers
Honorary PresidentSir Martin Wood OBE FRS Hon FREng DL
Company SecretarySusan Johnson-Brett ACIS
Board CommitteesAudit and RiskMary Waldner, Chairman1 Richard Friend Thomas Geitner Stephen Blair3
NominationAlan Thomson2, Chairman Richard Friend Thomas Geitner Mary Waldner Stephen Blair3
RemunerationThomas Geitner, Chairman Richard Friend Mary Waldner Alan Thomson2
Stephen Blair3
AdministrationAny two Directors
1. Mary Waldner became Chairman of of the Audit and Risk Committee on 16 June 2016.
2. Alan Thomson was appointed to the Nomination and Remuneration Committees on 1 June 2016 and was appointed Chairman of the Nomination Committee on 13 September 2016.
3. Stephen Blair was appointed to the Audit and Risk, Nomination and Remuneration Committees on 1 July 2017.
AuditorKPMG LLP
Principal BankersHSBC Bank plc Santander plc The Royal Bank of Scotland plc
StockbrokerJPMorgan Cazenove
UK SolicitorsLaytons Solicitors LLP Ashurst LLP
US CounselWilmer Hale LLP

Designed and produced by
www.lyonsbennett.com
The paper used in this report is produced using virgin wood fi bre from well-managed forests with FSC® certifi cation. All pulps used are elemental chlorine free and manufactured at a mill that has been awarded the ISO 14001 and EMAS certifi cates for environmental management. The use of the FSC® logo identifi es products which contain wood from well-managed forests certifi ed in accordance with the rules of the Forest Stewardship Council.
Printed by CPI Colour, an FSC® and ISO 14001 accredited company, who is committed to all round excellence and improving environmental performance as an important part of this strategy.

Oxfo
rd In
strum
ents p
lc Rep
ort an
d Fin
ancial Statem
ents 2017
For more information please email: [email protected]
This publication is the copyright of Oxford Instruments plc and provides outline information only, which (unless agreed by the Company in writing) may not be used, applied or reproduced for any purpose or form part of any order or contract or regarded as the representation relating to the products or services concerned. Oxford Instruments’ policy is one of continued improvement. The Company reserves the right to alter, without notice the specification, design or conditions of supply of any product or service. Oxford Instruments acknowledges all trademarks and registrations. © Oxford Instruments plc, 2017.
All rights reserved.
Find out more onlinewww.oxford-instruments.com/investors