ownership structure and board characteristics as ... · ownership structure and board...
TRANSCRIPT
Ownership Structure and Board Characteristics as Determinants of CEO Turnover in French-Listed Companies
BANG NGUYEN-DANG* HEC Paris School of Management and GREGHEC
December 2005
ABSTRACT This paper investigates ownership structure and board characteristics as determinants of CEO turnover in a sample of largest French-listed firms from 1994 to 2001. The results show that CEO turnover is negatively related to prior accounting and stock performance. Controlling for prior performance, ownership structure and characteristics of boards of directors impact the CEO turnover-performance relation. Firms with blockholders, two-tier boards, larger boards, and high government ownership are less likely to fire CEOs for poor performance, and institutional investors do not influence the CEO turnover-performance sensitivity. Keywords: CEO Turnover-Performance Sensitivity, Ownership Structure, Board of Directors, Corporate Governance JEL Classifications: G3, G30 *Bang Nguyen-Dang is from Finance Department, HEC Paris School of Management, and the GREGHEC research unit of the Centre National de la Recherche Scientique (CNRS), 1 Rue de la Liberation - 78351 Jouy-en-Josas - France. I thank François Degeorge for his enduring supports and inspiring suggestions. I am indebted to Ulrich Hege for his guidance and seminar participants at HEC Paris and the French Finance Association December 2005 Meetings in Paris for helpful comments. Help in data from Editions des Etats Majors, especially from Marie-Caroline Crabos, is gratefully acknowledged. All errors are mine. Please address all correspondence to me at [email protected].
1 Introduction
Theoretical and empirical research on corporate governance has focused on both aspects of
any governance system: control by shareholders and incentives for managers (e.g. Aghion
and Bolton (1992), Burkart, Gromb, and Panunzi (1997)). The issue is not whether control
or incentives are better, but an optimal use of both control and incentive devices. Control
helps to avoid managers’ abuse of power, shirk, perks, self-dealing, or entrenchment strate-
gies. However, greater control is more likely to eliminate managerial incentives to create
shareholder value. Thus, a number of theoretical papers (Kedia and John (2003) among
others) have explored the question of optimal governance structure.
Boards of directors play a central role in such a control-incentive trade-o¤ for they have
the right to decide of the level of control over the management and the incentive scheme to
motivate managers. Boards of directors have also to deal with two crucial (and observable)
decisions in the corporate life: to hire and/or to …re managers and to remunerate them. The
way and conditions under which boards exercise these rights might have an important impact
on corporate governance. Thus, among other things, the understanding of determinants of
top executive change helps to evaluate the e¤ectiveness of a corporate governance structure.
Prior research on top executive turnover has concentrated on board composition and
independence. Empirical evidence shows that boards dominated by outside (independent)
directors are more likely to …re CEOs for poor performance (Weisbach (1988)) and to hire
outsiders as new CEOs (Borokhovich, Parrino and Trapani (1996)). Boards are in fact not
really independent because directors are not chosen by shareholders but by the CEOs they
are supposed to monitor (Mace (1971), MacIver (1989), and Shivdasani and Yermack (1999)).
Hence, the issue is how boards can assume its monitoring role when there are stylized facts
and empirical evidence of the implication of CEO in the selection of directors. Recent papers
have tried to model the process of selection of new directors. Hermalin and Weisbach (1998),
for example, build a model in which CEO and existing directors play a bargaining game over
the board selection process. The independence and e¤ectiveness of boards will depend on
the outcome of this game.
Corporate …nance literature traditionally argues that managerial ownership can reduce
1
agency cost. However, managerial ownership may render managers entrenched and insulated
from external market control (Denis, Denis and Sarin (1997)). A number of other factors
can also a¤ect the functioning of boards of directors, e.g. board size (Yermack (1997)), CEO
founder, and CEO tenure (Denis, Denis and Sarin (1997)). There has been little evidence
of the impact of blockholders and institutional investors on the CEO turnover-performance
relation and on the e¤ectiveness of corporate governance mechanisms related to economic,
cultural, and historical conditions of the country in which a …rm is set up and operates.1
This research attempts …ll this void by empirically studying ownership structure and board
characteristics as potential determinants of CEO change in large traded …rms in France.
France is widely thought as a country where corporate ownership is very concentrated and
boards of directors are …lled with entrenched directors.2 The French corporate governance
model is also very distinctive from those of other countries. In some countries, the corporate
law allows boards to be organized as an unique organ (one tier board) or binary entities (two-
tier board with Supervisory Board and Management Board).3 In the …rst case, the CEO
is also the chairman of the board. In the second case, the CEO and the chairmanship are
separated. Board organization is important in that it determines the relative power between
the CEO and the board which a¤ects the CEO turnover probability after poor performance.
This paper takes into account the legal form of board and empirically studies the claim made
by Viénot Report II (1999) according to which one-tier board is a more e¤ective governance
structure.
Using a sample of large quoted …rms in France between 1994 and 2001, I …nd some ma-
jor results. First, similar to previous studies by Weisbach (1988), Denis, Denis, and Sarin
(1997), and Huson, Parrino, and Starks (2001) with U.S. samples, I …nd that French CEOs
are e¤ectively sanctioned for poor performance. Forced CEO turnover is negatively and
signi…cantly correlated to prior accounting and stock performance. Second, ownership struc-1One exception is Parrino, Sias, and Starks’ paper (2003) which shows that institutional ownership
declines in the year prior to forced CEO turnover.2As The Economist quotes Claude Bebear, CEO of Axa, an insurer: “It is always the same people on
company boards, and many have amicable relations.”3There have been controversial debates on the separation of the o¢ces of chairman and CEO. See Viénot
Reports I, II for France and Cadbury Report for the U.K.
2
ture and characteristics of boards of directors impact the CEO turnover-…rm performance
sensitivity.
With respect to ownership structure, I …nd that blockholders, very present in French large
…rms, signi…cantly reduce the performance-CEO turnover sensitivity. Consequently, …rms
with blockholders are less likely to …re CEOs for poor performance. On the other hand,
institutional investors do not impact the performance-CEO turnover sensitivity. The coex-
istence of both blockholders and institutional investors only impacts the performance-CEO
turnover sensitivity at some ownership thresholds. The co-existence of a 33.3% blockholder
and an institutional ownership at one of the 5%, 10%, or 15% levels does not in‡uence the
sensitivity of CEO turnover to performance. Firms with a 50% blockholder and an institu-
tional ownership at the 5%, 10%, or 15% levels exhibit a non-signi…cant performance-CEO
turnovers sensitivity. When such a coexistence does not exist, CEO turnover is negatively
and signi…cantly related to prior performance. Government ownership weakens the …rm
performance-CEO turnover sensitivity. CEOs are less likely to be …red for poor performance
in …rms in which the government holds a stake.
With respect to board characteristics, I …nd that …rms with one-tier board show sig-
ni…cant CEO turnover-performance sensitivity. This …nding favors claims by the Viénot
I and Viénot II reports that one-tier board is more e¤ective. Board size also impacts the
performance-CEO turnover sensitivity. Firms with smaller boards have a greater performance-
CEO turnover sensitivity, thus, are more likely to oust CEOs for poor results.
This paper provides further evidence on the determinants of CEO turnovers in the context
of France and contributes to the debate on the role of blockholders and institutional investors
in corporate governance.
The paper is organized as followed. Section 2 addresses the literature and research
hypotheses. Section 3 describes the database. Empirical results are reported in Section 4.
Section 5 shows checks of robustness. I conclude the paper in the last section.
3
2 Literature and Research Hypotheses
2.1 Firm Performance and CEO Turnover
A CEO has the responsibility to act in the interest of shareholders and to maximize share-
holder value. Thus, …rm performance is one of the most important measures of CEO com-
petence. In an e¤ective corporate governance structure, if a …rm performs poorly, the CEO
should be removed. If a …rm performs well, the CEO should be rewarded. The threat of
removal is an useful and e¤ective control device of shareholders over top managers.
Numerous empirical studies of U.S. …rms report a negative correlation between …rm
prior performance and CEO turnover probability. Warner, Watts, and Wruck (1988), Par-
rino (1997), and Huson, Parrino, and Starks (2001) …nd a negative correlation between
managerial turnover and …rm performance. Hermalin and Weisbach (1988) show that the
sensitivity of CEO turnover to …rm performance is greater when boards have larger frac-
tion of outside directors. More recently, Denis, Denis, and Sarin (1997) …nd that the CEO
turnover-performance sensitivity is decreasing with managerial stakes. Following the litera-
ture, I formulate this basic hypothesis as follows:
Hypothesis 1: Prior Performance and CEO Turnovers
A CEO who performs poorly is more likely to be ousted than one who performs well. In an
e¤ective corporate governance structure, forced CEO changes should be negatively correlated
to prior performance.
2.2 Ownership Structure and Top Executive Turnover
Literature usually predicts that blockholders are more likely to exert control over the man-
agement to improve …rm performance since their stake is big enough to o¤set the costs of
control. Grossman and Hart (1980) argue that small shareholders tend to free ride on large
shareholders e¤orts. Hence, in widely held public companies, managers are entitled to great
power because no shareholder has incentives to monitor. Shleifer and Vishny’s model (1986)
shows how a large minority shareholder plays the monitoring role through a takeover threat
and mitigates the free-riding problem. Their survey (1997) also points out the central role
4
of large shareholders in any corporate governance structure in that they are able to perma-
nently put pressure on the management team and …re top managers through proxy …ght or
takeover threat.
International empirical evidence on the role of large shareholders is abundant. Using a
sample of Japanese …rms, Kaplan and Minton (1994) report that the existence of large share-
holders increases the probability of top executive replacement when …rms perform poorly.
Franks and Mayers (1994) …nd that the presence of large shareholders is negatively corre-
lated with the CEO turnover rate in a sample of German companies. From a sample of U.S.
…rms, Denis and Serrano (1996) show that executive turnover is higher in companies that
perform poorly.
Corporate governance literature has also focused on managerial ownership and predicts
that managerial equity ownership helps align the interest of shareholders and managers
and overcome moral hazard problem. Managers with important equity ownership may,
however, avoid pressure of external control threat and make internal control less e¢cient.
Consequently, high managerial ownership might result in a lesser CEO turnover-performance
sensitivity. Denis, Denis, and Sarin (1997) …nd that the probability of top executive turnover
is negatively related to stakes held by o¢cers and directors and positively related to the
presence of an outside blockholder.
This paper’s main argument is that ownership structure a¤ects the allocation of con-
trol and impacts both external and internal control mechanisms. A higher level of ownership
concentration confers more power to blockholders. However, large shareholders may monitor
and put more pressure on the managers only when they can make a pro…t from monitoring.
Consequently, as in Hypothesis 2 and Alternative Hypothesis 2, we may or may not ex-
pect an increasing CEO turnover-performance sensitivity in …rms with highly concentrated
ownership, depending on blockholders’ incentives.
Hypothesis 2: Blockholders and Performance-CEO Turnovers Sensitivity
When blockholders are provided with enough incentives to monitor top managers, the
CEO turnover-performance sensitivity should be greater. Thus, forced CEO turnovers are
more likely to happen in poorly performing …rms with higher ownership concentration.
5
Alternative Hypothesis 2: Blockholders and Performance-CEO Turnovers
Sensitivity
When blockholders are not provided with enough incentives to monitor top managers,
their presence does not impact the CEO turnover-performance sensitivity.
Institutional investors own increasing stakes in companies and wield increasing in‡uence
in corporate governance. They even engage in private negotiations with …rms about gover-
nance issues (Carleton, Nelson, and Weisbach (1998)). Big pension funds like TIAA-CREF,
Calpers, and Fidelity have been activist investors with investment strategies based on their
own corporate governance principles. To have large pension funds as shareholders might be
a good signal of managerial quality and …nancial health. Meanwhile, institutional investors
might also be a threat for managerial misbehaviors and for CEOs because they have …nancial
strength and reputation to launch proxy contests. They can either “voice” or “vote with
their feet” by selling out their shareholding (Parrino, Sias, and Starks (2003)).
The e¤ects of institutional investors on CEO turnover-…rm performance sensitivity are far
from clear. On the on hand, an institutional investor might be a signal of good management
of …rm, thus, making top management change less likely. Indeed, some pension funds state
that they only invest in “well-managed” …rms. On the other hand, the emergence of an
institutional investor may also be the result of poor management. Institutional investors just
track poorly performing and potentially valuable …rms, take a stake, …re the management,
and turn investments into pro…ts. In this case, the CEO turnover-performance sensitivity is
likely higher.
There has been empirical evidence that institutional investors are associated with im-
proved performance and governance. McConnell and Servaes (1990) …nd a positive correla-
tion between Tobin’s Q and institutional ownership. Since the empirical …nding of Jensen
and Murphy (1990) that top executive pay is not very related to performance (3.25$ pay rise
for every 1000$ rise in shareholders wealth), institutional investors usually state that they
will try to increase the pay-performance sensitivity and decrease CEO pay level.
Institutional investors are, however, di¤erent from traditional blockholders to some ex-
tent. First, they have di¤erent investment strategies. They tend not to engage in long-term
6
investments and might be, in many cases, passive investors. Second, their objectives may be
more …nancial while blockholders’ objectives may be more industrial. Therefore, as speci…ed
in Hypothesis 3 and Alternative Hypothesis 3, we should expect a greater CEO turnover-
performance sensitivity in …rms with big institutional shareholders only when they are active
investors.
Hypothesis 3: Institutional Shareholders and Performance-CEO Turnover
Sensitivity
When institutional investors are active, their monitoring is increasing with their stake.
Thus, the performance-CEO turnover sensitivity is greater in …rms with a higher level of
institutional ownership.
Alternative Hypothesis 3: Institutional Shareholders and Performance-CEO
Turnover Sensitivity
When institutional investors are passive, they do not impact the CEO turnover-performance
sensitivity.
Hypothesis 2 and Hypothesis 3 are about the separated impact of blockholders and
institutional holders on the …rm performance-CEO turnover sensitivity. However, in large
…rms, they are likely to coexist. There has been little knowledge about the impact of
the coexistence between these two categories of shareholders on the CEO turnover-…rm
performance sensitivity and on corporate governance. If they coordinate and cooperate in
monitoring the management, one should expect a greater sensitivity. If they do not join
monitoring e¤orts, one should expect lesser sensitivity. The impact on …rm performance-
CEO turnover sensitivity might even be neutralized in the case that they enter into con‡icts.
This is Hypothesis 4.
Hypothesis 4: Coexistence between Blockholders and Institutional Share-
holders and CEO Turnover-Performance Sensitivity
The coexistence of blockholders and institutional investors in a …rm may strengthen or
weaken the performance-CEO turnover sensitivity, depending on their level of cooperation
and coordination.
7
2.3 Board Characteristics and CEO Turnover
Board of directors is the representative body of shareholders in charge of monitoring man-
agers. Directors are elected to boards to protect shareholder interests. Boards of directors
deal with strategic questions such as business strategy, appointment or removal of the CEO,
and executive remuneration. Board monitoring as a counterweight to powerful CEOs might
improve the quality of management and …rm performance.
Previous papers used to measure board independence by the fraction of outside directors
who are not …rm employees or management-related. Outside directors are usually thought
to exert more control on management and to care more about shareholder value than inside
directors do. Empirical research reports mixed results. Weisbach (1988) …nd that CEO
turnover is negatively correlated to stock performance. This correlation is a stronger in
…rms with outside dominated boards. On the contrary, Hermalin and Weisbach (1991)
report non-signi…cant correlation between accounting performance and the fraction of outside
directors on the board. Another measure of board independence is equity ownership of board
members. Using Tobin’s Q as a measure of performance, Morck, Shleifer, and Vishny (1988)
…nd a statistically signi…cant, though not monotonic, correlation between Tobin’s Q and
board ownership. Board independence may also be determined by board composition and
the selection process of new directors. Directors are usually not chosen by shareholders but
by the CEO they are supposed to monitor (Mace (1971), MacIver (1989)). Shivdasani and
Yermack (1999) provide empirical evidence that when CEOs are implicated in the selection
of new directors, fewer independent directors and more gray outside directors are appointed,
and markets negatively react to such appointment announcements.
Board characteristics such as board size and organization may also a¤ect board moni-
toring. When boards are large, there is a problem of coordination among members, leading
to a loss of productivity which may o¤set the gain from a large number of directors. Jensen
(1993) notes that “as groups increase in size they become less e¤ective because the coordi-
nation and decision process problem overwhelm the advantages from having more people to
draw on.” Lipton and Lorsch (1989) criticize the dysfunction of board and propose to reduce
size of board to ten people. Yermack (1996) argues that a small board will be more likely
8
to enhance the e¢ciency of decision process, and provides evidence that smaller board is
associated with higher Tobin’s Q.
Board organization might in‡uence the allocation of power between the management
and the board. Some corporate laws allow boards to be organized as an unique organ
(one-tier board with a unique board of directors) or binary entities (two-tier board with a
supervisory board and a management board). In the …rst case, the CEO is also Chairman
of the Board. In the second case, the two functions are separated. In Germany and the
Netherlands, the Corporate Law requires boards to be two-tier. In other countries, there is
no such an obligation. The Cadbury report (1992) recommends U.K. …rms to separate the
Chairmanship from the Chief Executive function and explain publicly the reason they fail
to do so. In the U.S. and in France, nearly 80% of listed companies do not separate the two
functions.4
French corporate law allows …rms to choose between one-tier or two-tier board. However,
…rms that adopt a two-tier board are a minority. When board is one-tier, the CEO also as-
sumes chairmanship of the board and is called the PDG (President and Chief Executive).
The PDG assumes management missions because she is responsible for strategies adopted by
the board. She also assumes a management control mission because of her position as head
of the board. Critics of one-tier board point out that this organization creates ambiguous
responsibilities between the board and the PDG, giving the later “excessive power”, and
being sources of ine¢ciency, misbehaviors, and bad governance. In contrast, reports by em-
ployers’ associations (Viénot I report (1995), Viénot II report (1999)) defend the ‡exibility
of French corporate law, arguing that this ‡exibility is an organizational advantage, and
that the concentration of power in the CEO hands helps avoid the blockage in the decision
process. I summarize the potential impacts of board characteristics in Hypothesis 5.
Hypothesis 5: Board Characteristics and CEO Turnover-Performance Sensi-
tivity
5a. A one-tier board, conferring more power to the CEO, is likely to be less independent
than a two-tier board, thus, reducing the CEO turnover-…rm performance sensitivity.4See Brickley, Coles, and Jarrell (1997) for a description of the issue for U.S. …rms, and Bang Nguyen-Dang
(2005) for Frech …rms.
9
5b. Board size a¤ects the e¤ectiveness of coordination between board members and deci-
sion making process. Larger boards tend to be less e¤ective, reducing the CEO turnover-…rm
performance sensitivity.
5c. The CEO turnover-performance sensitivity depends on board independence. Thus,
performance-CEO turnover sensitivity is decreasing with the fraction of inside directors.
3 Data and Methodology
3.1 Sample
Firms in the sample are from “Le Guide des Etats Majors” over the period 1994 to 2001.
This directory compiles a list of board members of the French largest, traded and non-traded
companies, as well as biographical information of directors.
However, “Le Guide des Etats Majors” does not compile the same number of …rms every
year. From 1994 to 1996, only 200 …rms were selected, while in 1997, 300 …rms were selected.
From 1998 to 2001, 400 …rms were chosen each year. Thus, between 1994 and 2001, the total
…rm-years selected by “Le Guide des Etats Majors” are 2500 (or 5000 …rm-semesters). After
elimination of non-traded companies, the remaining …rms cover almost all of the Paris Stock
Exchange SBF120 index at the beginning of the sample period, and, for recent years, the
Paris Stock Exchange SBF250 index of the 250 largest public …rms in France. Since I am
interested in semester (semi-annual) data, the …nal sample includes 2536 …rm-semesters of
listed …rms from 1994 to 2001.
I build a unique database from four di¤erent sources. Ownership structure data are from
the DAFSALiens database. Board characteristics are obtained from “Le Guide des Etats
Majors.” Datastream provides market and accounting data. The data on CEO turnovers
are provided by the Editor of “Le Guide des Etats Majors.”
Panel A of Table I describes characteristics of …rms in the sample. They are relatively
large with an average market capitalization of 5.5 billion euros. Ownership is concentrated
with many block-holders, including the French government. Board size is similar to that
of U.S. …rms with a median size of 12. One-tier board is adopted by 80% of …rms in the
10
sample. 21% of CEOs are founders and the CEO turnover rate is 6% per semester.
3.2 CEO Turnover
French corporate law allows …rms to choose between one-tier or a two-tier board. A large
fraction of large and traded companies in France adopts the one-tier board structure in which
the CEO also assumes chairmanship of the board. A minority of …rms has two-tier board
with a Supervisory Board (Conseil de Surveillance) and a Management Board (Directoire). I
de…ne CEO turnovers as CEO (PDG in French) or Chief Executive (Président du Directoire)
departures.
“Le Guide des Etats Majors” annual survey provides information on CEO turnovers of
…rms in the sample with details on former CEOs’ names and education, the month of the
turnovers, the new CEOs’ name and education, and the last employment of new CEOs. In
addition, the survey speci…es the cause of each turnover. As in Denis, Denis, and Sarin
(1997), I distinguish two kinds of turnover. A voluntary turnover is de…ned as a CEO’s
normal retirement, death, or illness. Normal retirement is de…ned as a normal departure
due to an age limit or an organized succession.5 All other CEO changes, such as CEO
dismissal by boards, by mergers and acquisitions, or resignation are quali…ed as forced CEO
turnovers. I systematically check all available information related to each CEO turnover in
the Lexis-Nexis database to assure the reliability of the CEO turnover classi…cation.
I set up two variables for CEO turnovers. The CEO forced turnover dummy is equal to
one if there is a forced turnover, and equal to zero if there is no turnover, or a voluntary one.
The voluntary turnover dummy is equal to one if there is a voluntary turnover, and equal
to zero if there is no turnover, or a forced one. Over 2536 …rm-semesters, I obtain 179 CEO
turnovers of which 70 are voluntary and 109 are forced.
3.3 Firm Performance, Ownership, and Board Characteristics
As stock performance benchmarks, I use two-, three-, and four-semesters lagged share price
performance prior to the semester in which the CEO change occurred, market adjusted5Denis et al. (1997) …xe an age limit at the 64-66 interval.
11
performance (using the SBF250 index), and industry-adjusted performance. The accounting
performance variable is one year-lagged Ebit/Assets ratio variation.
Board characteristics include board size, legal form (one-tier or two-tier board), and the
fraction of inside directors. Board size is the total number of board members if the board is
one-tier and the total number of Supervisory Board members if the board is two-tier. Panel
C of Table I shows that the average board size is 11,5 with a maximum of 36. Insiders occupy
about 10% of total board seats. About 18.6% of …rms have two-tier boards.
Ownership data are collected from DAFSALiens CD-ROM. A blockholder is de…ned as
any individual or corporate shareholder, except institutional investors, with a substantial
holding. I create dummies at the 5%, 10%, 15%, 25%, 33%, 50% ownership thresholds at
the beginning of each year. The ownership of French corporations is very concentrated.
Panel B of Table I shows that 37.2% of …rm-semesters have at least one blockholder holding
a 50% stake, 58.7% with at least one 33.3% shareholder (the blocking minority level). Nearly
every company (96.6% of the sample) has at least one 5% blockholder. I also create dummies
for institutional ownership at the 2%, 5%, 10%, 33%, 50% thresholds. About one third of
the …rms (28,9%) has at least one institutional investor holding a 5% stake.
3.4 CEO Characteristics
I control for CEO characteristics that may a¤ect the sensitivity of CEO turnover to per-
formance. Panel D of Table I shows that French CEOs are originated from a close-knit
elite with 60% of them having graduated from the “Grandes Ecoles” system. These elite
colleges recruit students after two preparatory years by competitive exams and enroll only a
very small number of them. The Ecole Polytechnique, the most well-known undergraduate
engineering Grande Ecole, accepts only 400 students a year. 22.95 % of …rms have an ex-
senior civil servant as CEO and 9.8% have an ex-Inspecteur des Finances (Public Finance
Inspector) as CEO.6
Interlocking directorships among CEOs are frequent in large …rms in France and may
impact the sensitivity of CEO turnover to performance. Dooley (1969) is among the …rst6For a detailed description of the French corporate elite, see Bang Nguyen-Dang (2005).
12
economists who are interested in the issue. He investigates interlocking directorates among
250 largest U.S. …rms in 1965 and …nd that this phenomenon is extensive and enduring. Hal-
lock (1997) …nds that CEO interlocks tend to be associated with higher CEO compensation.
His results suggest that CEO interlocks may contribute to an agency problem. Fich and
White (2001) study CEO cross-directorships from a sample of U.S. …rms and …nd that CEO
interlocks are more likely when a board has more outside directorships and less likely when
a larger part of CEO compensation is in options. More recently, Perry and Payer (2002)
analyze executives’ board seat accumulation from a shareholders’ perspective and …nd that
additional directorships relate to negative announcement returns when the executives’ …rms
have greater agency problems, and is associated with increased …rm value when fewer agency
concerns exist.
Panel D of Table I shows that 18.73% of CEOs have at least one cross-directorship.
Interestingly, the distribution of CEO interlocks in France is comparable to that of the U.S.
(Fich and White (2000) …nd that 14.26 % of U.S. companies have at least one interlock). An
average French CEO holds 0.84 cross-directorship whereas a Grande Ecole graduate CEO
holds 1.28, a Grands Corps CEO holds 1.55 and an Inspecteur des Finances CEO holds 2.45
cross-directorships (almost 3 times the average).
4 Empirical Findings
In this section, I …rst study whether prior performance is a determinant of CEO turnover.
Second, I analyze the e¤ects of ownership structure and board characteristics on the …rm
performance-CEO turnover sensitivity. Due to the unequal number of …rms selected each
year in the sample, one may raise the question of survival bias. To address this issue, I
systematically verify results on a subsample of …rms that appear in the sample for at least
four over eight years of the sample period and only report signi…cant di¤erence.
13
4.1 Prior Performance as Determinant of CEO Turnover
As previously argued, an e¤ective board correctly rewards the top manager for good per-
formance and is able to remove the top manager for poor performance. Finance literature
on control mechanisms over top executives is rich. The …rst mechanism, internal control, is
related to the way companies are organized and the share of power between the board of
directors and the management team. For internal control to be e¤ective, boards of directors
play a crucial role because they appoint and dismiss top executives. The second mechanism,
external control, is exercised through market mechanisms such as takeovers threats or con-
trol contests. If markets and boards ful…l their monitoring role, one would expect a negative
correlation between forced CEO turnover and prior performance. This is Hypothesis 1.
Table II reports results from logistic regressions which include forced CEO turnover
as dependent variable and prior performance as the main independent variable. I use 18
month-, 24 month-, 36 month-lagged stock return as proxies for prior stock performance
and a dummy for positive variation of the Ebit/Assets ratio as a proxy for accounting
performance. I also systematically check the robustness of these tests by using alternative
measures of prior performance such as market-adjusted returns (using the SBF250 index of
the 250 largest …rms in the Paris Bourse),7 industry-adjusted returns, and dividend yield.
Results are reported if there is a signi…cant di¤erence. Regressions (1), (2), and (3) show a
negative and signi…cant correlation between prior stock returns and subsequent forced CEO
turnovers.
Researchers often hypothesize that accounting results are subject to manipulations by
managers,8 although some accounting results are di¢cult to manipulate. Using a dummy
for positive variation of Ebit/Assets ratio as a proxy for accounting performance, regression
(4) shows that the probability of a forced CEO turnover is negative and signi…cantly (at the
5% level) related to prior accounting performance. Using alternative stock and accounting
performance benchmarks, I obtain similar (not reported) results.
I also compare the average forced CEO turnover rate between the best performing and the7Previous research by Weisbach (1988), Denis et al. (1997) used the CRSP value-weighted or equal-
weighted indexes to adjust market return. Such wide and representative indexes are not available in France.8See, for example, Degeorge et al. (1999).
14
worst performing …rms. I break …rm prior performance in quintiles from (1), for …rms with
the worst performance, to (5) for …rms with the best performance, and compute accordingly
the average rate of forced CEO turnovers for …rms in each performance quintile. Results
presented in Table III show a monotonic relation. Using 36 month-lagged stock performance,
I …nd that the average CEO turnover rate is 4.4% and 0.5 % per semester for the worst
performing and the best performing …rms respectively. This result means that the worst
performing CEOs are about nine times more likely to be …red than the best performing
CEOs. Results from means-tests (the last column of Table III) indicate that the di¤erence
in the average CEO turnover rate between …rms in the two extreme quintiles of stock and
accounting performance is statistically signi…cant at the 1% and 5% levels respectively.
The empirical …ndings support Hypothesis 1. Forced CEO change is negatively and
signi…cantly correlated with prior accounting and stock performance. Poor performance
render top executive change …ve times more likely. This result is similar to previous …ndings
for U.S. …rms by Weisbach (1988) and Denis, Denis and Darin (1997). I obtain similar results
using a sub-sample of time-series data consisting of …rms selected in the sample for at least
four out of the sample’s eight years period (Results are not reported).
4.2 Ownership Structure and the CEO Turnover-Performance Sen-
sitivity
4.2.1 Blockholdings and the Performance-CEO Turnover Sensitivity
The previous section shows that poor performance likely causes subsequent CEO depar-
tures. This section investigates impacts of ownership concentration on the performance-CEO
turnover sensitivity. The answer is important in that it helps to evaluate the e¤ectiveness of
a corporate governance system. In one hand, united small shareholders or blockholders can
exert e¤ective control on CEOs to limit potential abuse or misconduct. Shleifer and Vishny
(1986) argue that large shareholders, as a counterweight to powerful managers, play an im-
portant monitoring role in publicly traded …rms and help overcome the free-riding problem
of small shareholders. Thus, one can expect a greater performance-CEO turnover sensitivity
15
in …rms with large blockholders. On the other hand, as Burkart, Gromb, and Panunzi (1997)
theoretically show, large shareholders only exert their control right if they can get a pro…t
from control. A good functioning of the market for corporate control might provide large
shareholders with enough potential pro…ts as incentives to monitor managers. However, the
overall monitoring e¤ect of large shareholders on management is not without ambiguity.
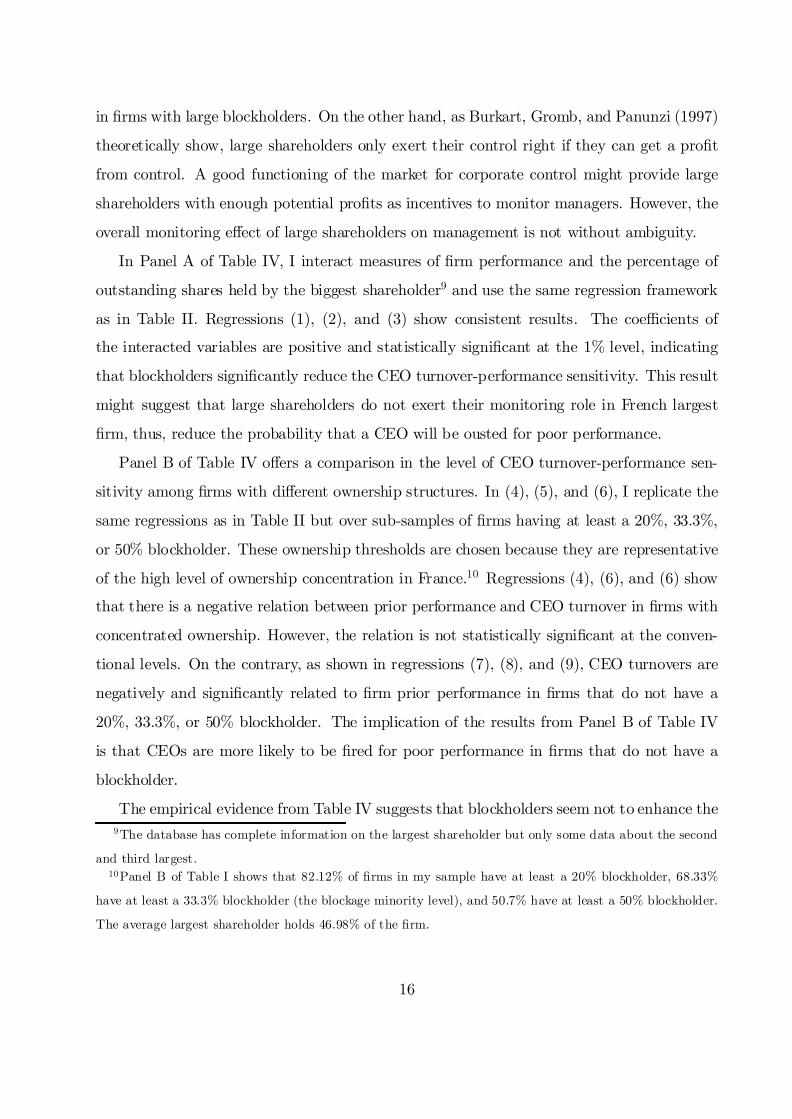
In Panel A of Table IV, I interact measures of …rm performance and the percentage of
outstanding shares held by the biggest shareholder9 and use the same regression framework
as in Table II. Regressions (1), (2), and (3) show consistent results. The coe¢cients of
the interacted variables are positive and statistically signi…cant at the 1% level, indicating
that blockholders signi…cantly reduce the CEO turnover-performance sensitivity. This result
might suggest that large shareholders do not exert their monitoring role in French largest
…rm, thus, reduce the probability that a CEO will be ousted for poor performance.
Panel B of Table IV o¤ers a comparison in the level of CEO turnover-performance sen-
sitivity among …rms with di¤erent ownership structures. In (4), (5), and (6), I replicate the
same regressions as in Table II but over sub-samples of …rms having at least a 20%, 33.3%,
or 50% blockholder. These ownership thresholds are chosen because they are representative
of the high level of ownership concentration in France.10 Regressions (4), (6), and (6) show
that there is a negative relation between prior performance and CEO turnover in …rms with
concentrated ownership. However, the relation is not statistically signi…cant at the conven-
tional levels. On the contrary, as shown in regressions (7), (8), and (9), CEO turnovers are
negatively and signi…cantly related to …rm prior performance in …rms that do not have a
20%, 33.3%, or 50% blockholder. The implication of the results from Panel B of Table IV
is that CEOs are more likely to be …red for poor performance in …rms that do not have a
blockholder.
The empirical evidence from Table IV suggests that blockholders seem not to enhance the9The database has complete information on the largest shareholder but only some data about the second
and third largest.10Panel B of Table I shows that 82.12% of …rms in my sample have at least a 20% blockholder, 68.33%
have at least a 33.3% blockholder (the blockage minority level), and 50.7% have at least a 50% blockholder.
The average largest shareholder holds 46.98% of the …rm.
16
monitoring over managers and favors Alternative Hypothesis 2. Some interpretations may be
in the order. First, a high level of ownership concentration (or pyramidal ownership) might
de facto confer control to large shareholders who may have private bene…ts in nominating
their own CEOs and maintaining them to sustain their rent extraction in detriment to
minority shareholders’ interests. Second, the market for corporate control in France might
not be e¤ective enough to reverse possible collusions between large shareholders and CEOs.
The law, as Shleifer et al. (1998) suggest, might not provide enough protection for minority
shareholders.
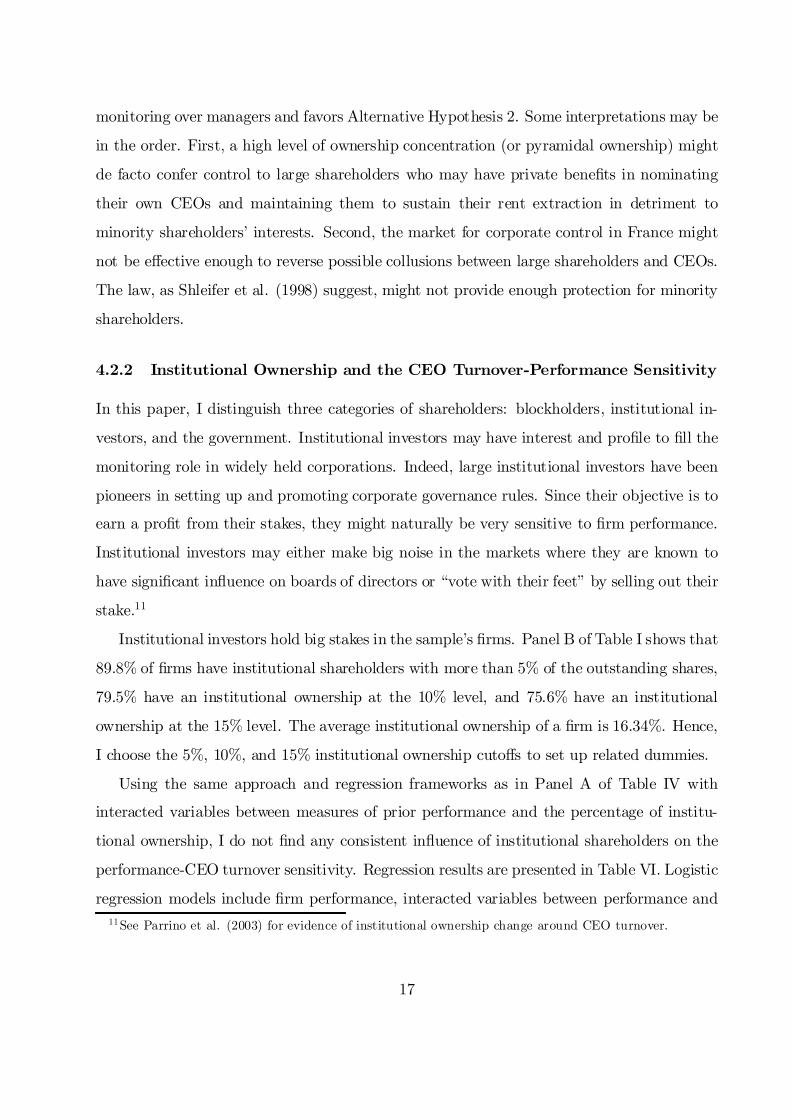
4.2.2 Institutional Ownership and the CEO Turnover-Performance Sensitivity
In this paper, I distinguish three categories of shareholders: blockholders, institutional in-
vestors, and the government. Institutional investors may have interest and pro…le to …ll the
monitoring role in widely held corporations. Indeed, large institutional investors have been
pioneers in setting up and promoting corporate governance rules. Since their objective is to
earn a pro…t from their stakes, they might naturally be very sensitive to …rm performance.
Institutional investors may either make big noise in the markets where they are known to
have signi…cant in‡uence on boards of directors or “vote with their feet” by selling out their
stake.11
Institutional investors hold big stakes in the sample’s …rms. Panel B of Table I shows that
89.8% of …rms have institutional shareholders with more than 5% of the outstanding shares,
79.5% have an institutional ownership at the 10% level, and 75.6% have an institutional
ownership at the 15% level. The average institutional ownership of a …rm is 16.34%. Hence,
I choose the 5%, 10%, and 15% institutional ownership cuto¤s to set up related dummies.
Using the same approach and regression frameworks as in Panel A of Table IV with
interacted variables between measures of prior performance and the percentage of institu-
tional ownership, I do not …nd any consistent in‡uence of institutional shareholders on the
performance-CEO turnover sensitivity. Regression results are presented in Table VI. Logistic
regression models include …rm performance, interacted variables between performance and11See Parrino et al. (2003) for evidence of institutional ownership change around CEO turnover.
17
institutional ownership at the 5%, 10%, and 15% thresholds, and various control variables
as independent variables. The dependent variable is the forced CEO turnover dummy. The
estimated coe¢cients of the interacted variables, as shown in regressions (1), (2), and (3) in
Panel A of Table V, are positive but not statistically signi…cant.
Panel B of Table V shows the relation between CEO turnover and prior performance
at di¤erent levels of institutional ownership. I replicate tests as in Panel B of Table IV,
but over the sub-samples of …rms with 5%, 10%, or 50% institutional ownership. Results
from regressions (4), (5), and (6) show that CEO turnovers are not signi…cantly related
to …rm performance for those …rms. Thus, institutional investors seem not to enhance the
monitoring over the management.
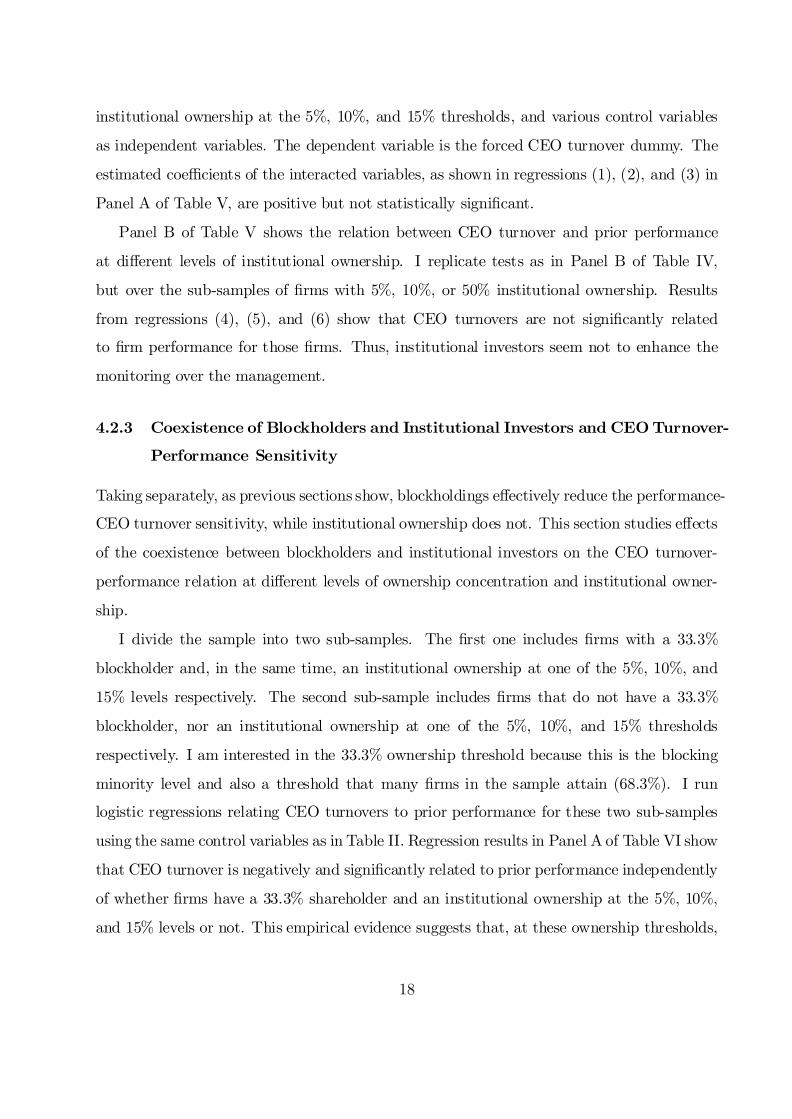
4.2.3 Coexistence of Blockholders and Institutional Investors and CEO Turnover-
Performance Sensitivity
Taking separately, as previous sections show, blockholdings e¤ectively reduce the performance-
CEO turnover sensitivity, while institutional ownership does not. This section studies e¤ects
of the coexistence between blockholders and institutional investors on the CEO turnover-
performance relation at di¤erent levels of ownership concentration and institutional owner-
ship.
I divide the sample into two sub-samples. The …rst one includes …rms with a 33.3%
blockholder and, in the same time, an institutional ownership at one of the 5%, 10%, and
15% levels respectively. The second sub-sample includes …rms that do not have a 33.3%
blockholder, nor an institutional ownership at one of the 5%, 10%, and 15% thresholds
respectively. I am interested in the 33.3% ownership threshold because this is the blocking
minority level and also a threshold that many …rms in the sample attain (68.3%). I run
logistic regressions relating CEO turnovers to prior performance for these two sub-samples
using the same control variables as in Table II. Regression results in Panel A of Table VI show
that CEO turnover is negatively and signi…cantly related to prior performance independently
of whether …rms have a 33.3% shareholder and an institutional ownership at the 5%, 10%,
and 15% levels or not. This empirical evidence suggests that, at these ownership thresholds,
18
the coexistence between blockholders and institutional investors is not detrimental to the
e¤ectiveness of corporate governance.
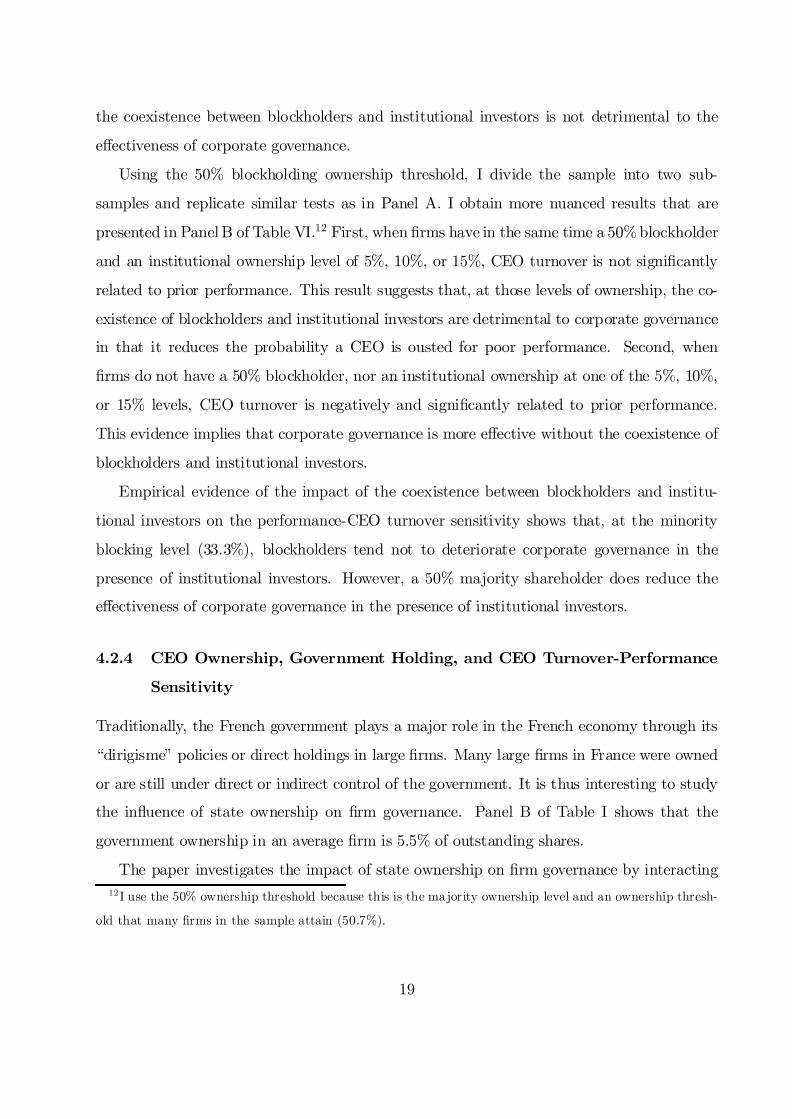
Using the 50% blockholding ownership threshold, I divide the sample into two sub-
samples and replicate similar tests as in Panel A. I obtain more nuanced results that are
presented in PanelB of Table VI.12 First, when …rms have in the same time a 50% blockholder
and an institutional ownership level of 5%, 10%, or 15%, CEO turnover is not signi…cantly
related to prior performance. This result suggests that, at those levels of ownership, the co-
existence of blockholders and institutional investors are detrimental to corporate governance
in that it reduces the probability a CEO is ousted for poor performance. Second, when
…rms do not have a 50% blockholder, nor an institutional ownership at one of the 5%, 10%,
or 15% levels, CEO turnover is negatively and signi…cantly related to prior performance.
This evidence implies that corporate governance is more e¤ective without the coexistence of
blockholders and institutional investors.
Empirical evidence of the impact of the coexistence between blockholders and institu-
tional investors on the performance-CEO turnover sensitivity shows that, at the minority
blocking level (33.3%), blockholders tend not to deteriorate corporate governance in the
presence of institutional investors. However, a 50% majority shareholder does reduce the
e¤ectiveness of corporate governance in the presence of institutional investors.
4.2.4 CEO Ownership, Government Holding, and CEO Turnover-Performance
Sensitivity
Traditionally, the French government plays a major role in the French economy through its
“dirigisme” policies or direct holdings in large …rms. Many large …rms in France were owned
or are still under direct or indirect control of the government. It is thus interesting to study
the in‡uence of state ownership on …rm governance. Panel B of Table I shows that the
government ownership in an average …rm is 5.5% of outstanding shares.
The paper investigates the impact of state ownership on …rm governance by interacting12 I use the 50% ownership threshold because this is the majority ownership level and an ownership thresh-
old that many …rms in the sample attain (50.7%).
19
prior performance and the percentage of state ownership. Regression results, presented in Ta-
ble VII, show that government ownership e¤ectively reduces the performance-CEO turnover
sensitivity. Estimated coe¢cients on the interacted variables are positive and statistically
signi…cant. Using the same approach with CEO ownership, I do not …nd any signi…cant
in‡uence of CEO ownership on the performance-CEO turnover sensitivity. The results are
thus not reported.
4.3 Board Characteristics and Performance-CEO Turnover Sensi-
tivity
4.3.1 Board Organization and Performance-CEO Turnover Sensitivity
The e¤ectiveness of a corporate governance system translated by its ability to …re poorly
performing CEOs may be in‡uenced by the way power is allocated between boards of di-
rectors and CEOs. French corporate law allows …rms to choose between one-tier or two-tier
board. Panel C of Table I shows that …rms with a two-tier board are a minority. 78.7% of
…rms have one-tier board in which the CEO also assumes chairmanship of the board and
is called PDG (President and Chief Executive). Critics of one-tier board point out that
this organization may create ambiguous responsibilities between the board and the PDG,
giving the PDG “excessive power,” and being sources of ine¢ciency, misbehaviors, and bad
governance. By contrast, employers’ associations (Viénot I report (1995), Viénot II report
(1999)) have defended the ‡exibility of French corporate law, arguing that this ‡exibility is
an organizational advantage, and that the concentration of power in the CEO hands helps
avoid the blockage in the decision process.
I study the impact of board organization by dividing the sample into two sub-samples
depending on whether board is one-tier or two-tier. Using the same logistic regression frame-
works as in Table II, I …nd that, as presented in Panel A of Table VIII, CEO turnover is
negatively and signi…cantly related to prior performance only in …rms with one-tier board. In
other …rms, CEO turnover is negatively, but not signi…cantly related to prior performance.
The evidence suggests that one-tier board results in a more e¤ective monitoring and seems
20
to favor the view that the concentration of power in one hand helps avoid ambiguity of power
and responsibility. The result favors Hypothesis 5a.
4.3.2 Board Insiders, Board Size, and Performance-CEO Turnover Sensitivity
Yermack (1996) shows that a smaller board is more e¢cient and associated with better …rm
valuation. This paper argues that if smaller boards are more e¢cient in decision making,
they should be more likely to …re CEOs for poor performance. Panel C of Table I shows
that the average size of a board in France is 11.42 with a median board size of 12. These
numbers are comparable to characteristics of U.S. boards in Yermack’s paper (1996).
I interact board size (the number of board members) and measures of performance and
use the same regression approach as in Table VII. Regression (5) in Panel B of Table VIII
shows regression results. The positive and signi…cant estimated coe¢cient of the interacted
variable implies that board size e¤ectively a¤ect the performance-CEO turnover sensitivity
and that a smaller board is more likely to …re the CEO for poor performance than a larger
one does.
The paper also investigates the impact of board independence, represented by the per-
centage of insiders on board. I de…ne an insider as an employee of the …rm, or people with
interest in the …rm. In France, apart from the CEO, several other employees can be elected
to boards. Senior managers usually hold seats in the board. Panel C of Table I shows
that the average number of employees who are board members, including the CEO, is 1.66.
Regression (6) in Panel B Table VIII reports that the coe¢cient of the interacted variable
between prior performance and the percentage of insiders is negative and signi…cant, sug-
gesting that a board with a greater fraction of insiders increase the probability that a CEO
is ousted for poor performance.
21
5 Checks of Robustness
5.1 Alternative Variables
In previous tests, I use many measures of …rm performance. The use of alternative measures
of control variables help avoid errors caused by a subjective choice of control variables. I only
show test results using stock performance, controlling for industries, but I did test the same
models using market-adjusted (SBF120, SBF250 indices), industry-adjusted performance
measures. Since my sample includes French largest …rms, the use of industry-adjusted per-
formance might have limits in the cases where there are only few …rms in one industry. Firm
size has been measured by log of sales. I respectively check results using log of total assets,
log of market value, and log of sales of the prior year as alternative measures. The results
are not reported as I do not …nd any signi…cantly di¤erent results.
5.2 Time-Series Check
I might have not controlled for potential unobserved determinants of CEO turnovers. Logistic
models assume that performance and ownership have the same structure across …rms. In fact,
…rms in di¤erent industries, of di¤erent sizes may have di¤erent ownership characteristics.
Due to the unequal number of …rms selected each year in the sample, one may also raise the
question of survival bias. The paper has also made the hypothesis that each …rm-semester
is an independent observation. In fact, an CEO change that happens in the …rst semester
may a¤ect (reducing or increasing) the probability of CEO change in the next semester. To
address those issues, I systematically check results on a subsample of …rms that appear in the
sample for at least four out of eight years of the sample period. Using this sub-sample as a
panel of data, I also use panel data techniques to measure the …xed-e¤ect and random-e¤ect.
I do not notice any signi…cantly di¤erent results to those of the previous sections.
5.3 Endogeneity and Simultaneity Check
The paper studies the relation between CEO turnover and ownership structure, taking the
former as the dependent variable. Endogeneity might be a problem. One may argue that
22
in …rms with blockholders and institutional investors, managers are more closely controlled
and the probability of CEO change after poor performance is likely greater. On the contrary,
others may argue that because bad CEOs are removed, …rms attract institutional investors
and blockholders. Thus, the cause-e¤ect direction is not without ambiguity. The solution
to the endogeneity problem may be the use of instrumental variables which are correlated
with the endogenous independent variables and independent of the random noisy term. It is
unfortunately di¢cult to …nd out such a variable. Another issue is the simultaneity problem.
One can hardly know about the ownership structure of a …rm at a moment. By nature, it can
be dynamic. Thus, it is di¢cult to detect whether the concentration of ownership occurred
before the CEO turnovers or the inverse. This paper has tried to mitigate these problems
by taking the ownership structure at the beginning of every year.
6 Conclusion
This paper empirically explores whether board characteristics and ownership structure are
potential determinants of CEO turnovers. From the point of view that a good corporate gov-
ernance structure rewards correctly and equitably managers’ e¤orts and gives shareholders
the possibility to remove them for poor performance, CEO turnover-…rm performance sen-
sitivity is an important benchmark of the e¤ectiveness of boards of directors and corporate
governance.
Similar to previous studies by Weisbach (1988), Denis, Denis, and Sarin (1997), Parrino
(1997), and Huson, Parrino, and Starks (2001) with U.S. data, I …nd that French CEOs
are e¤ectively sanctioned for poor performance. Forced CEO turnover is negatively and
signi…cantly correlated to prior accounting and stock performance. Furthermore, ownership
structure and characteristics of boards of directors impact the sensitivity of CEO turnover
to prior performance.
With respect to ownership structure, I …nd that blockholders, very present in large …rms
in France, signi…cantly reduce the CEO turnover-performance sensitivity. Consequently,
…rms with blockholders are less likely to …re CEOs for poor performance. This result con…rm
the hypothesis that blockholders only monitor the management when they can obtain a
23
bene…t from monitoring. On the other hand, institutional investors do not impact the CEO
turnover-performance sensitivity.
The coexistence of a 33.3% blockholder and institutional ownership at one of the 5%, 10%,
or 15% levels does not impact the negative and signi…cant relation between prior performance
and CEO turnover. By contrast, at the 50% blockholding threshold, the coexistence of
blockholders and institutional investors signi…cantly reduces the CEO turnover-performance
sensitivity. In …rms with a 50% blockholder and an institutional ownership at one of the 5%,
10%, or 15% levels, CEO turnover is negatively, but not signi…cantly related to performance.
On the contrary, CEO turnover is negatively and signi…cantly related to performance in …rms
with neither a 50% blockholder, nor an institutional ownership at one of the 5%, 10%, or 15%
thresholds. Government ownership weakens the CEO turnover-…rm performance sensitivity.
Consequently, CEOs are less likely to be …red for poor performance in …rms in which the
French government holds a stake.
With respect to board characteristics, I …nd evidence that …rms with one-tier board show
a greater CEO turnover-performance sensibility. This …nding favors claims by the Viénot I
(1995) and Viénot II (1999) reports that one-tier board is more e¤ective. The performance-
CEO turnover sensitivity is greater in …rms with smaller boards. Inside directors strengthens
the turnover-performance sensitivity. This result might be explained by the fact that many
employees sit on boards of French …rms.
Empirical evidence from the paper sheds some light on the practice and the e¤ectiveness
of the French corporate governance system and contributes to the debate raised by previous
research (Shleifer et al. (1999) among others). The paper shows that, despite its speci…city,
French corporate governance works quite well in the sense that poorly performing CEOs are
e¤ectively sanctioned.
24
References Aghion, Philippe, Patrick Bolton, 1992, An incomplete contracts approach to financial contracting, Review of Economic Studies 59, 473-494. Bebchuk, Lucian, R. Kraakman, G. Triantis, 1999, Stock pyramids, cross-ownership, and dual equity: the agency cost of separating control from cash flow rights, NBER, W.P. No. 6951. Berle, Adolph, Gardiner Means, 1932, The modern corporation and private property, NY, Macmillan. Bolton, Patrick, Ersnt-Ludwig von Thadden, 1998, Blocks, liquidity, and corporate control, Journal of Finance 53, 1-26. Borokhovich, Kenneth, Robert Parrino, Teresa Trapani, 1996, Outside directors and CEO selection, Journal of Financial and Quantitative Analysis, Vol. 31, No. 3, 337-355. Brickley, James, Jeffrey Coles, Gregg Jarrell, 1997, Leadership structure: separating the CEO and Chairman of the Board, Journal of Corporate Finance, Vol. 3, Issue 3, 189-220. Burkart, Mike, Denis Gromb, Fausti Panunzi, 1997, Large shareholders, monitoring, and the value of the firm, Quarterly Journal of Economics, Vol. 112, 693-728. Byrd, John, Kent Hickman, 1992, Do outside directors monitor managers? Evidence from tender-offer bids, Journal of Financial Economics 32, 195-221. Carleton, Willard, James Nelson, Michael Weisbach (1998), “The influence of institutions on corporate governance through private negotiations: Evidence from TIAA-CREF”, Journal of Finance, 53, 1335-1362. Cotter James, Anil Shivdasani, Marc Zenner, 1997, Do independent directors enhance target shareholder wealth during tender offers? Journal of Financial Economics 43, 195-218. Degeorge, François, Jayendu Patel, Josef Zeckhauser, 1999, Earnings management to exceeds thresholds, Journal of Business, 1999, vol. 72(1), 1-33. Degeorge, François, French Boardroms wake up slowly to the need for reform, Mastering Global Business, The Financial Times Publishing, 1999, 156-160. Denis, David, Diane Denis, 1995, Performance changes following top management dismissal, Journal of Finance 50, 1029-1058. Denis, David, J.M Serrano, 1996, Active investors, and management turnover following unsuccessful control contests, Journal of Financial Economics 40, 239-266. Denis, David Diane Denis, Atulia Sarin, 1997, Ownership structure and top executive turnover, Journal of Financial Economics 45, 193-221. Dooley, Peter, 1969, The interlocking directorate, American Economic Review 59, 314-323.
Fich, Eliezer, Lawrence White, 2001, Who do CEOs reciprocally sit on each other boards? W.P. Fich, Eliezer, Anil Shivdasani, 2005, Are busy boards effective monitors? Forthcoming Journal of Finance. Hallock, Kevin, 1997, Reciprocally interlocking boards of directors and executive compensation, Journal of Financial and Quantitative Analysis 32, 331-344. Hermalin, Benjamin, Michael Weisbach, 1998, Endogenously chosen boards of directors and their monitoring of the CEO, American Economic Review, 88, 96-118. Huson, Mark, Robert Parrino, and Laura Starks, 2001, Internal monitoring mechanisms and CEO turnover: a long-term perspective, Journal of Finance, Vol. LVI, No. 6, 2265-2297. John, Kose, Simi Kedia 2003, Institutions, markets and growth: a theory of comparative corporate governance, W.P. Kaplan, Steven, David Reishus, 1990, Outside directorship and corporate governance, Journal of Financial Economics 27, 389-410. Kaplan, Steven, Bernadette Minton, 1994, Appointments of outsiders to Japanese boards: determinants and implications for managers, Journal of Financial Economics 36, 225-258. Kaplan, Steven, 1994, Top executive rewards and firm performance: a comparison of Japan and the United States, Journal of Political Economy 1994, 510-546. La Porta, Raphael, Florencio Lopez-de-Silanes and Andrei Shleifer, Robert Vishny (1998), Law and Finance, Journal of Political Economy, 54, 471-515. La Porta, Raphael, Florencio Lopez-de-Silanes and Andrei Shleifer (1999), Corporate ownership around the world, Journal of Finance, 54, 471-515. Lipton, Martin, Jay Lorsch, 1992, A modest proposal for improved corporate governance, Business Lawyer 48, 59-77. Lorsch, Jay, Elizabeth MacIver, 1989. Pawns or potentates? The reality of America’s corporate boards (Harvard Business School Press, Boston). Lublin, Joann, 1996, Report urges curb on number of directorships, The Wall Street Journal, November 12. Mace, Myles, 1971. Directors: Myth and reality (Harvard Business School Press, Boston). Mayers, David, Anil Shivdasani, Clifford Smith, 1997, Board composition and corporate control, Journal of Business 70, 33-62. McConnell, John, Henri Servaes, 1990, Additional evidence on equity ownership and corporate value, Journal of Financial Economics 26, 595-612.
Morck, Randall, Andrei Shleifer, Robert Vishny, 1989, Alternative mechanisms for corporate control, American Economic Review, Vol 79, No4, 842-852. Nguyen-Dang, Bang, 2005, CEOs’ small world, interlocking directorships, and the effectiveness of boards of directors, W.P., HEC Paris. Parrino, Robert, 1997, CEO turnover and outside succession: a cross-sectional analysis, Journal of Financial Economics 46, 165-197. Parrino, Robert, Richard Sias, and Laura Starks, 2003, Voting with their feet: institutional ownership changes around forced CEO turnover, Journal of Financial Economics 68, 3-46. Perry, Tod, and Urs Peyer, 2002, Board seat accumulation by executives: A shareholder’s perspective, Forthcoming Journal of Finance. Rosenstein, Stuart and Jeffrey Wyatt, 1990, Outside directors, board independence, and shareholder wealth, Journal of Financial Economics 26, 175-191. Rosenstein, Stuart and Jeffrey Wyatt, 1997, Inside directors, board effectiveness, and shareholder wealth, , Journal of Financial Economics 44, 229-250. Shivdasani, Anil, David Yermack, 1999, CEO involvement in the selection of new board members: an empirical analysis, Journal of Finance Vol 54, No5. Shleifer, Andrei, and Robert Vishny, 1986, Large shareholders and corporate control, Journal of Political Economy 94, 461-488. Shleifer, Andrei, and Robert Vishny, 1987, A survey of corporate governance, Journal of Finance Vol. 52, No. 2, 737-783. Shleifer, Andrei, and Robert Vishny, 1989, Management entrenchment: the case of manager-specific investments, Journal of Financial Economics 25, 123-139. Tirole, Jean, 1999, Corporate governance, Presidential address, Econometric society. Viénot Report I, 1995, Le Conseil d’Administration des sociétés cotées, Association Française des Entreprises Privées et Conseil National du Patronat Français. Viénot Report II, 1999, Gouvernment d’entreprise, Association Française des Entreprises Privées et Conseil National du Patronat Français. Warner, Jerold, Ross Watts, Karen Wruck, 1988, Stock prices and top management changes, Journal of Financial Economics 20, 461-492. Weisbach, Michael 1988, Outside directors and CEO turnover, Journal of Financial Economics 20, 431-460. Yermack, David, 1996, Higher market valuation of companies with a small board of directors, Journal of Financial Economics 40, 185-211.
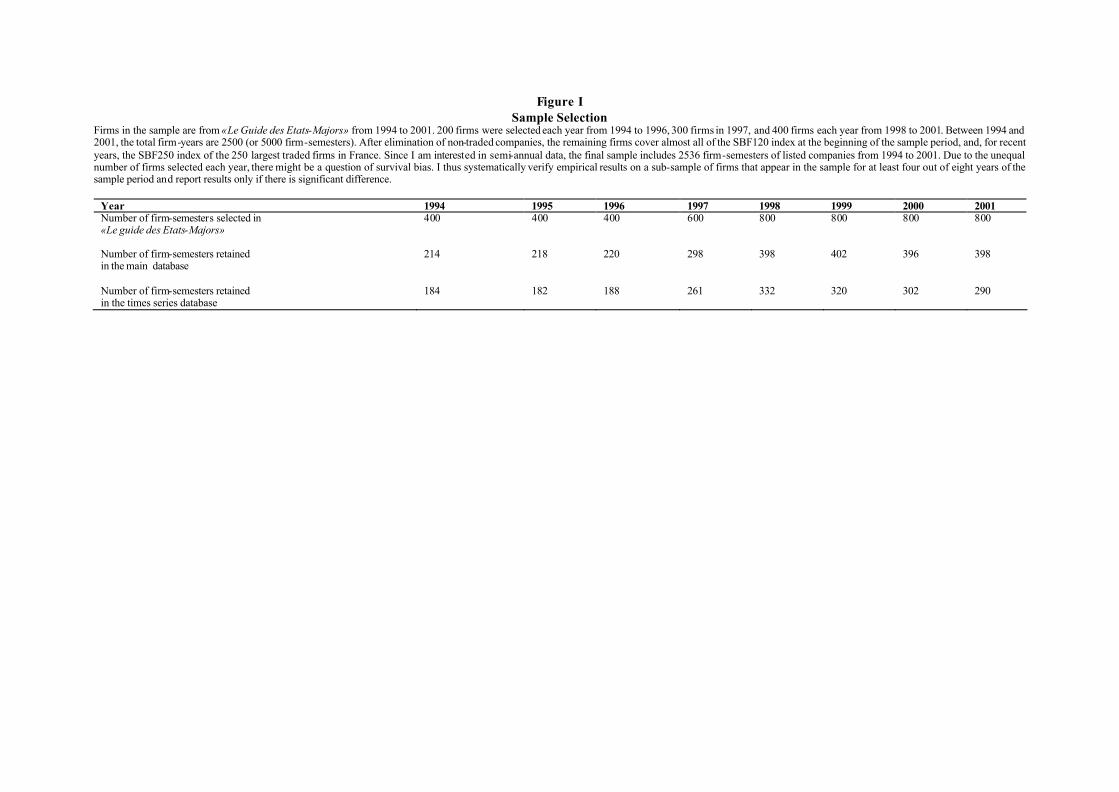
Figure I Sample Selection
Firms in the sample are from «Le Guide des Etats-Majors» from 1994 to 2001. 200 firms were selected each year from 1994 to 1996, 300 firms in 1997, and 400 firms each year from 1998 to 2001. Between 1994 and 2001, the total firm-years are 2500 (or 5000 firm-semesters). After elimination of non-traded companies, the remaining firms cover almost all of the SBF120 index at the beginning of the sample period, and, for recent years, the SBF250 index of the 250 largest traded firms in France. Since I am interested in semi-annual data, the final sample includes 2536 firm-semesters of listed companies from 1994 to 2001. Due to the unequal number of firms selected each year, there might be a question of survival bias. I thus systematically verify empirical results on a sub-sample of firms that appear in the sample for at least four out of eight years of the sample period and report results only if there is significant difference.
Year 1994 1995 1996 1997 1998 1999 2000 2001 Number of firm-semesters selected in «Le guide des Etats-Majors»
400 400 400 600 800 800 800 800
Number of firm-semesters retained in the main database
214 218 220 298 398 402 396 398
Number of firm-semesters retained in the times series database
184 182 188 261 332 320 302 290
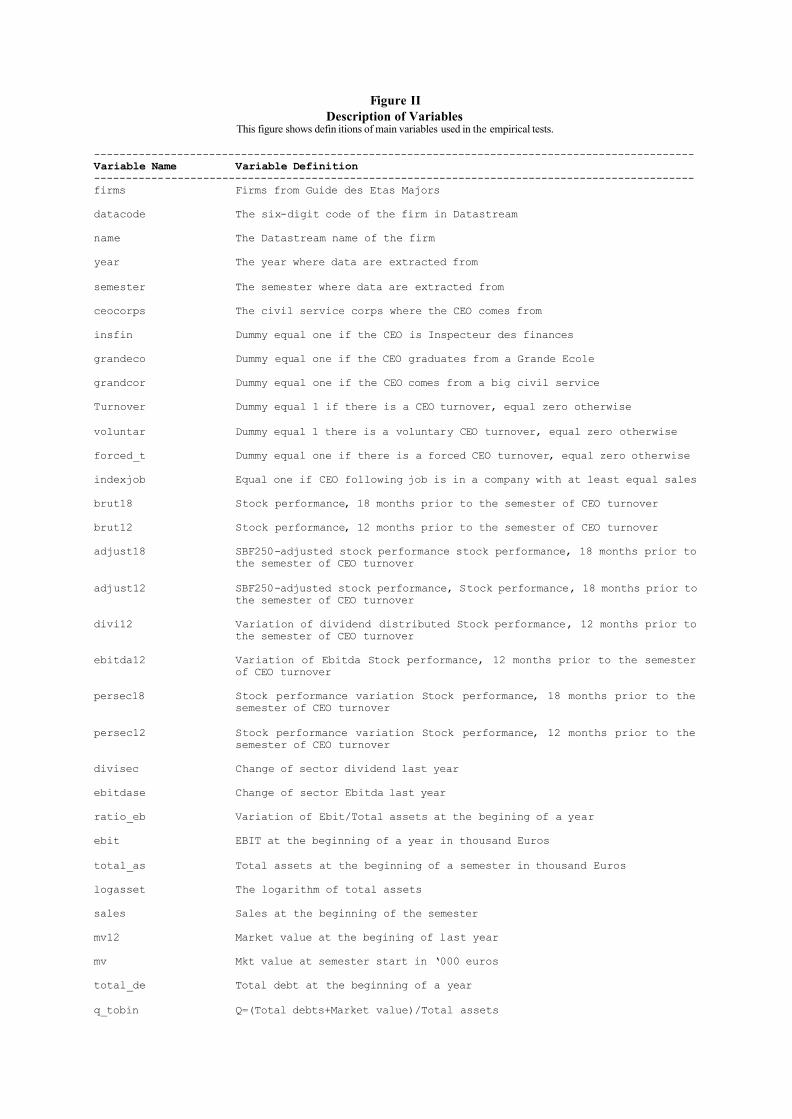
Figure II Description of Variables
This figure shows defin itions of main variables used in the empirical tests. ---------------------------------------------------------------------------------------------- Variable Name Variable Definition ---------------------------------------------------------------------------------------------- firms Firms from Guide des Etas Majors datacode The six-digit code of the firm in Datastream name The Datastream name of the firm year The year where data are extracted from semester The semester where data are extracted from ceocorps The civil service corps where the CEO comes from insfin Dummy equal one if the CEO is Inspecteur des finances grandeco Dummy equal one if the CEO graduates from a Grande Ecole grandcor Dummy equal one if the CEO comes from a big civil service Turnover Dummy equal 1 if there is a CEO turnover, equal zero otherwise voluntar Dummy equal 1 there is a voluntary CEO turnover, equal zero otherwise forced_t Dummy equal one if there is a forced CEO turnover, equal zero otherwise indexjob Equal one if CEO following job is in a company with at least equal sales brut18 Stock performance, 18 months prior to the semester of CEO turnover brut12 Stock performance, 12 months prior to the semester of CEO turnover adjust18 SBF250-adjusted stock performance stock performance, 18 months prior to
the semester of CEO turnover adjust12 SBF250-adjusted stock performance, Stock performance, 18 months prior to
the semester of CEO turnover divi12 Variation of dividend distributed Stock performance, 12 months prior to
the semester of CEO turnover ebitda12 Variation of Ebitda Stock performance, 12 months prior to the semester
of CEO turnover persec18 Stock performance variation Stock performance, 18 months prior to the
semester of CEO turnover persec12 Stock performance variation Stock performance, 12 months prior to the
semester of CEO turnover divisec Change of sector dividend last year ebitdase Change of sector Ebitda last year ratio_eb Variation of Ebit/Total assets at the begining of a year ebit EBIT at the beginning of a year in thousand Euros total_as Total assets at the beginning of a semester in thousand Euros logasset The logarithm of total assets sales Sales at the beginning of the semester mv12 Market value at the begining of last year mv Mkt value at semester start in ‘000 euros total_de Total debt at the beginning of a year q_tobin Q=(Total debts+Market value)/Total assets

---------------------------------------------------------------------------------------------- Variable Name Variable Definition ---------------------------------------------------------------------------------------------- adjsec18 18 month-lagged sector-adjusted stock performance, prior to semester of
turnover adjsec12 12 month-lagged sector-adjusted stock performance adjdivid Sector-adjusted dividend of last year adjebitd Sector-adjusted Ebitda of last year ow5, ow10, ow15, ow25, ow33, ow50 Dummy equal one if there is at leat one 5%, 10%, 15%, 25%, 33%, 50%
blockholder instit Dummy equal one if there is at leat one institutional investor instit2, insitit5, instit10, instit33, instit50
Dummy equal one if there is at leat one 2%, 5%, 10%, 33%, 50% institutional shareholder
Stateow, stateow5, state33, state50 Dummy equal one if the State is present in the firm’s capital, holding 5%, 33%, and 50% of shares
boardsiz Number of board members tierrule NUMBER OF DIRECTORS HAVING A WORK CONTRACT WITH THE FIRM insiders =TIERRULE/BOARDSIZ ins =TIERRULE/BOARDSIZ salaryb Number of directors who are employees of the firm, including the CEO bruttier =SALARYB/BOARDSIZ boardfor Dummy equal one if the board is two-tier otherfor Dummy equal one if the board has another form than two-tier or one-tier numcross Number of CEO cross-directorships with other firms in the sample crossdir Dummy equal one if CEO holds at least one cross-directorship, equal zero
otherwise crosdir1, crossdir2, crossdir3, crossdir4, …
Dummy equal one if CEO holds at least 1, 2, 3, 4, 5, … cros-directorships, equal zero otherwise
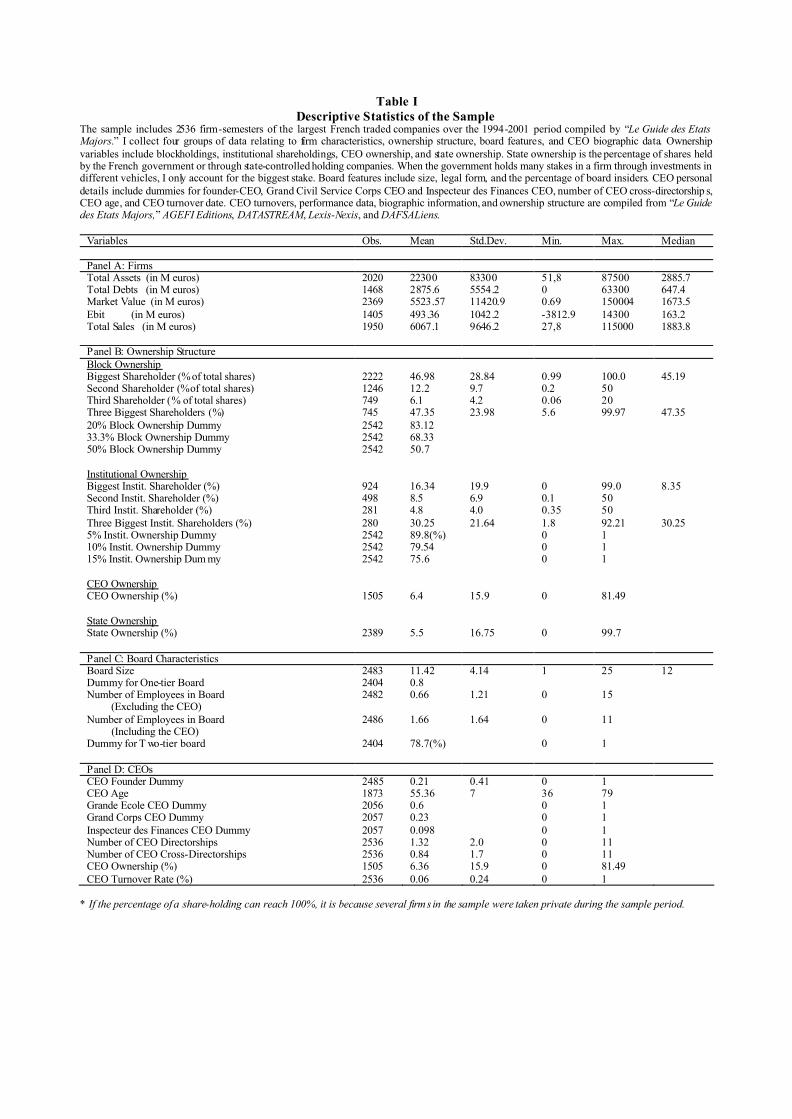
Table I Descriptive Statistics of the Sample
The sample includes 2536 firm-semesters of the largest French traded companies over the 1994-2001 period compiled by “Le Guide des Etats Majors.” I collect four groups of data relating to firm characteristics, ownership structure, board features, and CEO biographic data. Ownership variables include blockholdings, institutional shareholdings, CEO ownership, and state ownership. State ownership is the percentage of shares held by the French government or through state-controlled holding companies. When the government holds many stakes in a firm through investments in different vehicles, I only account for the biggest stake. Board features include size, legal form, and the percentage of board insiders. CEO personal details include dummies for founder-CEO, Grand Civil Service Corps CEO and Inspecteur des Finances CEO, number of CEO cross-directorship s, CEO age, and CEO turnover date. CEO turnovers, performance data, biographic information, and ownership structure are compiled from “Le Guide des Etats Majors,” AGEFI Editions, DATASTREAM, Lexis-Nexis, and DAFSALiens.
Variables Obs. Mean Std.Dev. Min. Max. Median Panel A: Firms Total Assets (in M euros) 2020 22300 83300 51,8 87500 2885.7 Total Debts (in M euros) 1468 2875.6 5554.2 0 63300 647.4 Market Value (in M euros) 2369 5523.57 11420.9 0.69 150004 1673.5 Ebit (in M euros) 1405 493.36 1042.2 -3812.9 14300 163.2 Total Sales (in M euros) 1950 6067.1 9646.2 27,8 115000 1883.8 Panel B: Ownership Structure Block Ownership Biggest Shareholder (% of total shares) 2222 46.98 28.84 0.99 100.0 45.19 Second Shareholder (% of total shares) 1246 12.2 9.7 0.2 50 Third Shareholder (% of total shares) 749 6.1 4.2 0.06 20 Three Biggest Shareholders (%) 745 47.35 23.98 5.6 99.97 47.35 20% Block Ownership Dummy 2542 83.12 33.3% Block Ownership Dummy 2542 68.33 50% Block Ownership Dummy 2542 50.7 Institutional Ownership Biggest Instit. Shareholder (%) 924 16.34 19.9 0 99.0 8.35 Second Instit. Shareholder (%) 498 8.5 6.9 0.1 50 Third Instit. Shareholder (%) 281 4.8 4.0 0.35 50 Three Biggest Instit. Shareholders (%) 280 30.25 21.64 1.8 92.21 30.25 5% Instit. Ownership Dummy 2542 89.8(%) 0 1 10% Instit. Ownership Dummy 2542 79.54 0 1 15% Instit. Ownership Dum my 2542 75.6 0 1 CEO Ownership CEO Ownership (%) 1505 6.4 15.9 0 81.49 State Ownership State Ownership (%) 2389 5.5 16.75 0 99.7 Panel C: Board Characteristics Board Size 2483 11.42 4.14 1 25 12 Dummy for One-tier Board 2404 0.8 Number of Employees in Board (Excluding the CEO)
2482 0.66 1.21 0 15
Number of Employees in Board (Including the CEO)
2486 1.66 1.64 0 11
Dummy for T wo-tier board 2404 78.7(%) 0 1 Panel D: CEOs CEO Founder Dummy 2485 0.21 0.41 0 1 CEO Age 1873 55.36 7 36 79 Grande Ecole CEO Dummy 2056 0.6 0 1 Grand Corps CEO Dummy 2057 0.23 0 1 Inspecteur des Finances CEO Dummy 2057 0.098 0 1 Number of CEO Directorships 2536 1.32 2.0 0 11 Number of CEO Cross-Directorships 2536 0.84 1.7 0 11 CEO Ownership (%) 1505 6.36 15.9 0 81.49 CEO Turnover Rate (%) 2536 0.06 0.24 0 1
* If the percentage of a share-holding can reach 100%, it is because several firm s in the sample were taken private during the sample period.

Table II Prior Performance and Forced CEO Turnover
I estimate the probability of forced CEO turnovers related to firm prior performance using logistic models. The sample consists of 2536 firm-semesters of the largest traded companies in France over the 1994-2001 period compiled by “Le Guide des Etats Majors.” Forced CEO turnover is all CEO change except death, illness, normal retirements, and normal succession. The dependent variable is forced CEO turnover dummy which is equal to one if there is a forced CEO turnover, and equal to zero if there is no CEO turnover or a voluntary one. Main independent variables are 18-, 24-, 36-month lagged stock performance prior to the semester of CEO turnover and a proxy for accounting performance. Control variables include CEO characteristics (dummies for founder-CEO, Grand Corps CEO, Inspecteur des Finances CEO; number of cross-directorships; CEO age); Ownership structure; Board features (size, percentage of insiders, and legal form); Firm size (log of total assets at the beginning of the year), industry dummy. The table reports estimated coefficients, starred with three, two, and one star if significant at the 1%, 5%, and 10% levels respectively. Standard errors are in parentheses. CEO turnovers, performance data, biographic information, and ownership structure are compiled from “Le Guide des Etats Majors,” AGEFI Editions, DATASTREAM, Lexis-Nexis, and DAFSALiens. Variables (1) (2) (3) (4) 18-month lagged stock performance -0.0084*
(-0.0047)
24-month lagged stock performance -0.08* (0.004)
36-month lagged stock performance
-0.008** (0.004)
Dummy for positive variation of one-year lagged Ebit /Assets ratio
-1.04** (0.44)
CEO age -0.078* (0.043)
-0.08* (0.04)
-0.08* (0.04)
-0.05 (0.04)
Grande Ecole CEO dummy -0.59 (0.58)
-0.6 (0.59)
-0.6 (0.58)
-0.42 (0.55)
Grand Civil Service CEO dummy
0.037 (0.81)
0.08 (0.8)
0.19 (0.8)
0.17 (0.71)
Inspector of Finance CEO dummy 0.98 (0.85)
0.93 (0.85)
0.9 (0.85)
0.31 (0.82)
CEO-founder dummy -0.56 (0.81)
-0.54 (0.8)
-0.57 (0.82)
-0.68 (0.79)
Largest shareholder (%)
-0.0002 (0.01)
-0.0002 (0.01)
0.001 (0.01)
0.004 (0.09)
Two-tier board dummy 0.08 (0.58)
0.03 (0.58)
-0.01 (0.59)
0.1 (0.55)
Board size 0.06 (0.08)
0.05 (0.08)
0.04 (0.58)
0.06 (0.08)
Board insiders (%) -0.53 (0.39)
-0.5 (0.39)
-0.42 (0.38)
-0.47 (0.36)
Number of CEO cross-directorships 0.05 (0.14)
0.06 (0.14)
0.05 (0.14)
0.016 (0.14)
Log of total assets -0.26 (0.21)
-0.24 (0.21)
-0.2 (0.22)
-0.33 (0.22)
Industry dummies YES YES YES YES Constant
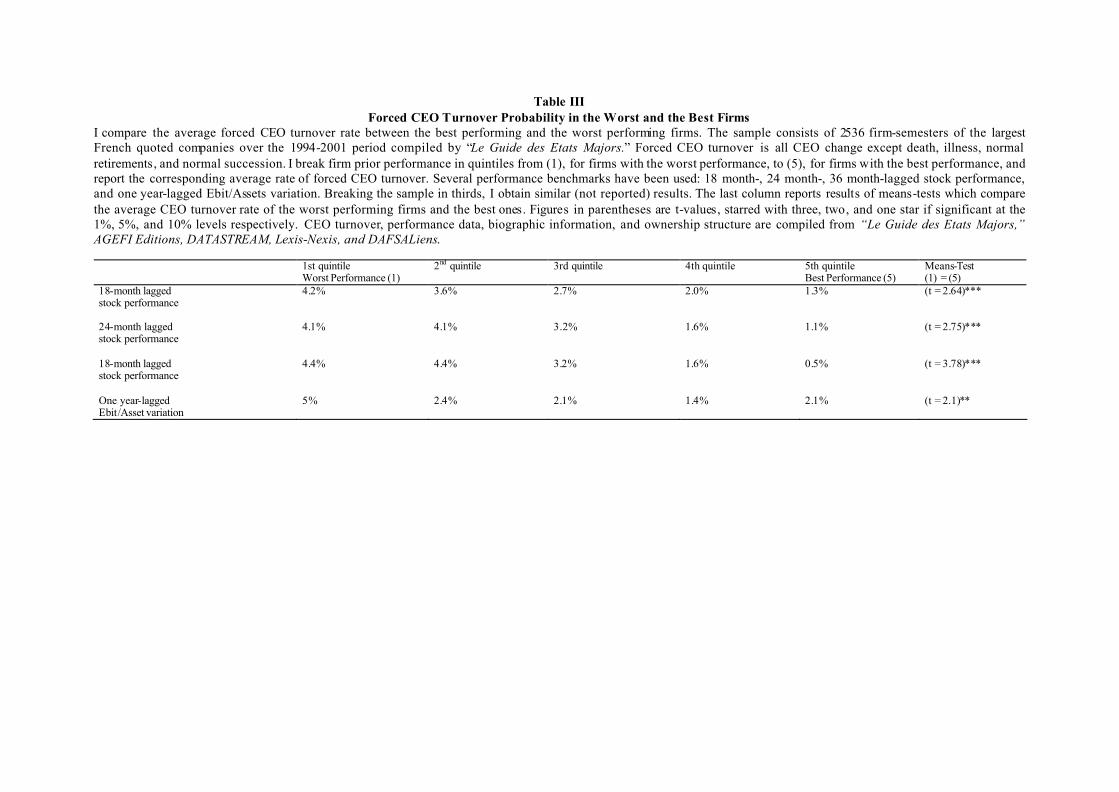
Table III Forced CEO Turnover Probability in the Worst and the Best Firms
I compare the average forced CEO turnover rate between the best performing and the worst performing firms. The sample consists of 2536 firm-semesters of the largest French quoted companies over the 1994-2001 period compiled by “Le Guide des Etats Majors.” Forced CEO turnover is all CEO change except death, illness, normal retirements, and normal succession. I break firm prior performance in quintiles from (1), for firms with the worst performance, to (5), for firms with the best performance, and report the corresponding average rate of forced CEO turnover. Several performance benchmarks have been used: 18 month-, 24 month-, 36 month-lagged stock performance, and one year-lagged Ebit/Assets variation. Breaking the sample in thirds, I obtain similar (not reported) results. The last column reports results of means-tests which compare the average CEO turnover rate of the worst performing firms and the best ones. Figures in parentheses are t-values, starred with three, two, and one star if significant at the 1%, 5%, and 10% levels respectively. CEO turnover, performance data, biographic information, and ownership structure are compiled from “Le Guide des Etats Majors,” AGEFI Editions, DATASTREAM, Lexis-Nexis, and DAFSALiens. 1st quintile
Worst Performance (1) 2nd quintile 3rd quintile 4th quintile 5th quintile
Best Performance (5) Means-Test (1) = (5)
18-month lagged stock performance
4.2% 3.6% 2.7% 2.0% 1.3% (t = 2.64)***
24-month lagged stock performance
4.1% 4.1% 3.2% 1.6% 1.1% (t = 2.75)***
18-month lagged stock performance
4.4% 4.4%
3.2%
1.6%
0.5% (t = 3.78)***
One year-lagged Ebit/Asset variation
5% 2.4% 2.1% 1.4% 2.1% (t = 2.1)**
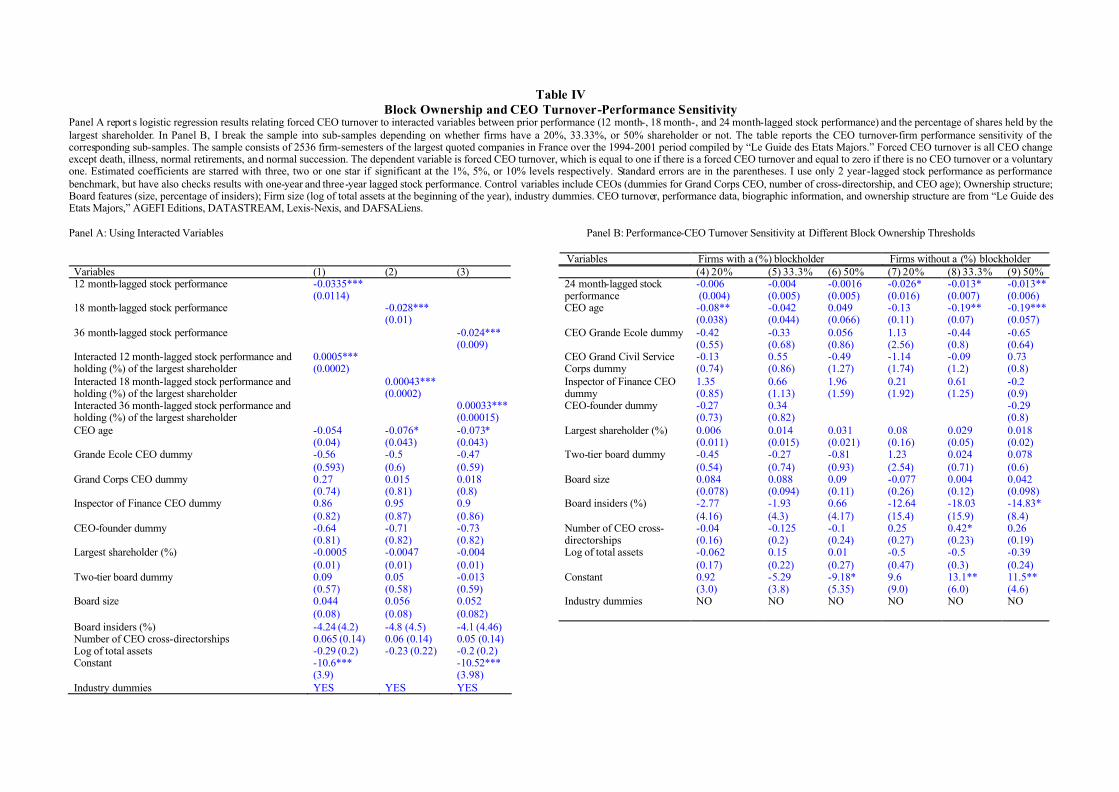
Table IV Block Ownership and CEO Turnover-Performance Sensitivity
Panel A report s logistic regression results relating forced CEO turnover to interacted variables between prior performance (12 month-, 18 month-, and 24 month-lagged stock performance) and the percentage of shares held by the largest shareholder. In Panel B, I break the sample into sub-samples depending on whether firms have a 20%, 33.33%, or 50% shareholder or not. The table reports the CEO turnover-firm performance sensitivity of the corresponding sub-samples. The sample consists of 2536 firm-semesters of the largest quoted companies in France over the 1994-2001 period compiled by “Le Guide des Etats Majors.” Forced CEO turnover is all CEO change except death, illness, normal retirements, and normal succession. The dependent variable is forced CEO turnover, which is equal to one if there is a forced CEO turnover and equal to zero if there is no CEO turnover or a voluntary one. Estimated coefficients are starred with three, two or one star if significant at the 1%, 5%, or 10% levels respectively. Standard errors are in the parentheses. I use only 2 year-lagged stock performance as performance benchmark, but have also checks results with one-year and three-year lagged stock performance. Control variables include CEOs (dummies for Grand Corps CEO, number of cross-directorship, and CEO age); Ownership structure; Board features (size, percentage of insiders); Firm size (log of total assets at the beginning of the year), industry dummies. CEO turnover, performance data, biographic information, and ownership structure are from “Le Guide des Etats Majors,” AGEFI Editions, DATASTREAM, Lexis-Nexis, and DAFSALiens. Panel A: Using Interacted Variables Panel B: Performance-CEO Turnover Sensitivity at Different Block Ownership Thresholds
Variables Firms with a (%) blockholder Firms without a (%) blockholder Variables (1) (2) (3) (4) 20% (5) 33.3% (6) 50% (7) 20% (8) 33.3% (9) 50% 12 month-lagged stock performance
-0.0335*** (0.0114)
24 month-lagged stock performance
-0.006 (0.004)
-0.004 (0.005)
-0.0016 (0.005)
-0.026* (0.016)
-0.013* (0.007)
-0.013** (0.006)
18 month-lagged stock performance
-0.028*** (0.01)
CEO age -0.08** (0.038)
-0.042 (0.044)
0.049 (0.066)
-0.13 (0.11)
-0.19** (0.07)
-0.19*** (0.057)
36 month-lagged stock performance
-0.024*** (0.009)
CEO Grande Ecole dummy -0.42 (0.55)
-0.33 (0.68)
0.056 (0.86)
1.13 (2.56)
-0.44 (0.8)
-0.65 (0.64)
Interacted 12 month-lagged stock performance and holding (%) of the largest shareholder
0.0005*** (0.0002)
CEO Grand Civil Service Corps dummy
-0.13 (0.74)
0.55 (0.86)
-0.49 (1.27)
-1.14 (1.74)
-0.09 (1.2)
0.73 (0.8)
Interacted 18 month-lagged stock performance and holding (%) of the largest shareholder
0.00043*** (0.0002)
Inspector of Finance CEO dummy
1.35 (0.85)
0.66 (1.13)
1.96 (1.59)
0.21 (1.92)
0.61 (1.25)
-0.2 (0.9)
Interacted 36 month-lagged stock performance and holding (%) of the largest shareholder
0.00033*** (0.00015)
CEO-founder dummy -0.27 (0.73)
0.34 (0.82)
-0.29 (0.8)
CEO age -0.054 (0.04)
-0.076* (0.043)
-0.073* (0.043)
Largest shareholder (%)
0.006 (0.011)
0.014 (0.015)
0.031 (0.021)
0.08 (0.16)
0.029 (0.05)
0.018 (0.02)
Grande Ecole CEO dummy -0.56 (0.593)
-0.5 (0.6)
-0.47 (0.59)
Two-tier board dummy -0.45 (0.54)
-0.27 (0.74)
-0.81 (0.93)
1.23 (2.54)
0.024 (0.71)
0.078 (0.6)
Grand Corps CEO dummy
0.27 (0.74)
0.015 (0.81)
0.018 (0.8)
Board size 0.084 (0.078)
0.088 (0.094)
0.09 (0.11)
-0.077 (0.26)
0.004 (0.12)
0.042 (0.098)
Inspector of Finance CEO dummy 0.86 (0.82)
0.95 (0.87)
0.9 (0.86)
Board insiders (%) -2.77 (4.16)
-1.93 (4.3)
0.66 (4.17)
-12.64 (15.4)
-18.03 (15.9)
-14.83* (8.4)
CEO-founder dummy -0.64 (0.81)
-0.71 (0.82)
-0.73 (0.82)
Number of CEO cross-directorships
-0.04 (0.16)
-0.125 (0.2)
-0.1 (0.24)
0.25 (0.27)
0.42* (0.23)
0.26 (0.19)
Largest shareholder (%)
-0.0005 (0.01)
-0.0047 (0.01)
-0.004 (0.01)
Log of total assets -0.062 (0.17)
0.15 (0.22)
0.01 (0.27)
-0.5 (0.47)
-0.5 (0.3)
-0.39 (0.24)
Two-tier board dummy 0.09 (0.57)
0.05 (0.58)
-0.013 (0.59)
Constant 0.92 (3.0)
-5.29 (3.8)
-9.18* (5.35)
9.6 (9.0)
13.1** (6.0)
11.5** (4.6)
Board size 0.044 (0.08)
0.056 (0.08)
0.052 (0.082)
Industry dummies NO NO NO NO NO NO
Board insiders (%) -4.24 (4.2) -4.8 (4.5) -4.1 (4.46) Number of CEO cross-directorships 0.065 (0.14) 0.06 (0.14) 0.05 (0.14) Log of total assets -0.29 (0.2) -0.23 (0.22) -0.2 (0.2) Constant -10.6***
(3.9) -10.52***
(3.98)
Industry dummies YES YES YES
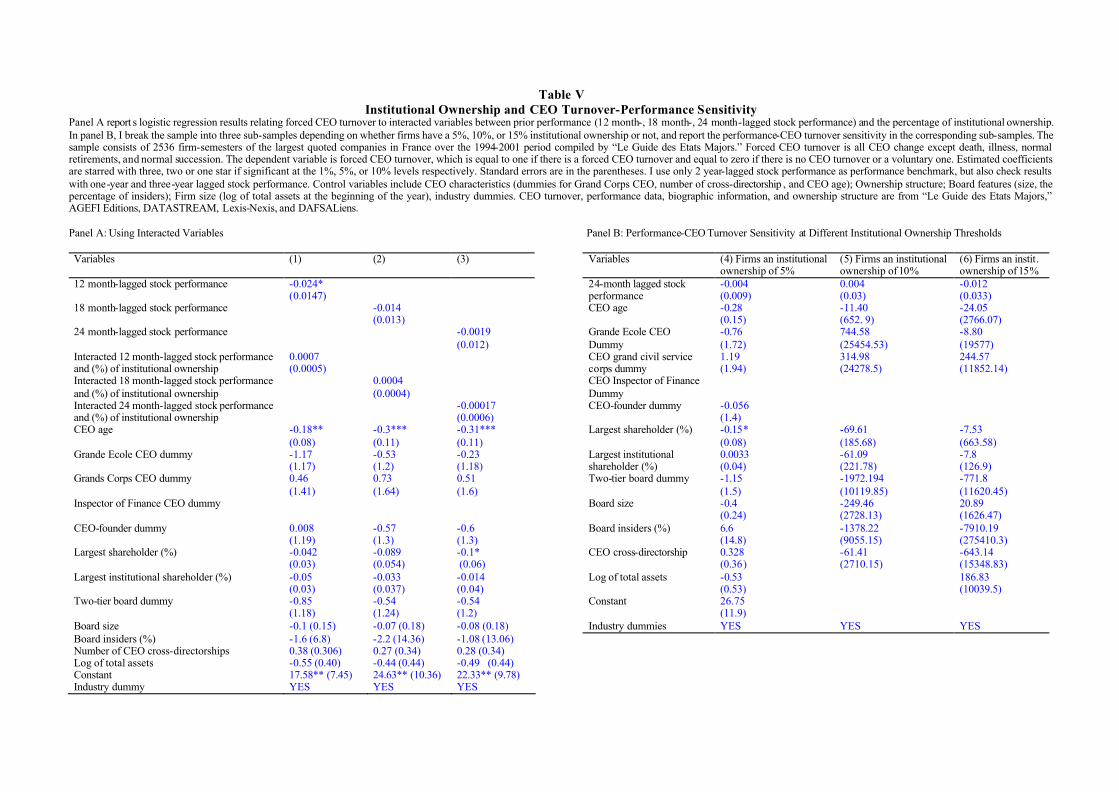
Table V Institutional Ownership and CEO Turnover-Performance Sensitivity
Panel A report s logistic regression results relating forced CEO turnover to interacted variables between prior performance (12 month-, 18 month-, 24 month-lagged stock performance) and the percentage of institutional ownership. In panel B, I break the sample into three sub-samples depending on whether firms have a 5%, 10%, or 15% institutional ownership or not, and report the performance-CEO turnover sensitivity in the corresponding sub-samples. The sample consists of 2536 firm-semesters of the largest quoted companies in France over the 1994-2001 period compiled by “Le Guide des Etats Majors.” Forced CEO turnover is all CEO change except death, illness, normal retirements, and normal succession. The dependent variable is forced CEO turnover, which is equal to one if there is a forced CEO turnover and equal to zero if there is no CEO turnover or a voluntary one. Estimated coefficients are starred with three, two or one star if significant at the 1%, 5%, or 10% levels respectively. Standard errors are in the parentheses. I use only 2 year-lagged stock performance as performance benchmark, but also check results with one-year and three-year lagged stock performance. Control variables include CEO characteristics (dummies for Grand Corps CEO, number of cross-directorship , and CEO age); Ownership structure; Board features (size, the percentage of insiders); Firm size (log of total assets at the beginning of the year), industry dummies. CEO turnover, performance data, biographic information, and ownership structure are from “Le Guide des Etats Majors,” AGEFI Editions, DATASTREAM, Lexis-Nexis, and DAFSALiens. Panel A: Using Interacted Variables Panel B: Performance-CEO Turnover Sensitivity at Different Institutional Ownership Thresholds Variables (1) (2) (3) Variables (4) Firms an institutional
ownership of 5% (5) Firms an institutional ownership of 10%
(6) Firms an instit. ownership of 15%
12 month-lagged stock performance
-0.024* (0.0147)
24-month lagged stock performance
-0.004 (0.009)
0.004 (0.03)
-0.012 (0.033)
18 month-lagged stock performance
-0.014 (0.013)
CEO age -0.28 (0.15)
-11.40 (652. 9)
-24.05 (2766.07)
24 month-lagged stock performance
-0.0019 (0.012)
Grande Ecole CEO Dummy
-0.76 (1.72)
744.58 (25454.53)
-8.80 (19577)
Interacted 12 month-lagged stock performance and (%) of institutional ownership
0.0007 (0.0005)
CEO grand civil service corps dummy
1.19 (1.94)
314.98 (24278.5)
244.57 (11852.14)
Interacted 18 month-lagged stock performance and (%) of institutional ownership
0.0004 (0.0004)
CEO Inspector of Finance Dummy
Interacted 24 month-lagged stock performance and (%) of institutional ownership
-0.00017 (0.0006)
CEO-founder dummy -0.056 (1.4)
CEO age -0.18** (0.08)
-0.3*** (0.11)
-0.31*** (0.11)
Largest shareholder (%) -0.15* (0.08)
-69.61 (185.68)
-7.53 (663.58)
Grande Ecole CEO dummy
-1.17 (1.17)
-0.53 (1.2)
-0.23 (1.18)
Largest institutional shareholder (%)
0.0033 (0.04)
-61.09 (221.78)
-7.8 (126.9)
Grands Corps CEO dummy
0.46 (1.41)
0.73 (1.64)
0.51 (1.6)
Two-tier board dummy -1.15 (1.5)
-1972.194 (10119.85)
-771.8 (11620.45)
Inspector of Finance CEO dummy
Board size -0.4 (0.24)
-249.46 (2728.13)
20.89 (1626.47)
CEO-founder dummy 0.008 (1.19)
-0.57 (1.3)
-0.6 (1.3)
Board insiders (%)
6.6 (14.8)
-1378.22 (9055.15)
-7910.19 (275410.3)
Largest shareholder (%)
-0.042 (0.03)
-0.089 (0.054)
-0.1* (0.06)
CEO cross-directorship 0.328 (0.36)
-61.41 (2710.15)
-643.14 (15348.83)
Largest institutional shareholder (%)
-0.05 (0.03)
-0.033 (0.037)
-0.014 (0.04)
Log of total assets -0.53 (0.53)
186.83 (10039.5)
Two-tier board dummy -0.85 (1.18)
-0.54 (1.24)
-0.54 (1.2)
Constant 26.75 (11.9)
Board size -0.1 (0.15) -0.07 (0.18) -0.08 (0.18) Industry dummies YES YES YES Board insiders (%) -1.6 (6.8) -2.2 (14.36) -1.08 (13.06) Number of CEO cross-directorships 0.38 (0.306) 0.27 (0.34) 0.28 (0.34) Log of total assets -0.55 (0.40) -0.44 (0.44) -0.49 (0.44) Constant 17.58** (7.45) 24.63** (10.36) 22.33** (9.78) Industry dummy YES YES YES
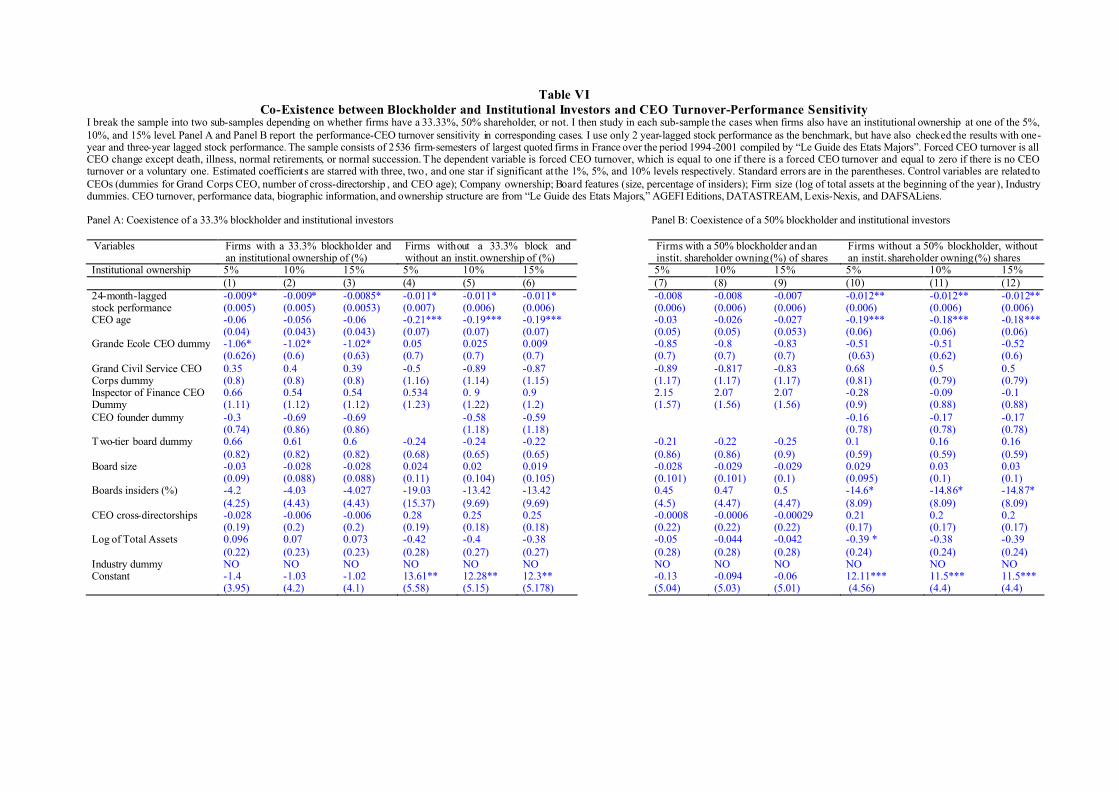
Table VI Co-Existence between Blockholder and Institutional Investors and CEO Turnover-Performance Sensitivity
I break the sample into two sub-samples depending on whether firms have a 33.33%, 50% shareholder, or not. I then study in each sub-sample the cases when firms also have an institutional ownership at one of the 5%, 10%, and 15% level. Panel A and Panel B report the performance-CEO turnover sensitivity in corresponding cases. I use only 2 year-lagged stock performance as the benchmark, but have also checked the results with one-year and three-year lagged stock performance. The sample consists of 2536 firm-semesters of largest quoted firms in France over the period 1994-2001 compiled by “Le Guide des Etats Majors”. Forced CEO turnover is all CEO change except death, illness, normal retirements, or normal succession. The dependent variable is forced CEO turnover, which is equal to one if there is a forced CEO turnover and equal to zero if there is no CEO turnover or a voluntary one. Estimated coefficients are starred with three, two, and one star if significant at the 1%, 5%, and 10% levels respectively. Standard errors are in the parentheses. Control variables are related to CEOs (dummies for Grand Corps CEO, number of cross-directorship , and CEO age); Company ownership; Board features (size, percentage of insiders); Firm size (log of total assets at the beginning of the year), Industry dummies. CEO turnover, performance data, biographic information, and ownership structure are from “Le Guide des Etats Majors,” AGEFI Editions, DATASTREAM, Lexis-Nexis, and DAFSALiens. Panel A: Coexistence of a 33.3% blockholder and institutional investors Panel B: Coexistence of a 50% blockholder and institutional investors
Variables Firms with a 33.3% blockholder and an institutional ownership of (%)
Firms without a 33.3% block and without an instit. ownership of (%)
Firms with a 50% blockholder and an instit. shareholder owning (%) of shares
Firms without a 50% blockholder, without an instit. shareholder owning (%) shares
Institutional ownership 5% 10% 15% 5% 10% 15% 5% 10% 15% 5% 10% 15% (1) (2) (3) (4) (5) (6) (7) (8) (9) (10) (11) (12) 24-month-lagged stock performance
-0.009* (0.005)
-0.009* (0.005)
-0.0085* (0.0053)
-0.011* (0.007)
-0.011* (0.006)
-0.011* (0.006)
-0.008 (0.006)
-0.008 (0.006)
-0.007 (0.006)
-0.012** (0.006)
-0.012** (0.006)
-0.012** (0.006)
CEO age -0.06 (0.04)
-0.056 (0.043)
-0.06 (0.043)
-0.21*** (0.07)
-0.19*** (0.07)
-0.19*** (0.07)
-0.03 (0.05)
-0.026 (0.05)
-0.027 (0.053)
-0.19*** (0.06)
-0.18*** (0.06)
-0.18*** (0.06)
Grande Ecole CEO dummy
-1.06* (0.626)
-1.02* (0.6)
-1.02* (0.63)
0.05 (0.7)
0.025 (0.7)
0.009 (0.7)
-0.85 (0.7)
-0.8 (0.7)
-0.83 (0.7)
-0.51 (0.63)
-0.51 (0.62)
-0.52 (0.6)
Grand Civil Service CEO Corps dummy
0.35 (0.8)
0.4 (0.8)
0.39 (0.8)
-0.5 (1.16)
-0.89 (1.14)
-0.87 (1.15)
-0.89 (1.17)
-0.817 (1.17)
-0.83 (1.17)
0.68 (0.81)
0.5 (0.79)
0.5 (0.79)
Inspector of Finance CEO Dummy
0.66 (1.11)
0.54 (1.12)
0.54 (1.12)
0.534 (1.23)
0. 9 (1.22)
0.9 (1.2)
2.15 (1.57)
2.07 (1.56)
2.07 (1.56)
-0.28 (0.9)
-0.09 (0.88)
-0.1 (0.88)
CEO founder dummy -0.3 (0.74)
-0.69 (0.86)
-0.69 (0.86)
-0.58 (1.18)
-0.59 (1.18)
-0.16 (0.78)
-0.17 (0.78)
-0.17 (0.78)
Two-tier board dummy 0.66 (0.82)
0.61 (0.82)
0.6 (0.82)
-0.24 (0.68)
-0.24 (0.65)
-0.22 (0.65)
-0.21 (0.86)
-0.22 (0.86)
-0.25 (0.9)
0.1 (0.59)
0.16 (0.59)
0.16 (0.59)
Board size -0.03 (0.09)
-0.028 (0.088)
-0.028 (0.088)
0.024 (0.11)
0.02 (0.104)
0.019 (0.105)
-0.028 (0.101)
-0.029 (0.101)
-0.029 (0.1)
0.029 (0.095)
0.03 (0.1)
0.03 (0.1)
Boards insiders (%) -4.2 (4.25)
-4.03 (4.43)
-4.027 (4.43)
-19.03 (15.37)
-13.42 (9.69)
-13.42 (9.69)
0.45 (4.5)
0.47 (4.47)
0.5 (4.47)
-14.6* (8.09)
-14.86* (8.09)
-14.87* (8.09)
CEO cross-directorships -0.028 (0.19)
-0.006 (0.2)
-0.006 (0.2)
0.28 (0.19)
0.25 (0.18)
0.25 (0.18)
-0.0008 (0.22)
-0.0006 (0.22)
-0.00029 (0.22)
0.21 (0.17)
0.2 (0.17)
0.2 (0.17)
Log of Total Assets 0.096 (0.22)
0.07 (0.23)
0.073 (0.23)
-0.42 (0.28)
-0.4 (0.27)
-0.38 (0.27)
-0.05 (0.28)
-0.044 (0.28)
-0.042 (0.28)
-0.39 * (0.24)
-0.38 (0.24)
-0.39 (0.24)
Industry dummy NO NO NO NO NO NO NO NO NO NO NO NO Constant -1.4
(3.95) -1.03 (4.2)
-1.02 (4.1)
13.61** (5.58)
12.28** (5.15)
12.3** (5.178)
-0.13 (5.04)
-0.094 (5.03)
-0.06 (5.01)
12.11*** (4.56)
11.5*** (4.4)
11.5*** (4.4)
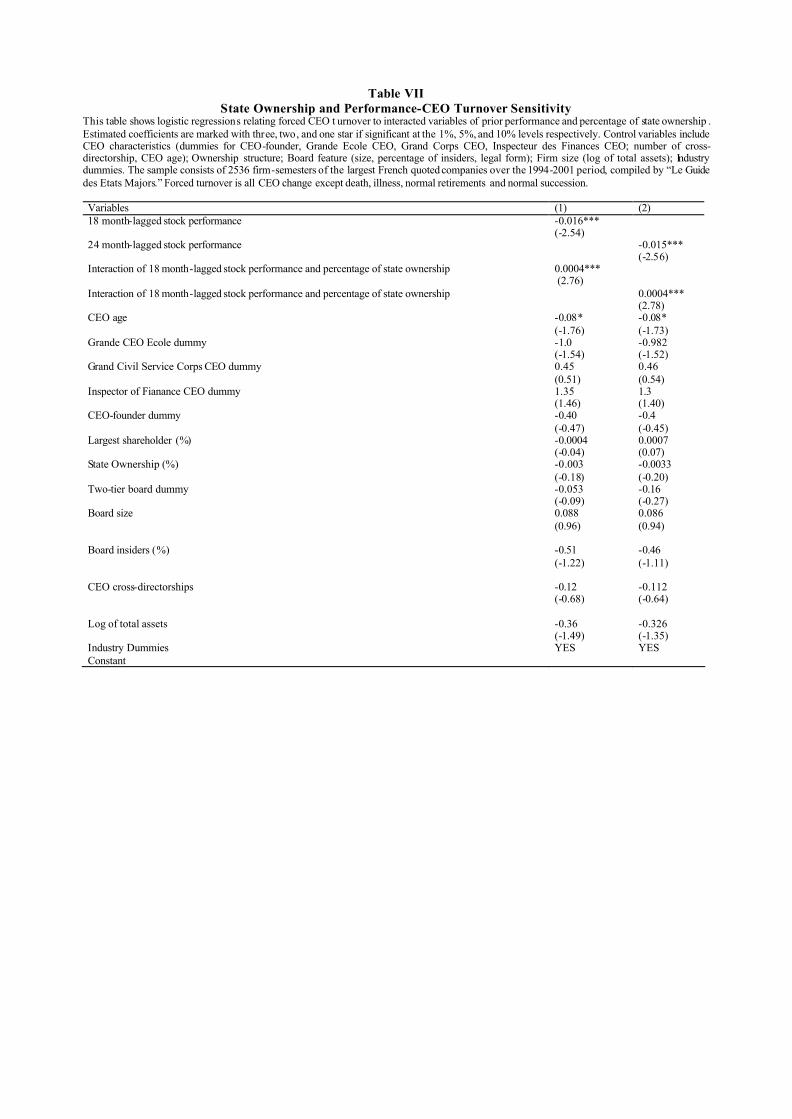
Table VII State Ownership and Performance-CEO Turnover Sensitivity
This table shows logistic regressions relating forced CEO t urnover to interacted variables of prior performance and percentage of state ownership . Estimated coefficients are marked with three, two, and one star if significant at the 1%, 5%, and 10% levels respectively. Control variables include CEO characteristics (dummies for CEO-founder, Grande Ecole CEO, Grand Corps CEO, Inspecteur des Finances CEO; number of cross-directorship, CEO age); Ownership structure; Board feature (size, percentage of insiders, legal form); Firm size (log of total assets); Industry dummies. The sample consists of 2536 firm-semesters of the largest French quoted companies over the 1994-2001 period, compiled by “Le Guide des Etats Majors.” Forced turnover is all CEO change except death, illness, normal retirements and normal succession. Variables (1) (2) 18 month-lagged stock performance
-0.016*** (-2.54)
24 month-lagged stock performance
-0.015*** (-2.56)
Interaction of 18 month-lagged stock performance and percentage of state ownership 0.0004*** (2.76)
Interaction of 18 month-lagged stock performance and percentage of state ownership 0.0004*** (2.78)
CEO age
-0.08* (-1.76)
-0.08* (-1.73)
Grande CEO Ecole dummy
-1.0 (-1.54)
-0.982 (-1.52)
Grand Civil Service Corps CEO dummy
0.45 (0.51)
0.46 (0.54)
Inspector of Fianance CEO dummy
1.35 (1.46)
1.3 (1.40)
CEO-founder dummy
-0.40 (-0.47)
-0.4 (-0.45)
Largest shareholder (%)
-0.0004 (-0.04)
0.0007 (0.07)
State Ownership (%) -0.003 (-0.18)
-0.0033 (-0.20)
Two-tier board dummy
-0.053 (-0.09)
-0.16 (-0.27)
Board size
0.088 (0.96)
0.086 (0.94)
Board insiders (%)
-0.51 (-1.22)
-0.46 (-1.11)
CEO cross-directorships
-0.12 (-0.68)
-0.112 (-0.64)
Log of total assets -0.36
(-1.49) -0.326 (-1.35)
Industry Dummies YES YES Constant
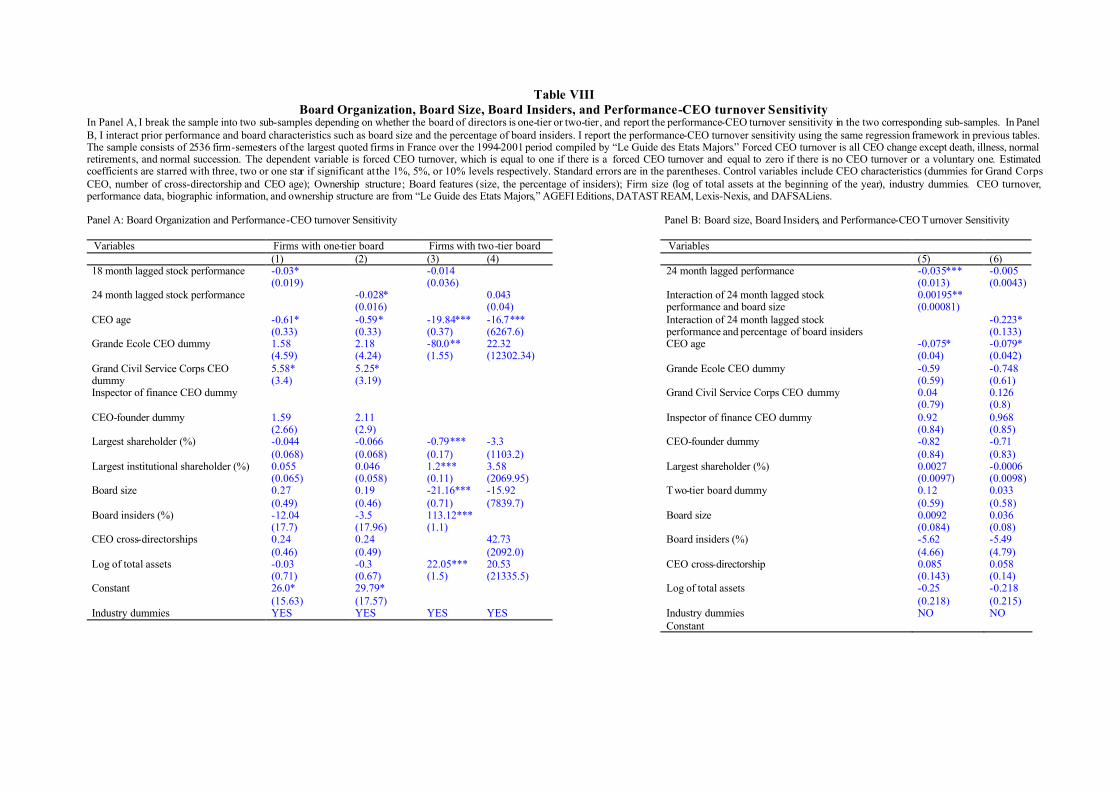
Table VIII Board Organization, Board Size, Board Insiders, and Performance-CEO turnover Sensitivity
In Panel A, I break the sample into two sub-samples depending on whether the board of directors is one-tier or two-tier, and report the performance-CEO turnover sensitivity in the two corresponding sub-samples. In Panel B, I interact prior performance and board characteristics such as board size and the percentage of board insiders. I report the performance-CEO turnover sensitivity using the same regression framework in previous tables. The sample consists of 2536 firm-semesters of the largest quoted firms in France over the 1994-2001 period compiled by “Le Guide des Etats Majors.” Forced CEO turnover is all CEO change except death, illness, normal retirements, and normal succession. The dependent variable is forced CEO turnover, which is equal to one if there is a forced CEO turnover and equal to zero if there is no CEO turnover or a voluntary one. Estimated coefficients are starred with three, two or one star if significant at the 1%, 5%, or 10% levels respectively. Standard errors are in the parentheses. Control variables include CEO characteristics (dummies for Grand Corps CEO, number of cross-directorship and CEO age); Ownership structure; Board features (size, the percentage of insiders); Firm size (log of total assets at the beginning of the year), industry dummies. CEO turnover, performance data, biographic information, and ownership structure are from “Le Guide des Etats Majors,” AGEFI Editions, DATAST REAM, Lexis-Nexis, and DAFSALiens. Panel A: Board Organization and Performance-CEO turnover Sensitivity Panel B: Board size, Board Insiders, and Performance-CEO Turnover Sensitivity
Variables Firms with one-tier board Firms with two-tier board Variables (1) (2) (3) (4) (5) (6) 18 month lagged stock performance
-0.03* (0.019)
-0.014 (0.036)
24 month lagged performance -0.035*** (0.013)
-0.005 (0.0043)
24 month lagged stock performance
-0.028* (0.016)
0.043 (0.04)
Interaction of 24 month lagged stock performance and board size
0.00195** (0.00081)
CEO age -0.61* (0.33)
-0.59* (0.33)
-19.84*** (0.37)
-16.7*** (6267.6)
Interaction of 24 month lagged stock performance and percentage of board insiders
-0.223* (0.133)
Grande Ecole CEO dummy
1.58 (4.59)
2.18 (4.24)
-80.0** (1.55)
22.32 (12302.34)
CEO age -0.075* (0.04)
-0.079* (0.042)
Grand Civil Service Corps CEO dummy
5.58* (3.4)
5.25* (3.19)
Grande Ecole CEO dummy
-0.59 (0.59)
-0.748 (0.61)
Inspector of finance CEO dummy Grand Civil Service Corps CEO dummy 0.04 (0.79)
0.126 (0.8)
CEO-founder dummy 1.59 (2.66)
2.11 (2.9)
Inspector of finance CEO dummy 0.92 (0.84)
0.968 (0.85)
Largest shareholder (%) -0.044 (0.068)
-0.066 (0.068)
-0.79*** (0.17)
-3.3 (1103.2)
CEO-founder dummy -0.82 (0.84)
-0.71 (0.83)
Largest institutional shareholder (%) 0.055 (0.065)
0.046 (0.058)
1.2*** (0.11)
3.58 (2069.95)
Largest shareholder (%) 0.0027 (0.0097)
-0.0006 (0.0098)
Board size 0.27 (0.49)
0.19 (0.46)
-21.16*** (0.71)
-15.92 (7839.7)
Two-tier board dummy 0.12 (0.59)
0.033 (0.58)
Board insiders (%) -12.04 (17.7)
-3.5 (17.96)
113.12*** (1.1)
Board size 0.0092 (0.084)
0.036 (0.08)
CEO cross-directorships
0.24 (0.46)
0.24 (0.49)
42.73 (2092.0)
Board insiders (%) -5.62 (4.66)
-5.49 (4.79)
Log of total assets -0.03 (0.71)
-0.3 (0.67)
22.05*** (1.5)
20.53 (21335.5)
CEO cross-directorship 0.085 (0.143)
0.058 (0.14)
Constant 26.0* (15.63)
29.79* (17.57)
Log of total assets -0.25 (0.218)
-0.218 (0.215)
Industry dummies YES YES YES YES Industry dummies NO NO Constant