overviewtfeip-secretariat.com/.../2019updates/...soils-2019-draft1-clean.docx · web viewcleaner...
TRANSCRIPT

Category Title
NFR 3.D3.D.a.1, 3.D.a.2.a, 3.D.a.2.b, 3.D.a.2.c 3.D.a.3, 3.D.a.4, 3.D.b, 3.D.c, 3.D.d, 3.D.e
Crop production and agricultural soilsInorganic N fertilisers (includes urea); Livestock manure applied to soils; Sewage sludge applied to soils; Other organic fertilisers applied to soils (including compost); Urine and dung deposited by grazing livestock; Crop residues applied to soils*; Indirect emissions from managed soils; Farm-level agricultural operations including storage, handling and transport of agricultural products;Off-farm storage, handling and transport of bulk agricultural products; Cultivated crops
SNAP The Nomenclature for Reporting (NFR) codes do not readily equate to the previous SNAP codes. This chapter provides guidance on the calculation of emissions previously reported under the following SNAP codes100101100102100103100104100105100101
Permanent cropsArable land cropsRice fieldMarket gardeningGrasslandFallows
ISIC Version
Guidebook 2016
Update history
November 2016For details of past updates please refer to the chapter update log available at the online Guidebook website
* The official nomenclature is misleading as the reporting category not only includes residues actively applied to soils from outside the field, e.g. for the purposes of erosion control or mulching, but also crop residues that are left on the soil surface after harvest and returned to soil by weathering and cultivation.
Lead authorsNicholas Hutchings, J. Webb, Barbara Amon
Contributing authors (including those who contributed to earlier versions of this chapter)Ulrich Dämmgen, Torsten Hinz, Klaas Van Der Hoek, Rainer Steinbrecher, Chris Dore, Jeremy Wiltshire, Beatriz Sánchez Jiménez, Hans-Dieter Haenel, Claus Rösemann, Tom
EMEP/EEA air pollutant emission inventory guidebook 2016 – Update Nov. 2016 1
3.D Crop production and agricultural soils
Misselbrook, Kentaro Hayashi, Annette Freibauer, Pierre Cellier, Klaus Butterbach-Bahl, Mark Sutton, Ute Skiba, Carolien Kroeze, Brian Pain, Wilfried Winiwarter, Guiseppi Bonazzi, Ingrid Svedinger, David Simpson, Steen Gyldenkærne, Rikke Albrektsen and Mette H. Mikkelsen.
EMEP/EEA air pollutant emission inventory guidebook 2016 – Update Nov. 2016 2
3.D Crop production and agricultural soils
Contents1 Overview..............................................................................32 Description of sources..........................................................5
2.1 Process description.................................................................................................72.2 Measured emissions...............................................................................................92.3 Controls................................................................................................................10
3 Methods.............................................................................113.1 Choice of method..................................................................................................113.2 Calculating emissions...........................................................................................123.3 Default tier 1 approach.........................................................................................133.4 Tier 2, technology-specific approach and emission factors..................................163.5 Tier 3 emission modelling and use of facility data................................................21
4 Data quality........................................................................224.1 Completeness.......................................................................................................224.2 Avoiding double counting with other sectors........................................................224.3 Verification............................................................................................................224.4 Developing a consistent time series and recalculation.........................................224.5 Uncertainty assessment.......................................................................................234.6 Inventory quality assurance/quality control (QA/QC)............................................234.7 Gridding................................................................................................................234.8 Reporting and documentation..............................................................................24
5 Glossary.............................................................................246 References.........................................................................257 Point of enquiry..................................................................26Annex 1 Ammonia.................................................................27
A1.1 Description of sources..............................................................................................27
Annex 2 Nitric oxide..............................................................31A2.1 Overview..................................................................................................................31A2.2 Description of sources..............................................................................................31A2.3 Methods....................................................................................................................32A2.4 Data quality..............................................................................................................32A2.5 Uncertainty assessment...........................................................................................32A2.6 Gridding and temporal disaggregation.....................................................................32
Annex 3 Non-methane volatile organic compounds.................33A3.1 Description of sources..............................................................................................33A3.2 Data quality..............................................................................................................34A3.3 Uncertainty assessment...........................................................................................35
Annex 4 Particulate matter....................................................36A4.1 Methods....................................................................................................................36A4.2 Data quality..............................................................................................................37
Annex 5 Summary of updates................................................38Annex references.....................................................................38
EMEP/EEA air pollutant emission inventory guidebook 2016 – Update Nov. 2016 3
3.D Crop production and agricultural soils
1 OverviewInventories of emissions are required for three purposes:
to provide annual updates of total emissions in order to assess compliance with agreed commitments;
to identify the main sources of emissions in order to formulate approaches to make the most effective reductions in emissions;
to provide data for models of air quality dispersion and the impacts of the emissions.
The guidance in this guidebook primarily aims to enable countries to prepare annual national inventories for regulatory purposes. The results obtained using the methods outlined here may also be suitable for some modelling purposes, e.g. the production of abatement cost curves. However, because of the lack of disaggregation at both the temporal and geographical scales, and also because the methods proposed take only limited account of the impacts of weather on emissions, the output may not be suitable for use in other models. This limited account of the impacts of weather is a result mainly of the difficulty in obtaining sufficiently detailed activity data to enable accurate estimates to be made of the impacts of temperature and rainfall, for example, on emissions. If possible, users should develop methods to take account of the influence of more detailed activity data. This guidebook provides methodologies that use inputs that can be reliably obtained by emission inventory compilers.
Ammonia (NH3) emissions lead to the acidification and eutrophication of natural ecosystems. NH3 may also form secondary particulate matter (PM). Nitric oxide (NO) and non-methane volatile organic compounds (NMVOCs) play a role in the formation of ozone (O3), which, near the surface of the Earth, can have an adverse effect on human health and plant growth. Particulate emissions also have an adverse impact on human health.
This chapter describes methods to estimate the emissions of NH3, NO, NMVOCs and PM from crop production and agricultural soils. Emissions of NH3 from livestock manures applied to soils, and from the excreta deposited by grazing animals, are determined by the calculations described in Chapter 3.B, ‘Manure management’. This is because the methodologies developed to calculate NH3 emissions from livestock husbandry treat those emissions as part of a chain of events so that the impacts of any factors that affect NH 3
emissions at one stage of manure management on subsequent NH3 emissions may be taken into account (see Annex 1 of Chapter 3.B ‘Manure management’). However, emissions from livestock manures applied to soils and urine and faeces deposited by grazing animals are reported under 3D (3Da2a and 3Da3, respectively). The two emission terms are calculated separately in Chapter 3B. Emissions following application of mineral nitrogen (N) fertilisers, sewage sludge and other organic wastes (including digestates produced by anaerobic digestion) are calculated in this chapter.
The persistent organic pollutants should be reported under 3.D.f ‘Use of pesticides’ or 3.I ‘Agriculture other’; as yet, no robust methodology has been developed.
Emissions (principally NH3) also arise from cultivated crops and crop residues. However, these emissions are very uncertain and it is not currently possible to provide robust methodologies for these sources. Nevertheless, given the large areas of crops, even if emissions per ha are only c. 1–2 kg ha–1, total emissions are potentially large. Hence,
EMEP/EEA air pollutant emission inventory guidebook 2016 – Update Nov. 2016 4
3.D Crop production and agricultural soils
inventory compilers should be aware of the potential impact of these emissions and that further work may enable the development of reliable methods for their calculation.
Crop production and agricultural soils typically contribute c. 32 % of the total source strength for European emissions of NH3 (Table 1.1 below) and c. 2.4 % of NO (Table 1.1), albeit the contributions vary widely among European Union (EU) Member States. Emissions of gaseous N species from crop production and agricultural soils are generally related closely to the amount of fertiliser N applied. Further information on NO is provided in Annex 2 (A2.1).
Crop production and agricultural soils are currently estimated to emit only c. 1 % of total NMVOC emissions (Table 1.1), and therefore do not yet require a methodology for calculation. However, given current uncertainties regarding the magnitude of NMVOC emissions from agricultural crops, some information is given in this chapter, in order to provide background information and a tool to estimate the order of magnitude of these emissions, as well as to highlight current uncertainties.
Particulate emissions are reported in fractions varying from fine PM (smaller than 2.5 μm (PM2.5)) to coarse (total suspended particles (TSP)). Emissions from tillage land are currently estimated to account for < 1 %, c. 6 % and c. 20 % respectively of PM2.5, PM10 and emissions in the EU, respectively.
This chapter is divided into two separate sections. The first section, the main part of the chapter, provides guidance on methodologies for calculating emissions at the Tier 1 and Tier 2 levels. The second part, the annexes, provides the scientific documentation underlying the Tier 1 and 2 methodologies and guidance for the development of Tier 3 methodologies.
Emissions from the movement of agricultural vehicles on unpaved roads, from the consumption of fuels and emissions due to the input of pesticides are not included here (see relevant chapters under 1A for mobile machinery and 3Df for the use of pesticides). Pollen and other wind-blown particles from cultivated soils that do not arise directly from field operations are considered as natural emissions. Further information on PM is provided in Annex 4.
Table 1.1 Contributions to emissions from crop production and agricultural soilsNH3 (a) NOx NMVOC PM2.5 PM10 TSP
Total, Gg a–1 3 810 8 166 6 933 1 220 1 808 3 440Crop production and agricultural soils, Gg a–1
1 236 199 89 13 92 667
Crop production and agricultural soils, %
32.4 2.4 1.3 1.0 5.1 19.3
Notes: The figures are 2013 estimates for EU-27.(a) The estimates of NH3 emissions includes those from the application of livestock manures to
agricultural soils and during grazing.(b) Gg a–1: Gigagrammes per year
Source: http://ceip.at
EMEP/EEA air pollutant emission inventory guidebook 2016 – Update Nov. 2016 5

3.D Crop production and agricultural soils
2 Description of sourcesThe sources to be reported in Chapter 3D are described in Table 2.1. Emissions from some of these sources are likely to be small. Methodologies are provided to enable users to make an estimate of the size and importance of these emissions.
EMEP/EEA air pollutant emission inventory guidebook 2016 – Update Nov. 2016 6
3.D Crop production and agricultural soils
Table 2.2 Codes for the reporting of gaseous emissions from soils and the sources they cover
NFR Name Definition and clarification of source Are emission factors available?
3Da1 Inorganic N fertilisers (includes urea)
Emissions that arise during and after the application of N fertilisers to land.
Not emissions arising from the handling of N fertilisers after delivery to the farm but before application to land; these are to be included with emissions during the handling and storage of other dry bulk materials in 3Dc
NH3 — yes and a revised Tier 2.
NO
PM — no method
3Da2a Livestock manure applied to soils
Livestock manure applied to soils. The guidance for calculating these emissions is given in Chapter 3B
NH3 — yes, calculated in 3BNO
3Da2b Sewage sludge applied to soils
Sewage sludge applied to soils NH3
3Da2c Other organic fertilisers applied to soils (including compost)
Organic fertilisers, other than livestock manures and sewage sludge, applied to soils (including digestate and compost)
NH3NO
3Da3 Urine and dung deposited by grazing livestock
Urine and dung deposited by grazing livestock to fields during grazing. The guidance for calculating these emissions is given in Chapter 3B
NH3 — yes, calculated in 3B
3Da4 Crop residues applied to soils
All non-senesced (a) crop residues which are either returned or applied to soils. In the great majority of cases these will be residues from the crop grown in that field which remain on the soil surface. However, in some cases crop residues may be imported to the field in order to control erosion, act as a mulch or a source of nutrients
No method
3Db Indirect emissions from managed soils
Emissions resulting from the deposition of N emitted from managed soils
No method
3Dc Farm-level agricultural operations including storage, handling and transport of agricultural products
This source includes not only emissions arising from the handling and storage of agricultural products on farms, such as grain, but also emissions during the handling and storage of products produced elsewhere to be used on the farm such as fertilisers and livestock feeds
Soil cultivation and crop harvesting are currently reported to account for 80 % of PM emissions in
3D (b)The values for PM do not include emissions from fertiliser, pesticides or
from grassland, e.g. hay making
3Dd Off-farm storage, handling and transport of bulk agricultural products
Off-farm storage, handling and transport of bulk agricultural products
Any emissions from this source are to be reported here because they would
not be reported elsewhere. However, no
methodology has yet been developed for these
3De Cultivated crops Ammonia emissions arising from standing or ‘cultivated’ crops. This source is distinct from emissions of NH3 that arise from the application of fertiliser to crops (which are reported under 3Da1 and 3Da2a-c)
No method
(a) See subsection 2.1.1 for the difference between non-senesced and senesced residues.
EMEP/EEA air pollutant emission inventory guidebook 2016 – Update Nov. 2016 7

3.D Crop production and agricultural soils
(b) Since PM emissions from livestock production arise from buildings, these are calculated and reported in 3.B.
There are four main sources of emissions from crop production and agricultural soils: mineral N fertiliser, livestock manure and organic waste application (NH3); soil microbial processes (NO); crop processes (NH3 and NMVOCs); soil cultivation and crop harvesting (PM).
2.1 Process description
2.1.1 Ammonia
NH3 volatilisation occurs when NH3 in solution is exposed to the atmosphere. The extent to which NH3 is emitted depends on the chemical composition of the solution (including the concentration of NH3), the temperature of the solution, the surface area exposed to the atmosphere and the resistance to NH3 transport in the atmosphere.
Although N fertilisers are normally applied as solids, there is usually sufficient moisture in the soil or air for the fertiliser to dissolve. High pH favours the volatilisation of NH 3 from many N fertilisers, so if the soil is acidic (i.e. pH values of less than 7), the degree of volatilisation will tend to be small. In contrast, if the soil is alkaline, the potential for volatilisation will tend to be larger. In general, NH3 emissions will increase with increasing temperature. Direct emissions of NH3 occur from only fertilisers containing N as ammonium (NH4
+) or if, as for urea, the fertiliser is rapidly decomposed to NH3. Those fertilisers containing N as only nitrate (NO3
–) are not direct sources of NH3 but may increase NH3
emissions via crop foliage.
NH3 emissions that occur in the 7 to 10 days after N fertiliser application include some emissions from the crop canopy, because of the increase in the concentration of N in the leaves of crops after the addition of fertiliser N. Emissions from the crop canopy that occur at this time cannot be distinguished from emissions that take place directly from applied N fertiliser and are included with N fertiliser emissions. Once direct NH3 emissions after N fertiliser application have ceased, there may be a net emission of NH3, or net deposition, depending on many factors, including the N status of the plant; the crop or plant growth stage; stresses such as drought and disease; the time of day; and the ambient NH3
concentration. Later in the season, during grain filling and senescence, net NH3 emissions from standing crops can occur. The emission of NH3 from crops is a complex process as it is influenced by both the concentration of NH3 in the air and environmental conditions. NH3
emissions occur when organic manures (livestock manure, sewage sludge and other organic wastes) are applied to land. As for N fertilisers, these emissions occur because a proportion of the N is present as ammonium in the liquid fraction.
NH3 emissions may also be emitted from crop residues as they senesce and break down. The degradation of proteins within the residues leads to the formation of NH4
+. Senesced residues, such as cereal straw, are not considered to be sources of NH3 emissions.
The difficulty in the estimation of NH3 flux from standing crops and crop residues is increased by limited measurements of NH3 flux, especially in field environments and for
EMEP/EEA air pollutant emission inventory guidebook 2016 – Update Nov. 2016 8

3.D Crop production and agricultural soils
whole seasons or years. As a consequence, it has not yet been possible to develop a robust and usable methodology to calculate these emissions.
2.1.2 Nitric oxide
In agricultural soils, where pH is likely to be maintained above 5.0, nitrification is considered to be the dominant pathway of NO emission. Nitrification is the process by which microorganisms oxidise NH4
+-N to NO3–-N. The main determinants of NO production
during crop production and in agricultural soils are mineral N concentration, temperature, soil carbon (C) concentration and soil moisture.
Increased nitrification is likely to occur after the application of fertilisers containing NH4+,
soil cultivation and the incorporation of crop residues. Activities such as tillage and incorporation are considered to increase NO emissions by a factor of four, for periods of between 1 and 3 weeks.
The 2006 Intergovernmental Panel on Climate Change (IPCC) guidelines (IPCC, 2006) account for indirect N2O emissions, i.e. those that result from the deposition of N emitted as NH3 from N fertilisers, organic wastes, urine and dung N deposited on land grazed by livestock; N in crop residues (above and below ground), including N-fixing crops and forage/pasture renewal returned to soils; and N mineralisation associated with loss of soil organic matter resulting from change of land use or management on mineral soils. Since NO is produced as an intermediate product of nitrification and denitrification, indirect emissions should be accounted for here. However, it has not yet been possible to develop a methodology. For further details, see Annex 2 (A2.2.1).
2.1.3 Non-methane volatile organic compounds
Emissions from crops may arise to attract pollinating insects, eliminate waste products or as a means of losing surplus energy. The NMVOCs emitted have proven difficult to quantify in atmospheric samples. Factors that can influence the emission of NMVOCs include temperature and light intensity, plant growth stage, water stress, air pollution and senescence. For further details see, Annex 3 (A3.1.1).
2.1.4 Particulate matter
The main sources of PM emissions from soil result from soil cultivation and crop harvesting, which together account for > 80 % of total PM10 emissions from tillage land (CEIP, 2015). These emissions originate at the sites at which the tractors and other machinery operate, and are thought to consist of a mixture of organic fragments from the crop and soil mineral and organic matter. There is considerable settling of dust close to the sources and washing out of fine particles by large particles. Field operations may also lead to the re-suspension of dust that has already settled (re-entrainment). Emissions of PM are dependent on climatic conditions, and in particular the moisture of the soil and crop surfaces.
EMEP/EEA air pollutant emission inventory guidebook 2016 – Update Nov. 2016 9
3.D Crop production and agricultural soils
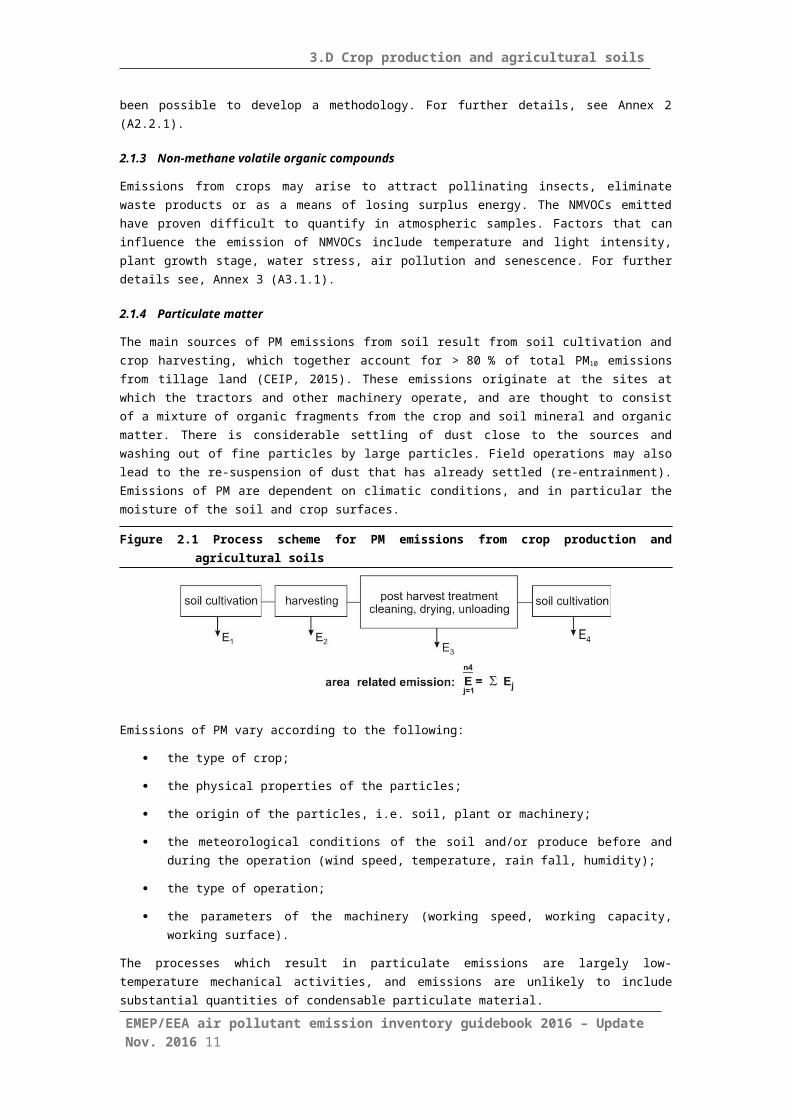
Figure 2.1 Process scheme for PM emissions from crop production and agricultural soils
Emissions of PM vary according to the following:
the type of crop;
the physical properties of the particles;
the origin of the particles, i.e. soil, plant or machinery;
the meteorological conditions of the soil and/or produce before and during the operation (wind speed, temperature, rain fall, humidity);
the type of operation;
the parameters of the machinery (working speed, working capacity, working surface).
The processes which result in particulate emissions are largely low-temperature mechanical activities, and emissions are unlikely to include substantial quantities of condensable particulate material.
2.2 Measured emissions
2.2.1 Ammonia
Based on reported measurements and reviews of NH3 from fertilisers, it was concluded that NH3 emissions from urea are the most variable, ranging from 6 to 47 % of applied N, and are very dependent on factors such as soil type, weather conditions and application rates. In contrast, measured emissions from ammonium nitrate (AN) (and calcium AN (CAN)) are much smaller, never exceeding 4 % of applied N. There are fewer studies of other fertilisers such as ammonium sulphate (AS) and diammonium phosphate (DAP). Variations in emissions result from differences in soil type and time of application. In addition, application method (broadcast, incorporation and deep placement in the soil, etc.) will affect NH3 emissions. The default emission factors (EFs) are based on broadcast application but incorporation of fertiliser will need to be taken into account if it is practised.
There are relatively few studies on emissions from crops and crop residues. The emissions appear to be low (1–3 kg ha–1 year–1), but given the large areas dedicated to crop production, the emissions are likely to be significant at the national scale.
The field application of sewage sludge is a source of NH3 emissions, but emissions are very uncertain.
For information related to livestock manure and organic wastes, see Chapters 3B and 5B.
Further information on NH3 is provided in Annex 1 (A1.1.2).EMEP/EEA air pollutant emission inventory guidebook 2016 – Update Nov. 2016 10
3.D Crop production and agricultural soils
2.2.2 Nitric oxide
A review of a global data set of NO measurements from 189 agricultural fields, but biased towards industrialised countries, has shown that NO emissions are closely related to the amount of N applied. Broadcasting fertiliser N results in greater NO emissions than incorporating fertiliser N or applying it as solution. Soils with organic C contents of > 3 % have significantly greater NO emissions than soils with < 3 % organic C, and good drainage, coarse texture and neutral pH promote NO emissions. Fertiliser and crop type do not appear to significantly influence NO emissions.
For further details, see Annex 2 (A2.2.2).
The proportion of N lost as NO from indirect emissions arising from N deposition to agricultural land is assumed to be the same as for the direct emissions. There are very few data on indirect emissions of NO from agricultural land.
2.2.3 Non-methane volatile organic compounds
Hewitt and Street (1992) concluded that only c. 700 plant species, mainly from North America, had been investigated as isoprene or monoterpene emitters. Few of these were agricultural crops, and quantitative data were available for only a few species. Many measurements had been made at temperatures higher than those prevailing in northern and western Europe. However, based on these limited data, a preliminary estimate of the order of magnitude of crop emissions can be made. Further information on how the methodology was developed is provided in Annex 3 (A3.1.1).
2.2.4 Particulate matter
Emissions from crop production arise from soil cultivation, harvesting and cleaning, of which soil cultivation is the largest source. In wet climates, the drying of crops gives rise to particularly large emissions, emitting more PM than any of the other activities. There are a wide range of different variables that have significant impacts on the emissions from the different activities. In general, the most important variable is the moisture of the soil and crop surface, but emissions will also very much depend on the crop type, soil type, cultivation method and weather conditions in general before and while working. Total dust emissions from crop management have a large mass fraction in the coarse fraction compared with other sources of PM or dust. This is typically the case for all sources of suspended or mechanically generated dust or PM, rather than combustion sources, and the latter has a much greater mass fraction in the fine and ultrafine PM fractions.
2.3 Controls
2.3.1 Ammonia
NH3 emissions from the application of manure and fertiliser N can be reduced by complying with the United Nations Economic Commission for Europe (UNECE) Framework Advisory Code of Good Agricultural Practice for Reducing Ammonia Emissions (https://www.unece.org/fileadmin/DAM/env/documents/2014/AIR/WGSR/eb.air.wg.5.2001.7.e.pdf) and the draft Guidance document on preventing and abating ammonia emissions from agricultural sources (
EMEP/EEA air pollutant emission inventory guidebook 2016 – Update Nov. 2016 11

3.D Crop production and agricultural soils
https://www.unece.org/fileadmin/DAM/env/documents/2014/AIR/WGSR/eb.air.wg.5.2001.7.e.pdf) and related guidelines, for example by the rapid incorporation of urea immediately after application. However, the majority of fertiliser N is applied to growing crops of cereals or grass, for which incorporation is seldom a practical option. Rapid incorporation is also an effective means of reducing NH3 emissions from sewage sludge and non-senesced crop residues.
2.3.2 Nitric oxide
No potential controls have been proposed for NO emissions from fertilised crops, but the topic is discussed in Annex 2 (A2.2.3).
2.3.3 NMVOCs
No potential controls have been proposed for NMVOC emissions from fertilised crops.
2.3.4 Particulate matter
No potential controls have been proposed for PM emissions from tillage operations.
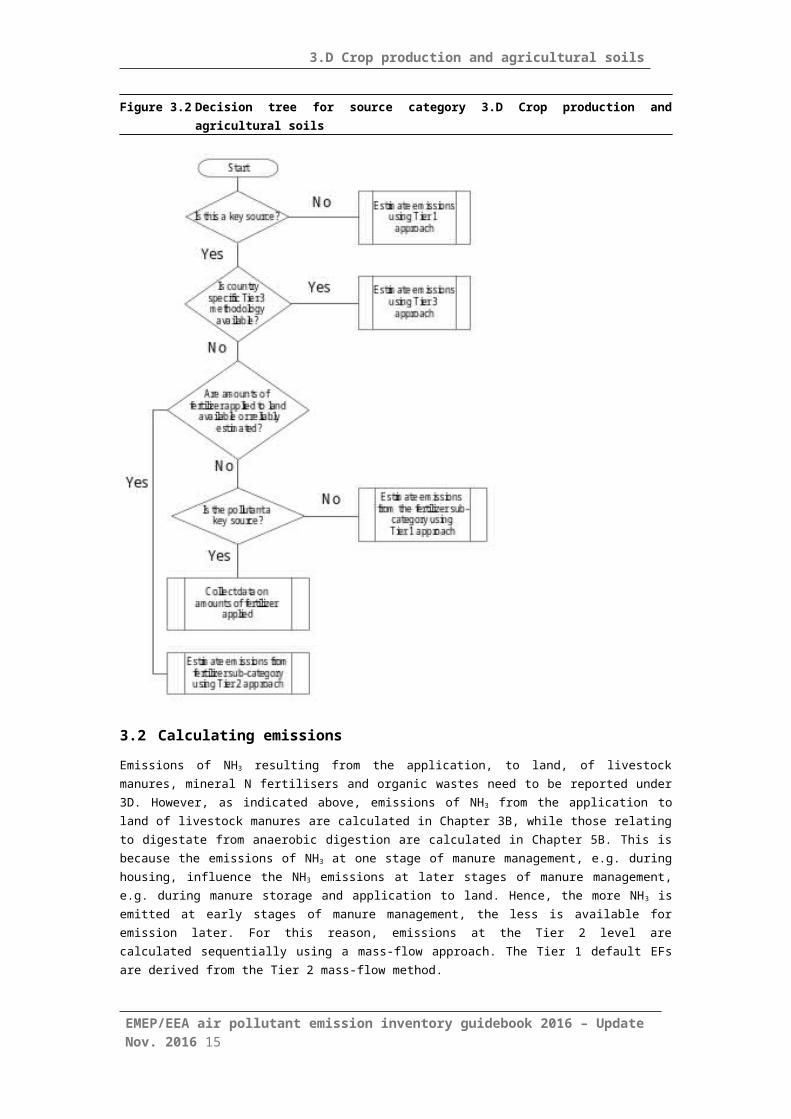
3 Methods3.1 Choice of methodFigure 3.2 provides the decision tree for this source category. Starting from the top left, it guides the user towards the most applicable approach. General guidance on the identification of key sources can be found in the general guidance chapters of the EMEP/EEA air pollutant emission inventory guidebook, namely Chapter 2, ‘Key category analysis and methodological choice’ (EMEP/EEA, 2016).
EMEP/EEA air pollutant emission inventory guidebook 2016 – Update Nov. 2016 12

3.D Crop production and agricultural soils
Figure 3.2 Decision tree for source category 3.D Crop production and agricultural soils
3.2 Calculating emissionsEmissions of NH3 resulting from the application, to land, of livestock manures, mineral N fertilisers and organic wastes need to be reported under 3D. However, as indicated above, emissions of NH3 from the application to land of livestock manures are calculated in Chapter 3B, while those relating to digestate from anaerobic digestion are calculated in Chapter 5B. This is because the emissions of NH3 at one stage of manure management, e.g. during housing, influence the NH3 emissions at later stages of manure management, e.g. during manure storage and application to land. Hence, the more NH3 is emitted at early stages of manure management, the less is available for emission later. For this reason, emissions at the Tier 2 level are calculated sequentially using a mass-flow approach. The Tier 1 default EFs are derived from the Tier 2 mass-flow method.
Manure management also effects NH3 emissions from grazed pastures. The more time grazing livestock are housed, the smaller the proportion of their excreta deposited on grazed pastures will be, and hence the smaller the emissions from those pastures.
EMEP/EEA air pollutant emission inventory guidebook 2016 – Update Nov. 2016 13
3.D Crop production and agricultural soils
Emissions from grazed pasture and after the application of livestock manures to land need to be reported separately. The guidance and both Tier 1 and Tier 2 methodologies for estimating emissions from livestock manures applied to land and from excreta deposited by livestock during grazing are presented in Chapter 3B.
There are currently no methodologies available for calculating the emissions from standing crops and non-senesced crop residues.
Note that NO emissions are reported together with NO2 emissions, as NOx. The NO emissions are converted to NO2 when reporting emissions of NOx. Further information on NO is provided in Annex 2 (A2.1)..
3.3 Default tier 1 approach
3.3.1 AlgorithmThe Tier 1 approach for NH3 and NO emissions from crop production and agricultural soils uses the general equation:
Epollutant = ARN_applied × EFpollutant (1)
where: Epollutant = amount of pollutant emitted (kg a–1),ARN_applied = amount of N applied in fertiliser or organic waste (kg a–1),EFpollutant = EF of pollutant (kg kg–1).
This equation is applied at the national level, equating ARN_applied to the annual national total fertiliser N use or organic waste application.
The Tier 1 approach for NMVOC and PM emissions from crop production and agricultural soils uses the general equation:
Epollutant = ARarea × EFpollutant (2)
where Epollutant is the amount of pollutant emitted (in kg a–1); ARarea is the area covered by crop (in ha); and EFpollutant is the EF of pollutant (in kg ha–1 a–1).
The value of ARarea is equated to the utilised agricultural area (UAA), which includes all cropland, permanent pasture and rough grazing land.
EMEP/EEA air pollutant emission inventory guidebook 2016 – Update Nov. 2016 14
3.D Crop production and agricultural soils
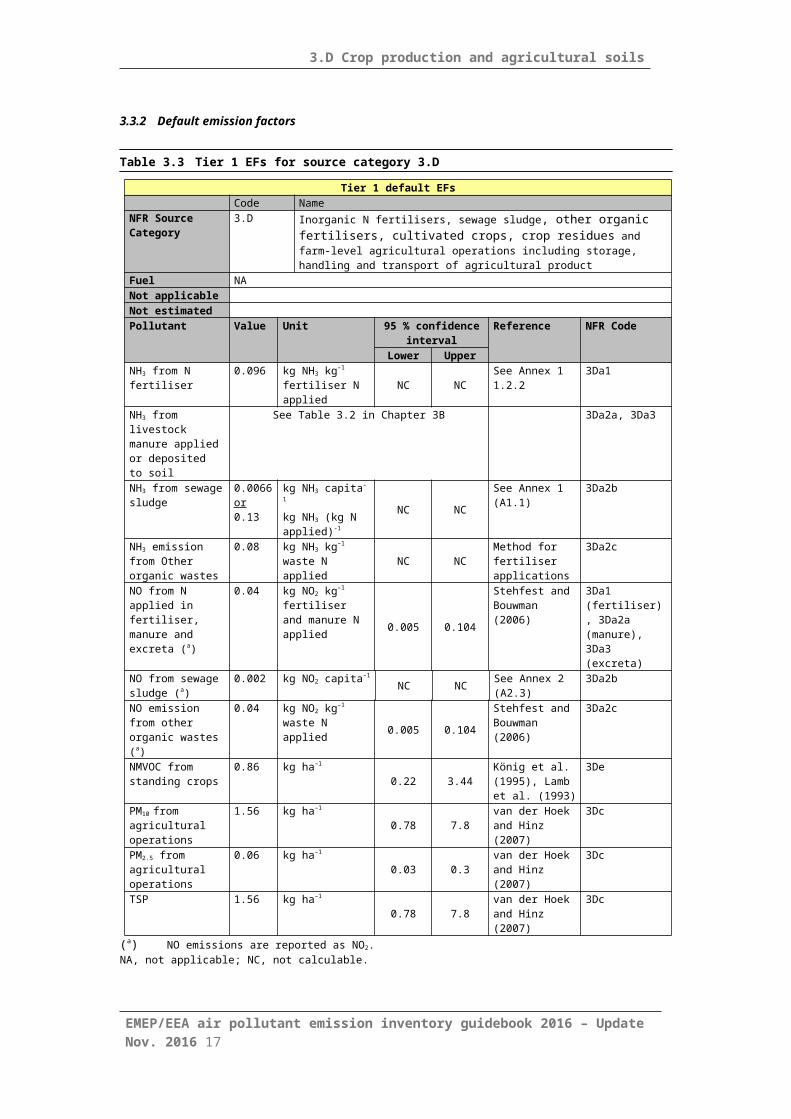
3.3.2 Default emission factors
Table 3.3 Tier 1 EFs for source category 3.D Tier 1 default EFs
Code NameNFR Source Category
3.D Inorganic N fertilisers, sewage sludge, other organic fertilisers, cultivated crops, crop residues and farm-level agricultural operations including storage, handling and transport of agricultural product
Fuel NANot applicableNot estimatedPollutant Value Unit 95 % confidence
intervalReference NFR Code
Lower UpperNH3 from N fertiliser
0.096 kg NH3 kg–1 fertiliser N applied
NC NCSee Annex 1 1.2.2
3Da1
NH3 from livestock manure applied or deposited to soil
See Table 3.2 in Chapter 3B 3Da2a, 3Da3
NH3 from sewage sludge
0.0066 or 0.13
kg NH3 capita–1 kg NH3 (kg N applied)-1
NC NCSee Annex 1 (A1.1)
3Da2b
NH3 emission from Other organic wastes
0.08 kg NH3 kg–1 waste N applied NC NC
Method for fertiliser applications
3Da2c
NO from N applied in fertiliser, manure and excreta (a)
0.04 kg NO2 kg–1 fertiliser and manure N applied
0.005 0.104
Stehfest and Bouwman (2006)
3Da1 (fertiliser), 3Da2a (manure), 3Da3 (excreta)
NO from sewage sludge (a)
0.002 kg NO2 capita–1NC NC See Annex 2
(A2.3)3Da2b
NO emission from other organic wastes (a)
0.04 kg NO2 kg–1 waste N applied 0.005 0.104
Stehfest and Bouwman (2006)
3Da2c
NMVOC from standing crops
0.86 kg ha–1
0.22 3.44König et al. (1995), Lamb et al. (1993)
3De
PM10 from
agricultural operations
1.56 kg ha–1
0.78 7.8van der Hoek and Hinz (2007)
3Dc
PM2.5 from agricultural operations
0.06 kg ha–1
0.03 0.3van der Hoek and Hinz (2007)
3Dc
TSP 1.56 kg ha–1
0.78 7.8van der Hoek and Hinz (2007)
3Dc
(a) NO emissions are reported as NO2.NA, not applicable; NC, not calculable.
Ammonia
The Tier 1 default NH3 EF for emissions from fertiliser has been derived as a mean of default EFs for individual N fertilisers weighted according to their use as reported by the International Fertilizer Industry Association (IFA) for Europe in 2014 (www.fertilizer.org). More information on the key equations and assumptions behind these defaults can be found in Annex 1 (A1.1.2).
Emissions from livestock manure applied to land or deposited during grazing should be calculated using the method described in section 3.3 of Chapter 3B.
EMEP/EEA air pollutant emission inventory guidebook 2016 – Update Nov. 2016 15

3.D Crop production and agricultural soils
The emission from sewage sludge (3Da2b) is calculated by multiplying the emission per capita in Table 3.1 by the human population of the relevant territory. The contribution of digestates produced as a result of anaerobic digestion of organic wastes (including manure) to the N applied in other organic wastes (3Da2c) should be obtained from Chapter 5B2 (Biological treatment of waste — Anaerobic digestion at biogas facilities).
Nitric oxide
The NO EF was calculated from Table 6 of Stehfest and Bouwman (2006), as the weighted average of the EFs for cropland and grassland. No information on differences in NO emissions from use of mineral fertilisers or livestock manure was mentioned by Stehfest and Bouwman (2006).
Emissions from livestock manure applied to land (3Da2a) should be calculated by multiplying the annual average population of each livestock category by the appropriate Nex values in Table 3.7 of Chapter 3B. The Tier 1 methodology does not distinguish between emissions from manure applied to land (3Da2a) or those from excreta deposited during grazing (3Da3). For each livestock category, the emissions should be reported under 3Da2a if the livestock are in animal housing for most of the year or under 3Da3 if they are predominantly grazed.
The emission from sewage sludge (3Da2b) is calculated by multiplying the emission per capita in Table 3.1 by the human population of the relevant territory.
The contribution of digestates produced as a result of anaerobic digestion of organic wastes (including manure) to the N applied in other organic wastes (3Da2c) should be obtained from Chapter 5B2 (Biological treatment of waste — Anaerobic digestion at biogas facilities).
Non-methane volatile organic compounds
A Tier 1 EF for NMVOCs is presented in Table 3.1. This has been determined by aggregating detailed data provided by König et al. (1995) and Lamb et al. (1993). A number of assumptions have to be incorporated into the aggregation methodology.
The underlying data and method for determining the Tier 1 EF are presented and explained under the description of the Tier 2 methodology (section 3.4).
Particulate matter
The Tier 1 EFs for PM do not include emissions from fertiliser, pesticides or from grassland, e.g. hay making. These emissions are mainly from combine harvesting and soil cultivation. Detailed information on PM emissions from agricultural fields is included in Annex 4. The Tier 1 EFs are based on the work of van der Hoek and Hinz (2007), but represent a simplification and aggregation of the detailed data, to give a single value for PM emissions per hectare.
3.3.3 Activity data
The UAA for most European countries can be obtained from Eurostat. Information is required on the annual national consumption of total N fertiliser. Annual fertiliser consumption data may be collected from official country statistics, often recorded as fertiliser sales and/or as domestic production and imports. The amounts and types of
EMEP/EEA air pollutant emission inventory guidebook 2016 – Update Nov. 2016 16
3.D Crop production and agricultural soils
sewage sludge applied to land will also need to be known. To calculate emissions of NO, data on additions of N in manures and excreta are also needed. Methods to estimate emissions of NO after manure application and from excreta deposited during grazing are provided in Chapter 3.B, Manure management.
3.4 Tier 2, technology-specific approach and emission factors
3.4.1 Algorithm
Ammonia
Ammonia emissions from soils
NH3 emissions from fertilisers and emissions from foliage in the weeks immediately after fertiliser application are treated here as a single integrated term because it is not possible to separately identify the two sources experimentally. These are estimated as proportional losses of the fertiliser N use for each of the main fertiliser categories. Emissions from unfertilised crops are considered to be zero.
The methodology was developed from the results of a meta-analysis of trials in which NH3
emissions were measured following the application of 31 different types of N fertiliser. Details of the meta-analysis and development of the methodology to estimate Tier 2 emissions are provided in Annex 1 (A1.1.2).
3.D.a.1 emissions after N fertiliser application are calculated as outlined below.
Step 1
Quantify the areas of the agricultural and horticultural land that are in the climatic zones ‘Cool’, ‘Temperate’ and ‘Warm’, as defined in Table 10.4 of Chapter 10 (‘Emissions from livestock and manure management’) of IPCC, 2006.
Step 2
Quantify the areas within each climate zone in which the soil pH is above or below 7.0. For the purpose of calculating emissions after N fertiliser application, the area with soils of < pH 7.0 will be designated as ‘normal’ pH, while the area with soils of > pH 7.0 will be designated as ‘high’ pH. Each combination of climatic zone and soil pH is referred to here as an ‘emission region’.
Step 3
Quantify the amounts of each fertiliser type shown in Table 3.2 that are applied to agricultural and horticultural land.
Step 4
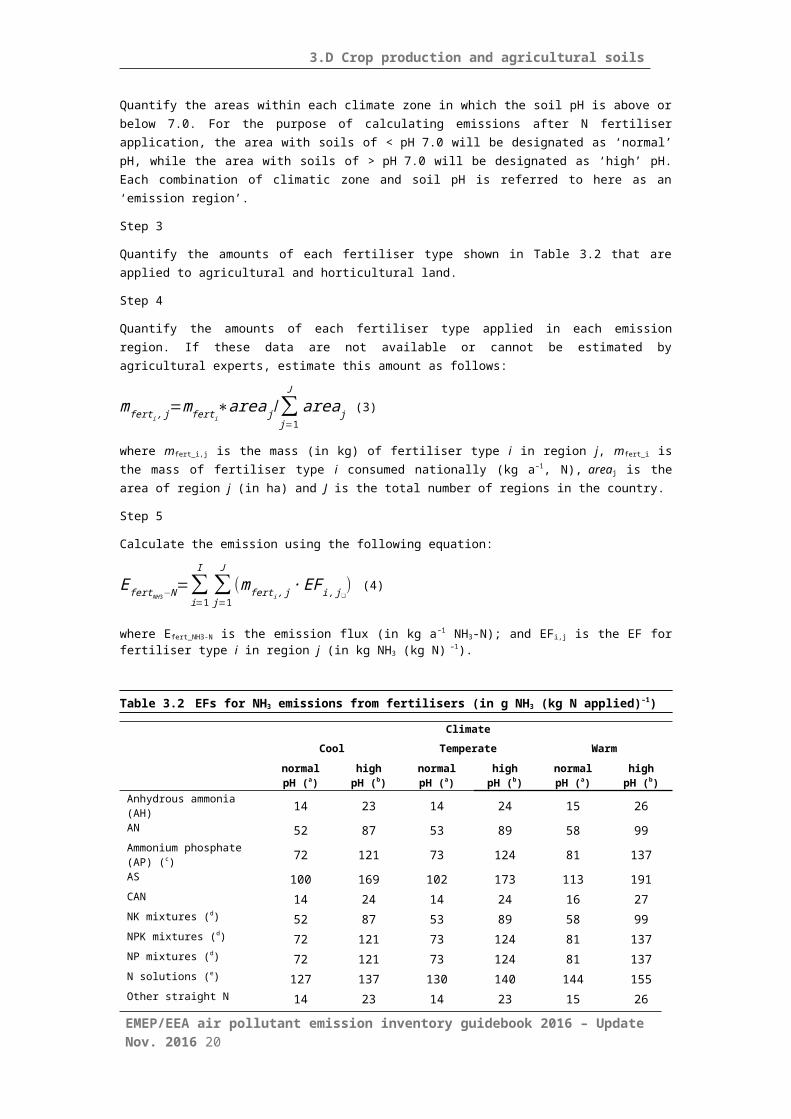
Quantify the amounts of each fertiliser type applied in each emission region. If these data are not available or cannot be estimated by agricultural experts, estimate this amount as follows:
mfert i , j=mfert i∗area j /∑j=1
J
area j (3)
EMEP/EEA air pollutant emission inventory guidebook 2016 – Update Nov. 2016 17

3.D Crop production and agricultural soils
where mfert_i,j is the mass (in kg) of fertiliser type i in region j, mfert_i is the mass of fertiliser type i consumed nationally (kg a–1, N), areaj is the area of region j (in ha) and J is the total number of regions in the country.
Step 5
Calculate the emission using the following equation:
E fertNH 3−N=∑i=1
I
∑j=1
J
(mfert i , j ∙ EFi , j❑) (4)
where Efert_NH3-N is the emission flux (in kg a–1 NH3-N); and EFi,j is the EF for fertiliser type i in region j (in kg NH3 (kg N) –1).
Table 3.2 EFs for NH3 emissions from fertilisers (in g NH3 (kg N applied)–1)Climate
Cool Temperate Warmnormal pH (a)
high pH (b)
normal pH (a)
high pH (b)
normal pH (a)
high pH (b)
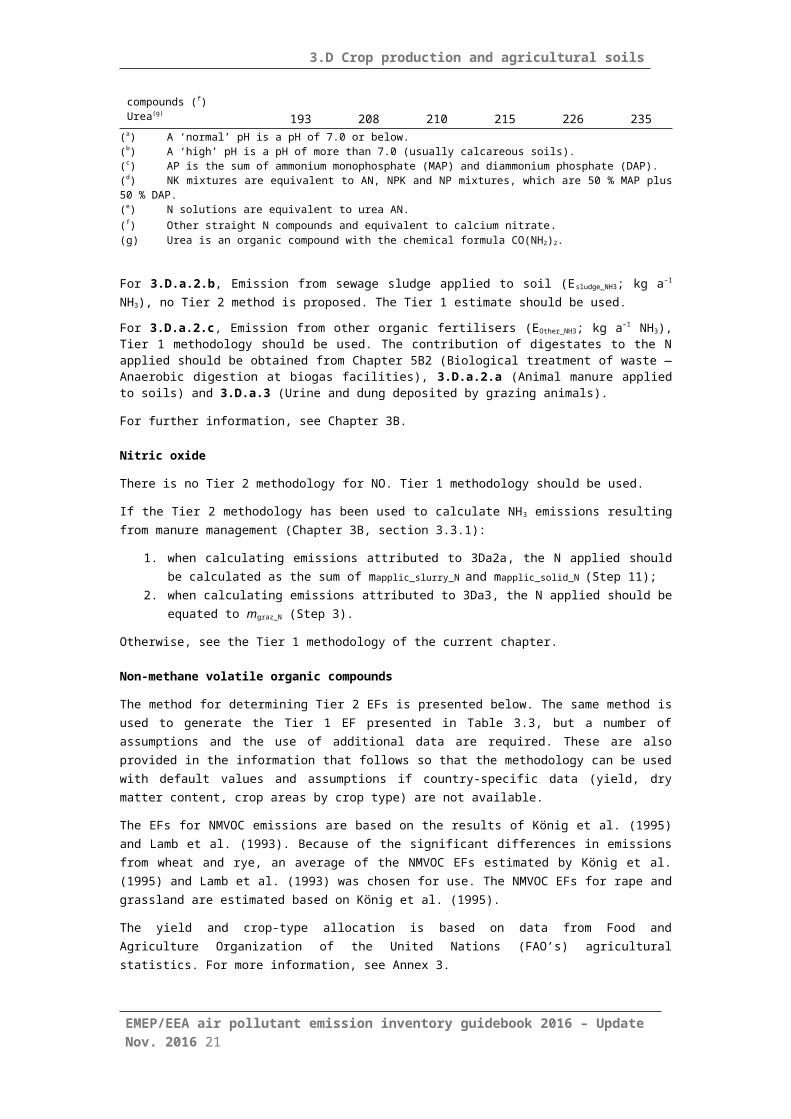
Anhydrous ammonia (AH) 14 23 14 24 15 26AN 52 87 53 89 58 99Ammonium phosphate (AP) (c) 72 121 73 124 81 137AS 100 169 102 173 113 191CAN 14 24 14 24 16 27NK mixtures (d) 52 87 53 89 58 99NPK mixtures (d) 72 121 73 124 81 137NP mixtures (d) 72 121 73 124 81 137N solutions (e) 127 137 130 140 144 155Other straight N compounds (f) 14 23 14 23 15 26Urea(g) 193 208 210 215 226 235
(a) A ‘normal’ pH is a pH of 7.0 or below. (b) A ‘high’ pH is a pH of more than 7.0 (usually calcareous soils).(c) AP is the sum of ammonium monophosphate (MAP) and diammonium phosphate (DAP).(d) NK mixtures are equivalent to AN, NPK and NP mixtures, which are 50 % MAP plus 50 % DAP.(e) N solutions are equivalent to urea AN.(f) Other straight N compounds and equivalent to calcium nitrate.(g) Urea is an organic compound with the chemical formula CO(NH2)2.
For 3.D.a.2.b, Emission from sewage sludge applied to soil (Esludge_NH3; kg a–1 NH3), no Tier 2 method is proposed. The Tier 1 estimate should be used.For 3.D.a.2.c, Emission from other organic fertilisers (EOther_NH3; kg a–1 NH3), Tier 1 methodology should be used. The contribution of digestates to the N applied should be obtained from Chapter 5B2 (Biological treatment of waste — Anaerobic digestion at biogas facilities), 3.D.a.2.a (Animal manure applied to soils) and 3.D.a.3 (Urine and dung deposited by grazing animals).
For further information, see Chapter 3B.
Nitric oxide
There is no Tier 2 methodology for NO. Tier 1 methodology should be used.
EMEP/EEA air pollutant emission inventory guidebook 2016 – Update Nov. 2016 18
3.D Crop production and agricultural soils
If the Tier 2 methodology has been used to calculate NH3 emissions resulting from manure management (Chapter 3B, section 3.3.1):
1. when calculating emissions attributed to 3Da2a, the N applied should be calculated as the sum of mapplic_slurry_N and mapplic_solid_N (Step 11);
2. when calculating emissions attributed to 3Da3, the N applied should be equated to mgraz_N (Step 3).
Otherwise, see the Tier 1 methodology of the current chapter.
Non-methane volatile organic compounds
The method for determining Tier 2 EFs is presented below. The same method is used to generate the Tier 1 EF presented in Table 3.3, but a number of assumptions and the use of additional data are required. These are also provided in the information that follows so that the methodology can be used with default values and assumptions if country-specific data (yield, dry matter content, crop areas by crop type) are not available.
The EFs for NMVOC emissions are based on the results of König et al. (1995) and Lamb et al. (1993). Because of the significant differences in emissions from wheat and rye, an average of the NMVOC EFs estimated by König et al. (1995) and Lamb et al. (1993) was chosen for use. The NMVOC EFs for rape and grassland are estimated based on König et al. (1995).
The yield and crop-type allocation is based on data from Food and Agriculture Organization of the United Nations (FAO’s) agricultural statistics. For more information, see Annex 3.
Table 3.3 Estimation of NMVOC Tier1 EFs in kg ha–1 a–1
NMVOC, kg dm–1 ha–1*
Fraction of year emitting
NMVOC, kg dm–1 a–1
Mean dry matter of crop, kg dm ha–1
NMVOC, kg ha–1a–
1
Crops distribution
Weighted EF, kg NMVOC ha–1 a–1
Wheat 2.60 10–8 0.3 6.82 × 10⁻⁵ 4700 0.32 0.35 0.11Rye 1.41 × 10⁻⁷ 0.3 3.70 × 10⁻⁴ 2800 1.03 0.05 0.05Rape 2.02 × 10⁻⁷ 0.3 5.30 × 10⁻⁴ 2500 1.34 0.10 0.13Grass (15 °C) 1.03 × 10⁻⁸ 0.5 4.51 × 10⁻⁵ 9000 0.41 0.25 0.10Grass (25 °C) 4.67 × 10⁻⁸ 0.5 2.05 × 10⁻⁴ 9000 1.85 0.25 0.46Tier1 NMVOC EF (sum of weighted EFs) 0.86
*dm: dry matter
Source: König et al. (1995), Lamb et al. (1993), FAO (2012).
The data provided in Table 3.4 are used to arrive at these values, and allow the use of country-specific data if they are available in order to determine more accurate EFs.
EMEP/EEA air pollutant emission inventory guidebook 2016 – Update Nov. 2016 19
3.D Crop production and agricultural soils
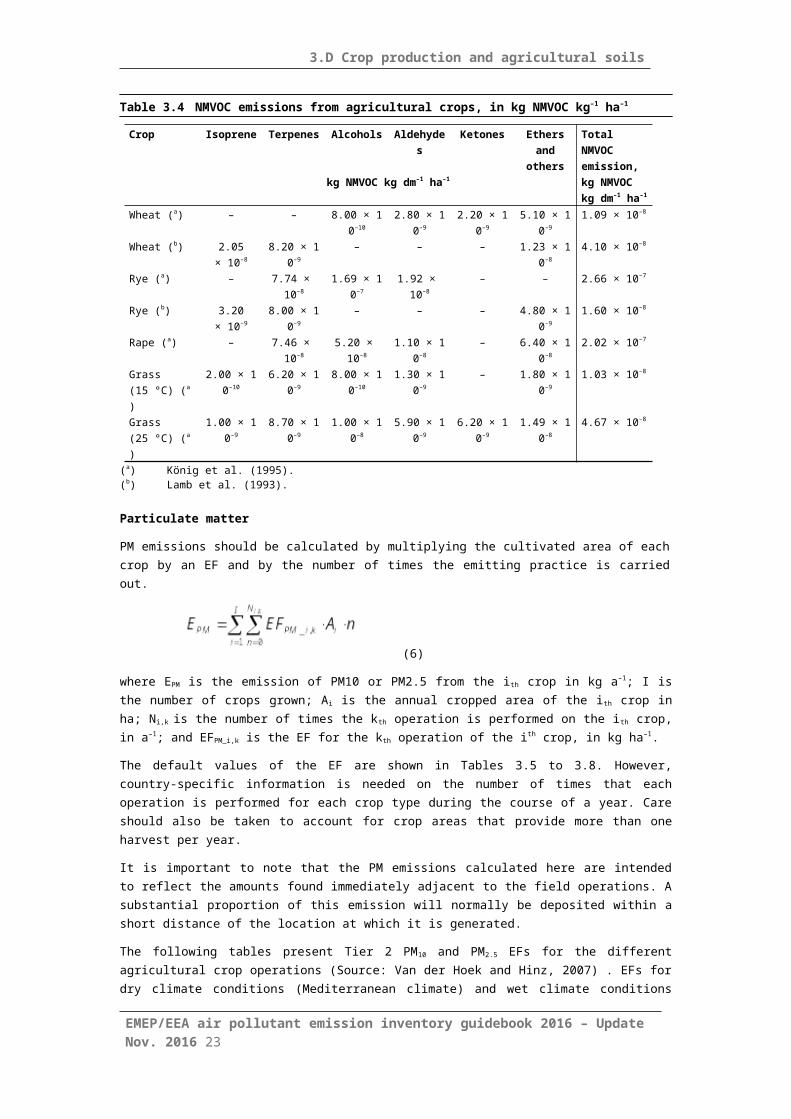
Table 3.4 NMVOC emissions from agricultural crops, in kg NMVOC kg–1 ha–1
Crop Isoprene Terpenes
Alcohols Aldehydes
Ketones Ethers and
others
Total NMVOC emission,
kg NMVOC kg dm–1 ha–1 kg NMVOC kg dm–1 ha–
1
Wheat (a) – – 8.00 × 10⁻¹⁰
2.80 × 10⁻⁹
2.20 × 10⁻⁹
5.10 × 10⁻⁹
1.09 × 10⁻⁸
Wheat (b) 2.05 × 10⁻⁸
8.20 × 10⁻⁹
– – – 1.23 × 10⁻⁸
4.10 × 10⁻⁸
Rye (a) – 7.74 × 10⁻⁸
1.69 × 10⁻⁷
1.92 × 10⁻⁸
– – 2.66 × 10⁻⁷
Rye (b) 3.20 × 10⁻⁹
8.00 × 10⁻⁹
– – – 4.80 × 10⁻⁹
1.60 × 10⁻⁸
Rape (a) – 7.46 × 10⁻⁸
5.20 × 10⁻⁸
1.10 × 10⁻⁸
– 6.40 × 10⁻⁸
2.02 × 10⁻⁷
Grass (15 °C) (a)
2.00 × 10⁻¹⁰
6.20 × 10⁻⁹
8.00 × 10⁻¹⁰
1.30 × 10⁻⁹
– 1.80 × 10⁻⁹
1.03 × 10⁻⁸
Grass (25 °C) (a)
1.00 × 10⁻⁹
8.70 × 10⁻⁹
1.00 × 10⁻⁸
5.90 × 10⁻⁹
6.20 × 10⁻⁹
1.49 × 10⁻⁸
4.67 × 10⁻⁸
(a) König et al. (1995).(b) Lamb et al. (1993).
Particulate matter
PM emissions should be calculated by multiplying the cultivated area of each crop by an EF and by the number of times the emitting practice is carried out.
(6)
where EPM is the emission of PM10 or PM2.5 from the i th crop in kg a–1; I is the number of crops grown; Ai is the annual cropped area of the ith crop in ha; Ni,k is the number of times the kth operation is performed on the ith crop, in a–1; and EFPM_i,k is the EF for the kth operation of the ith crop, in kg ha–1.
The default values of the EF are shown in Tables 3.5 to 3.8. However, country-specific information is needed on the number of times that each operation is performed for each crop type during the course of a year. Care should also be taken to account for crop areas that provide more than one harvest per year.
It is important to note that the PM emissions calculated here are intended to reflect the amounts found immediately adjacent to the field operations. A substantial proportion of this emission will normally be deposited within a short distance of the location at which it is generated.
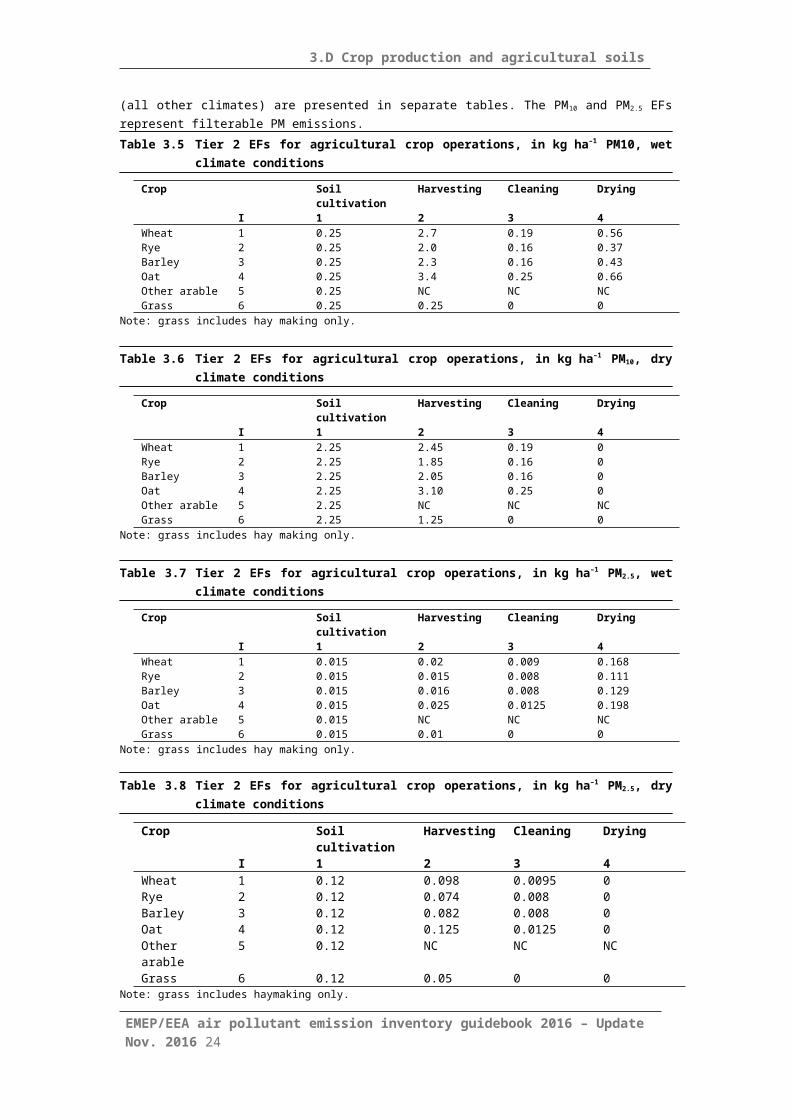
The following tables present Tier 2 PM10 and PM2.5 EFs for the different agricultural crop operations (Source: Van der Hoek and Hinz, 2007) . EFs for dry climate conditions (Mediterranean climate) and wet climate conditions (all other climates) are presented in separate tables. The PM10 and PM2.5 EFs represent filterable PM emissions.
EMEP/EEA air pollutant emission inventory guidebook 2016 – Update Nov. 2016 20
3.D Crop production and agricultural soils
Table 3.5 Tier 2 EFs for agricultural crop operations, in kg ha–1 PM10, wet climate conditions
Crop Soil cultivation
Harvesting Cleaning Drying
I 1 2 3 4Wheat 1 0.25 2.7 0.19 0.56Rye 2 0.25 2.0 0.16 0.37Barley 3 0.25 2.3 0.16 0.43Oat 4 0.25 3.4 0.25 0.66Other arable 5 0.25 NC NC NCGrass 6 0.25 0.25 0 0
Note: grass includes hay making only.
Table 3.6 Tier 2 EFs for agricultural crop operations, in kg ha–1 PM10, dry climate conditions
Crop Soil cultivation
Harvesting Cleaning Drying
I 1 2 3 4Wheat 1 2.25 2.45 0.19 0Rye 2 2.25 1.85 0.16 0Barley 3 2.25 2.05 0.16 0Oat 4 2.25 3.10 0.25 0Other arable 5 2.25 NC NC NCGrass 6 2.25 1.25 0 0
Note: grass includes hay making only.
Table 3.7 Tier 2 EFs for agricultural crop operations, in kg ha–1 PM2.5, wet climate conditions
Crop Soil cultivation
Harvesting Cleaning Drying
I 1 2 3 4Wheat 1 0.015 0.02 0.009 0.168Rye 2 0.015 0.015 0.008 0.111Barley 3 0.015 0.016 0.008 0.129Oat 4 0.015 0.025 0.0125 0.198Other arable 5 0.015 NC NC NCGrass 6 0.015 0.01 0 0
Note: grass includes hay making only.
Table 3.8 Tier 2 EFs for agricultural crop operations, in kg ha–1 PM2.5, dry climate conditions
Crop Soil cultivation
Harvesting Cleaning Drying
I 1 2 3 4Wheat 1 0.12 0.098 0.0095 0Rye 2 0.12 0.074 0.008 0Barley 3 0.12 0.082 0.008 0Oat 4 0.12 0.125 0.0125 0Other arable 5 0.12 NC NC NCGrass 6 0.12 0.05 0 0
Note: grass includes haymaking only.
3.4.2 Activity data
Information is required on the annual national consumption of the N fertiliser types shown in Annex 1, Table A1.1. Annual fertiliser consumption data may be collected from official country statistics, often recorded as fertiliser sales and/or as domestic production and imports. Fertiliser use also needs to be disaggregated by fertiliser type. In addition, if AS or DAP are significant sources, then information will be needed on the amounts of those fertilisers applied. It should be noted that most data sources (including FAO) might limit EMEP/EEA air pollutant emission inventory guidebook 2016 – Update Nov. 2016 21

3.D Crop production and agricultural soils
reporting to agricultural N uses, although applications may also occur on forest land, settlements or other lands. This unaccounted N is likely to account for a small proportion of the overall emissions. However, it is recommended that countries seek out this additional information whenever possible.
If spatially disaggregated inventories of fertilised culture emissions are required (see section 4.7 below), information on the spatial distribution of different crop types and average N fertiliser inputs to each crop type may be used. In the absence of data on the use of different fertilisers for crop types, the average N fertiliser inputs to crops may be combined with the average NH3 EF for a country: estimated total NH3 emission/total N fertiliser consumption.
The sources of activity data needed for calculating emissions from livestock manures are provided in Chapter 3B.
For ‘Other organic wastes’, guidance related to activity data is available for digestates from anaerobic digestion in Chapter 5B2 and for domestic compost in Chapter 5B1.
3.5 Tier 3 emission modelling and use of facility data
3.5.1 Algorithm
Tier 3 methodologies are those that result in more accurate estimates of emissions than would be achieved using the Tier 2 methodology. This could include the use of alternative EFs, based on local measurement, the use of more detailed activity data and EFs, or the use of process-based models. Users are encouraged to use Tier 3 methodologies whenever possible. If measures are taken to reduce emissions, such as those mentioned in section 2.3 above, it may be necessary to use a Tier 3 methodology to gain acceptance of the effect on emissions. For example, immediate incorporation of mineral fertiliser would reduce direct emissions, so the EF for the relevant type of fertiliser would require modification. In contrast, reducing N fertiliser use by balancing fertiliser applications to crop requirements would not require a Tier 3 approach, since the effect would be adequately reflected by the change in the activity data.
For estimating NH3 emissions using Tier 3 methodology, process-based models are useful because, in appropriate forms, they can relate the soil and environmental variables responsible for NH3 emissions to the size of those emissions. These relationships may then be used to predict emissions from whole countries or regions for which experimental measurements are impracticable. Models should be used only after validation by representative experimental measurements.
An example of a simple process-based model for estimating NH3 emissions from fertiliser applications to agricultural land is provided by Misselbrook et al. (2004). This has been incorporated into the United Kingdom’s National Ammonia Reduction Strategy Evaluation System (NARSES) model and used for the construction of the United Kingdom NH3 emission inventory. Important influencing variables which are included in this model are the type of N fertiliser, soil pH, land use type, application rate, rainfall and temperature. Each fertiliser type is associated with a maximum potential emission (EFmax), which is modified by functions relating to the other variables (soil pH, land use, etc.) to give an EF for a given scenario:
EF = EFmax × RFsoilpH × RFlanduse × RFrate × RFrainfall × RFtemperature (7)
EMEP/EEA air pollutant emission inventory guidebook 2016 – Update Nov. 2016 22
3.D Crop production and agricultural soils
where RF is the reduction factor, expressed as a proportion, associated with the variable.
3.5.2 Activity data
Data on the type of N fertiliser applied, soil pH, land use, application rate, rainfall and temperature will typically be required. Activity data for model input can be gathered from country-specific databases, trade associations (preferred) or, if these data are unavailable, can be found in different international databases: the International Food Policy Research Institute (IFPRI) database; the International Soil Reference and Information Centre (ISRIC) in Wageningen, the Netherlands (www.isric.org); Eurostat (http://ec.europa.eu/eurostat/); or the CAPRI database (http://www.capri-model.org/).
4 Data quality4.1 CompletenessAll nitrogenous fertilisers and all cropped land should be included. Emissions occurring after the application of manure, calculated in Chapter 3B, also need to be included, together with emissions that occur during grazing and after the application of sewage sludge.
4.2 Avoiding double counting with other sectorsCaution is required to account for the possible double counting of fertiliser/foliar emissions from grazed grassland. If only the distribution of total grassland is available, estimates would need to be made of the fraction that is grazed, while account of the temporal overlap of grazing and emissions from the application of N fertilisers and livestock manure should also be taken.
4.3 VerificationThere are no direct methods to evaluate total inventory estimates of NH3 emissions from croplands, and verification is dependent on laboratory and micrometeorological field studies of emissions from example situations. In particular, many studies have focused on laboratory measurements and there is a need to provide long-term field measurements using micrometeorological techniques to estimate NH3 fluxes over a range of crop types in different climates.
Emissions of NO, NMVOC and PM cannot be verified except by field studies of emissions from example situations.
4.4 Developing a consistent time series and recalculationGeneral guidance on developing a consistent time series is given in Chapter 4 of the EMEP/EEA air pollutant emission inventory guidebook, ‘Time series consistency’ (EMEP/EEA, 2016).
Ideally, the same method is used throughout the entire time series. However, the detail and disaggregation of emissions estimates from this source category may improve over time. In cases for which some historic data are missing, it may be necessary to derive the data using other references or data sets. Inter-annual changes in EFs are not expected unless mitigation measures are undertaken. These factors should be changed with only proper justification and documentation. If updated defaults for any of these variables
EMEP/EEA air pollutant emission inventory guidebook 2016 – Update Nov. 2016 23
3.D Crop production and agricultural soils
become available through future research, inventory agencies must recalculate their historical emissions. It is important that the methods used reflect the results of action taken to reduce emissions, and that the methods and results are thoroughly documented. If policy measures are implemented such that activity data are affected directly (e.g. increased efficiency of fertiliser use resulting in a decrease in fertiliser consumption), the effect of the policy measures on emissions will be transparent, assuming the activity data are carefully documented. In cases in which policy measures have an indirect effect on activity data or EFs (e.g. a change to the timing of fertiliser N application), inventory input data should reflect these effects. The inventory text should thoroughly explain the effect of the policies on the input data.
4.5 Uncertainty assessmentGeneral guidance on quantifying uncertainties in emission estimates is given in Chapter 5 of the Guidebook, ‘Uncertainties’ (EMEP/EEA, 2016). In the following sections, the results of some previous studies of uncertainties in emission estimates from agricultural sources are discussed.
4.5.1 Ammonia
The main uncertainty lies in the generalisation of EFs, rather than the areas of crops under cultivation, which are probably accurate in most countries to ±10 %. The standard deviation in the NH3 measurements from mineral fertiliser are at the same level as the average measured emission in per cent. The accuracies of overall emissions estimates are probably no better than ±50 %.
4.5.2 Nitric oxide
The relative 95 % confidence interval for the NO emission estimates may be regarded as from -80 % to +406 %, as given by Stehfest and Bouwman (2006); thus, the overall uncertainty is considered to be a factor of five (see also Annex 3, A3.3.2).
4.5.3 Non-methane volatile organic compounds
For NMVOCs, the uncertainty in the emission potential of plant species accounts for about half of the overall uncertainty of a factor of four for, e.g. an annual emission inventory of Great Britain (Stewart et al., 2003). See also Annex 3.
4.5.4 Particulate matter
No uncertainty can be given for the first estimates of PM, but uncertainty will be probably in the range of one order of magnitude depending on the variations in EFs and activity data.
4.5.5 Activity data uncertainties
Application of fertiliser N may be estimated with an accuracy of ±10 %; other factors, such as returns of N in manures, may be estimated to within ±25 %. With respect to national data on crop areas, an uncertainty of < 5 % is assumed, with a normal distribution.
EMEP/EEA air pollutant emission inventory guidebook 2016 – Update Nov. 2016 24
3.D Crop production and agricultural soils
4.6 Inventory quality assurance/quality control (QA/QC)Guidance on the checks of the emission estimates that should be undertaken by the persons preparing the inventory are given in the Chapter 6 of the general guidance chapters, ‘Inventory management, improvement and QA/QC’ (EMEP/EEA, 2016).
4.7 GriddingEmissions due to N fertiliser application may be spatially, as well as temporally, disaggregated using census data on the distribution of different crops and the application data statistics, together with mean fertiliser N inputs to those crops and climatic information, as outlined in Annex 1 (A1.1.2.)
NMVOC emissions from some major agricultural crops (Table 3.4) enable some spatial disaggregation of agricultural NMVOC emissions. Emissions of NMVOCs are also likely to differ according to crop growth stage, soil type, cultivation and weather conditions. Some temporal disaggregation may be possible if seasonal variations in emissions by non-agricultural plants can be assumed to be valid for fertilised crops.
The specific yield is one factor that may influence PM emissions during harvesting. More important are climatic conditions and soil composition in the particular cereal-growing regions. These are important because there are large regional differences in plant production depending on the soil and climatic properties and the requirements of the end user.
4.8 Reporting and documentationGeneral guidance on reporting and documentation is given in the general guidance chapter ‘Inventory management, improvement and QA/QC’ (Chapter 6) of the Guidebook.
The main supplementary documentation required for applying the estimates in this chapter are details of national N fertiliser consumption and the areas of major crops. The approximate timing of soil cultivation, including crop residue incorporation, will also be useful. If disaggregated estimates are to be made, details on N application rates to crops and spatially disaggregated crop distribution are needed.
The use of temperature and soil pH-dependent data presupposes knowledge and documentation of regional spring air temperatures and soil pH distribution.
5 GlossaryAN Ammonium nitrate
AP Ammonium phosphate
AS Ammonium sulphate
CAN Calcium ammonium nitrate
EMEP/EEA air pollutant emission inventory guidebook 2016 – Update Nov. 2016 25
3.D Crop production and agricultural soils
CEC Cation exchange capacity
DAP Di-ammonium phosphate
EF Emission factor
FAO Food and Agriculture Organization of the United Nations
IFA International Fertilizer Industry Association
IFPRI International Food Policy Research Institute
IPCC Intergovernmental Panel on Climate Change
ISRIC International Soil Reference and Information Centre
NMHC Non-methane hydrocarbon
OVOC Oxidised volatile organic compound
RAINS Regional Air Pollution and Simulation
REML Residual maximum likelihood
UAA Utilised agricultural area
6 ReferencesCEIP, 2015, ‘Officially reported emission data’, the Convention on Long-range Transboundary Air Pollution Centre on Emission Inventories and Projections (http://www.ceip.at/ms/ceip_home1/ceip_home/webdab_emepdatabase/reported_emissiondata/ ), last accessed September 2016.
EMEP/EEA, 2016, ‘EMEP/EEA air pollutant emission inventory guidebook 2016 — Technical guidance to prepare national emission inventories, EEA Technical Report No 21/2016, European Environment Agency (http://www.eea.europa.eu/emep-eea-guidebook ) , accessed 30 September 2016.
EMEP/EEA air pollutant emission inventory guidebook 2016 – Update Nov. 2016 26

3.D Crop production and agricultural soils
FAO, 2012, ‘Food And Agriculture Organization Of The United Nations Statistics Division’, Food and Agriculture Organization of the United Nations http://faostat3.fao.org/home/E) accessed September 2016
Hewitt, C. N. and Street, R. A., 1992, ‘A qualitative assessment of the emission of non-methane hydrocarbons from the biosphere to the atmosphere in the U.K: Present knowledge and uncertainties’, Atmospheric Environment, (26) 3069–3077.
IPCC, 2006, 2006 IPCC guidelines for national greenhouse gas inventories — Volume 4: Agriculture, forestry and other land use, Intergovernmental Panel on Climate Change (http://www.ipcc-nggip.iges.or.jp/public/2006gl/vol4.html).
König, G., Brunda, M., Puxbaum, H., Hewitt, C. N., Duckham, S. C. and Rudolph, J., 1995, ‘Relative contribution of oxygenated hydrocarbons to the total biogenic VOC emissions of selected mid-European agricultural and natural plant species’, Atmospheric Environment, (29) 861–874.
Lamb, B., Gay, D. and Westberg, H., 1993, A biogenic hydrocarbon emission inventory for the U.S.A. using a simple forest canopy model, Atmospheric Environment, (27) 1673–1690.
Misselbrook, T. H., Sutton, M. A. and Scholefield, D, 2004, ‘A simple process-based model for estimating ammonia emissions from agricultural land after fertilizer applications’, Soil Use and Management, (20) 365–372.
Stehfest, E. and Bouwman, L., 2006, ‘N2O and NO emission from agricultural fields and soils under natural vegetation: summarizing available measurement data and modelling of global annual emissions’, Nutrient Cycling in Agroecosystems, (74) 1385–1314.
Stewart, E. H., Hewitt, C. N., Bunce, R. G. H., Steinbrecher, R., Smiatek, G. and Schoenemeyer, T., 2003, ‘A highly spatially and temporally resolved inventory for biogenic isoprene and monoterpene emissions — Model description and application to Great Britain’, Journal of Geophysical Research, (D108) 4644.
van der Hoek, K. and Hinz, T., 2007, ‘Particulate matter emissions from arable production — a guide for UNECE emission inventories’, Landbauforschung Völkenrode, (308) 15–19. (https://literatur.thuenen.de/digbib_extern/dk038301.pdf).
7 Point of enquiryEnquiries concerning this chapter should be directed to the relevant leader(s) of the Task Force on Emission Inventories and Projections’ (TFEIP’s) Expert Panel on Agriculture and Nature. Please refer to the TFEIP website (tfeip-secretariat.org/) for the contact details of the current expert panel leaders.
EMEP/EEA air pollutant emission inventory guidebook 2016 – Update Nov. 2016 27
3.D Crop production and agricultural soils
Annex 1 AmmoniaSupplementary information is given in the annexes.
A1.1 Description of sources
A1.1.1 Process description
NH3 volatilisation is a physico-chemical process which results from the equilibrium (described by Henry’s law) between gaseous phase (g) NH3 and NH3 in solution (aq) (Equation A1.1). NH3 in solution is in turn maintained by the equilibrium between NH4
+ and NH3 (Equation A1.2):
NH3 (aq) ↔ NH3 (g) (A1.1)
NH4+ (aq) ↔ NH3 (aq) + H+ (aq) (A1.2)
High pH (i.e. a low concentration of hydrogen ions (H+) in solution) favours the right-hand side of Equation A1.2, resulting in a greater concentration of NH3 in solution and also, therefore, in the gaseous phase. Thus, if the soil is buffered at values of less than c. pH 7, the dominant form of ammoniacal-N (NHx) will be NH4
+ and the potential for volatilisation will be small. In contrast, if the soil is buffered at higher pH values, the dominant form of NHx will be NH3 and the potential for volatilisation will be large, although other chemical equilibria may serve to increase or decrease this.
Although NH3 emissions tend to increase with soil pH, there is a strong interaction between the fertiliser and the soil solution which may (e.g. for urea) override the effects of initial soil pH through hydrolysis and precipitation reactions. Important in this regard is the effect of the soil cation exchange capacity (CEC): large soil CEC (more specifically, high NH4
+
retention) tends to reduce NH3 volatilisation potential by reducing the concentration of NH4
+ in the soil solution by adsorption of NH4+ on the exchange sites.
The ambient soil pH results in the establishment of a bicarbonate–carbonate equilibrium with dissolved carbon dioxide (CO2):
CO2 (aq, g) ↔ H2CO3 (aq) ↔ HCO3– (aq) + H+ (aq) ↔ CO3
2– (aq) + 2H+ (aq) (A1.3)
In acidic soils, this equilibrium lies to the left, so that the concentration of free carbonate ions (CO3
2–) is negligible. However, in alkaline (calcareous) soils, the CaCO3– solubility
equilibrium also becomes important:
Ca2+ (aq) + CO32– (aq) ↔ CaCO3 (s) (A1.4)
It is apparent that the addition of soluble Ca2+ will move this equilibrium (A1.4) to the right, reducing the concentration of CO3
2– in solution, thus generating additional H+ ions (i.e. reducing the pH) via the equilibrium shown in Equation A1.3. Furthermore, the addition of any other ion that forms sparingly soluble salts with Ca2+ (e.g. sulphate) will act in the opposite manner by reducing the concentration of Ca2+ ions and hence increasing the concentration of CO3
2– ions (Equation A1.4). This will move the equilibrium (Equation A1.3) to the right and reduce the concentration of H+ ions and increase the pH.
Meteorological conditions and time of application in relation to crop canopy development (Holtan-Hartwig and Bøckmann, 1994; Génermont, 1996) also have an influence.EMEP/EEA air pollutant emission inventory guidebook 2016 – Update Nov. 2016 28

3.D Crop production and agricultural soils
Emissions of NH3 normally increase with increasing temperature and wind speed. However, there are many other factors that influence the emission under field conditions, and therefore the temperature dependence is often difficult to verify in field measurements.
The Tier 1 EF is based on consumption data for 2014 for western, central and eastern Europe and Central Asia from the IFA (www.fertilizers.org), for which the sales data have been multiplied by the Tier 2 EFs. The sale of ammonia, which covers a large amount, is not included in the Tier 1 estimate as this amount is assumed to be used in other mineral fertiliser products. The sales data are given in Tables A1.1 and A1.2.
Table A1.1 Sales data from the IFA (www.fertilizer.org) for 2014 in kt N; the figures shown are for apparent consumption
Fertiliser Western Europe
Central Europe
Eastern Europe and Central Asia
Total
Urea 4 560 1 549 2 173 8 281AN 1 828 1 404 3 820 7 053CAN 2 439 757 100 3 295AS 635 158 254 1 047AP 924 414 604 2 012Total 10 386 4 282 6 951 58 842
Table A1.2 Portions of fertiliser N in different mineral fertilisers (% of total N); the figures shown are based on sales data from the IFA (www.fertilizer.org) for 2014
Fertiliser West Europe Central Europe
East Europe and Central Asia
Total
Urea 44 36 31 38AN 18 33 55 33CAN 23 18 1 15AS 6 4 4 5AP 9 10 9 9Total 100 100 100 100
Results from Japan (Hayashi et al., 2006) suggest that the large losses usually reported from paddy fields may be a consequence of high temperatures and not directly applicable to production in more temperate regions. Furthermore, an application rate also affects the EF for urea: 21 % with a rate of 30 kg N ha–1 at panicle formation and reduced to 0.5 % with a rate of 10 kg N ha–1 at heading, in which the rice plants’ effect on net exchange was included (Hayashi et al., 2008). It was estimated that rice plants accounted for c. 70 % of the NH3 emissions from a rice paddy at the panicle formation stage after broadcast application of urea with a rate of 30 kg N ha–1. In consideration of the reduced emissions from application at panicle initiation and the practice of applying much of the fertiliser N at that stage, an EF of 22 % for urea was recently proposed by Yan et al. (2003). The same EF was used for AS.
A1.1.2 Reported measurements and emission factors
Direct emission after fertiliser N application is the most understood source of NH3 emissions from crop production and agricultural soils. Emissions take place from the soil surface layer
EMEP/EEA air pollutant emission inventory guidebook 2016 – Update Nov. 2016 29
3.D Crop production and agricultural soils
and decrease as the NH4+ ions are absorbed onto soil colloids or nitrified. Hence, fertiliser N
that is immediately incorporated into the soil will not be a source of NH3.
The main factors controlling NH3 volatilisation are the type of N fertiliser applied, the rate of hydrolysis for urea fertiliser and changes in soil pH after application for all fertilisers (Whitehead and Raistrick, 1993; ECETOC, 1994; Harrison and Webb, 2001; Sommer et al., 2004). When N is applied to soils in the form of urea, it is rapidly hydrolysed by the extracellular enzyme urease (which is ubiquitous in soils) to produce two moles of NH 3 and one of CO2 from each mole of urea ((NH2)2CO together with H2O). Dissolution of NH3
produces NH4+ and OH– ions, and the OH– ions increase the liquid phase pH which, in turn,
increases NH3 volatilisation (Equation A1.2). Although NH3 losses from AS and DAP have been found to increase markedly with increasing pH (e.g. Whitehead and Raistrick, 1990), NH3 loss from urea is less dependent on initial soil pH, because urea hydrolysis increases the pH immediately around the fertiliser granule to c. pH 9.2 (Fenn, 1988). Moreover, reaction with calcium ions reduces the volatilisation potential of the (NH4)2CO3 produced by urea hydrolysis (Fenn and Hossner, 1985). In contrast with other N fertilisers, NH 3 loss from urea did not increase consistently with pH, and was not greater for calcareous soils (Whitehead and Raistrick, 1990). This was considered to be due to differences in CEC. Whitehead and Raistrick (1993) also found losses of NH3 from cattle urine were no greater on calcareous than on non-calcareous soils. The best correlation with NH3 loss was with CEC. Gezgin and Bayrakli (1995) measured NH3 losses from urea, AS and AN on calcareous soils in Turkey. Losses from AS (c. 16 %) and AN (c. 5 %) were greater than those measured on non-calcareous soils by Sommer and Jensen (1994), which were < 5 % and < 2 %, respectively. However, losses from urea at c. 8 % were less than those measured by Sommer and Jensen (1994). In field studies in the United Kingdom, Chadwick et al. (2005) also observed large variations which not could be attributed to a single parameter. Application to calcareous soils will, however, increase NH3 losses from AS (Fleisher et al., 1987). Other fertilisers, such as AN, are more neutral in pH and produce much smaller emissions. These are often difficult to distinguish in measurements from plant–atmosphere fluxes.
In several experiments, negative NH3 emissions after N fertiliser application have been found for fertilisers that have little emission potential. This is explained by high NH3
concentrations in the air which favour plant uptake and a net movement of NH3 from the air to plants and soils; this complicates the isolation of NH3 flux from fertiliser use. It is also possible that there were measurement errors for incoming and outgoing air in the tunnels during periods of low emissions.
Early reviews of data from field measurements of NH3 loss after application of N fertilisers to grassland and arable land concluded that NH3 losses from N fertilisers are greater by a factor of 2 on grassland (Van der Weerden and Jarvis, 1997; Harrison and Webb, 2001). However, subsequent measurements have failed to show such a large difference, and different EFs when N fertilisers are applied to arable or grassland are no longer considered appropriate (Bouwman et al., 2002b; Chadwick et al., 2005). Under controlled (laboratory) conditions, relationships between temperature and NH3 loss have been found. However, field experiments in which other factors also affect emissions have often failed to confirm an increase in NH3 emissions with increasing temperature. The meta-analysis carried out to provide more robust EFs for this chapter did confirm interactions between temperature and NH3 emissions after N fertiliser application. These interactions differed among N fertiliser types and were not always linear.
EMEP/EEA air pollutant emission inventory guidebook 2016 – Update Nov. 2016 30
3.D Crop production and agricultural soils
Calculation of ammonia emissions after application of N fertiliser
Hutchings et al. (in preparation) carried out a meta-analysis of 1 209 observations in which NH3 emissions were measured after the application of 31 different types of N fertiliser. The data were analysed in a series of generalised linear mixed models in order to take into account the varying uncertainty on the applied scale, to determine an additive effect over the whole scale and to ensure that the predicted values stayed within the range of 0–100%. Details of the findings will be given in Hutchings et al. (in preparation) and a spreadsheet is provided to enable more specific calculations.
Development of Tier 1 methodology for ammonia emissions from sewage sludge
Sewage sludge is generated in sewage treatment works. The primary function of such works is to remove biologically degradable organic matter from wastewater, to prevent pollution of freshwater and coastal marine ecosystems. Based on Leip et al. (2011), the sources of the N in sewage are domestic sewage (human excreta, food waste, etc.) and industrial effluent, with the former accounting for about 93 % of treated sewage. The same source estimated that only about 1 % of the N entering the sewage treatment system was applied to land in sewage sludge. Rose et al. (2015) estimated that the mean excretion of N by human adults was 11 g capita–1 day–1 in urine and 1.8 g capita–1 day–1 in faeces, resulting in an annual excretion of 4.67 kg capita–1 a–1. If the domestic contribution is assumed to be 93 % of the total, the total input of N to the wastewater treatment system is 5.0 kg capita–1 a–1. The N applied to land in sewage sludge is, therefore, estimated to be 0.05 kg capita–1 a–1.
The NH3 emission from field-applied sewage sludge occurs from the ammonium fraction. This fraction accounts for < 10 % in solid sludges and about 5 to 50 % in liquid sludges. The proportion of this ammonium that is emitted as NH3 will vary considerably, depending on the application technique and the weather at the time of application. As a first approximation, we will assume that one-third of the N in the sludge is in the ammoniacal form and that one-third of this is lost as NH3. After converting from NH3-N to NH3, this yields an EF of 0.13 kg NH3 (kg N applied)–1.
Multiplying 0.0502 kg N applied capita–1 a–1 by 0.132 kg NH3 (kg N applied)–1 yields an EF of 0.0067 kg NH3 capita–1 a–1. The Tier 1 methodology is therefore:
NH3 emission from sewage sludge applied to land = 0.0066 human population
Note that by using total population rather than adult population, the NH3 emission may be overestimated. However, given the other uncertainties in the development of the methodology and the limited extent to which this source will contribute to national NH 3
emissions, it is not worth attempting to refine the methodology further.
EMEP/EEA air pollutant emission inventory guidebook 2016 – Update Nov. 2016 31

3.D Crop production and agricultural soils
Annex 2 Nitric oxideA2.1 OverviewSoils and crops are considered to be a net sink for most NOx (NO plus NO2) compounds. However, NO may be released from soils during nitrification and denitrification after N application and mineralisation of incorporated crop residues and soil organic matter. Estimates of NO emissions are very uncertain, but soils may contribute c. 4–8 % of total European emissions. On a hot summer day, this fraction may increase to values of > 27 % (Stohl et al., 1996; Butterbach-Bahl et al., 2001). On the global scale, recent estimates consider that NOx emissions from soils could represent more than 40 % of NOx emissions (Penner et al., 1993; Davidson and Kingerlee, 1997) and up to 65 % for the USA (Hall et al., 1996).
A2.2 Description of sources
A2.2.1 Process description
For plant production and agricultural soils, for which the pH is likely to be maintained above 5.0, nitrification is considered to be the dominant pathway of NO emission. NO is also a substrate and product of denitrification, but it is only very rarely emitted as a consequence of denitrification in European soils (see Ludwig et al. (2001) for further details).
A2.2.2 Emissions
Data on NO emissions in relation to fertiliser N use were reviewed by Yienger and Levy (1995) and were updated by Skiba et al. (1997). Yienger and Levy (1995) calculated an arithmetic mean emission of 2.5 % loss of fertiliser N. Based on almost the same data set, Skiba et al. (1997) showed that NO losses ranged from 0.003 to 11 % of applied fertiliser N with a geometric mean emission of 0.3 %. More recently, Bouwman et al. (2002a) used the residual maximum likelihood (REML) technique to calculate, from 99 studies of NO emissions, a global mean fertiliser-induced NO emission of 0.7 %. Before this, an EF of 1.0 % of applied N was suggested by Freibauer and Kaltschmitt (2000).
Maljanen et al. (2007) reported emissions of NO from grazed pastures that were c. 40 % of those of N2O; background emissions were c. 25 % of N2O. NO emissions increased with increasing soil temperature and with decreasing soil moisture. Emissions of NO are still poorly understood, but it is clear that there are differences in the mechanisms regulating N2O and NO production. There are not enough data available to discuss the effect of grazing on NO emissions, but the localised very high N and C inputs caused by animal excreta are likely to stimulate NO production.
A2.2.3 Controls
In temperate climates, NO emissions are considered to be predominantly a consequence of nitrification. Hence, substitution of AN for urea to reduce NH3 emissions, may also give some reduction in NO emissions; the results from Slemr and Seiler (1984) are consistent with this hypothesis. Nevertheless, these conclusions can only be tentative as there are insufficient data to discriminate among fertiliser N sources (Skiba et al., 1997). Chu et al.
EMEP/EEA air pollutant emission inventory guidebook 2016 – Update Nov. 2016 32

3.D Crop production and agricultural soils
(2007) reported that the use of controlled-release urea fertiliser could reduce emissions of NO.
A2.3 Methods
The Tier 1 methodology for sewage sludge is calculated by multiplying the EF derived from Stehfest and Bouwman (2006) of 0.04 kg NO2 (kg N applied)–1 by the estimate of 0.05 kg N applied capita–1 a-1, derived in Equation A1.2. The result is 0.002 kg NO2 capita–1.
There is currently no Tier 2 methodology for NO.
A2.4 Data quality
A2.5 Uncertainty assessmentLess information is available on the factors that determine losses of NO from soils (N input, soil temperature and soil moisture, soil texture, soil C). Long-term intensive field experiments are not currently sufficient to provide a good degree of certainty in the estimate. The data available suggest that the EF for NO is broadly similar to the EF for N 2O (Bouwman et al., 2002a; Stehfest and Bouwman, 2006).
A2.6 Gridding and temporal disaggregationLosses of NO take place mainly as a consequence of nitrification and in acid soils as a consequence of chemo-denitrification. Peaks in NO emission are therefore likely after the application of NH4
+-based N fertilisers, incorporation of crop residues and tillage of soils. Data on all of these processes should be available, for some countries at least. At present, however, there are insufficient data on NO emissions to quantify these effects. Ultimately, as the mechanisms of NO production become better understood, climatic data may also be utilised to assess when soil and weather conditions are favourable for nitrification, and hence NO production (Butterbach-Bahl et al., 2004). In common with NH3, NO emissions may vary greatly in space and time from year to year, depending upon weather conditions and fertiliser input.
EMEP/EEA air pollutant emission inventory guidebook 2016 – Update Nov. 2016 33

3.D Crop production and agricultural soils
Annex 3 Non-methane volatile organic compoundsA3.1 Description of sources
A3.1.1 Emissions
Hewitt and Street (1992) concluded that trees are the main emitters of non-methane hydrocarbons (NMHCs). Other plants, including crops, were insignificant sources in comparison. However, although NMVOC emissions from plant production and agricultural soils are smaller than from woodlands, they may not be entirely negligible (Simpson et al., 1999). König et al. (1995) noted that in earlier studies, NMHCs were regarded as the major component of VOC emissions. However, König et al. (1995) found oxygenated VOCs to be the major type of VOC emission from cereals. In that study, emissions were not invariably greater from trees than from agricultural crops.
The emission of some NMVOCs may be of benefit to plants, e.g. to attract pollinating insects, while others may be waste products or a means of losing surplus energy (Hewitt and Street, 1992). Ethene emissions have been observed to increase when plants are under stress.
As with forest NMVOC emissions, biogenic emissions from grasslands consist of a wide variety of species, including isoprene, monoterpenes (α-pinene, limonene, etc.) and oxygenated volatile organic compounds (OVOCs). The OVOC species consist of a large number of oxygenated compounds (alcohols, aldehydes, etc.) and have proven difficult to quantify in atmospheric samples. Progress in the quantification of OVOCs from European vegetation has been made (König et al., 1995), although many more measurement data will be required before reliable attempts to specifically inventory OVOCs can be made.
Factors that can influence the emission of NMVOCs include temperature and light intensity, plant growth stage, water stress, air pollution and senescence (Hewitt and Street, 1992).
Methodologies and emission factorsThe EFs include partial EFs for isoprene, terpenes, alcohols, aldehydes, ketones, ethers and other organic compounds, and their contribution to overall emissions.
The use of the following equation and data is recommended:
ENMVOC_crop = ∑Ai × mD_i × ti × EFi (A3.1)
where ENMVOC_crop is the NMVOC emission flux from cropped areas (kg a–1 NMVOC); Ai is the area covered by cropi (ha a–1); mD_i is the mean dry matter of crop i (kg ha–1 a–1); ti is the fraction of year during which cropi is emitting (in a a–1); and EFi is the EF for crop i (kg kg–1
NMVOC).
NMVOC measurements made by König et al. (1995) are used to provide information on the order of magnitude of NMVOC emissions from growing crops. Other comparable NMVOC emission studies are Lamb et al. (1993) and Winer et al. (1992).
Comparisons of the reference EFs show that the EF for wheat estimated by König et al. (1995) is significantly smaller than that estimated by Lamb et al. (1993) and Winer et al. EMEP/EEA air pollutant emission inventory guidebook 2016 – Update Nov. 2016 34
3.D Crop production and agricultural soils
(1992). The opposite is the case for rye: the EF estimated by König et al. (1995) is considerably greater than that estimated by Lamb et al. (1993) and Winer et al. (1992). König et al. stated that the reason for the large difference in the emission rates between rye and wheat observed in the study is unclear. However, different stages of development might explain the differences in the observed emission rates. Rye was sampled at near blossoming stage, during which the emissions are greater and this could explain why the EF was greater than the EF suggested by the results of Lamb et al. (1993). It might be that the emissions of alcohols in the non-blossoming rye were already a result of the development of the blossoming stage. The samples for wheat were taken 3 days after blossoming and the blossoms had been washed off by heavy rain during the days prior to sampling. It might be possible that the emission of alcohols is reduced after rainfall because of the leaching of water-soluble compounds during rainfall.
Alternative derivation of Tier 1 emission factors
A Tier 1 NMVOC EF can be determined if the data in Table 3.4 (Section 3.4) are combined with some additional data (average crop yield, dry matter content and crop areas).
Yield and dry matter content vary significantly from country to country because of differences in climatic conditions and the use of agricultural technology. If country-specific yield and dry matter content are not available, the following can be used.
Average crop yields can be estimated from FAO agricultural statistics, which include data on the main crop-producing countries in the European Monitoring and Evaluation Programme (EMEP) area (FAO, 2012). Yield values are based on the 2006–2010 average. Dry matter content is assumed to be 0.85 kg per kg harvested for wheat and rye, 0.90 kg per kg for rape and 0.30 kg per kg for grass. The yield for grassland is based on Danish agricultural conditions because no yield data for grass are given in FAO Statistics.
Crops emit NMVOCs during the growing season only. For the purposes of this methodology, the growing season accounts for 0.3 of the year for wheat, rye and rape, while the fraction of the year for grassland is taken as 0.5 (Rösemann et al., 2011).
Crop area data are required for different crop types, as outlined below.
To determine the Tier 1 EF, it was necessary to aggregate the data for the different crop types. To do this, it was necessary to assume the distribution between crops and grassland. This distribution varies considerably among countries — for example, grain accounts for 55 % of the total agricultural area in Denmark, 30 % in France and 20 % in the Russian Federation. The distribution of the fraction of wheat, rye, rape and pasture land is based on estimates from data in the FAO agricultural database. An area distribution of 50 % cereals and 50 % of pasture land has been assumed.
Two different NMVOC emission estimates are given for wheat (Table 3.4). The emission reported by König et al (1995) is much less than that suggested by Lamb et al. (1993), and thus an average emission is used. The same is true for rye, for which an average of the two emissions estimates is used. The emission from grass is based on König et al. (1995).
Based on the abovementioned assumptions, the Tier 1 NMVOC EF was determined to be 0.86 kg NMVOC per hectare per year.
EMEP/EEA air pollutant emission inventory guidebook 2016 – Update Nov. 2016 35

3.D Crop production and agricultural soils
A3.2 Data quality
A3.2.1 Uncertainty
The small number of measurements of NMVOC emissions from agricultural vegetation is a considerable weakness, and, in addition, the reference material is very dated. However, the literature does not appear to contain relevant studies that are more recent than those used here. It is unknown whether or not emissions are related to fertiliser N inputs.
A3.3 Uncertainty assessment
A3.3.1 Emission factor uncertainties
Biogenic VOC emissions for the United Kingdom were summarised by Hewitt and Street (1992). These ranged from 38–211 Gg a–1 total NMVOCs. Emissions from woodlands were estimated to be 72 % of total biogenic emissions by Anastasi et al. (1991). Thus, between c. 10 and 59 Gg a–1 appear to be of agricultural origin. In their incomplete analysis, Hobbs et al. (2004) calculated c. 5 t a–1 from agricultural crops. This compares with the Corinair 94 estimate of only 2 Gg a–1 for SNAP code 1001, Cultures with fertilisers, NFR 3.D.1, or < 2 % of emissions from agriculture and forestry. Thus, the range of emissions may be uncertain by a factor of 30. However, the estimate for agriculture by Anastasi et al. (1991) was recognised as likely to be too large.
A3.3.2 Activity data uncertainties
Hewitt and Street (1992) concluded that only c. 700 plant species, mainly from North America, had been investigated as isoprene or monoterpene emitters. Few of these were agricultural crops, and quantitative data were available for only a few species. Many measurements had been made at temperatures higher than those prevailing in northern and western Europe.
With respect to national data on crop areas, an uncertainty of < 5 % is assumed, with a normal distribution.
EMEP/EEA air pollutant emission inventory guidebook 2016 – Update Nov. 2016 36
3.D Crop production and agricultural soils
Annex 4 Particulate matterA4.1 Methods
A4.1.1 Tier 1 default approach
The EFs for PM10 and PM2.5 can be determined in a number of different ways, as outlined below.
Direct measurements can be made with pre-separators. These pre-separators split the sample air flow into different components based on the aerodynamic properties of the particulate material. These measurements can be used directly for comparison or balancing.
The PM size distribution of the total dust emissions can be measured. If total dust emissions are known, then EFs for the different PM fractions can be determined.
It is also possible, based on measurements, to calculate the different PM fractions as a proportion of the TSP. To get results comparable with other approaches, the definition and measuring procedure for TSP must be known.
Takai et al. (1998) introduced a sampler for the ‘inhalable part’ of TSP. These samplers have a cut diameter (50 % separation) at 100 µm.
A literature review reported different ways to create EFs for arable farming.
Direct measurements of the primary PM emissions from the use of cultivation implements can be used. From these, machinery-related estimates of the potential strength of a source and field-related EF may be calculated.
Indirect estimations of source strength using concentration measurements carried out using machinery placed in the driver’s cab and a layer- or plume-based model of the treated area to establish a relationship with the balance volume or volume flow rate concerned can be made.
Measurements of PM concentrations at the border of a field fitted to an inverse computing model of dispersion can be used.
The PM10 EFs given below were reported.
Combine harvesting:
4.1–6.9 kg ha–1, parameter cereal, cereals humidity during harvesting (Batel, 1976)
3.3–5.8 kg ha–1 (WRAP, 2006).
Because of the settling effect of coarse particles, it was assumed that only part of the primary emitted PM10 leaves the field to give the field EF. Two situations have been considered: one with 50 % of the original PM10 emissions leaving the field and one with 10 % leaving the field.
Soil cultivation:
0.1 kg ha–1, the Regional Air Pollution Information And Simulation (RAINS)
0.06–0.3 kg ha–1 (Wathes et al., 2002)
0.28–0.48 kg ha–1 (Hinz, 2002).
EMEP/EEA air pollutant emission inventory guidebook 2016 – Update Nov. 2016 37

3.D Crop production and agricultural soils
Assumptions based on both models are not consistent with measured values and lead to overestimates of EFs. Corrections gave an averaged field EF of 0.25 kg ha ha–1 as given in the matrix:
4.2 kg ha–1, US National Emission Inventory (NEI) method;
5.2 kg ha–1, US California Air Resources Board (CARB) method.
Measurements from California are much larger. This is because of the climatic and soil conditions, that is, higher temperatures and lower humidity. This is supported by measurements carried out in Brandenburg, Germany, under 2006 conditions — which were hot and dry — and emission values one order of magnitude greater than former years were derived.
Table A4.1 EFs for PM10, PM2.5 and PM1 for field operations
PM10, kg ha–1 PM2.5, kg ha–1 PM1, kg ha–1
Harrowing 0.82 0.29 < 1Discing 1.37 0.12 0.03Cultivating 1.86 0.06 0.02Ploughing 1.20 0.05 0.01
Source: EFs for soil operations (van der Hoek and Hinz, 2007).
Source strength is computed using the inverse Lagrangian dispersion model aided by concentration measurements made using a particle counter. This is a first approach to calculation with some uncertainties in the model but also in measurements.
A4.1.2 Default emission factors
Table A4.2 PM EFs (EFPM) for agricultural crop operations, in kg ha–1 PM (van der Hoek and Hinz, 2007)
Crop Soil cultivation Harvesting Cleaning DryingWheat 0.25 2.7 0.19 0.56Rye 0.25 2.0 0.16 0.37Barley 0.25 2.3 0.16 0.43Oats 0.25 3.4 0.25 0.66
The measured values are of emissions from the immediate surroundings of the tractors and harvesting machinery in the field.
Further information about PM emissions can be found in Hinz and Funk (2007) and Hinz and Tamoschat-Depolt (2007).
A4.2 Data quality
A4.2.1 CompletenessThe small number of measurements of PM emissions from agricultural activities is a considerable weakness.
EMEP/EEA air pollutant emission inventory guidebook 2016 – Update Nov. 2016 38

3.D Crop production and agricultural soils
Annex 5 Summary of updatesTable A5.1 Summary of updates to calculation methodologies and EFs made
during the 2016 revision of this chapterEmission Tier 1 Tier 2
Methodology EFs Methodology EFsNH3 Updated Updated Updated UpdatedNO Updated Not updated Updated UpdatedNMVOC Not updated not updated NC NCPM Not updated Not updated Not updated Not updatedNC, not calculable.
Annex referencesAnastasi, C., Hopkinson, L. and Simpson, V. J., 1991, ‘Natural Hydrocarbon emissions in the United Kingdom’, Atmospheric Environment, (25) 1403–1408.
Batel, W., 1976, ‘Staubemission, Staubimmission und Staubbekämpfung beim Mähdrescher. Grundl.’, Landtechnik Bd, (26) 205– 248.
Bouwman, A. F., Boumans, L. J. M. and Batjes, N.H., 2002a, ‘Modelling global annual N2O and NO emissions from fertilized fields’, Global Biogeochemical Cycles, (16) 1080.
Bouwman, A. F., Boumans, L. J. M. and Batjes, N. H., 2002b, ‘Estimation of global NH3 volatilization loss from synthetic fertilizers and animal manure applied to arable lands and grasslands’, Global Biogeochemical Cycles, (16) 1024.
Butterbach-Bahl, K., Stange, F., Papen, H. and Li C., 2001, ‘Regional inventory of nitric oxide and nitrous oxide emissions for forest soils of Southeast Germany using the biogeochemical model PnET-N-DNDC’, Journal of Geophysical Research, (106) 34155–34166.
Butterbach-Bahl, K., Kesik, M., Miehle, P., Papen, H. and Li, C., 2004‚ ‘Quantifying the regional source strength of N-trace gases across agricultural and forest ecosystems with process based models’, Plant and Soil, (260) 311–329.
Chadwick, D., Misselbrook, T., Gilhespy, S., Williams, J., Bhogal, A., Sagoo, L., Nicholson, F., Webb, J., Anthony, S. and Chambers, B., 2005, WP1b ammonia emissions and crop N use efficiency, Component report for DEFRA Project NT2605 (CSA 6579), Department for Food, Environment & Rural Affairs.
Chu, H., Hosen, Y. and Yagi, K., 2007, ‘NO, N2O, CH4 and CO2 fluxes in winter barley field of Japanese Andisol as affected by N fertilizer management’, Soil Biology and Biochemistry, (39) 330–339.
Countess Environmental, 2006, WRAP fugitive dust handbook, prepared for the Western Governors’ Association by Countess Environmental, Westlake Village, CA (http://www.wrapair.org/forums/dejf/fdh/content/FDHandbook_Rev_06.pdf).
Davidson, E. A. and Kingerlee, W., 1997, ‘A global inventory of nitric oxide emissions from soils’, Nutrient Cycling in Agroecosystems, (48) 37–50.
EMEP/EEA air pollutant emission inventory guidebook 2016 – Update Nov. 2016 39

3.D Crop production and agricultural soils
Ecetoc, 1994, Ammonia emissions to air in western Europe, Technical Report No 62, European Centre for Ecotoxicology and Toxicology of Chemicals, Brussels (http://www.ecetoc.org/wp-content/uploads/2014/08/ECETOC-TR-062.pdf).
FAO, 2016, Food And Agriculture Organization Of The United Nations Statistics Division http://faostat3.fao.org/home/E
Fenn, L.B., 1988. ‘Effects of initial soil calcium content on ammonia losses from surface-applied urea and calcium-urea’, Fertilizer Research, (16) 207–216.
Fenn, L. B. and Hossner, L. R., 1985, ‘Ammonia volatilization from ammonium or ammonium-forming fertilizers’, Advances in Soil Science, (1) 123–169.
Fleisher, Z., Kenig, A., Ravina, I. and Hagin, J. (1987). ‘Model of ammonia volatilization from calcareous soils’, Plant and Soil, (103) 205–212.
Freibauer, A. and Kaltschmitt, M. (eds), 2000, ‘Emission rates and emission factors of greenhouse gas fluxes in arable and animal agriculture’, Project report Task 1, EU Concerted Action Biogenic emissions of greenhouse gases caused by arable and animal agriculture (FAIR3-CT96-1877), Universität Stuttgart, Institut für Energiewirtschaft und Rationelle Energieanwendung,375 pp.
Génermont, S., 1996, ‘Modélisation de la volatilisation d’ammoniac après épandage de lisier sur parcelle agricole’, Thèse de Doctorat Thesis, Université Paul Sabatier, Toulouse, 331 pp.
Gezgin, S. and Bayrakli, F., 1995, ‘Ammonia volatilization from ammonium sulphate, ammonium nitrate, and urea surface applied to winter wheat on a calcareous soil’, Journal of Plant Nutrition, (18) 2483–2494.
Hall, S. J., Matson, P. A. and Roth, P. M., 1996, ‘NOx emissions from soil: implications for air quality modelling in agricultural regions’, Annual Review of Energy and the Environment, (21) 311–346.
Harrison, R. and Webb, J., 2001, ‘A Review of the effect of N fertilizer form on gaseous N emissions’, Advances in Agronomy, (73) 65–108.
Hayashi, K., Nishimura, S. and Yagi, K., 2006, ‘Ammonia volatilization from the surface of a Japanese paddy field during rice cultivation’, Soil Science and Plant Nutrition, (52) 545–555.
Hayashi, K., Nishimura, S. and Yagi, K., 2008, ‘Ammonia volatilization from a paddy field following applications of urea: Rice plants are both an absorber and an emitter for atmospheric ammonia’, Science of the Total Environment, (390) 486–495.
Hinz, T., 2002, Particulate matter in and from agriculture, Landbauforschung Völkenrode, Special Issue 235, Bundesforschungsanstalt für Landwirtschaft (http://literatur.vti.bund.de/digbib_extern/zi026867.pdf).
Hinz, T. and Funk, R., 2007, ‘Particle emissions of soils induced by agricultural field operations’, in: DustConf 2007: How to improve air quality, International Conference in Maastricht, the Netherlands, 23–24 April 2007 (http://www.umweltbundesamt.at/fileadmin/site/umweltthemen/industrie/pdfs/3rd_announcement_dustconf.pdf ).
Hinz, T. and Tamoschat-Depolt, K. (eds), 2007, ‘Particulate Matter in and from Agriculture’, Landbauforschung Völkenrode, (308).EMEP/EEA air pollutant emission inventory guidebook 2016 – Update Nov. 2016 40
3.D Crop production and agricultural soils
Hobbs, P. J., King, L., Webb, J., Mottram, T. T., Grant, B. and Misselbrook, T. M., 2004, ‘Significant projections of non-methane volatile organic compounds originating from UK agriculture’, Journal of the Science of Food and Agriculture, (84) 1414–1420.
Holtan-Hartwig L. and Bøckman O. C., 1994, ‘Ammonia exchange between crops and air’, Norwegian Journal of Agricultural Science, (Supplement No. 14).
Leip, A. et al., 2011, ‘Integrating nitrogen fluxes at the European scale’, In: Sutton, M.A., Howard, C.M., Erisman, J.W., Billen, G., Bleeker, A., Grennfelt, P., Grinsven, H.v. and Grizzetti, B. (eds), The European Nitrogen Assessment, Cambridge University Press, Cambridge (http://www.nine-esf.org/sites/nine-esf.org/files/ena_doc/ENA_pdfs/ENA_c16.pdf).
Ludwig, J., Meixner, F. X., Vogel, B. and Förstner, J., 2001, ‘Soil–air exchange of nitric oxide: An overview of processes, environmental factors, and modelling studies’, Biogeochemistry (52) 225–257.
Maljanen, M., Martikkala, M., Koponen, H. T. Virkajärvi, P. and Martikainen, P. J., 2007, ‘Fluxes of nitrous oxide and nitric oxide from experimental excreta patches in boreal agricultural soil’, Soil Biology and Biochemistry, (39) 914–920.
Oettl, D., Funk, R. and Sturm, P., 2005, ‘PM emission factors for farming activities’, in: Sturm, P. J. and Minarik, S., Proceedings of the 14th Symposium Transport and Air Pollution, 1–3 June 2005, Technical University Graz, Austria.
Penner, J. E., Atherton, C. S. and Graedel, T. E., 1993, ‘Global emissions and models of photochemically active compounds’, International Global Atmospheric Chemistry (IGAC) project conference, 18–22 April 1993, Eilat, Israel.Rose, C., Parker, A., Jefferson, B. and Cartmell, E., 2015, ‘The characterization of feces and urine: a review of the literature to inform advanced treatment technology’. Critical Reviews in Environmental Science and Technology, (45) 1827–1879.
Rösemann, C., Haenel, H. D, Poddey, E., Dämmgen, U., Döhler, H., Eurich-Menden, B., Laubach, P., Dieterle, M. and Osterburg B., 2011, Calculations of gaseous and particulate emissions from German agriculture 1990–2009, Landbauforschung vTI Agriculture and Forestry Research, Sonderheft 342 (http://literatur.vti.bund.de/digbib_extern/dn048142.pdf).
Simpson, D., Winiwarter, W., Borjesson, B., Cinderby, S., Ferreiro, A., Guenther, A., Hewitt, C. N., Janson, R., Khalil, A. M. K., Owen, S., Pierce, T. E., Puxbaum, H., Shearer, M., Skiba, U., Steinbrecher, R., Tarrasón, L. and Öquist, M. G., 1999, ‘Inventorying emissions from nature in Europe’, Journal of Geophysical Research, (104, D7) 8113–8152.
Skiba, U., Fowler, D. and Smith, K. A., 1997, ‘Nitric oxide emissions from agricultural soils in temperate and tropical climates: Sources, controls and mitigation options’, Nutrient Cycling in Agroecosystems, (48) 75–90.
Slemr, F. and Seiler, W., 1984, ‘Field measurements of NO and NO2 emissions from fertilized and unfertilized soils’, Journal of Atmospheric Chemistry, (2) 1–24.
Sommer, S. G. and Jensen, C., 1994, ‘Ammonia volatilization from urea and ammoniacal fertilizers surface applied to winter wheat and grassland’, Fertilizer Research, (37) 85–92.
Sommer, S. G., Schjørring, J. K. and Denmead, O.T., 2004, ‘Ammonia Emission from mineral fertilizers and fertilized crops’, Advances in Agronomy, (82) 557–662.
EMEP/EEA air pollutant emission inventory guidebook 2016 – Update Nov. 2016 41

3.D Crop production and agricultural soils
Stohl, A., Williams, E., Wotawa, G. and Kronup-Kolb, H., 1996, ‘A European Inventory of soil nitric oxide emissions and the effect of these emissions on the photochemical formation of ozone’, Atmospheric Environment, (30) 3741–3755.
Takai, H., Pedersen, S., Johnsen, J. O., Metz, J. H. M., Groot Koerkamp, P. W. G., Uenk, G. H., Phillips, V. R., Holden, M. R., Sneath, R. W., Short, J. L., White, R. P., Hartung, J., Seedorf, J., Schröder, M., Linkert, K. H. and Wathes, C. M., 1998, ‘Concentrations and emissions of airborne dust in livestock buildings in northern Europe’, Journal of Agricultural Engineering Research, (70) 59–77.
Van der Weerden, T. J. and Jarvis, S. C., 1997, Ammonia emission factors for N fertilizers applied to two contrasting grassland soils. Environmental Pollution, (95) 205–211.
Wathes, C. M., Phillips, V. R., Sneath, R. W., Brush, S. and ApSimon, H. M., 2002, ‘Atmospheric emissions of particulates (PM10) from agriculture in the United Kingdom’, 2002 ASAE Annual Meeting, Paper number 024217 (http://elibrary.asabe.org/abstract.asp?aid=10582&redir=[confid=cil2002]&redirType=techpapers.asp&dabs=Y), 26 September 2016.
Whitehead, D. C. and Raistrick, N., 1990, ‘Ammonia volatilization from five nitrogen compounds used as fertilizers following surface application to soils’, Journal of Soil Science, (41) 387–394.
Whitehead, D. C. and Raistrick, N., 1993, ‘The volatilization of ammonia from cattle urine applied to soils as influenced by soil properties’, Plant and Soil, (148) 43–51.
Winer, A. M., Arey, J., Atkinson, R., Aschmann, S. M., Long, W. D., Morrison, C. L. and Olszyk, D. M., 1992, ‘Emission rates of organics from vegetation in California’s central valley’, Atmospheric Environment, (26) 2647–2659.
Yan, X., Akimoto, H. and Ohara, T.,2003, ‘Estimation of nitrous oxide, nitric oxide and ammonia emissions from croplands in East, Southeast and South Asia’, Global Change Biology, (9) 1080–1096.
Yienger, J. J. and Levy, H., 1995, ‘Empirical model of the global soil-biogenic NOx emissions’, Journal of Geophysical Research, (100) 11447–11464.
EMEP/EEA air pollutant emission inventory guidebook 2016 – Update Nov. 2016 42