overview...overview risk and safe-haven assets broadly rose in july as investors weighed mixed...
TRANSCRIPT

Monthly Market CommentaryJuly 2020
DoubleLine Capital || 333 S. Grand Ave., 18th Floor || Los Angeles, CA 90071 || (213) 633-8200 || doubleline.com
10YEARS
2009 - 2019
DOUBLELIN
E
Outlined version (no font)
Outlined version (no font) All Gray
OverviewRisk and safe-haven assets broadly rose in July as investors weighed mixed economic data and quarterly corporate earnings results. The U.S. Treasury curve flattened as yields fell across tenors, led by a decline of 22 basis points (bps) on the yield of the 30-year bond. High yield (HY) corporate bonds returned 4.69%, as measured by the Bloomberg Barclays US Corporate High Yield Index, erasing their negative return for the year. U.S. equities rose as the S&P 500 Index returned 5.64%. (Figure 1)
The spot price of gold rallied to a record high, closing the month at $1,975.86 per ounce. Continued growth in COVID-19 cases and deaths in the U.S. clouded the economic outlook. According to figures from the Centers for Disease Control and Prevention, the U.S. set a record for new case growth per day at nearly 75,000, and the geographic impact of the pandemic is now more widespread than the initial outbreak in March, which was concentrated heavily in the Northeastern states.1 Investors were particularly focused in July on the ramifications of the potential expiration at the end of the month of the $600-per-week federal unemployment benefit, originally passed by Congress in March as part of the Coronavirus Aid, Relief, and Economic Security (CARES) Act. Whether the benefit should be extended and at what scale emerged as key sticking points in Congress as legislators tangled over fiscal stimulus measures. The benefit did expire.
1 CDC COVID Data Tracker. Trends in Number of COVID-19 Cases in the U.S. Reported to CDC by State/Territory. Centers for Disease Control and Prevention (CDC).
5.6%
4.5%
3.3%
-0.8
%
9.0%
1.5%
1.1%
0.2%
3.3% 4.
7%
2.0% 3.
8%
-4.2
%
5.7%
2.4%
-6.7
%
-9.0
%
-4.5
% -1.5
%
7.7% 10
.0%
3.7%
8.4%
0.7%
-2.7
%
1.7%
-3.2
%
-14.
8%
-20%
-15%
-10%
-5%
0%
5%
10%
15%
20%July 2020 Year-to-Date
Figure 1Source: Bloomberg
July 2020 and Year-to-Date Performance of Asset Classes | Denominated in U.S. dollar

Monthly Market CommentaryJuly 2020
2
U.S. second quarter gross domestic product (GDP) contracted by 32.9% quarter-over-quarter (QoQ) annualized, according to the advanced estimate released by the Bureau of Economic Analysis. If the estimate holds, it will have been the worst quarter going back to 1947. (Figure 3) The largest driver of the economic contraction was personal consumption, which declined 34.6% QoQ annualized. The declines in personal consumption and GDP were more than three times the previous worst contractions going back to 1946. Personal consumption of services declined 43.5% in the second quarter while gross private investment declined 49.0% QoQ annualized, the largest contraction since the record set in 1975.
Overview (cont'd)
The extent to which unemployment benefits are extended is meaningful as millions of American workers remain displaced. In the week ended July 25, seasonally adjusted initial jobless claims were 1,434,000, an increase of 12,000 from the previous week’s revised level; initial claims for Pandemic Unemployment Assistance (PUA) were 830,000. Seasonally adjusted continuing claims during the week ended July 18 were over 17 million, an increase of 867,000 from the previous week’s revised level. This was the first uptick in continuing claims since the week of May 22. (Figure 2) The unemployment rate implied by continuing claims was 11.6% for the week ended July 18.
United States Unemployment Data | July 24, 2020
0
5,000
10,000
15,000
20,000
25,000
30,000
35,000
0
1,000
2,000
3,000
4,000
5,000
6,000
7,000
8,000
Thou
sand
s
Thou
sand
s
US Initial Jobless Claims Pandemic UnemploymentAssistance (PUA) - on 7/24/20 (LHS)
US Initial Jobless Claims SA (LHS)
US Continuing Jobless Claims SA (RHS)
Persons Claiming Unemployment InsuranceBenefits Total - on 7/10/20 (RHS)
Figure 2Source: Bloomberg, DoubleLine
U.S. Annualized Gross Domestic Product | June 30, 2020
-35-30-25-20-15-10
-505
101520
U.S. GDP QoQ Annualized U.S. GDP YoY Annualized
Figure 2Source: Bloomberg, DoubleLine

Monthly Market CommentaryJuly 2020
3
Overview (cont'd)
Against the backdrop of a 10.3% U-3 unemployment rate for July and the worst annualized QoQ GDP print since 1947, the Federal Reserve decided to keep the Fed Funds Target Rate unchanged at the July Federal Open Market Committee (FOMC) meeting. Fed Chairman Jerome Powell announced that the committee expects to maintain this target “until (the FOMC) is confident that the economy has weathered recent events and is on track to achieve its maximum employment and price stability goals.” As several economic data points have improved, the committee cautioned that the ongoing health crisis “poses considerable risks to the economic outlook over the medium term.”2
As measured by the U.S. Dollar Index (DXY), the dollar weakened against the currencies of its G10 peers and had its worst month on a percentage basis since September 2010. The dollar sell-off took place amid growing skepticism of the U.S. economic recovery, uncertainty over fiscal support from Congress and rising U.S. COVID-19 infection rates. The dollar weakened significantly versus the currencies of other developed markets (DM), particularly euro and euro-linked countries. European leaders agreed in July to a 750 billion euro recovery package of grants and low-interest loans that will be backed by common bond issuance by the European Commission. This positive news, combined with some European countries reopening due to improved COVID-19 markers, which helped economic activity improve in Europe versus the United States, provided catalysts for DM currencies to rally against the dollar.
At DoubleLine, we remain vigilant in monitoring the upcoming economic data releases and the possible ramifications of continuing unemployment.
2 Federal Reserve Chairman Jerome Powell, July 29, 2020, press conference.

Monthly Market CommentaryJuly 2020
4
U.S. Government SecuritiesThe Treasury market had generally been calm since the upheaval in March, but the asset class was extraordinarily placid in July. While trading volume was typical, price volatility was unusually low. The intraday range on the 10-year Treasury yield was a modest 19 basis points (bps). The range of closing yields around the downward sloping trend line was just 8 bps, and the ICE Bank of America (BofA) MOVE Index a measure of implied volatility – fell to an all-time low of 41 at the end of the month. Yields generally trended lower through July, with more-pronounced drops at longer maturities as a resurgent COVID-19 and increasing tension with China weighed on Treasury investors’ outlook. The Bloomberg Barclays US Treasury Index returned 1.14%, bringing the year-to-date (YTD) return to 9.96%.
The Federal Reserve’s Federal Open Market Committee (FOMC) convened and adjourned in late July with no new policy actions, which was in line with expectations. The tone was dovish in the face of rising COVID-19 cases and an acknowledged slowdown in high-frequency economic data. Many thought the Fed would introduce some form of forward guidance to reinforce its accommodative stance, but Chairman Jerome Powell remained patient, even while professing to be prepared to take further action as needed.
Real yields fell more sharply than nominal yields in July, and implied inflation expectations ratcheted higher. The yield on 10-year Treasury inflation-protected securities (TIPS) fell 32 bps, from -71 bps on June 30 to an all-time low of -103 bps on July 31. The 10-year breakeven inflation rate rose in July to a post-COVID-19 high of 155 bps, aided by, among other factors, the ongoing recovery in oil prices. The Bloomberg Barclays US TIPS Index returned 2.30%, and the YTD return rose to 8.44%.
In August, we expect a deceleration in the recent yield declines and a deceleration in the rise in implied inflation rates. Two-year yields have little room to move lower as they were barely above the overnight repo rate as of this writing, and there is little prospect of the Fed moving policy rates negative. The expectation that the Fed will keep the Fed Funds Rate near zero for an extended period has brought the five-year yield to near a practical minimum as well. We expect the recent 50 bps-80 bps range on the 10-year Treasury yield to hold through August.
U.S. Treasury Yield Curve
6/30/2020 7/31/2020 Change3 month 0.13% 0.08% -0.05%6 month 0.13% 0.09% -0.04%1 year 0.15% 0.11% -0.04%2 year 0.15% 0.11% -0.04%3 year 0.17% 0.11% -0.06%5 year 0.29% 0.20% -0.09%10 year 0.66% 0.53% -0.13%30 year 1.41% 1.19% -0.22%
Source: Bloomberg
Agency Mortgage-Backed SecuritiesJuly prepayment speeds showed little change over the month, with 30-year Fannie Mae prepays increasing to 31.2 Constant Prepayment Rate (CPR) from 30.8 CPR. In addition, 30-year Freddie Mac prepays decreased to 31.8 CPR from 32.0 CPR, and 30-year Ginnie Mae II prepays decreased to 35.8 CPR from 37.2 CPR.
The Freddie Mac US Mortgage Market Survey 30 Year Homeowner Commitment National Index decreased 14 basis points (bps) from June and set a historic low of 2.98% the week of July 16. Despite new rate lows continuing to be set for new mortgages in July, higher coupons were starting to show early signs of burnout. Relatively unchanged conventional speeds were positive in the context of rising turnover due to a rebound in home sales in the wake of COVID-19 shutdowns. While Ginnie Mae issuers continued to buy out loans that were delinquent 90 days or longer, involuntarily prepays decreased compared to June’s sharp spike.
In July, monthly gross issuance of Agency mortgage-backed securities (MBS) reached $297 billion, the highest level in 2020, and net issuance increased to $47 billion. Out of that sum, $21 billion was Fannie Mae, $38 billion was Freddie Mac and -$12 billion was Ginnie Mae. The Federal Reserve made $105 billion in gross purchases of Agency MBS, bringing the total gross to $892 billion in what is considered the fourth round of quantitative easing.
Aggregate 30-day delinquency rates decreased for a consecutive month, from 5.6% to 4.9% for 30-year Freddie loans and 5.8% to 5.6% for 30-year Fannie Mae loans. The share of borrowers who missed one payment declined from 3.7% in May to 0.9% in July as most borrowers who were hit by the COVID-19 shock have moved through the stages of delinquency. However, rates on 30-day delinquencies remained slightly higher in July than the pre-COVID-19 average of 0.7%.

Monthly Market CommentaryJuly 2020
5
0.00
1.00
2.00
3.00
4.00
5.00
6.00
7.00
120.00
170.00
220.00
270.00
320.00
370.00
0
1,000
2,000
3,000
4,000
5,000
6,000
7,000
2.50
3.00
3.50
4.00
4.50
5.00
5.50
Source: eMBS, Barclays Capital. FHLMC Commitment Rate Source: Bloomberg
Agency Mortgage-Backed Securities (cont'd)
In July, the Bloomberg Barclays US MBS Index duration contracted from 2.07 to 1.68. The index’s total return for the month was 0.18% with an excess return of -0.02%, measured relative to maturity-matched U.S. Treasuries.
Duration of Barclays U.S. MBS Bond Index | As of July 31, 2020
MBA U.S. Refinancing Index | As of July 31, 2020
Source: Bloomberg. Base = 100 on 3/16/1990. Seasonally Adjusted.
7/31/20 3,688.1
MBA Purchase Index | As of July 31, 2020
7/31/20 300.7
Source: Bloomberg. Base = 100 on 1/14/2011. Seasonally Adjusted
Source: Bloomberg. Base = 100 on 1/14/2011. Seasonally Adjusted
7/31/20 1.7
Freddie Mac Commitment Rate - 30 Year | As of July 30, 2020
7/30/20 3.0
Source: Bloomberg, DoubleLine
% Years
Conditional Prepayment Rates (CPR)2019-2020 August September October November December January February March April May June July
Fannie Mae (FNMA) 16.8 18.4 20.2 16.5 16.5 14.5 16.1 22.3 28.0 27.5 30.8 31.2Ginnie Mae (GNMA) 22.3 22.8 24.4 22 22.9 21.3 21.3 24.5 26.2 27.0 37.2 35.8Freddie Mac (FHLMC) 17.2 19.1 20.6 16.7 16.6 14.6 16.4 23.0 28.8 28.8 32.0 31.8
Bloomberg Barclays U.S. MBS Index 5/31/2020 6/30/2020 7/31/2020 ChangeAverage Dollar Price 106.93 106.67 106.77 0.10Duration 2.15 2.07 1.68 -0.39
Bloomberg Barclays U.S. Index Returns 5/31/2020 6/30/2020 7/31/2020Aggregate 0.47% 0.63% 1.49%MBS 0.12% -0.09% 0.18%Corporate 1.56% 1.96% 3.25%Treasury -0.25% 0.09% 1.14%

Monthly Market CommentaryJuly 2020
6
Non-Agency Residential Mortgage-Backed SecuritiesNon-Agency residential mortgage-backed securities (RMBS) delivered positive returns in July, continuing the gains marked in June. Credit spreads tightened in July as the U.S. economy continued down a path toward recovery as employment opportunities returned and business sentiment improved. Despite this progress, credit spreads still remained wider than their pre-COVID-19 levels. Forbearance rates were 8.2% for private-label mortgages as of July 28.2
During the month, there were $7 billion in issuance, mainly originating from reperforming loans, non-qualified mortages (non-QM) and Jumbo Prime.3 Due to the closure of the new-issue market, non-Agency RMBS net issuance has been negative for 2020. The current pace of cumulative year-to-date (YTD) issuance is on par with the same period in 2018. Total gross issuance for 2020 is estimated to reach $85 billion.
The most-recent reading of home prices (for the month of May) showed an increase of 3.70% year-over-year (YoY), decreasing 20 basis points (bps) month-over-month (MoM).4 The housing market has been resilient despite the pandemic lockdown and market volatility. The pandemic has affected renters more negatively than homeowners as renters are more likely to hold lower-income jobs in the COVID-19-slammed hospitality and retail sectors. Existing home sales marked a strong 20.7% rebound in June MoM, though they were down 11.3% YoY.5 Housing inventory fell to 4.0 months’ supply in June compared to 4.8 months’ in May.
The 30-year mortgage rate finished July at 2.99%, down 14 bps MoM.6 Mortgage rates fell despite the growth in home purchase applications and decrease in inventory.7
Commercial Mortgage-Backed SecuritiesPrivate-label commercial mortgage-backed securities (CMBS) continued to mark new issuance in July with two conduit deals totaling $1.63 billion and three single asset, single borrower (SASB) deals totaling $1.49 billion pricing throughout the month. While post-COVID-19-originated loans have started to populate conduit deals, the market priced its first post-COVID-19-originated SASB deal in July. Demand for new-issue paper continued to outpace supply, leading to most deals being well oversubscribed across the capital stack. The outstanding private-label CMBS universe decreased slightly by 0.05% to $581.4 billion, approximately 9.3% higher year-over-year (YoY).
Legislation to boost the commercial real estate (CRE) market was introduced in July with the bipartisan bill Helping Open Properties Endeavor (HOPE) Act. The HOPE Act aims to help distressed CRE/CMBS borrowers by providing government guarantees for banks to take preferred-equity stakes in exchange for cash infusions,
enabling borrowers to cover up to a year of debt service and other expenses. While analysts saw little likelihood that the act would be included in stimulus measures being debated at the beginning of August, congressional leaders, including Sen. Mike Crapo, R-Idaho, appealed to Treasury Secretary Steven Mnuchin and Federal Reserve Chairman Jerome Powell to launch CRE and asset-based lending programs.
CRE price growth continued to feel the effects of the pandemic in July, with the RCA U.S. All-Property Commercial Property Price Index (CPPI) remaining flat month-over-month (MoM), resulting in a YoY gain of just 3.6%, the smallest rate of annual growth since 2011. Retail price growth struggled the most, falling 0.3% MoM and 0.7% YoY, the first annual decline for a CRE sector in nearly a decade. While industrial price growth continued as the top performer, gaining 7.6% over the past year, the pace has been slowing since the middle of 2019, when prices were growing around 12% annually. CRE transaction volume plunged 68% YoY to $44 billion in the second quarter of 2020, the largest decline since the second quarter of 2009. Retail transaction volume fell 72% in the second quarter of 2020, the worst YoY change on record, and hotel transactions fell 91% to a record low of 71 deals. While the industrial sector fared better than others, transaction volume still fell 50% in the quarter.
CMBS delinquencies stabilized somewhat in July, with the rate of loan delinquencies 30 days or longer declining slightly to 8.5%. However, the rate of loan delinquencies 90 days or longer and the special servicing rate increased. The improvement can be attributed to borrowers being granted COVID-19-related relief, which is expected to continue over the coming months. The six-month COVID-19 relief typically granted will expire by October so it remains to be seen how delinquencies will perform in the fourth quarter.
CMBS secondary market cash spreads continued to grind tighter in July, resulting in a flattening across the capital stack as demand outpaced both new-issue and secondary supply. AAA last cash flows (LCFs) tightened by 13 basis points (bps) to swaps +97 bps, having retraced approximately 90% of their widening since the March sell-off, while BBB- LCFs tightened by 160 bps to swaps +575 bps. There was limited secondary conduit mezzanine supply relative to significant secondary volumes in March through May. Given the rebound in prices, coupled with limited supply and slowing trading volumes, SASB paper for industry sectors less impacted by COVID-19 was trading close to or above par in July, while SASB deals become range bound in the more-impacted hotel and retail sectors.2 Black Knight3 Bloomberg4 S&P Corelogic Case-Shiller 20-City Home Price Composite 5 National Association of Realtors Existing Home Sale Index6 Freddie Mac Primary Mortgage Market Survey7 Mortgage Bankers Association

Monthly Market CommentaryJuly 2020
7
0
50
100
150
200
250
300
350
400
Billi
ons o
f U.S
. Dol
lars
-14.0%
-12.0%
-10.0%
-8.0%
-6.0%
-4.0%
-2.0%
0.0%
2.0%
4.0%
6.0%
U.S. High YieldU.S. CreditU.S. Aggregate
Commercial Mortgage-Backed Securities (cont'd)
The CMBX market moved tighter at the top of the stack as the return of new-issue conduit brought back originators while the bottom of the stack remained tiered by vintage and credit. Overall, 2012-2018 AAA reference indices tightened by 7 bps while 2012-2018 BBB- reference indices widened by 2 bps.
Asset-Backed SecuritiesAsset-backed securities (ABS) continued to build momentum in July, delivering their fourth consecutive month of positive returns and marking healthy transaction volumes in the primary and secondary markets.
The most-liquid segments of ABS, as measured by the Bloomberg Barclays US ABS Index, returned 0.42% while esoteric ABS, as measured by the ICE Bank of America (BofA) U.S. Fixed-Rate Miscellaneous Asset-Backed Securities (ABS) Index, returned 0.86%. For the latter index, generic spreads over U.S. Treasuries rallied steadily throughout the month, falling 17 basis points (bps) to 283 bps. The decline was mostly driven by credit curves flattening as bids improved for the lower-rated tranches of ABS debt, which have generally lagged the rallies seen in their investment grade (IG) counterparts.
The only missing ingredient for ABS performance was duration, as longer-duration sectors such as IG corporate bonds and Treasuries outperformed due to the rally in long-end rates. In terms of new-issue activity, 33 transactions priced for a total of $22 billion. While July marked the highest month of issuance in the 2020 calendar year, gross ABS issuance was still about 25% lower year-over-year (YoY).
Investment Grade CreditU.S. investment grade (IG) credit continued to rally in July on better than expected corporate earnings. In addition, the Federal Reserve’s support for credit markets through special lending facility programs, which at the end of July were extended by three months through the end of the year, is boosting investors’ confidence, creating robust demand for corporate credit. IG credit spreads as measured by the Bloomberg Barclays US Credit Index tightened by 16 basis points (bps) to 126 bp for the month, outperforming duration-matched U.S. Treasuries by 167 bp. The total return was 3.08%, bringing the year-to-date (YTD) total return to 8.05%. In addition, yields on IG credit fell to an all-time low of 1.78%.
Cyclical and commodity-exposed sectors outperformed. The best-performing sectors on a total return basis were independent energy, utility (other), natural gas, railroads and transportation (other). The worst-performing sectors were leisure, finance (other), supranationals, foreign agency and gaming.
At the ratings level, loans rated BBB outperformed, posting a total return of 3.52% versus 3.07% for loans rated A and 2.65% for loans rated AA.
Across the curve, long duration credit notably outperformed, posting a total return of 6.09% versus 1.39% for intermediate duration credit and 0.39% for short duration credit. The outperformance in long duration credit was partially driven by the rally in the long end of the Treasuries market.
Dollar-denominated IG new issuance was subdued, with $94.2 billion of gross issuance and $14.8 billion of net issuance. YTD, gross new issuance stands at $1,470 billion, surpassing the full-year record of $1,468 billion set in 2017.
IG funds’ inflows were $42.5 billion, extending cumulative inflows to $194 billion since March.
Performance of Select Barclays Indices Last 12 Months
Total Fixed-Rate Investment Grade Supply As of July 31, 2020
Source: Barclays Live
Monthly Market CommentaryJuly 2020
8
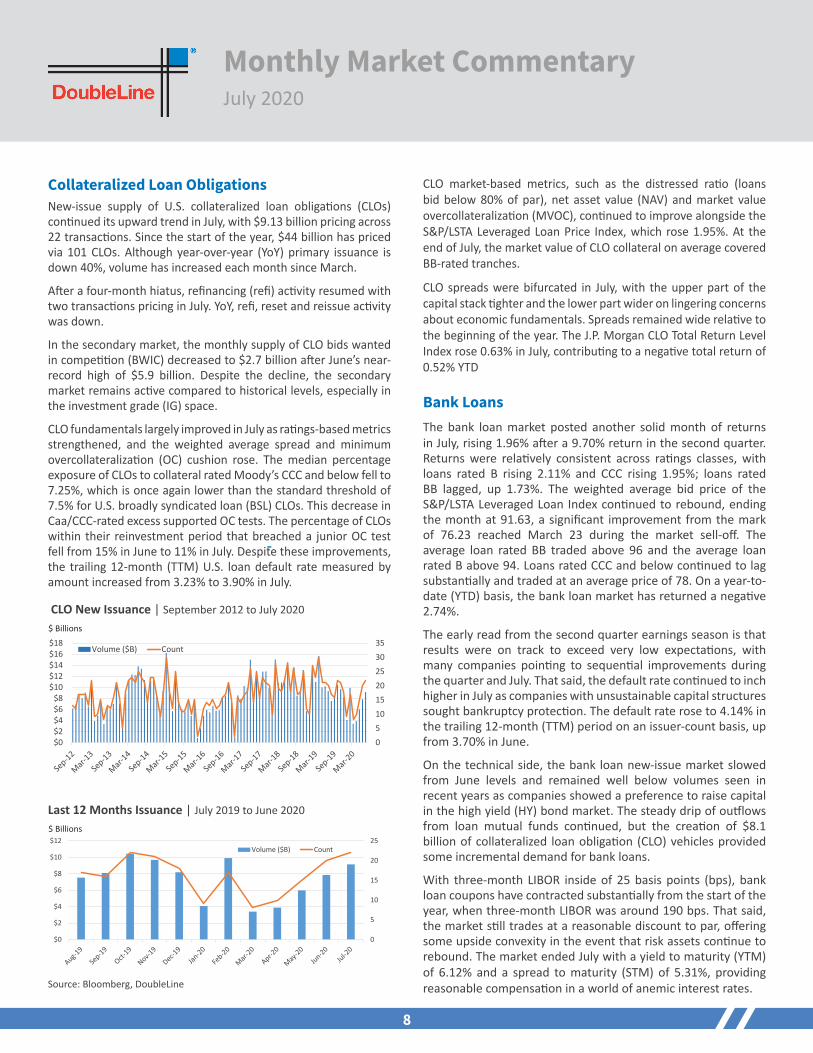
CLO New Issuance | September 2012 to July 2020
Last 12 Months Issuance | July 2019 to June 2020
Source: Bloomberg, DoubleLine
$ Billions
Collateralized Loan ObligationsNew-issue supply of U.S. collateralized loan obligations (CLOs) continued its upward trend in July, with $9.13 billion pricing across 22 transactions. Since the start of the year, $44 billion has priced via 101 CLOs. Although year-over-year (YoY) primary issuance is down 40%, volume has increased each month since March.
After a four-month hiatus, refinancing (refi) activity resumed with two transactions pricing in July. YoY, refi, reset and reissue activity was down.
In the secondary market, the monthly supply of CLO bids wanted in competition (BWIC) decreased to $2.7 billion after June’s near-record high of $5.9 billion. Despite the decline, the secondary market remains active compared to historical levels, especially in the investment grade (IG) space.
CLO fundamentals largely improved in July as ratings-based metrics strengthened, and the weighted average spread and minimum overcollateralization (OC) cushion rose. The median percentage exposure of CLOs to collateral rated Moody’s CCC and below fell to 7.25%, which is once again lower than the standard threshold of 7.5% for U.S. broadly syndicated loan (BSL) CLOs. This decrease in Caa/CCC-rated excess supported OC tests. The percentage of CLOs within their reinvestment period that breached a junior OC test fell from 15% in June to 11% in July. Despite these improvements, the trailing 12-month (TTM) U.S. loan default rate measured by amount increased from 3.23% to 3.90% in July.
CLO market-based metrics, such as the distressed ratio (loans bid below 80% of par), net asset value (NAV) and market value overcollateralization (MVOC), continued to improve alongside the S&P/LSTA Leveraged Loan Price Index, which rose 1.95%. At the end of July, the market value of CLO collateral on average covered BB-rated tranches.
CLO spreads were bifurcated in July, with the upper part of the capital stack tighter and the lower part wider on lingering concerns about economic fundamentals. Spreads remained wide relative to the beginning of the year. The J.P. Morgan CLO Total Return Level Index rose 0.63% in July, contributing to a negative total return of 0.52% YTD
Bank LoansThe bank loan market posted another solid month of returns in July, rising 1.96% after a 9.70% return in the second quarter. Returns were relatively consistent across ratings classes, with loans rated B rising 2.11% and CCC rising 1.95%; loans rated BB lagged, up 1.73%. The weighted average bid price of the S&P/LSTA Leveraged Loan Index continued to rebound, ending the month at 91.63, a significant improvement from the mark of 76.23 reached March 23 during the market sell-off. The average loan rated BB traded above 96 and the average loan rated B above 94. Loans rated CCC and below continued to lag substantially and traded at an average price of 78. On a year-to-date (YTD) basis, the bank loan market has returned a negative 2.74%.
The early read from the second quarter earnings season is that results were on track to exceed very low expectations, with many companies pointing to sequential improvements during the quarter and July. That said, the default rate continued to inch higher in July as companies with unsustainable capital structures sought bankruptcy protection. The default rate rose to 4.14% in the trailing 12-month (TTM) period on an issuer-count basis, up from 3.70% in June.
On the technical side, the bank loan new-issue market slowed from June levels and remained well below volumes seen in recent years as companies showed a preference to raise capital in the high yield (HY) bond market. The steady drip of outflows from loan mutual funds continued, but the creation of $8.1 billion of collateralized loan obligation (CLO) vehicles provided some incremental demand for bank loans.
With three-month LIBOR inside of 25 basis points (bps), bank loan coupons have contracted substantially from the start of the year, when three-month LIBOR was around 190 bps. That said, the market still trades at a reasonable discount to par, offering some upside convexity in the event that risk assets continue to rebound. The market ended July with a yield to maturity (YTM) of 6.12% and a spread to maturity (STM) of 5.31%, providing reasonable compensation in a world of anemic interest rates.
$ Billions
05101520253035
$0$2$4$6$8
$10$12$14$16$18
Volume ($B) Count
0
5
10
15
20
25
$0
$2
$4
$6
$8
$10
$12Volume ($B) Count

Monthly Market CommentaryJuly 2020
9
High Yield8
High yield (HY) returns were very strong in July, with the Bloomberg Barclays US Corporate HY Index returning 4.69%. Index yield fell 150 basis points (bps) to 5.37% while spreads tightened 138 bps to 488 bps. Investors reacted positively to headlines about potential COVID-19 vaccines amid a market backdrop of surging inflows, record issuance and continued historically low U.S. Treasury yields.
By rating, loans rated BB outperformed modestly, increasing 4.88%. Loans rated CCC closely followed, rising 4.76%, and loans rated B lagged with a gain of 4.50%. All sectors were up for the month, with the three best-performing being aerospace/defense (+9.53%), independent energy (+8.02%) and automotive (+6.02%). The worst sectors were oil field services (+0.32%), airlines (+0.66%) and refining (+2.40%).
The par-weighted 12-month default rate ended July at a 10-year high of 6.22%, up 4 bps points from June and 359 bps from 2.63% at the end of 2019. For reference, the current default rate compares to 10.3% in 2009 and a 25-year average of 2.90%. The energy sector in July continued to account for a substantial portion of defaults; it has represented 44% of the par-weighted total over the last 12 months for a sector rate of 19.70%.
Downgrades by volume continued to outweigh upgrades in the U.S. HY market in July, though by a much smaller margin than in June. In July, $37.7 billion of downgrades were registered compared to $31.5 billion of upgrades for a trailing 12-month (TTM) upgrade-to-downgrade ratio of 0.4x. On a year-to-date (YTD) basis, downgrades total $657.2 billion compared to $152.7 billion of upgrades. Recall, the upgrade-to-downgrade ratio ended 2019 at 0.8x, 2018 at 1.3x and 2017 at 1.4x. As for fallen angel volume, June was more muted than recent months, with a total of $7.1 billion, bringing the YTD mark to $204.2 billion, already exceeding the prior full-year record of $150.2 billion set in 2009.
Primary activity experienced seasonal moderation in July but remained very strong, with HY pricing $26.7 billion of deals after achieving an all-time monthly record in June ($61.5 billion). YTD, issuance is up 48% to $245.1 billion while net issuance of refinancings is up a remarkable 80% to $101.4 billion. Recall, primary activity for 2019 increased 52% (+28% net issuance of refinancings), though that came against a 2018 whose full-year activity was the lightest since 2009 (2018’s volume of $187 billion was a 43% decline compared to 2017’s).
HY funds took in $6.1 billion in July, following the fourth-largest inflow month on record in June ($9.7 billion), the largest in May ($20.5 billion) and second largest in April ($17.1 billion). YTD, inflows stand at $34.7 billion, compared to an inflow of $18.8 billion in full-year 2019 and an outflow of $46.9 billion in full-year 2018.
CommoditiesIn July, the broad commodity market rallied by 3.78% as measured by the S&P GSCI and 5.70% by the Bloomberg Commodity (BCOM) Index. Precious metals (+10.30%) appreciated strongly as gold (+8.54%) and silver (+29.94%) rallied in the wake of global monetary and fiscal stimulus packages. Industrial metals (+6.73%) also rallied, with the best performer, zinc, up 13.14% and the economic bellwether copper up 6.68%. The energy sector increased 2.62%, with the best performer, Brent crude, up 4.93% while the weakest, unleaded gasoline, declined 0.77%. The agriculture sector increased 1.37%, with the best performer, coffee, up 17.77% while the worst, corn, declined 7.47%.
Emerging Markets Fixed IncomeEmerging markets (EM) sovereign and corporate external bonds posted positive performances in July, continuing their strong positive performances from the second quarter. The positive performance of external EM debt was driven primarily by credit spread tightening, with lower U.S. Treasury yields and accrued interest also contributing.
The J.P. Morgan Emerging Markets Bond Index (EMBI) Global Diversified credit spread tightened by 34 basis points (bps) over the month. The Treasury yield curve tightened, with two-year Treasury yields lower by 4 bps and 10-year Treasury yields lower by 13 bps.
Performance across all regions was positive in both the sovereign index and corporate index for the month, as measured by the J.P. Morgan EMBI Global Diversified and J.P. Morgan Corporate Emerging Markets Bond Index (CEMBI) Global Diversified indices. Latin America was the best-performing region in both the sovereign and corporate indices. The positive return in Europe was the least relative to the other regions in both indices.
8 Index data from Barclays. Default, new issue and fallen angel data from J.P. Morgan. Flows data are Lipper as reported by J.P. Morgan.

Monthly Market CommentaryJuly 2020
10
Emerging Markets Fixed Income (cont'd)
The sovereign index outperformed the corporate index over the period as sovereigns significantly outperformed their corporate counterparts in Latin America, Asia and the Middle East. The outperformance was in part driven by the higher allocation to Latin America in the sovereign index relative to the corporate index and the sovereign index’s longer duration relative to the corporate index in a period where rates fell. The investment grade (IG) subindex outperformed the high yield (HY) subindex in the sovereign index, while the IG subindex slightly underperformed the HY subindex in the corporate index.
Risk appetite for the second half of 2020 will largely be driven by the effectiveness of measures to contain the COVID-19 outbreak and reopen economies. The pandemic will continue to impact the global growth trajectory and influence fiscal and monetary policy responses from developed markets (DM) and EM central banks and governments. Other risk-appetite factors include escalating U.S.-China tensions, rising social unrest and the U.S. presidential election in November.
International SovereignGlobal government bonds, as measured by the FTSE World Government Bond Index (WGBI), posted positive returns in July. The positive performance was driven largely by foreign currency appreciation against the U.S. dollar, but a global rates rally also contributed.
As measured by the U.S. Dollar Index (DXY), the dollar weakened against all of its G10 peers and had its worst month on a percentage return basis since September 2010. The dollar sell-off took place against a backdrop of growing skepticism over the U.S. economic recovery, uncertainty over fiscal support from Congress and worsening COVID-19 infection rates. The Federal Reserve left rates unchanged at near zero. The Fed pledged to maintain this target “until it is confident that the economy has weathered recent events and is on track to achieve its maximum employment and price stability goals.” In addition, dollar liquidity swap lines and repo operations were extended through March 2021, but it is worth noting that the outstanding amount of dollars borrowed via these facilities continued to drop over the month as normalcy returned to global currency markets. Congress failed to pass a new fiscal relief package before federal jobless benefits expired at the end of July. U.S. Treasury rates, as measured by the 10-year Treasury yield, moved lower during the month.
The euro had its best month on a percentage return basis versus the dollar since September 2010. Risk sentiment improved as economic data recovered and European leaders agreed to a fiscal support program. Euro-area purchasing managers’ indices (PMIs) rebounded and indicated pickup in economic activity in July from a gross domestic product (GDP) contraction of -12.1% in the second quarter as European countries eased their COVID-19 lockdowns. Meanwhile, European leaders overcame internal disagreements and agreed to a 750 billion euro recovery package. The package of grants and low-interest loans will be backed by common bond issuance by the European Commission. The European Central Bank (ECB) kept the deposit rate at -0.5% and left its bond purchase program unchanged.
The Japanese yen strengthened versus the dollar. The Bank of Japan (BoJ) maintained its monetary policy stance, pledged to cap 10-year government bond yields at around zero and kept its asset purchase program unchanged. The BoJ lowered forecasts for economic growth and issued warnings of downside risk to economic activity and prices amid the uncertain outlook amid the pandemic. Tokyo and other urban areas experienced a surge in COVID-19 infections through most of the month.
Emerging markets (EM) currencies generally appreciated versus the dollar in July but lagged other developed markets (DM) currencies. EM countries benefitted from improved risk sentiment as capital flows stabilized and commodity prices broadly recovered. Many EM countries are still being challenged by rising COVID-19 cases, particularly Brazil and India. Investors remain concerned that many EM countries lack the fiscal and monetary resources to offset the economic impact of the pandemic.
-15.0%
-10.0%
-5.0%
0.0%
5.0%
10.0%
-4.0%
-3.0%
-2.0%
-1.0%
0.0%
1.0%
2.0%
3.0%
4.0%
5.0%
6.0%
JPM Emerging Markets Bond Global Diversified Index (EMBI)
JPM Corporate Emerging Markets Bond Broad Diversified Index (CEMBI)
JPM Government Bond Emerging Markets Broad Diversified Index (GBI-EM)
J.P. Morgan Emerging Markets Bond Index Performance August 30, 2019 to July 31, 2020
Source: J.P. Morgan

Monthly Market CommentaryJuly 2020
11
InfrastructureInfrastructure assets performed well in July, generating a roughly 2% monthly return as credit spreads tightened and the U.S. Treasury curve flattened. This marked a slight outperformance over the Bloomberg Barclays US Aggregate Bond Index return of 1.49% but underperformance relative to the Bloomberg Barclays US Credit Index return of 3.08%.
Unsecured corporate bonds backed by utilities and industrial companies were the top performers in the infrastructure space, as 20- and 30-year Treasury rates rallied by approximately 20 basis points (bps), and investor demand continued to drive spreads tighter.
Another standout sector was infrastructure assets in securitized form, namely bonds backed by payments for residential renewable energy systems such as solar power. This sector experienced some selling pressure in March due to its sensitivity to consumer repayment rates but has marked strong rallies the last two months due to better than expected remittance reports.
Global shipping and transportation assets in securitized form also contributed positive total returns in July but to a lesser degree as the COVID-19 pandemic continued to weigh on these sectors.
U.S. Equities In July, the S&P 500 Index rallied 5.64%, defying double-digit unemployment and pandemic-induced earnings declines, and edged back into positive territory for the year (+2.38%).
The Nasdaq 100 Index continued its phenomenal run, increasing 7.41% in July and up 25.55% year-to-date (YTD).
Large-capitalization stocks continued to outperform small-cap stocks. The Russell 2000® Index, which tracks small-cap stocks, gained 2.77%, lagging the S&P 500 by 2.87%.
The three best-performing sectors of the market were utilities (+7.81%), communication services (+7.43%) and consumer discretionary (+7.19%). The three-worst performers were energy (-4.91%), real estate (+4.05%) and financials (+3.77%).
Global EquitiesGlobal equities continued to rally in July as economic data rebounded. The Morgan Stanley Capital International All Country World Index (MSCI ACWI) rose 5.33% for the month. U.S. equities performed in line, with the S&P 500 Index up 5.64% and the Nasdaq Composite Index up 6.85%. The Dow Jones Industrial Average (+2.51%) and the Russell 2000® Index (+2.77% ) underperformed.
European equities significantly underperformed the broader market. The Euro Stoxx 50 Index declined 1.52%. Core European equities had mixed results, with the DAX of German blue chips returning 0.02% and the French CAC 40 down 2.64%. On the periphery, Italian stocks, as measured by the FTSE Milano Indice di Borsa (FTSE MIB), declined 1.13% and Spain’s IBEX was down 4.4%. U.K. equities, as measured by the FTSE 100, declined 4.2%.
Asian equities outperformed ex-Japan. Japanese equities, as measured by the Nikkei, were down 2.59%. As measured by the Shanghai Stock Exchange Composite Index, Chinese equities rose 11.96%. Hong Kong’s Hang Seng Index was up 1.50%. South Korea’s KOSPI rose 6.69%, and Taiwan’s TAIEX rose 10.73%.
Emerging markets (EM) equities also outperformed the broad market with the help of a weaker U.S. dollar, with the Morgan Stanley Capital International Emerging Markets Index (MSCI EMI) returning 9.01%. Indian equities, as measured by MSCI India, were up 9.48% for the month. Brazil’s Ibovespa was up 8.27% while Chilean equities, as measured by MSCI Chile, rose 10.66% in July. Russian equities, as measured by MSCI Russia, rose 3.05%.

12
Definitions/Explanations
AUD – Australian Dollar
ADP Research Institute – ADP generates data-driven discoveries about the world of work and derives economic indicators from these discoveries. Its two primary areas of focus are Labor Market trends, and issues related to People + Performance at work.
Basis Point – A basis point (bps) equals 0.01%.
Bloomberg Agriculture Subindex – Formerly known as Dow Jones-UBS Agriculture Subindex (DJUBSAG), the index is a commodity group subindex of the Bloomberg CI. It is composed of futures contracts on coffee, corn, cotton, soybeans, soybean oil, soybean meal, sugar and wheat. It reflects the return of underlying commodity futures price movements only and is quoted in USD.
Bloomberg Barclays US Aggregate Bond Index – This index represents securities that are SEC registered, taxable and dollar denominated. It covers the U.S. investment-grade fixed-rate bond market, with components for government and corporate securities, mortgage pass-through securities and asset-backed securities. These major sectors are subdivided into more specific indices that are calculated and reported on a regular basis.
Bloomberg Barclays US Aggregate Credit Average OAS Index – The Option-Adjusted Spread calculated on the Bloomberg Barclays U.S. Aggregate Bond Index.
Bloomberg Barclays US Asset-Backed Securities (ABS) Index – This index is the ABS component of the Bloomberg Barclays US Aggregate Index. The ABS index has three subsectors: credit and credit cards, autos and utility.
Bloomberg Barclays US Corporate Index – This index measures the investment-grade fixed-rate taxable corporate bond market. It includes U.S. dollar-denominated securities publicly issued by U.S. and non-U.S. industrial, utility and financial issuers.
Bloomberg Barclays US Credit Index – This index is the U.S. credit component of the US Government/Credit Index. It consists of publicly issued U.S. corporate and specified foreign debentures and secured notes that meet the specified maturity, liquidity and quality requirements. To qualify, bonds must be SEC registered. The US Credit Index is the same as the former US Corporate Index.
Bloomberg Barclays US Government/Credit Index – This index is a broad-based flagship benchmark that measures the nonsecuritized component of the Bloomberg Barclays US Aggregate Index. It includes investment-grade U.S. dollar-denominated fixed-rate U.S. Treasuries, and government-related and corporate securities.
Bloomberg Barclays US Mortgage-Backed Securities (MBS) Index – This index measures the performance of investment-grade fixed-rate mortgage-backed pass-through securities of the government-sponsored enterprises (GSEs): Federal Home Loan Mortgage Corp. (Freddie Mac), Federal National Mortgage Association (Fannie Mae) and Government National Mortgage Association (Ginnie Mae).
Bloomberg Barclays US Corporate High Yield (HY) Index – This index measures the U.S. dollar-denominated HY fixed-rate corporate bond market. Securities are classified as HY if the respective middle ratings of Moody’s, Fitch and S&P are Ba1, BB+ or BB+ or below. The Bloomberg Barclays US HY Long Index, including bonds with maturities of 10 years or greater, and the Bloomberg Barclays US HY Intermediate Index, including bonds with maturities of 1 to 9.999 years, are subindices of the Bloomberg Barclays US Corporate HY Index.
Bloomberg Barclays US Treasury Inflation-Protected Securities (TIPS) Index – This index comprises all publicly issued U.S. Treasury inflation-protected securities (TIPS) denominated in U.S. dollars and traded intraday.
Bloomberg Barclays US Treasury Total Return Unhedged USD Index – Measures U.S. dollar-denominated, fixedrate, nominal debt issued by the U.S. Treasury. Treasury bills are excluded by the maturity constraint, but are part of a separate Short Treasury Index.
Bloomberg Barclays US Treasury Index – This index measures U.S. dollar-denominated fixed-rate nominal debt issued by the U.S. Treasury with a remaining maturity of one year or more.
Bloomberg Commodity (BCOM) Index – This index is calculated on an excess return basis and reflects the price movements of commodity futures. It rebalances annually, weighted two-thirds by trading volume and one-third by world production, and weight caps are applied at the commodity, sector and group levels for diversification. The roll period typically occurs from the sixth to 10th business day based on the roll schedule.
Bid Wanted in Competition (BWIC) – A formal request for bids on a package of securities that is submitted by an institutional investor to a number of securities dealers. The dealers are being invited to submit bids on the listed securities.
Brent Crude Oil – A major trading classification of sweet light crude oil that serves as a benchmark price for purchases of oil worldwide.
Broadly Syndicated Loans (BSL) – Any Loan to an Obligor issued as part of a loan facility with an original loan size (including any first and second lien loans included in the facility) greater than $250,000,000.
CBOE Volatility Index (VIX) – A popular measure of the stock market’s expectation of volatility implied by S&P 500 Index options, calculated and published by the Chicago Board Options Exchange (CBOE).
CMBX Index – The CMBX is an index, or more accurately a series of indices, designed to reflect the creditworthiness of commercial mortgage-backed securities (CMBS).
Collateralized Loan Obligation (CLO) – A single security backed by a pool of debt.
Conference Board Leading Economic Index (LEI) – Phenomena, such as the unemployment and new construction rates, used by The Conference Board to predict the financial condition of a particular industry or the economy in general.
Conference Board Consumer Confidence Index (CCI) – This index measures the degree of optimism that consumers feel and future expectations about the overall economy.
Conference Board Measure of CEO Confidence – A survey of approximately 100 CEOs in a wide variety of industries that details Chief Executive’s attitudes and expectations regarding the overall state of the economy as well as their own industry.
Consumer Price Index (CPI) – A measure that examines the weighted average of prices of a basket of consumer goods and services, such as transportation, food and medical care. It is calculated by taking price changes for each item in the predetermined basket of goods and averaging them. Changes in the CPI are used to assess price changes associated with the cost of living; the CPI is one of the most frequently used statistics for identifying periods of inflation or deflation.
Cotation Assistee en Continu (CAC) 40 – This stock market index tracks the 40 largest French stocks based on Euronext Paris market capitalization.
Credit Default Swap Index (CDX) – Formerly the Dow Jones CDX, this is a financial instrument made up of credit securities that have been issued by North American or emerging markets companies. The CDX is itself a tradable security – a credit market derivative.
Deutsche Aktien Index (DAX) – This blue-chip stock market index comprises the 30 major German companies trading on the Frankfurt Stock Exchange.
Dot Plot – A simple statistical chart that consists of data points plotted as dots on a graph with x- and y-axes. Dot plots are well known as the method that the U.S. Federal Reserve (Fed) uses to convey its benchmark Federal Funds interest rate outlook at certain Federal Open Market Committee (FOMC) meetings.
Dow Jones Industrial Average (DJIA) – This index tracks 30 large publicly owned companies trading on the New York Stock Exchange and the Nasdaq.
EUR – Euro
EUR/USD – The Currency Pair EUR/USD is the shortened term for the euro and U.S. dollar pair or cross for the currencies of the European Union (EU) and the United States (USD). The currency pair indicates how many U.S. dollars (the quote currency) are needed to purchase one euro (the base currency).
Euro Stoxx 50 Index – This index of 50 eurozone stocks provides a blue-chip representation of supersector leaders in the eurozone.
FactSet – Provides computer-based financial data and analysis for financial professionals, including investment managers, hedge funds and investment bankers. It consolidates data on global markets, public and private companies, and equity and fixed-income portfolios.
Federal Family Education Loan Program (FFELP) – A system of private student loans which were subsidized and guaranteed by the United States federal government.
Fannie Mae (FNMA) – The Federal National Mortgage Association (Fannie Mae) is a government-sponsored enterprise (GSE) established in 1938 to expand the liquidity of home mortgages by creating a secondary mortgage market. As a secondary market participant, Fannie Mae does not lend money directly to consumers. Instead, it keeps money flowing to lenders (e.g., credit unions, local and national banks, thrifts and other financial institutions) through the purchase and guaranty of mortgages made by these firms.

13
Federal Funds Rate – This is the target interest rate, set by the Federal Reserve (the Fed) at its Federal Open Market Committee (FOMC) meetings, at which commercial banks borrow and lend their excess reserves to each other overnight. The Fed sets a target Federal Funds Rate eight times a year, based on prevailing economic conditions.
FICO Score – This credit score, created by the Fair Isaac Corp., is used by lenders along with other details on a borrower’s credit report to assess credit risk and determine whether to extend credit.
Financial Times Stock Exchange Milano Italia Borsa (FTSE MIB) – The benchmark stock market index for the Borsa Italiana, the Italian national stock exchange, which superseded the MIB-30 in September 2004. The index consists of the 40 most-traded stock classes on the exchange.
Financial Times Stock Exchange 100 (FTSE 100) – A capitalization-weighted index of the 100 most highly capitalized companies traded on the London Stock Exchange.
FTSE World Government Bond Index (WGBI) – This broad index measures the performance of fixed-rate local-currency investment-grade sovereign bonds. It is a widely used benchmark that comprises sovereign debt from more than 20 countries that is denominated in a variety of currencies.
Freddie Mac (FHLMC) – The Federal Home Loan Mortgage Corp. (Freddie Mac) is a stockholder-owned, government-sponsored enterprise (GSE) chartered by Congress in 1970 to keep money flowing to mortgage lenders in support of homeownership and rental housing for middle-income Americans. Freddie Mac, purchases, guarantees and securitizes mortgages to form mortgage-backed securities (MBS).
Freddie Mac Primary Mortgage Market Survey (PMMS) – This weekly national survey tracks the most-popular 30- and 15-year fixed-rate mortgages, and 5-1 hybrid amortizing adjustable-rate mortgage products among a mix of lender types. The survey is compiled Monday through Wednesday and released (as average rates and points) on Thursday.
Freddie Mac U.S. Mortgage Market Survey 30 Year Homeowner Commitment National Index – This index tracks the 30-year fixed-rate mortgages component of the Freddie Mac Primary Mortgage Market Survey (PMMS).
FTSE 100 Index – This index tracks the 100 companies with the highest market capitalization on the London Stock Exchange.
FTSE Milano Indice di Borsa (FTSE MIB) – This benchmark index for the Borsa Italian, the Italian stock exchange, comprises the 40-most traded stock classes on the exchange.
G10 (Group of Ten) – The G10 comprises 11 industrialized nations that meet on an annual basis, or more frequently as needed, to consult each other, debate and cooperate on international financial matters. The member countries are: Belgium, Canada, France, Germany, Italy, Japan, the Netherlands, Sweden, Switzerland, the United Kingdom and the United States.
G20 (Group of 20) – The G20 comprises the European Union leadership and 19 countries that look to cooperate on international financial matters. The member countries are: Argentina, Australia, Brazil, Canada, China, France, Germany, India, Indonesia, Italy, Japan, Mexico, Russia, Saudia Arabia, South Africa, South Korea, Turkey, the United Kingdom and the United States.
GBP – British Pound
Gilt – Bonds issued by the U.K., India, and other Commonwealth countries.
Ginnie Mae (GNMA) – The Government National Mortgage Association (Ginnie Mae) is a federal government corporation that guarantees the timely payment of principal and interest on mortgage-backed securities (MBSs) issued by approved lenders. Ginnie Mae’s guarantee allows mortgage lenders to obtain a better price for MBS in the capital markets.
Ginnie Mae (GNMA) – Ginnie Mae I is composed of mortgages that pay principal and interest on the 15th of every month, while the Ginnie Mae II does the same on the 20th of every month. Another difference between the two pools is the maturity, with Ginnie Mae I having a maximum of 30 years for single-family and 40 years for multifamily, whereas Ginnie Mae II is 30 years max as it doesn’t include multifamily project or construction loans.
Ginnie Mae II - This class of pass-through investments is issued by the Government National Mortgage Association (GNMA), known as Ginnie Mae, and draws income from pools of Federation Housing Administration (FHA) and Department of Veterans Affairs mortgages. Ginnie Mae II securities pay principal and interest on the 20th of every month (in contrast to the 15th for Ginnie Mae I) and have a maximum maturity of 30 years.
Hang Seng Index – This free-float capitalization weighted index tracks a selection of companies on the Stock Exchange of Hong Kong. The index has four subindices: commerce and industry, finance, utilities and properties.
Ibovespa Index – This gross-return index is weighted by trade volume and comprises the most-liquid stocks on Brazil’s Sao Paulo Stock Exchange.
ICE Bank of America (BofA) MOVE Index – This index is a measure of U.S. interest-rate volatility that tracks the movement in U.S. Treasury yield volatility implied by current prices of one-month over-the-counter options on two-, five-, 10- and 30-year Treasuries.
ICE Bank of America (BofA) U.S. Fixed-Rate Asset-Backed Securities (ABS) Index – This index tracks the performance of U.S. dollar-denominated investment grade (IG) asset-backed securities publicly issued in the U.S. domestic market. Qualifying securities must have an IG rating (based on an average of Moody’s, S&P and Fitch).
ICE Bank of America (BofA) U.S. Fixed-Rate Miscellaneous Asset-Backed Securities (ABS) Index – A subset of the ICE BofA U.S. Fixed-Rate ABS Index, including all ABS collateralized by anything other than auto loans, home equity loans, manufactured housing, credit card receivables and utility assets.
IHS Markit Eurozone Manufacturing Purchasing Managers’ Index – A measure of the performance of the manufacturing sector derived from a survey of 3,000 manufacturing firms and including national data for Germany, France, Italy, Spain, the Netherlands, Austria, the Republic of Ireland, and Greece. The index is based on five individual indexes: New Orders (30%), Output (25%), Employment (20%), Suppliers’ Delivery Times (15%), and Stock of Items Purchased (10%), with the Delivery Times index inverted to move in a comparable direction. A reading of above 50 indicates an expansion of the sector, while a reading below 50 represents a contraction and 50 indicates no change.
The IHS Markit/CIPS UK Manufacturing PMI® – Based on data compiled from monthly replies to questionnaires sent to purchasing executives in over 600 industrial companies. It is a composite index based on five of the individual indexes with the following weights: New Orders - 0.3, Output - 0.25, Employment - 0.2, Suppliers’ Delivery Times - 0.15, Stock of Items Purchased - 0.1, with the Delivery Times Index inverted so that it moves in a comparable direction.
Indice Bursatil Espanol (IBEX) – This official index of the Spanish Continuous Market comprises the 35 most-liquid stocks traded on the market.
Institute for Supply Management (ISM) Purchasing Managers Index (PMI) – An indicator of the economic health of the manufacturing sector. The PMI is based on five major indicators: new orders, inventory levels, production, supplier deliveries and the employment environment.
ISM Non-Manufacturing Index (ISM NMI) – An index made up of data from 400 non-manufacturing firms collected by the Institute of Supply Management (ISM).
ISM New Orders Index – The Manufacturing ISM Report On Business is based on data compiled from monthly replies to questions asked of purchasing and supply executives in over 400 industrial companies. For each of the indicators measured (New Orders, Backlog of Orders, New Export Orders, Imports, Production, Supplier Deliveries, Inventories, Customers Inventories, Employment, and Prices), this report shows the percentage reporting each response, the net difference between the number of responses in the positive economic direction and the negative economic direction and the diffusion index. Responses are raw data and are never changed. The diffusion index includes the percent of positive responses plus one-half of those responding the same (considered positive). The resulting single index number is then seasonally adjusted to allow for the effects of repetitive intra-year variations resulting primarily from normal differences in weather conditions, various institutional arrangements, and differences attributable to non-moveable holidays. All seasonal adjustment factors are supplied by the U.S. Department of Commerce and are subject annually to relatively minor changes when conditions warrant them.
J.P. Morgan Collateralized Loan Obligation Index (CLOIE) – This index a market value-weighted index consisting of U.S. dollar-denominated collateralized loan obligations (CLO).
J.P. Morgan Collateralized Loan Obligation (CLO) Total Return Level Index – This index is a total return subindex of the J.P. Morgan Collateralized Loan Obligation Index (CLOIE), which is a market value-weighted index consisting of U.S. dollar-denominated CLO.
J.P. Morgan Corporate Emerging Markets Bond Index (CEMBI) – This index is a market capitalization-weighted index consisting of U.S. dollar-denominated emerging markets (EM) corporate bonds. CEMBI is a liquid global corporate benchmark representing Asia, Latin America, Europe and the Middle East/Africa.
J.P. Morgan Emerging Markets Bond Index (EMBI) – This index tracks emerging markets (EM) bonds and comprises sovereign debt and emerging corporate bonds.

14
J.P. Morgan Emerging Markets Bond Index (EMBI) Global Diversified – This index is a uniquely weighted version of the EMBI, which tracks emerging markets (EM) bonds and comprises sovereign debt and emerging corporate bonds. It limits the weights of index countries with larger debt stocks by only including specified portions of those countries’ eligible current face amounts of debt outstanding.
J.P. Morgan Corporate Emerging Markets Bond Index (CEMBI) Global Diversified – This index is a uniquely weighted version of the CEMBI, which is a market capitalization-weighted index consisting of U.S. dollar-denominated emerging markets (EM) corporate bonds. It limits the weights of index countries with larger debt stocks by only including specified portions of those countries’ eligible current face amounts of debt outstanding.
JPY – Japanese Yen
Korean Composite Stock Price Index (KOSPI) – This index comprises all common stocks traded on the stock market division of the Korea Exchange. It is the representative stock market index in South Korea, like the S&P 500 Index in the U.S.
Last Cash Flow (LCF) – The last revenue stream paid to a bond over a given period.
Leveraged Commentary & Data (LCD) – A unit of S&P Global Market Intelligence, LCD provides in-depth coverage of the leveraged loan market through real-time news, analysis, commentary, and proprietary loan data.
Loan-to-Value Ratio (LTV) – This ratio compares a loan to the value of an asset purchased to asses lending risk.
LTM – Last Twelve Months
London Interbank-Offered Rate (LIBOR) – An indicative average interest rate at which a selection of banks, known as the “panel banks,” are prepared to lend one another unsecured funds on the London money market.
Major Markets – Major markets are defined by Real Capital Analytics as Boston, Chicago, Washington, D.C., Los Angeles, New York City and San Francisco. All markets outside of the Major Markets are Non-Major Markets.
Markit CMBX Index – A synthetic tradable index referencing a basket of 25 commercial mortgage-backed securities.
Mortgage Bankers Association (MBS) Refinancing Index – A weekly measurement that helps predict mortgage activity and loan prepayments based on the number of mortgage refinance applications submitted. When this index is seasonal adjusted, a statistical technique is used that attempts to measure and remove the influences of predictable seasonal patterns (weather, harvests, major holidays, school schedules, etc.) to make it easier to observe the cyclical, underlying trend, and other nonseasonal movements in the series.
Morgan Stanley Capital International All Country World Index (MSCI ACWI) – This market capitalization-weighted index is designed to provide a broad measure of stock performance throughout the world. It comprises stocks from 23 developed countries 24 and emerging markets.
Mortgage Bankers Association (MBA) Purchase Index – An index that includes all mortgage applications for purchases of single-family homes. It covers the entire market, both conventional and government loans and all products.
Mortgage Bankers Association (MBA) Refinance Index – An index that covers all mortgage applications to refinance an existing mortgage. It includes conventional and government refinances. SA indicates seasonally adjusted and NSA indicates non-seasonally adjusted.
Morgan Stanley Capital International Emerging Markets Index (MSCI EMI) – This index captures large- and mid-cap representation across 26 emerging markets (EM) countries. With 1,385 constituents, the index covers approximately 85% of the free-float-adjusted market capitalization in each country.
MSCI Russia Index – A free-float capitalization-weighted index used to track the equity market performance of Russian securities on the MICEX Stock Exchange.
Nasdaq Composite Index – This index (“the Nasdaq”) comprises the more than 3,000 common stocks and similar securities (e.g., American depository receipts (ADRs), tracking stocks, limited-partnership interests) listed on the Nasdaq exchange. The index, which includes U.S. and non-U.S. companies, is highly followed in the U.S. as an indicator of the stock performance of technology companies and growth companies.
Nasdaq 100 Index – This index comprises the 100 largest U.S. and non-U.S. nonfinancial securities based on market capitalization listed on the Nasdaq stock exchange. The index reflects companies across major industry groups including computer hardware and software, telecommunications, biotechnology and retail/wholesale trade.
Net Asset Value (NAV) – Net value of an entity calculated as the total value of the entity’s assets minus the total value of its liabilities. Most commonly used in the context of a mutual fund or an exchange-traded fund (ETF), the NAV represents the per share/unit price of the fund on a specific date or time.
NFIB Small Business Optimism Index – The small business optimism index is compiled from a survey that is conducted each month by the National Federation of Independent Business (NFIB) of its members. The index is a composite of 10 seasonally adjusted components based on the following questions: plans to increase employment, plans to make capital outlays, plans to increase inventories, expect economy to improve, expect real sales higher, current inventory, current job openings, expected credit conditions, now a good time to expand, and earnings trend.
Nikkei 225 Index – This price-weighted index comprises Japan’s top 225 blue-chip companies on the Tokyo Stock Exchange. The Nikkei is equivalent to the Dow Jones Industrial Average Index in the U.S.
On-the-Run Treasuries – The most recently issued U.S. Treasury bonds or notes of a particular maturity. “On-the-run” Treasuries are the opposite of “off-the-run” Treasuries, which refer to Treasury securities that have been issued before the most recent issue and are still outstanding.
Overcollateralization (OC) – Provision of collateral that is worth more than enough to cover potential losses in cases of default.
Personal Consumption Expenditures (PCE) Core Price Index – Measures price changes in consumer goods and services. Expenditures included in the index are actual U.S. household expenditures. Data that pertains to services, durables and non-durables are measured by the index.
Qualified Mortgage (QM) – A qualified mortgage is a mortgage that meets certain requirements for lender protection and secondary market trading under the Dodd-Frank Wall Street Reform and Consumer Protection Act.
RCA Commercial Property Price Index (CPPI) – This index describes various nonresidential property types for the U.S. (10 monthly series from 2000). It is a periodic same-property round-trip investment price-change index of the U.S. commercial investment property market. The dataset contains 20 monthly indicators.
RCA U.S. All-Property Commercial Property Price Index (CPPI) – This index is a component of the suite of price indexes that comprise the RCA CPPI.
Russell 1000® Growth Index – An index that measures the performance of the large-cap growth segment of the U.S. equity universe. It includes those Russell 1000 companies with higher price-to-book ratios and higher forecasted growth values.
Russell 1000® Value Index – An index that measures the performance of the large-cap value segment of the U.S. equity universe. It includes those Russell 1000 companies with lower price-to-book ratios and lower expected growth values.
Russell 2000® Index – This market capitalization-weighted index comprises 2,000 small-cap U.S. companies and is considered a bellwether index for small-cap investing.
S&P CoreLogic Case-Shiller National Home Price Index – An index that tracks the value of single-family housing within the United States. The index is a composite of single-family home price indices for the nine U.S. Census divisions.
S&P CoreLogic Case-Shiller 20-City Composite Home Price NSA Index – This index seeks to measures the value of residential real estate in 20 major U.S. metropolitan areas: Atlanta; Boston; Charlotte; Chicago; Cleveland; Dallas; Denver; Detroit; Las Vegas; Los Angeles; Miami; Minneapolis; New York; Phoenix; Portland; San Diego; San Francisco; Seattle; Tampa; and Washington, D.C.
S&P/LSTA Leveraged Loan Index – This index is designed to track the market-weighted performance of institutional weighted loans based on market weightings, spreads and interest payments.
S&P/LSTA Leveraged Loan 100 Index – An index designed to track the market-weighted performance of the 100 largest institutional leveraged loans based on the market weightings, spreads and interest payments.
S&P GSCI – This index (formerly the Goldman Sachs Commodity Index) measures investment in the commodity markets and commodity market performance over time.
S&P 500 Index – This unmanaged capitalization-weighted index of the stocks of the 500 largest publicly traded U.S. companies is designed to measure performance of the broad domestic economy through changes in the aggregate market value of the 500 stocks, which represent all major industries.

Monthly Market CommentaryJuly 2020
15
S&P Global Market Intelligence – A provider of multi-asset class and real-time data, research, news and analytics to institutional investors, investment and commercial banks, investment advisors and wealth managers, corporations, and universities.
Secured Overnight Financing Rate (SOFR) – An influential interest rate that banks use to price U.S. dollar-denominated derivatives and loans. The daily SOFR is based on transactions in the Treasury repurchase market, where investors offer banks overnight loans backed by their bond assets.
Shanghai Stock Exchange Composite Index – This capitalization-weighted index, developed in December 1990 with a base value of 100, tracks the daily performance of all A-shares and B-shares listed on the Shanghai Stock Exchange.
Spread – The difference between yields on differing debt instruments, calculated by deducting the yield of one instrument from another. The higher the yield spread, the greater the difference between the yields offered by each instrument. The spread can be measured between debt instruments of differing maturities, credit ratings and risk.
Spread to Maturity (STM) – A measure of return from a floating rate note relative to that from its index or reference rate, such as the London interbank-offered rate (LIBOR), calculated by discounting future cash flows on a bond basis.
TAIEX Index – This index tracks companies traded on the Taiwan Stock Exchange. The index covers all listed stocks excluding preferred, full-delivery and newly listed stocks, which are listed for less than one calendar month.
Trade Reporting and Compliance Engine (TRACE) – The Trade Reporting and Compliance Engine is the FINRA-developed vehicle that facilitates the mandatory reporting of over-the-counter secondary market transactions in eligible fixed income securities.
U-3 Unemployment Rate – The U.S. Bureau of Labor Statistics U-3 unemployment rate is the officially recognized rate of unemployment, measuring the number of unemployed people as a percentage of the labor force.
U.S. National All-Property Price Index – A transaction-based RCA Commercial Property Price Index (CPPI) that measures commercial real estate price movement using repeat-sales regression methodology. One of over 350 indices which provide direct comparability across markets and property types in 15 countries, this Index focuses on the United States.
U.S. Dollar Index (DXY) – A weighted geometric mean of the U.S. dollar’s value relative to a basket of six major foreign currencies: the euro, Japanese yen, British pound, Canadian dollar, Swedish krona and Swiss franc.
U.S. Treasuries (UST) – Commonly used for references to the Treasury debt that the U.S. issues.
Uniform Mortgage-Backed Securities (UMBS) – Single-class securities backed by mortgage loans purchased by either Freddie Mac or Fannie Mae.
University of Michigan Consumer Sentiment Index – The Surveys of Consumers is a rotating panel survey based on a nationally representative sample that gives each household in the coterminous U.S. an equal probability of being selected. Interviews are conducted throughout the month by telephone. The minimum monthly change required for significance at the 95-percent level in the Sentiment Index is 4.8 points; for Current and Expectations Index the minimum is 6 points.
USD/JPY – The Currency Pair USD/JPY is the shortened term for the yen and U.S. dollar pair or cross for the currencies of Japan (JPY) and the United States (USD). The currency pair indicates how many Japanese yen (the quote currency) are needed to purchase one U.S. dollar (the base currency).
Weighted Average Cost of Capital (WACC) – The weighted average cost of capital (WACC) is a calculation of a firm’s cost of capital in which each category of capital is proportionately weighted. All sources of capital, including common stock, preferred stock, bonds, and any other long-term debt, are included in a WACC calculation.
WAL (Weighted Average Life) – The average number of years for which each dollar of unpaid principal on a loan or mortgage remains outstanding.
World Interest Rate Probabilities WIRP (WIRP) – Allows you to analyze the probabilities of various interest rate level outcomes as implied by the futures, options, and OIS markets, so you can quantify to what extent the markets are “pricing in” future central bank interest rate changes.
WTI – West Text Intermediate Crude Oil Front Month Futures Contract
Yield to Maturity (YTM) – The total return anticipated on a bond if the bond is held until it matures. Yield to maturity is considered a long-term bond yield but is expressed as an annual rate.
Z-Score – A numerical measurement used in statistics of a value’s relationship to the mean (average) of a group of values, measured in terms of standard deviations from the mean. If a Z-score is 0, it indicates that the data point’s score is identical to the mean score. A Z-score of 1.0 would indicate a value that is one standard deviation from the mean. Z-scores may be positive or negative, with a positive value indicating the score is above the mean and a negative score indicating it is below the mean.

Monthly Market CommentaryJuly 2020
16
Important Information Regarding This MaterialIssue selection processes and tools illustrated throughout this presentation are samples and may be modified periodically. These are not the only tools used by the investment teams, are extremely sophisticated, may not always produce the intended results and are not intended for use by non-professionals.
DoubleLine has no obligation to provide revised assessments in the event of changed circumstances. While we have gathered this information from sources believed to be reliable, DoubleLine cannot guarantee the accuracy of the infor-mation provided. Securities discussed are not recommendations and are present-ed as examples of issue selection or portfolio management processes. They have been picked for comparison or illustration purposes only. No security presented within is either offered for sale or purchase. DoubleLine reserves the right to change its investment perspective and outlook without notice as market condi-tions dictate or as additional information becomes available. This material may include statements that constitute “forward-looking statements” under the U.S. securities laws. Forward-looking statements include, among other things, projec-tions, estimates, and information about possible or future results related to a cli-ent’s account, or market or regulatory developments.
Important Information Regarding Risk FactorsInvestment strategies may not achieve the desired results due to implementa-tion lag, other timing factors, portfolio management decision-making, economic or market conditions or other unanticipated factors. The views and forecasts ex-pressed in this material are as of the date indicated, are subject to change without notice, may not come to pass and do not represent a recommendation or offer of any particular security, strategy, or investment. All investments involve risks. Please request a copy of DoubleLine’s Form ADV Part 2A to review the material risks involved in DoubleLine’s strategies. Past performance is no guarantee of fu-ture results.
Important Information Regarding DoubleLineIn preparing the client reports (and in managing the portfolios), DoubleLine and its vendors price separate account portfolio securities using various sources, includ-ing independent pricing services and fair value processes such as benchmarking.
To receive a copy of DoubleLine’s current Form ADV (which contains important additional disclosure information, including risk disclosures), a copy of Double-Line’s proxy voting policies and procedures, or to obtain additional information on DoubleLine’s proxy voting decisions, please contact DoubleLine’s Client Services.
Important Information Regarding DoubleLine’s Investment StyleDoubleLine seeks to maximize investment results consistent with our interpreta-tion of client guidelines and investment mandate. While DoubleLine seeks to max-imize returns for our clients consistent with guidelines, DoubleLine cannot guaran-tee that DoubleLine will outperform a client’s specified benchmark or the market or that DoubleLine’s risk management techniques will successfully mitigate losses. Additionally, the nature of portfolio diversification implies that certain holdings and sectors in a client’s portfolio may be rising in price while others are falling or that some issues and sectors are outperforming while others are underperform-ing. Such out or underperformance can be the result of many factors, such as, but not limited to, duration/interest rate exposure, yield curve exposure, bond sector exposure, or news or rumors specific to a single name.
DoubleLine is an active manager and will adjust the composition of clients’ portfo-lios consistent with our investment team’s judgment concerning market conditions and any particular sector or security. The construction of DoubleLine portfolios may differ substantially from the construction of any of a variety of market indices. As such, a DoubleLine portfolio has the potential to underperform or outperform a bond market index. Since markets can remain inefficiently priced for long periods, DoubleLine’s performance is properly assessed over a full multi-year market cycle.
Important Information Regarding Client ResponsibilitiesClients are requested to carefully review all portfolio holdings and strategies, in-cluding by comparison of the custodial statement to any statements received from DoubleLine. Clients should promptly inform DoubleLine of any potential or per-ceived policy or guideline inconsistencies. In particular, DoubleLine understands that guideline enabling language is subject to interpretation and DoubleLine strongly encourages clients to express any contrasting interpretation as soon as practical. Clients are also requested to notify DoubleLine of any updates to cli-ent’s information, such as, but not limited to, adding affiliates (including broker dealer affiliates), issuing additional securities, name changes, mergers or other alterations to Client’s legal structure.
DoubleLine Group is not an investment adviser registered with the Securities and Exchange Commission (SEC).
DoubleLine® is a registered trademark of DoubleLine Capital LP.
© 2020 DoubleLine Capital LP

17
For Investors in ChileIf any products are offered within Chile, they will be offered and sold only pursuant to General Rule 336 of the SVS, an exemption to the registration requirements, or in circumstances which do not constitute a public offer of securities in Chile within the meaning of Article 4 of the Chilean Law No. 18,045 on Securities Market.
This communication is addressed only to “Qualified Investors” (as defined in SVS General Rule No. 216).
Si algunos valores son ofrecidos dentro de Chile, serán ofrecidos y colocados sólo de acuerdo a la Norma de Carácter General 336 de la SVS, una excepción a la ob-ligación de registro, o en circunstancias que no constituyan una oferta pública de valores en Chile según lo definido por el Artículo 4 de la Ley 18.045 de Mercado de Valores de Chile.
Esta comunicación está dirigida a “Inversionistas Calificados” (según se define en la Norma de Carácter General N° 216 de la SVS).
For Investors in PeruAll content in this document is for information or general use only. The informa-tion contained in this document is referential and may not be construed as an offer, invitation or recommendation, nor should be taken as a basis to take (or stop taking) any decision.
This neither is an offer or an invitation to offer nor authorizes such sales or invita-tions in places where such offers or invitations are contrary to the corresponding applicable.
This communication is not intended for any person who is not qualified as an in-stitutional investor, in accordance with provisions set forth in SMV Resolution Nº 021-2013-SMV-01, and as subsequently amended. No legal, financial, tax or any other kind of advice is hereby being provided.
Todo lo contenido en este documento es sólo para fines informativos o de uso general. La información contenida en este documento es referencial y no puede interpretarse como una oferta, invitación o recomendación, ni debe considerarse como fundamento para tomar (o dejar de tomar) alguna decisión.
La presente no constituye una oferta ni una invitación a ofertar ni autoriza tales ventas o invitaciones en los lugares donde tales ofertas o invitaciones sean con-trarias a las respectivas leyes aplicables.
Esta comunicación no está dirigida a ninguna persona que no califique como un inversionista institucional, de conformidad con lo dispuesto en la Resolución SMV Nº 021-2013-SMV-01, así como pueda ser modificada en el futuro. Por medio de la presente comunicación no se le está proveyendo de consejo legal, financiero, tributario o de cualquier otro tipo.
For Investors in Latin America and the Middle EastThis material has not been registered with, or approved or passed on in any way, by any regulatory body or authority in any jurisdiction. This material is for the information of prospective investors only and nothing in this material is intended to endorse or recommend a particular course of action. By receiving this material, the person or entity to whom it has been issued understands, acknowledges and agrees that neither this material nor the contents therein shall be deemed as an offer to sell or a solicitation of an offer to buy, or a recommendation of any security or any other product, strategy or service by DoubleLine or any other third party.
For Investors in Japan (Discretionary Investment Manager (DIM) & Non- Discre-tionary Investment Manager (Non-DIM)DoubleLine Investment Management Asia Ltd. (“DoubleLine Asia”) is registered with the Kanto Local Finance Bureau as an Investment Advisory and Agency (“IAA”) operator in Japan (Registration No. 2986). However, DoubleLine Asia only conducts the agency business under its IAA registration. Under its agency busi-ness, DoubleLine Asia is authorized to intermediate in the execution of investment advisory and investment management contracts between its affiliates which are registered investment managers outside of Japan (“Foreign Investment Manag-ers”) and discretionary investment managers and trust banks conducting the in-vestment management business (together the “Japan DIMs”) registered in Japan.
DoubleLine Asia is not permitted to market or solicit any securities or other invest-ment products, nor is it able to provide any direct investment advisory or invest-ment management services in Japan or elsewhere.
While discussions with Japan DIMs may involve its agency business of interme-diating investment advisory and investment management arrangements, all dis-cussions with persons other than Japan DIMs are necessarily limited to general information about DoubleLine Asia and its affiliates and nothing herein should be read to suggest a solicitation of products or services inconsistent with such regu-latory status.