overview optimizing mri protocols mri protocols 7/27/2005 g.d. clarke, ut hsc san antonio 4 ax t1w...
TRANSCRIPT

Optimizing MRI Protocols 7/27/2005
G.D. Clarke, UT HSC San Antonio 1
Optimizing MRI ProtocolsClinical Practice & Compromises
Geoffrey D. Clarke, Radiology DepartmentUniversity of Texas Health Science Center at San Antonio
Overview• Pulse timing parameters for adjusting
image contrast
• Effects of spatial resolution and imaging speed on signal-to-noise ratio
• Effects of magnetic field strength
• Adapting MRI pulsing protocols to physiology under investigation
Image Contrast• Basic image contrast is effected by the
amplitude and timing of the RF pulses used to excite the spin system.
• More advanced methods may use gradient pulses (to modulate motion) and alter tissue properties with exogenous contrast agents
Morphology & Physiology• Chemical Shift (water vs. fat)
• Blood motion (macroscopic & microscopic)
• Diffusion of water
• Gross motion (peristalsis, respiration)
• Tissue Susceptibility
Tissue Parameters
• Tissue Water Density – Proton Density (PD)
• Longitudinal Relaxation Time (T1)
• Transverse Relaxation Time (T2)
• Magnetization transfer rate constants
User Selectable Parameters• Magnetic Field Strength (Bo)
• RF Pulse timing (TR, TE, TI)
• RF pulse amplitude - flip angles (α)
• Gradient Amplitude & Timing (b-value)
• RF pulse excitation frequency & bandwidth
• Receiver bandwidth (BW)

Optimizing MRI Protocols 7/27/2005
G.D. Clarke, UT HSC San Antonio 2
Contrast-to-Noise Ratio
σ = standard deviation of the signal (the noise)
n = number of signals acquired
Ia,Ib = signal intensities from tissues “a” and “b”
( )σ
ba IInCNR −=
Contrast relationships are determined by the RF pulse timings used and the relaxation properties of tissues under investigation.
Relaxation Times• T1: longitudinal relaxation time defines recovery
of potential for next signal
• T2: transverse relaxation time defines rate of dephasing of MRI signal due to microscopic processes
• T2*: transverse relaxation time with Boinhomogeneity effects added; defines rate of dephasing of MRI signal due to macroscopic and microscopic processes
T1, T2 and for Various Tissues
Tissue T1(ms) T2(ms)
Liver 675+142 54+8 Kidney 559+10 84+8Muscle 1123+119 43+4Gray Matter 1136+91 87+15White Matter 889+30 86+1.5
AkberAkber, 1996 (at 63 MHz), 1996 (at 63 MHz)
Manipulating Contrast• The “weighting” of image contrast is related to
delay times, TR (repetition time) & TE (echo time)
• Spin Echo – manipulates image contrast with 180o
refocusing pulses (insensitive to Bo inhomogeneities)
• Gradient Echo – manipulates image contrast by varying the excitation flip angle (fast scans)
• Inversion Recovery – manipulates image contrast with 180o inversion pulses
Pulse Sequence Classifications ApplicationContrast
WeightingRF PulsesName
Exclude certain tissues
T1 and T2ThreeInversion Recovery
Fast imaging (3DFT)
T1 or T2*OneGradient Echo
ConventionalT1, PD or T2
Two or more
Spin Echo
Spin Echo - Rules of Thumb• TE controls T2 dependence• TR controls T1 dependence• T1 competes with T2 and proton density
“PD Weighted” = long TR, short TE“T1 Weighted” = short TR, short TE“T2 Weighted” = long TR, long TE

Optimizing MRI Protocols 7/27/2005
G.D. Clarke, UT HSC San Antonio 3
Spin-Echo Imaging Sequence
TX
RF1=90o RF2=180o
Spin Echo
time
timeRX
time
time
time
GGslsl
GGroro
Gpe
Multi-Echo AcquisitionsImage 1Image 1
Image 2Image 2
Image 3Image 3
SNR and Imaging Parameters
rxBWNSAzS ⋅∆⋅∝
ph
ph
ro
ro
MFOV
MFOV NR
FOV = field of view M = matrix size NSA = number of signals averagedBWrx = receiver bandwidth ro = read out (frequency encoding) direction∆z = slice thickness ph = phase encoding direction
Matched Bandwidth
Mugler & Brookeman, Magn Reson Imag 1989; 7:487-493.
1 2
Matched Bandwidth• Bandwidth on ADC1 is limited by finite Tmax
& desire to minimize TE1.
• T1 weighting and SNR is sacrificed moreby T2 decay than by BW
• T2-weighted image - lots of time for ADC2, poorer SNR. It would be nice to decrease BW (increase Tmax)
Mugler & Brookeman, Magn Reson Imag 1989; 7:487-493.
Matched Bandwidth = Unmatched Distortion
• Smaller BW on T2W image leads to increased image distortion
T1W T2W

Optimizing MRI Protocols 7/27/2005
G.D. Clarke, UT HSC San Antonio 4
AX T1W AX T2W FLAIR Diffusion Gadolinium
• Gray-white matter contrast
• See inside bony structures
• High spatial resolution
MR Brain Imaging
• Depicts white matter lesions
• Evaluate cerebral blood flow
SE – Effect of TRTR = 63 ms, NSA = 16 TR =125 ms, NSA = 8 TR = 250 ms, NSA = 4 TR = 500 ms, NSA = 2
TR = 1 s, NSA = 1 TR = 2 s, NSA = 1 TR = 4 s, NSA = 1
Bo = 1.5 T
FOV = 230 mm
256 x 256
st = 4 mm
TE = 15 ms
Vlaardingerbroek & den Boer, 1999
TR (s)4
2
1.5
1.2
0.9
0.6
TE 30 60 90 120 150 180 ms
MultiechoImage Matrix
Most TMost T1 1 WeightedWeighted
Most Proton Most Proton Density WeightedDensity Weighted
Most TMost T2 2 WeightedWeighted
Paramagnetism• Oxygen
• Metal ions with unpaired electrons resulting in positive susceptibility- Fe - Gd - Mg
• Paramagnetism has less than 1/1000th effect of ferromagnetism
• Shortens T1 and T2 times
Gd-DTPA• Typical dose of ~0.1 mM/kg• 550-600 Dalton• seven unpaired electrons
–high magnetic moment
–unpaired electrons react with protons in adjacent water molecules shortening their relaxation time
Gadolinium
• shortens T1 relaxation of water– high SI on T1 weighted images in lower
concentrations
• shortens T2 relaxation of water– lowers SI on T1 weighted images in high
concentrations

Optimizing MRI Protocols 7/27/2005
G.D. Clarke, UT HSC San Antonio 5
• Nonuniform distribution of Gd-DTPA increases magnetic susceptibilitydifferences– Decreases MR signal on T2*-weighted
images
Gadolinium Gadolinium Contrast Agents
MeningiomaMeningioma
TT11--weighted Imagesweighted Images
Normal With Gd Contrast
Commercial Contrast Agents Inversion Recovery
FLAIR(FLuid Attenuated Inversion Recovery)
Brain
Lesion
CSF
TI
0 time
Tefftime
Lesion
Brain
Mz
Mxy
Multiple Sclerosis
TR = 2350TE = 30
Proton Density
Rydberg JN et al. Radiology 1994; 193:173-180
T2-Weighted
TR=2350 TE= 80
FLAIR
TR=2600TE=145
TI= 11,000

Optimizing MRI Protocols 7/27/2005
G.D. Clarke, UT HSC San Antonio 6
FSE Pulse Sequence
ETL = Echo Train Length
Effective TE
FSE Point Spread Function Depends on T2
Effect of Echo Spacing
Vlardengerbrook & den Boer, 1999
Signal-to-noise decreases for short T2 tissues (gray & white matter) leading to a decrease in spatial resolution
Spin Echo vs. Fast Spin Echo
TT11--weighted weighted
(TR = 500)(TR = 500)
TT22--weightedweighted
(TR= 2000)(TR= 2000)
Spin Echo Fast Spin Echo (Echo Train Length = 4)Spin Echo Fast Spin Echo (Echo Train Length = 4)
TE = 30 ms
TE = 120 ms
Inversion Recovery FSE
Vlaardingerbroek & den Boer, 1999
Mod
ulus
Phas
e C
ompe
nsat
ed
TR =1400TI = 100
TR =1400TI = 280
TR =2000TI = 280
FLAIR Imaging
T2W-FSE FLAIR-FSETE/TR = 98/3500ms,
Slice 5/1.5mm, ET:8 (split)256x224, 1 NEX,
20x20 cm FOV, 3:23
TI/TE/TR = 2200/147/10000ms, Slice 5/1.5mm, 256x160, 1 NEX,
20x20cm FOV, 3:40

Optimizing MRI Protocols 7/27/2005
G.D. Clarke, UT HSC San Antonio 7
Magnetization Transfer
MultisliceFSE:
Magnetization Transfer Contrast Enhances T2-Weighted Appearance
Magnetization Transfer Contrast
Attenuation Due to Diffusion
)]4
(exp[)0()( 2222 δαδγ −∆−= appDGATEAWhere: α=π/2;G is amplitude of diffusion sensitive gradient
pulse;δ is duration of diffusion sensitive gradient;
∆ is time between diffusion sensitive gradientpulses;
Dapp is the apparent diffusion coefficientHahn E., Phys Rev 1950
Diffusion Weighted Imaging:Prototype Pulse Sequence
Stejskal EO & Tanner JE, 1965. 42: 288-292
( )3 b 222 δδγ −∆= G
Diffusion Echo-Planar Imaging
•Signal has to be acquired in time ~T2•Images in less than 100 ms but poor spatial resolution ( ~ 3mm x 3mm pixel)•Requires very good Bo homogeneity big susceptibility artifacts
The b-value• Controls amount of diffusion weighting
in image
• The greater the b-value the greater the area under the diffusion-weighted gradient pulses– longer TE
– stronger and faster ramping the gradients

Optimizing MRI Protocols 7/27/2005
G.D. Clarke, UT HSC San Antonio 8
Diffusion Imaging of Infarcts
SE Echo PlanarTE = 80 ms
SE Echo Planarb = 1205 s mm-1
SAG T1W SAG T2W STIR Gadolinium
• See inside bony structures
• Surface coil almost always used
• Evaluate nerve root compression
Left:Coronal
T2W(one slice)
Right:MIP
Spine Imaging
Gradient-Echo Imaging• Partial (<90o) flip angle keeps all
longitudinal magnetization from being used up
• Short TE values preserve SNR• Short TR values allow for fast scanning
(~ 1 sec/image) • Poor T2-weighted contrast• Sensitive to susceptibility
Spoiled Gradient Echo
Also called spoiled GRASS, fast field echo, FLASH, etc.
Magnetic Susceptibility Effects Gradient-Echo ImagingThe susceptibility-induced artifacts in GRE
images:• Increase with TE - limiting the utility of GRE
T2*-weighted images in many cases.• Are worst for tissue/air interfaces, but
noticeable at tissue/bone interfaces.• Are usually a detriment, but are useful in some
circumstances (e.g., blood-sensitive imaging, BOLD contrast functional imaging, etc.).

Optimizing MRI Protocols 7/27/2005
G.D. Clarke, UT HSC San Antonio 9
Gradient-Echo Imaging
Reference: Wehrli, Fast-Scan Magnetic Resonance. Principles and Applications
Spatial SaturationSpatial presaturationpulses (slabs) can be
applied in oblique coronal planes and are
used to suppress signal intensities of tissue adjacent to spine and reduce breathing artifacts
Phased Array Surface Coils
www.toshiba-europe.com
www.medical.philips.com
Surface receiver coils are used to maximize signal from regions of interest while minimizing noise from volumes outside of the region of investigation.
STIR(Short TI Inversion Recovery)
Fat
Liver
TI
0 time
Mz
T1-
wei
ghte
dT
1T1 --
wei
ghte
dw
eigh
ted• Right: Saggital T1W
image of T11–L1 demonstrates minimal wedging of the vertebral bodies associated with intravertebral disc herniations (arrows)
SAG T1W SAG T2W STIR Gadolinium
Spine Imaging
T2-
wei
ghte
dT
2T2 --
wei
ghte
dw
eigh
ted
• Heavily T2-weighted
images show CSF as bright,
creating myelographic
effect
SAG T1W SAG T2W STIR Gadolinium
MRI CT
Spine Imaging

Optimizing MRI Protocols 7/27/2005
G.D. Clarke, UT HSC San Antonio 10
S TI R
S TI R
Top: Sag T1WBottom: STIR
••SShort ••TTI••IInversion••RRecovery
SAG T1W SAG T2W STIR Gadolinium
Spine Imaging
Con
tra s
t A
gen t
Con
tra s
t A
gen t
Left – Axial T1W image of S1 (note nerve root)Right – Gd-enhanced image confirms abnormal soft tissue is scar
SAG T1W SAG T2W STIR Gadolinium
Spine Imaging
AX T2W AX EPI AX T1W Ferumoxide
Advantages:
• Soft tissue contrast
• High degree of contrast manipulation
• Lesion characterization
• High sensitivity to iron
Liver Imaging
Body MR Imaging requires:
• Control of respiratory an dother motion artiafcts
• Identification and/or elimination of fat signals
• Avoidance of wrap-around (aliasing) artifact
Chemical Shift Artifact• Occurs in
– Readout direction• Conventional SE
– Phase encode direction
• Echo-Planar
• Controlled by– Fat Pre-Saturation– STIR sequence
Chemical shift artifact seen in axial image of kidney
Chemical Shift• Chemical shift (fat-water) ~3.5 ppm
– At 1.5T:
– At 0.5T:
• ↓ field strength …. ↓ chemical shift
HzTTMHzf waterfat 2205.16.42105.3 6 ≅⋅⋅×=∆ −
−
HzTTMHzf waterfat 735.06.42105.3 6 ≅⋅⋅×=∆ −
−
CHESS
• This is typically accomplished by preceding a SE or FSE sequence with a 90o pulse that is frequency, not spatially, selective.

Optimizing MRI Protocols 7/27/2005
G.D. Clarke, UT HSC San Antonio 11
Liver ImagingChemical Shift
A. In phase-spoiled FFE image w/ TE= 4 ms
B. Out of phase spoiled FFE images w/ TE = 2 ms
C. T2 breath-hold FSE with fatsat pulse
A
B
http://www.users.on.net/~vision/papers/abdomen/abdominal-mri.htm
C
T2 W
T2 W
T2 W
AX FSE AX EPI AX T1W Ferumoxide • T2-Weighted FAST SPIN ECHO is often used to reduce motion artifact & scan time
Liver Imaging
Echo Planar
Echo Planar
Echo Planar
AX T2W T2W EPI AX T1W Ferumoxide
• Echo planar is the fastest imaging sequence and can be used to minimize motion artifacts
• Long TE Gradient Echoes produce T2* contrast to identify tumors
Increasing the number of shots
increases imaging time but decreases
geometric distortions
8 Shot 4 Shot
1 Shot2 Shot
Medhi P-A et al. Radiographics 2001; 21:767
Liver Imaging
PD/T
1WPD
/T1W
AX T2W AX EPI AX T1W Ferumoxide
PDW /T1WSGE
Very fast (EPI or Gradient Echo) T1 weighted images allow effective management ofrespiratory motion.
photo
Liver Imaging
Co ntra st
ag entsC
o ntra st ag ents
AX T2W AX EPI AX T1W Ferumoxide Super Super Paramagnetic Iron Paramagnetic Iron OxideOxide is the contrast agent of choice in liver imaging
T2W Fast Spin Echo T2*W Gradient Echo
Liver ImagingChanges in MRI with
Bo Field-Strength
Less uniform images
Increases in magnetic
susceptibility
Increased chemical shift?
Increased absorption of
RF power
Poorer T1W contrast due to
longer T1
Increased signal
The UglyThe BadThe Good
Optimizing MRI Protocols 7/27/2005
G.D. Clarke, UT HSC San Antonio 12
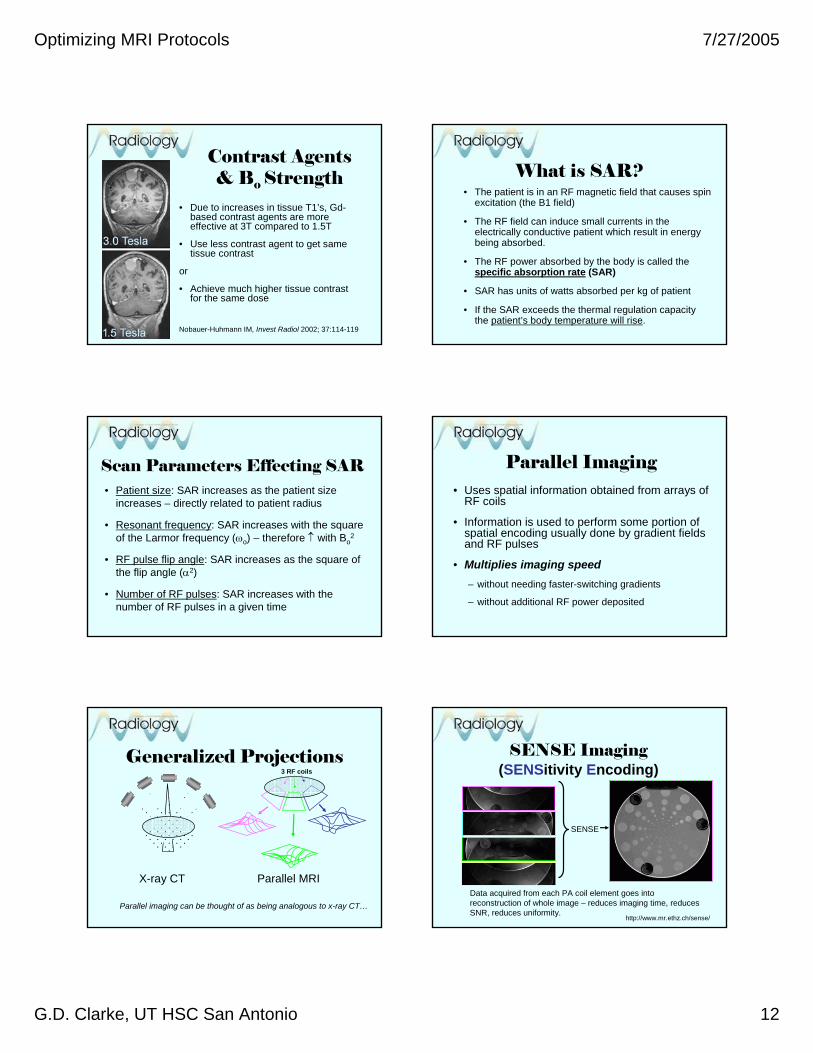
Contrast Agents & Bo Strength
• Due to increases in tissue T1’s, Gd-based contrast agents are more effective at 3T compared to 1.5T
• Use less contrast agent to get same tissue contrast
or
• Achieve much higher tissue contrast for the same dose
Nobauer-Huhmann IM, Invest Radiol 2002; 37:114-119
What is SAR?• The patient is in an RF magnetic field that causes spin
excitation (the B1 field)
• The RF field can induce small currents in the electrically conductive patient which result in energy being absorbed.
• The RF power absorbed by the body is called the specific absorption rate (SAR)
• SAR has units of watts absorbed per kg of patient
• If the SAR exceeds the thermal regulation capacity the patient’s body temperature will rise.
Scan Parameters Effecting SAR• Patient size: SAR increases as the patient size
increases – directly related to patient radius
• Resonant frequency: SAR increases with the square of the Larmor frequency (ωo) – therefore ↑ with Bo
2
• RF pulse flip angle: SAR increases as the square of the flip angle (α2)
• Number of RF pulses: SAR increases with the number of RF pulses in a given time
Parallel Imaging• Uses spatial information obtained from arrays of
RF coils
• Information is used to perform some portion of spatial encoding usually done by gradient fields and RF pulses
• Multiplies imaging speed– without needing faster-switching gradients
– without additional RF power deposited
Generalized Projections
X-ray CT Parallel MRI
Parallel imaging can be thought of as being analogous to x-ray CT…
3 RF coils
SENSE Imaging(SENSitivity Encoding)
SENSE
http://www.mr.ethz.ch/sense/
Data acquired from each PA coil element goes into reconstruction of whole image – reduces imaging time, reduces SNR, reduces uniformity.

Optimizing MRI Protocols 7/27/2005
G.D. Clarke, UT HSC San Antonio 13
Image AccelerationConventional breath-hold cardiac MRI Requires 14 heartbeats.
SENSE breath-hold cardiac MRI
Requires 3 heartbeats.
http://www.mr.ethz.ch/sense/sense_application.html
What We Haven’t Covered
http://www.mr.ethz.ch/3t/patient_5.html
•• MR AngiographyMR Angiography
•• InIn--flow enhancement flow enhancement
•• Magnetization transfer Magnetization transfer contrastcontrast
•• MR Perfusion ImagingMR Perfusion Imaging
•• Dynamic contrast uptakeDynamic contrast uptake
•• PresaturatingPresaturating inversion inversion slabs (FAIR)slabs (FAIR)
•• Functional MRIFunctional MRI
•• EchoEcho--planar imagingplanar imaging
•• Blood oxygen level Blood oxygen level dependent contrastdependent contrast
Summary
Magnetization transfer
RF coil sensitivityChemical shift artifact
Gradient timing (b-value)
Receiver bandwidth
Motion artifact
Preparation pulses
Bo field strengthFSE inter-echo spacing
RF Pulse flip angles & timing
RF Pulse flip angles & timing
Slice thickness
Relaxation timesFOV & matrix sizeFOV & matrix size
ContrastSignal-to-NoiseResolutionSuggested Reading
(In order of increasing complexity)
• MRI: From Picture to Proton McRobbie DW, Moore EA, Graves MJ & Prince MR. Cambridge Univ. Press, 2003; ISBN: 0521523192
• Magnetic Resonance Imaging 3rd ed. Vlaardingerbroek MT, den Boer JA, Luiten A. Springer 2002; ISBN: 3540436812
• Handbook of MRI Pulse Sequences Bernstein MA, King KF, Zhou XJ. Elsevier, 2004; ISBN: 0120928612