overview of vancouver's short-term rental...
TRANSCRIPT

© Host Compliance LLC | 735 Market St, Floor 4, San Francisco, CA 94103 | www.hostcompliance.com
1 City of Vancouver: Short-Term Rental Market Overview
City of Vancouver: Short-Term Rental Market Overview By Host Compliance, LLC
August 2016

© Host Compliance LLC | 735 Market St, Floor 4, San Francisco, CA 94103 | www.hostcompliance.com
2 City of Vancouver: Short-Term Rental Market Overview
I. Introduction
In recent years there has been rapid growth globally in online platforms like Airbnb that allow people to rent their rooms or suites out on a nightly basis, often to tourists. In Vancouver, the number of short-term rental listings continues to grow despite the fact that City zoning regulations only allow licenced hotels and bed and breakfasts to rent rooms for fewer than 30 days per tenancy.
In April 2016, the City of Vancouver began a review of current short-term rental regulations. The purpose of this review is to investigate the short-term rental market in Vancouver, assess positive and negative impacts, and determine whether changes should be made to current regulations. Host Compliance LLC was commissioned to provide data on the short-term rental market in Vancouver, a key input to the policy review. This report summarizes the findings of this work.
2. Background & Methodology
Background As a software, data and consulting services provider exclusively focused on helping local governments overcome the challenges associated with short-term vacation rentals, Host Compliance LLC has developed a set of proprietary data and analytics tools that can provide deep insights into the scale and scope of the short-term rental activity in any community. In this report, we will provide our findings from the City of Vancouver, with the hope that this fact-base will help inform the debate about how short-term rentals should be regulated in the City in the years to come.
General Methodology Host Compliance’s data is collected weekly and we currently collect, aggregate and de-duplicate all listing data, reviews, calendar info and photos across the world’s 16 top short-term rental listing sites1. We estimate this represents 99% of the total vacation rental universe in the City of Vancouver’s jurisdiction.
In order to avoid overstating the scale of the short-term rental phenomena, Host Compliance de-duplicates its data to eliminate duplicate listings (units that are listing more than once on the same listing site or within the same “listing site family”2) and avoid double-counting cross-listed properties (i.e. units that are listed on more than one listing site).
To focus the analysis on properties that are actively being rented, data is segmented into active and passive listings. A listing is considered active if either: a) the listing has received a review in the past 12 months, or b) the listing description or calendar has been updated in the past 12 months.
Host Compliance’s raw, de-duplicated and activity-based data can be segmented and analyzed by a number of parameters including:
1 Airbnb.com, Flipkey.com, HomeAway.com, VRBO.com, VacationRentals.com, travelmob.com,
BedandBreakfast.com, HomeAway.co.uk, OwnersDirect.co.uk, HomeAway.de, Abritel.fr, Homelidays.com, HomeAway.es, Toprural.es, AlugueTemporada.com.br , HomeAway.com.au,Stayz.com.au, Bookabach.co.nz 2 By “listing site family”, we refer to the fact that Expedia owns multiple listing websites such as
HomeAway.com, VRBO.com and VacationRentals.com

© Host Compliance LLC | 735 Market St, Floor 4, San Francisco, CA 94103 | www.hostcompliance.com
3 City of Vancouver: Short-Term Rental Market Overview
• Listing site • Location (as defined by a boundary box or polygon i.e. a neighborhood) • Property type (e.g. apartment, house, condo) • Room type (e.g. entire home, private room, shared room) • Number of bedrooms and bathrooms • Minimum number of nights available for rent • Host Name/ID • Number of reviews • First review date • Last review date • Date the property was first active
The data contained in this report is believed to be highly accurate and representative of the scale and scope of the short-term rental activity in the City of Vancouver as of the date of this report.
Data Used For This Report The data contained in this report was collected during the week of June 20th, 2016. Given that the Vancouver short-term rental is extremely dynamic and listings come, go and change daily, the data in this report should be viewed as a “point in time snapshot” of the market. That said, given the large number of listings in the city, the patterns, themes and ratios outlined in this report are believed to be fully representative of the current state of the market.
Unless noted otherwise, the analysis in this report is based on active listings de-duplicated within and across platforms. Due to rounding, some data lists will total more than 100%.
Team The analysis contained in the report was led by Host Compliance’s team of data and short-term rental experts including: Jeffrey Goodman Jeffrey is an urban planner and considered one of North America’s leading authorities on short-term rentals and how they impact communities. He has previously contracted with both the City of New Orleans and Airbnb, and advised researchers on short-term rentals in range of cities including San Francisco, Pasadena, Portland, New Orleans, and New York. Jeff has spoken about short-term rentals across North America, including at the APA's National Planning Conference. He graduated from Yale College and earned his Masters of Urban Planning from Harvard University. He is the author of a recent featured article in Planning Magazine on the topic of STR regulation. David Marcus David is a Caltech Applied and Computational Math graduate working at the intersection of data science and geospatial information management with eight years of experience building well-architected, scalable software.
Prior to Host Compliance, David founded Routefriend.com, a web-based application for planning trips on buses and trains, serving 1.5 million monthly users.
David's most recent experience was at DwellAware where he served as the Lead Data Scientist for the data analytics company building products to quantify housing risks and costs for businesses and their customers in the residential real estate sector. Prior to DwellAware, David

© Host Compliance LLC | 735 Market St, Floor 4, San Francisco, CA 94103 | www.hostcompliance.com
4 City of Vancouver: Short-Term Rental Market Overview
served in various technical roles at a number of software companies including aboutLife, UrbanMapping, AmericanTowns.com, Nielsen Analytic Consulting and Hewitt Associates.
David earned his BS Degree in Applied & Computational Mathematics at California Institute of Technology and his MA in Anthropology from University of Kent.
Ulrik Binzer Ulrik is the Founder and CEO of Host Compliance, the industry leader in short-term rental monitoring and compliance solutions for local governments. A pioneer in the short-term rental enforcement solution space, Ulrik developed the first short-term rental compliance monitoring tools and now uses his expertise and insights to help local governments across North America implement, monitor and enforce short-term rental regulation. Ulrik previously served in a variety of leadership roles in management consulting, private equity, startups and the military and developed his strategic and analytical skill-set at McKinsey & Company and the Harvard Business School.

© Host Compliance LLC | 735 Market St, Floor 4, San Francisco, CA 94103 | www.hostcompliance.com
5 City of Vancouver: Short-Term Rental Market Overview
3. Global Context
Though people have been renting spare rooms for centuries, the creation of Internet-based
platforms have greatly expanded the availability of short-term rentals worldwide. Backed by
large public companies or venture capitalists, sites like Airbnb.com, VRBO.com,
HomeAway.com and Flipkey.com have expanded rapidly, from under 500,000 short-term rental
listings worldwide in 2008 to over 4,000,000 in 2016. This pace of change - Airbnb added nearly
35,000 listings per month in 2015 - has turned a traditional local resort community industry into
a global marketplace with active listings in more than 34,000 cities around the world. In North
America, the growth has been equally astounding, and in the U.S. and Canada, there are now
more than 2,700 cities with more than 50 active short-term rental listings.

© Host Compliance LLC | 735 Market St, Floor 4, San Francisco, CA 94103 | www.hostcompliance.com
6 City of Vancouver: Short-Term Rental Market Overview
3.1 Platforms Active in Vancouver
Ten of the 16 sites surveyed by Host Compliance were active in the City of Vancouver in June,
2016: Airbnb, HomeAway, VRBO, Flipkey, VacationRentals.com Travelmob, Homelidays,
Abritel, Ownersdirect, and BedandBreakfast.com. Staff identified three more websites with at
least 100 listings in Vancouver: Craigslist, Roomorama and Vancouver Dream Rentals, each
with about 1% of all listings.
The short-term rental market in the City of Vancouver is dominated by Airbnb, which represents
85% of the active listings. The remainder of the market is split between a long list of websites,
with the sites in the HomeAway family (HomeAway.com, VRBO.com, Vacation Rentals.com
etc.) representing 8% of the market, and FlipKey.com representing 4%. These market-share
figures are consistent with the figures from most other large urban cities in North America.
The 3 largest players in the Vancouver short-term rental market are all multi-billion dollar
companies backed by large investors. In the case of Airbnb, the company is currently valued at
© Host Compliance LLC | 735 Market St, Floor 4, San Francisco, CA 94103 | www.hostcompliance.com
7 City of Vancouver: Short-Term Rental Market Overview
USD 30 Billion and backed by major private venture capital investors. The companies in the
HomeAway family were recently acquired by the travel company Expedia (Nasdaq:EXPE) for
close to USD 4 Billion, and FlipKey was sold to Trip Advisor (Nasdaq:TRIP) in 2008 for an
undisclosed amount.
3.2 Listings
3.2.1 Total vs. Active vs. Unique
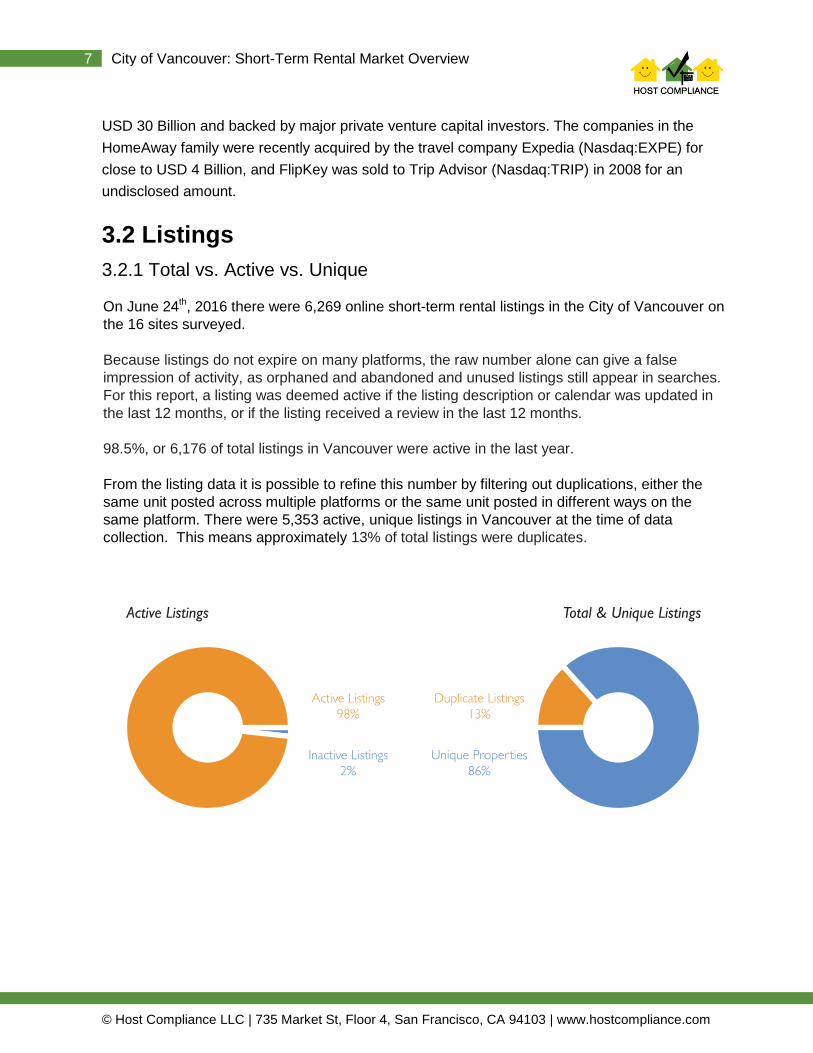
On June 24th, 2016 there were 6,269 online short-term rental listings in the City of Vancouver on
the 16 sites surveyed.
Because listings do not expire on many platforms, the raw number alone can give a false
impression of activity, as orphaned and abandoned and unused listings still appear in searches.
For this report, a listing was deemed active if the listing description or calendar was updated in
the last 12 months, or if the listing received a review in the last 12 months.
98.5%, or 6,176 of total listings in Vancouver were active in the last year.
From the listing data it is possible to refine this number by filtering out duplications, either the
same unit posted across multiple platforms or the same unit posted in different ways on the
same platform. There were 5,353 active, unique listings in Vancouver at the time of data
collection. This means approximately 13% of total listings were duplicates.

© Host Compliance LLC | 735 Market St, Floor 4, San Francisco, CA 94103 | www.hostcompliance.com
8 City of Vancouver: Short-Term Rental Market Overview
3.3 Listing Types
3.3.1 Entire Units vs. Private/Shared Rooms
Most platforms allow hosts to label their units as different kinds of spaces: entire unit, which
could be whole apartments, condos, or houses; private room, a bedroom within a larger unit; or
a shared room, such as a bed in a bedroom or a couch in a living room.
Of the 5,353 active, unique listings, 4,012 or 74% were for entire units - The other 26% of
listings were for either private bedrooms (23%) or shared rooms (2%). A small number of
listings could not be categorized (numbers do not add to 100% due to rounding).
3.3.2 Number of Bedrooms
The number of advertised bedrooms varies considerably. While nearly four hundred listings
claim zero bedrooms, almost a hundred listings have five or more bedrooms, with one listing
even offering an eleven bedroom unit. A large majority of both listings and unique units have
either one bedroom (64.4% of listings) or two bedrooms (19.9%).
For a small number of listings (<.1%), the number of bedrooms are unknown, both here and in
the neighbourhood profiles.

© Host Compliance LLC | 735 Market St, Floor 4, San Francisco, CA 94103 | www.hostcompliance.com
9 City of Vancouver: Short-Term Rental Market Overview
3.4 Listings/Units by Location
Three quarters of Vancouver’s active, unique short-term rental listings are located in four
neighborhoods: Downtown (29%), Mt. Pleasant/Renfrew Heights (14%), East Hastings (15%)
and Kitsilano/Point Grey (15%). The geographic distribution remains largely the same when the
data is segmented by entire units vs. private/shared rooms, although the analysis reveals fewer
private/shared room listings Downtown and more of such units in Mt. Pleasant/Renfrew Heights.
The following tables show this neighbourhood-level analysis in more detail. The ‘% of Total’
refers to the total within each table.

© Host Compliance LLC | 735 Market St, Floor 4, San Francisco, CA 94103 | www.hostcompliance.com
10 City of Vancouver: Short-Term Rental Market Overview
Unique, Active Listings By Neighbourhood
Neighbourhood Listings % of Total
1 - West End, Stanley Park 66 1.2%
2 – English Bay 175 3.3%
3 – Downtown 1578 29.4%
4 – South Granville / Oak 490 9.2%
5 – Kitsilano / Point Grey 824 15.4%
6 – Westside / Kerrisdale 346 6.5%
7 – Marpole 59 1.1%
8 – Mt. Pleasant / Renfrew Heights 746 14.0%
9 – East Hastings 818 15.3%
10 – Southeast Vancouver 251 4.7%
Unique, Active Entire Unit Listings By Neighbourhood
Neighbourhood Listings % of Total
1 - West End, Stanley Park 52 1.3%
2 – English Bay 131 3.3%
3 – Downtown 1320 32.9%
4 – South Granville / Oak 365 9.1%
5 – Kitsilano / Point Grey 606 15.1%
6 – Westside / Kerrisdale 174 4.3%
7 – Marpole 30 0.7%
8 – Mt. Pleasant / Renfrew Heights 584 14.6%
9 – East Hastings 560 14.0%
10 – Southeast Vancouver 190 4.7%
Unique, Active Private Room or Shared Room Listings By Neighbourhood
Neighbourhood Listings % of Total
1 - West End, Stanley Park 14 1.0%
2 – English Bay 44 3.3%
3 – Downtown 258 19.2%
4 – South Granville / Oak 125 9.3%
5 – Kitsilano / Point Grey 218 16.3%
6 – Westside / Kerrisdale 172 12.8%
7 – Marpole 29 2.2%
8 – Mt. Pleasant / Renfrew Heights 162 12.1%
9 – East Hastings 258 19.2%
10 – Southeast Vancouver 61 4.5%

© Host Compliance LLC | 735 Market St, Floor 4, San Francisco, CA 94103 | www.hostcompliance.com
11 City of Vancouver: Short-Term Rental Market Overview
Zone 3: Downtown
At the time of data collection there were 1602 unique properties (1930 total listings). This is 29%
of Vancouver’s total number of short-term rental units, and nearly twice as many units as the
next highest neighbourhood. Around 85% of these listings are for entire units. About 98% or
1903 of all listings have been active in the last year, representing 1578 active, unique units. A
large majority of units are either one or two bedrooms.
Listings and Unique Units by Listing Type
Unique Units Listings
Entire Units 1334 1655
Shared Units 268 275
TOTAL 1602 1930
Activity in Last Year
Unique Units Listings
Active 1578 1903
Unique Units by Bedroom
0 bedrooms 1 bedrooms 2 bedrooms 3 bedrooms 4 bedrooms 5+ bedrooms
129 1016 374 54 1 2

© Host Compliance LLC | 735 Market St, Floor 4, San Francisco, CA 94103 | www.hostcompliance.com
12 City of Vancouver: Short-Term Rental Market Overview
Zone 5: Point Grey/Kitsilano
At the time of data collection there were 830 unique properties (896 total listings). This is 14% of
Vancouver’s total number of short-term rental units, and the third most units of any
neighbourhood. Around 75% of these listings are for entire units. About 98% or 884 of all listings
have been active in the last year. A large majority of units are either one or two bedrooms
though there are several units with 5+ bedrooms available.
Listings and Unique Units by Listing Type
Unique Units Listings
Entire Units 614 669
Shared Units 216 227
TOTAL 830 896
Activity in Last Year
Unique Units Listings
Active 818 884
Unique Units by Bedroom
0 bedrooms 1 bedrooms 2 bedrooms 3 bedrooms 4 bedrooms 5+ bedrooms
47 479 190 72 19 10

© Host Compliance LLC | 735 Market St, Floor 4, San Francisco, CA 94103 | www.hostcompliance.com
13 City of Vancouver: Short-Term Rental Market Overview
Zone 8: Mt. Pleasant / Renfrew
At the time of data collection there were 842 unique properties (943 total listings). This is 15% of
Vancouver’s total number of short-term rental units, and the second most available units of any
neighbourhood. Around 68% of these listings are for entire units. About 97% or 925 of all listings
have been active in the last year. While most units have only a few bedrooms, Zone 8 does
have a larger than average number of 4 and 5+ bedroom units.
Listings and Unique Units by Listing Type
Unique Units Listings
Entire Units 595 645
Shared Units 247 298
TOTAL 842 943
Activity in Last Year
Unique Units Listings
Active 827 925
Unique Units by Bedroom
0 bedrooms 1 bedrooms 2 bedrooms 3 bedrooms 4 bedrooms 5+ bedrooms
50 542 133 74 16 8
© Host Compliance LLC | 735 Market St, Floor 4, San Francisco, CA 94103 | www.hostcompliance.com
14 City of Vancouver: Short-Term Rental Market Overview
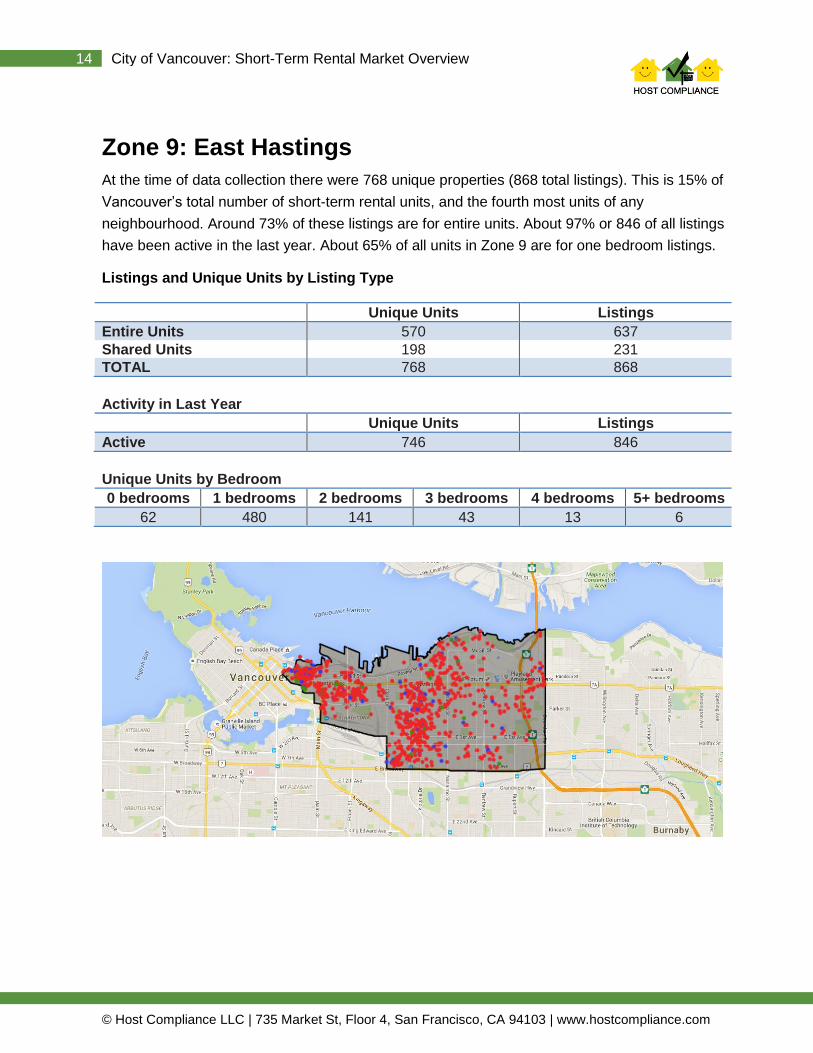
Zone 9: East Hastings
At the time of data collection there were 768 unique properties (868 total listings). This is 15% of
Vancouver’s total number of short-term rental units, and the fourth most units of any
neighbourhood. Around 73% of these listings are for entire units. About 97% or 846 of all listings
have been active in the last year. About 65% of all units in Zone 9 are for one bedroom listings.
Listings and Unique Units by Listing Type
Unique Units Listings
Entire Units 570 637
Shared Units 198 231
TOTAL 768 868
Activity in Last Year
Unique Units Listings
Active 746 846
Unique Units by Bedroom
0 bedrooms 1 bedrooms 2 bedrooms 3 bedrooms 4 bedrooms 5+ bedrooms
62 480 141 43 13 6

© Host Compliance LLC | 735 Market St, Floor 4, San Francisco, CA 94103 | www.hostcompliance.com
15 City of Vancouver: Short-Term Rental Market Overview
3.5 Listing Per Host
Using both published names of hosts in online profiles and the unique id numbers given to hosts
on certain platforms, it is possible to get a sense of how many listings each hosts is managing.
These numbers are not perfect for a number of reasons - hosts posting under multiple names on
one platform or across several, for example - but give a general sense of the shape of the
marketplace.
There are at least 4393 hosts in Vancouver, with a large majority (83%) managing only one
listing. Another 10% operate two listings, and the remaining 7% of hosts have three or more
listings. A small number of hosts (around 25) control more than 10 listings each. The largest
number of listings by one host is at least 28.