overview of the temporary assistance for needy families...
TRANSCRIPT

Overview of the TemporaryAssistance for Needy Families
Program in Maryland
DEPARTMENT OF LEGISLATIVE SERVICES 2017

Overview of the Temporary Assistance for Needy Families Program
In Maryland
Department of Legislative Services Office of Policy Analysis
Annapolis, Maryland
October 30, 2017

ii
Contributing Staff
Writer(s)
Tonya D. Zimmerman
Reviewers
Jennifer B. Chasse Simon G. Powell
Administrative Support
Kamar Merritt Maureen R. Merzlak
For further information concerning this document contact:
Library and Information Services Office of Policy Analysis
Department of Legislative Services 90 State Circle
Annapolis, Maryland 21401
Baltimore Area: 410-946-5400 ● Washington Area: 301-970-5400 Other Areas: 1-800-492-7122, Extension 5400
TTY: 410-946-5401 ● 301-970-5401 TTY users may also use the Maryland Relay Service
to contact the General Assembly.
Email: [email protected] Home Page: http://mgaleg.maryland.gov
The Department of Legislative Services does not discriminate on the basis of age, ancestry, color, creed, marital status, national origin, race, religion, gender, gender identity, sexual orientation, or disability in the admission or access to its programs, services, or activities. The Department’s Information Officer has been designated to coordinate compliance with the nondiscrimination requirements contained in Section 35.107 of the Department of Justice Regulations. Requests for assistance should be directed to the Information Officer at the telephone numbers shown above.

'Varren G. Deschenaux Executive Director
DEPARTMENT OF LEGISLATIVE SERVICES OFFICE OF THE EXECUTIVE DIRECTOR
MARYLAND GENERAL ASSEMBLY
October 30, 2017
The Honorable Thomas V. Mike Miller, Jr., President of the Senate The Honorable Michael E. Busch, Speaker of the House of Delegates Members of the General Assembly
Ladies and Gentlemen:
The attached report, titled Overview of the Temporary Assistance for Needy Families Program in Maryland, provides a review of the Temporary Assistance for Needy Families (TANF) program. This report responds to a question raised during the 201 7 session in the House of Delegates Health and Government Operations Committee regarding the impact of the transition from the Aid to Families with Dependent Children program to the T ANF block grant.
The report provides information on T ANF funding, spending, and fund balance. The report also describes eligibility requirements, work requirements, cash assistance caseloads, benefit levels, and outcomes after leaving cash assistance.
This report was prepared by Tonya D. Zimmerman, under the general direction of Jennifer B. Chasse and Simon G. Powell. Maureen R. Merzlak created the maps used in the report. Kamar Merritt provided administrative support. Your questions and comments are welcomed.
WGD/JBC:SGP/km
Sincerely,
~~lA
lll
Wanen G. Deschenaux Executive Director
Legislative Services Building· 90 State Circle ·Annapolis, Maryland 21401-1991 410-946-5500 ·FAX 410-946-5508 · TIY 410-946-5401 301-970-5500 ·FAX 301-970-5508 · TIY 301-970-5401
Other areas in Maryland 1-800-492-7122

IV

v
Contents
Letter of Transmittal ...................................................................................................................... iii
Executive Summary ...................................................................................................................... vii
Chapter 1. Introduction ............................................................................................................1 Personal Responsibility and Work Opportunity Reconciliation Act .......................1 Basics .......................................................................................................................1
Chapter 2. Temporary Assistance for Needy Families Funding and Spending ..................3 Funding ....................................................................................................................3 Balance .....................................................................................................................6 Spending ...................................................................................................................9
Chapter 3. Eligibility and Other Requirements ...................................................................19 Eligibility Requirements ........................................................................................19 Work-related Requirements ...................................................................................25 Benefit Limits ........................................................................................................32
Chapter 4. Temporary Cash Assistance Caseload ...............................................................35 Cases ......................................................................................................................35 Reasons for Case Closure .......................................................................................43 Case Closure Due to Sanctions ..............................................................................45
Chapter 5. Benefit Levels .......................................................................................................49 Cash Assistance Grant Levels ................................................................................49
Chapter 6. Outcomes for Temporary Cash Assistance Recipients and Former Recipients .....................................................................................................53
Job Placement and Retention for Recipients .........................................................53 Outcomes for Recipients After Exit .......................................................................55 Comparison of Maryland Leaver Outcomes with Leavers in Other States ...........63
Chapter 7. Conclusions ...........................................................................................................67
Appendix A ...................................................................................................................................69

vi

vii
Executive Summary
Recently, there have been discussions at
the federal level about changing some benefit programs, particularly Medicaid and the Supplemental Nutrition Assistance Program (SNAP), from entitlement programs to block grant programs. At the same time, the Temporary Assistance for Needy Families (TANF) program, a block grant program that replaced the former entitlement Aid to Families with Dependent Children (AFDC) program, recently reached its twentieth anniversary. This report is designed to describe the impact of changing cash assistance benefits from an entitlement program to a block grant and how TANF and TANF-funded programs have fared since 1997 under a block grant structure. More specifically, the report (1) describes TANF funding and details the State’s TANF balance; (2) reviews TANF expenditures in Maryland on both core and noncore areas; (3) describes income, asset, work-related, and other eligibility requirements for TANF-funded programs, benefit limits and restrictions, as well as sanctions for noncompliance; (4) provides Maryland’s program caseload and benefit levels; and (5) discusses available information on outcomes for TANF recipients, including job placement and retention, median earnings, and returns to public assistance. The primary focus of the report is on Maryland; however, the report contains several comparisons with other states where available.
In 1996, the Personal Responsibility and Work Opportunity Reconciliation Act (PRWORA) replaced AFDC and other related programs with the TANF block grant. The change in the program resulted in dramatic changes in the caseload and
program requirements while creating additional flexibility in spending. The Department of Human Services (DHS) administers TANF in Maryland. TANF is authorized to be used for four broad purposes: (1) providing assistance to needy families so that children can be cared for in their homes; (2) reducing the dependence of needy parents by promoting job preparation, work, and marriage; (3) preventing and reducing out-of-wedlock pregnancies; and (4) encouraging the formation and maintenance of two-parent families. In Maryland, the cash assistance portion of TANF is known as Temporary Cash Assistance (TCA), and the job training program is known as the Work Opportunities Program. TANF Funding
The primary funding stream of TANF is the basic block grant, known as the State Family Assistance Grant. State funding amounts under the basic block grant are derived from spending on the predecessor programs. Basic block grant spending across states, tribes, and territories has annually totaled $16.5 billion. Maryland’s share has generally been $229.1 million, or 1.4% of the total TANF grants to states, tribes, and territories. The value of the grant has not increased over time with inflation and, as a result, has lost more than 30% of its original value.
The Consolidated Appropriations Act of
2017 effectively reduced the basic block grants in each state by 0.33%. As a result, in federal fiscal 2017 and 2018, Maryland will

viii
receive $228.3 million. The federal fiscal 2018 budget proposed by President Donald J. Trump would reduce states’ block grants by 10.0% (a reduction of nearly $23.0 million in Maryland).
A second key funding source from
TANF in recent years is the Contingency Fund. This fund is designed to assist in economic downturns by making funds available to states experiencing certain conditions (including increased food assistance recipients or unemployment rates). Maryland has received these funds in each year since fiscal 2009 and received more than $20.0 million annually since fiscal 2013. The proposed federal fiscal 2018 budget would eliminate this fund source.
TANF Spending The flexibility allowed by the block grant structure provides the opportunity to invest TANF in a variety of areas. Maryland’s use of TANF throughout the program’s history has included home visiting programs, child welfare/foster care maintenance payments, and administrative areas of DHS. The flexibility in the use of funds provided allows TANF to be used in some ways that reduce general fund needs, including those that result from challenges associated with other federal fund sources.
This broad use of TANF is acceptable in times when caseloads are relatively low, and funds are not needed for cash assistance. However, as the caseloads increase, a broad use of funds is not sustainable. Maryland had to pull back from some of the broader uses of funds after fiscal 2011 when Maryland overspent available TANF due to rising caseloads and reduced availability of general funds. As a result, Maryland ended its TANF funding for child care subsidies
among other programs. TANF, however, is still used broadly within DHS extending beyond core areas to include foster care and child welfare. Maryland ran a deficit in TANF from fiscal 2011 through 2016, which it covered by borrowing from the next year’s grant. However, in fiscal 2017, DHS reported a small but positive TANF balance for the first time since fiscal 2010.
While Maryland has used TANF funding broadly, the majority of its funding in most years is spent on core programs. The core areas of TANF spending are cash assistance and those programs that assist recipients in exiting cash assistance (job training programs and child care assistance). However, as noted, Maryland has provided no TANF for child care assistance in recent years due to funding challenges. Eligibility Requirements In addition to flexibility in the use of TANF funds, states also have flexibility in setting a variety of program and eligibility requirements. States choose to set income eligibility in a variety of ways and at a variety of income levels. According to the Urban Institute’s Welfare Rules Databook, in July 2015, the maximum income an individual could have in Maryland and qualify for TCA was $795, the twenty-ninth highest among states. However, Maryland is one of only eight states with no asset limit for recipients. Having no asset limit allows recipients to create savings, if possible in their financial situation, without worrying about losing benefits. The PRWORA also restricted eligibility for both TANF and federal SNAP (formerly known as food stamps) benefits for individuals with prior drug convictions. However, states had the flexibility to modify

ix
the required lifetime ban. Most states have modified this ban, including Maryland. Chapters 792 and 793 of 2017 further modified the ban to apply only to certain types of convictions (drug king pin and volume dealers). Maryland, along with other states, also have more general substance use screening requirements. While Maryland screens applicants and may refer individuals for testing and treatment, sanctions are only applied if an individual fails to comply with referrals, not for failed tests. In fiscal 2016, 32.8% of those referred for further assessment did not show, and 18.0% of those referred for treatment did not show. However, these are relatively small portions of the total applicants and recipients, as between fiscal 2014 and 2016, 4.0% to 6.0% of applicants that were screened, screened positive for substance use and, therefore, would have been subject to additional referrals. Work Requirements A key change from AFDC to TANF was the imposition of work requirements. These rules require individuals to complete a minimum of 30 hours per week of work activities. Federal rules also prescribe the activities that may be counted and when they may be counted. Despite the federal rules, states have flexibility in establishing their own program, including creating stricter requirements or counting additional activities. Ultimately, state flexibility in establishing these programs is limited in that only those activities (and in the hours allowed) that comply with federal rules are counted towards the required state work participation rate.
States are required to meet a 50.0% work participation rate for all families. The actual rate individual states must meet may be
reduced. For example, the state work participation rate may be reduced based on a credit for caseload reductions made compared to federal fiscal 2005. In federal fiscal 2015, Maryland’s adjusted work participation rate was 21.0%. Maryland’s actual work participation rate was 51.5%. Only four states failed to meet the required work participation rate. One way to ensure compliance with individual recipient requirements, which allows states to meet the requirements, is the imposition of sanctions for noncompliance. Maryland is 1 of 14 states that reduces the entire benefit for the first sanction and 1 of 18 states that reduces the entire benefit for the most severe sanction. Slightly more than half of states (28) close the case for the most severe sanction. The sanction lengths vary significantly among states, but Maryland has a relatively lighter sanction length. For example, individuals must be in compliance for only one month to have a sanction removed for Maryland’s most severe sanction. Six states permanently sanction individuals for the most severe sanction. Lifetime Limits The PRWORA also imposed a 60-month lifetime limit on benefit receipt under TANF. As of July 2015, most states continued to set the limit at 60 months; however, 12 states impose a shorter limit and 1 state (Massachusetts) has no limit. Actual state practices vary in terms of enforcement of these limits. For example, while Maryland has a 60-month limit officially, individuals throughout the life of the program have been able to retain benefits through a “hardship exemption.” Under TANF, 20% of the caseload may continue receiving benefits beyond the lifetime limit under a “hardship exemption.” In fiscal 2016, the annual

x
average number of cases in Maryland headed by adults that received assistance for more than 60 months was 2,068, well under the 20% cap on hardship exemptions. TCA Cases Maryland, consistent with national trends, experienced significant reductions in the TCA caseload following the transition from AFDC to TANF. Between fiscal 1997 and 2000, the average monthly number of TCA recipients decreased by 54.9% (from 173,530 to 78,294). The number of recipients continued to decline until a low point in fiscal 2007. During the Great Recession and immediate recovery, the average monthly number of recipients increased and reached its highest point since fiscal 2002 in 2012 (72,413). The average number of recipients has declined again over the last several years and, in fiscal 2017, was the second lowest in program history (50,901). As this indicates, the program has generally responded as expected based on economic conditions (increasing caseloads during economic downturns and declining caseloads in better economic periods). Despite this, the growth in the caseload was not as large or as extended as occurred in other public assistance programs, such as SNAP. The TCA caseload can be divided into two main groups: (1) the core caseload and (2) cases headed by an employable adult. The core cases include child-only cases, cases headed by individuals with disabilities, caretaker relatives, and other cases exempt from work requirements. Core cases are not generally expected to transition from TCA into work. Over time, one would expect to see fewer employable cases, as work eligible individual’s transition into employment, and
a larger share of cases that are core cases. This pattern has generally occurred, except in periods impacted by the Great Recession and in 2016 due to the impacts of a policy change regarding exempt cases. However, in no year since 2001, were fewer than 30% of the cases in the employable category. Grant Levels State cash assistance grant levels have generally not increased, after accounting for inflation, since the beginning of TANF. According to the Welfare Rules Databook, in 1996, the maximum benefit for a family of three ranged from $120 in Mississippi to $923 in Alaska. In 2015, the maximum benefit for a family of three ranged from $170 in Mississippi to $923 in Alaska. In 2015, 17 states had the same maximum benefit for a family of three as the state did in 1996. Six states had a lower maximum benefit for a family of three in 2015 than the state did in 1996. Only 2 states (Maryland and Wyoming) had a maximum benefit for a family of three that was higher in 2015 on an inflation adjusted basis than the maximum benefit in 1996. Maryland’s maximum benefit for a family of three in 2015 ($636) was the eighth highest among all states. Maryland’s benefit has kept up with inflation in part due to the method of calculation. Section 5-316 of the Human Services Article requires the Governor to include in the budget sufficient funds to provide a TCA benefit, when combined with federal SNAP benefits, equal to at least 61% of the State minimum living level (MLL). The MLL is adjusted annually for inflation, allowing the benefit to keep up with inflationary increases. While the TCA benefit, as a result of the MLL, has kept up with inflation, 61% of the MLL in fiscal 2017 equates to 68% of the federal poverty level.

xi
Outcomes Annually, the University of Maryland (UM) School of Social Work presents a report on those leaving TCA (the Life After Welfare series). In the most recent report, UM studied those that left welfare between January 2004 and March 2016 grouping leavers into three cohorts (mid-2000s recovery, Great Recession era, and Great Recession recovery leavers). The data shows that a higher share of individuals exiting TCA worked at some point in the year after exit than the year prior to entering TCA. However, the increase between these two periods varies between the cohorts and shows that economic conditions upon exit impact the ability to work after exit. The Great Recession era leavers had the lowest share of leavers working at some point in the year after exit (59.4%) compared to the other two cohorts. This cohort also had the lowest median annual earnings in the year after TCA exit ($7,585). Both Great Recession and Great Recession recovery leavers had similar shares of leavers return to TCA within the first 12 months of exit (around 32%). While return rates for TCA are relatively low and receipt of TCA declines over time, rates of receipt of other public benefits remains high even five years after exit. Five years after exit, 67.1% of leavers receive SNAP benefits, and 80.6% receive Medicaid benefits. This indicates that households may have sufficient income to remain off of welfare, but many remain precariously financed with incomes low enough to remain eligible for other benefits. Limited comparisons of outcomes to other states are available. Few studies in other states examine welfare leavers in a
similar way as the Life After Welfare series. However, in comparisons with studies in Vermont and Colorado, it appears that leavers from TCA in Maryland have lower rates of employment and income than these states. However, Maryland and Vermont had similar rates of receipt of Medicaid and SNAP one year after exit. Conclusions The structure of the TANF block grant provided flexibility for states in designing many aspects of the welfare program and use of federal funds. In Maryland, the majority of federal funds continue to be used for core programs. However, a substantial share of funding is used for noncore areas such as child welfare/foster care. This funding often fills needs that otherwise would have required general funds. Diverting the funds in this way limits the ability to invest funds in programs to further assist individuals to transition from TCA. This becomes even more important as the block grant loses value because it includes no adjustment for inflation. Maryland’s cash assistance benefits have kept pace with inflation, largely due to statutory requirements related to the benefit level. However, Maryland is one of only two states that have had benefits keep pace with inflation. In fact, cash assistance benefits have decreased in six states (in nominal dollars) between 1996 and 2015. The flexibility of the block grant and the need to make choices about the use of funds may lead some states to make difficult choices about the grant level. Outcome data available through the Life After Welfare series show that a higher share of TCA leavers work in the year after exit than prior to entering TCA. However, the

xii
economic conditions at the time of exit appear to matter in employment and earnings outcomes. In addition, while few leavers return to TCA (generally less than one-third within 12 months), the receipt of other public assistance after exit is high. Even five years after exit, more than half of leavers are receiving Medicaid and federal SNAP benefits. This indicates that the financial situation remains precarious for leavers even a significant period of time after exit.

1
Chapter 1. Introduction Introduction
Recently, there have been discussions at the federal level about changing some benefit programs, particularly Medicaid and the Supplemental Nutrition Assistance Program, from entitlement programs to block grant programs. At the same time, the Temporary Assistance for Needy Families (TANF) program, a block grant program that replaced the former entitlement Aid to Families with Dependent Children (AFDC) program, recently reached its twentieth anniversary. This report describes the impact of changing cash assistance benefits from an entitlement program to a block grant and how TANF and TANF-funded programs have fared since 1997 under a block grant structure. More specifically, the report (1) describes TANF funding and details the State’s TANF balance; (2) reviews TANF expenditures in Maryland on both core and noncore areas; (3) describes income, asset, work-related, and other eligibility requirements for TANF-funded programs, benefit limits and restrictions, as well as sanctions for noncompliance; (3) provides Maryland’s Temporary Cash Assistance program caseload and benefit levels; and (4) discusses available information on outcomes for TANF recipients, including job placement and retention, median earnings, and returns to public assistance. The primary focus of the report is on Maryland; however, the report contains several comparisons with other states where available. Personal Responsibility and Work Opportunity Reconciliation Act
In 1996, the Personal Responsibility and Work Opportunity Reconciliation Act
(PRWORA) replaced the federal entitlement AFDC program along with other related programs with the state-administered TANF block grant. Under AFDC, state expenditures were matched with federal expenditures. Thus, if state expenditures increased due to caseload increases, there was a corresponding increase in federal funds. In contrast, through several re-authorizations at the federal level, the TANF block grant has remained level-funded since the program’s creation and has only a limited mechanism to respond to economic cycles. In Maryland, the Department of Human Services is the State administrator of the program. Basics The PRWORA replaced three programs – AFDC, the Job Opportunities and Skills Training Program, and Emergency Assistance – with TANF. Under AFDC, an individual eligible for the program was entitled to benefits with limited requirements. Under TANF, cash assistance is intended to be time limited with a five-year lifetime limit for benefits. States can continue paying benefits beyond five years under a hardship exemption for up to 20% of the caseload or through solely state-funded programs. TANF funds may be used for one of four purposes:

2 Overview of the Temporary Assistance for Needy Families Program in Maryland
• providing assistance to needy families so that children can be cared for in their homes;
• reducing the dependence of needy parents by promoting job preparation, work, and marriage;
• preventing and reducing out-of-wedlock pregnancies; and
• encouraging the formation and maintenance of two-parent families.
TANF may also be used for items authorized under the prior federal law. A maximum of 30% of TANF is authorized to be transferred to a combination of the Social Services Block Grant (SSBG) and the Child Care and Development Fund. However, the transfer to SSBG is limited to a maximum of 10%.
States must also spend 80% of the amount of nonfederal funds that the state spent in federal fiscal 1994 on AFDC and related programs under Maintenance of Effort (MOE) requirements. However, if the state meets its work participation requirements, the MOE requirement is reduced to 75% of prior expenditures. Maryland’s MOE requirement, as a result of meeting the work participation rate, is approximately $177 million annually. Under AFDC, states had some flexibility regarding eligibility criteria and benefit levels. However, under a TANF block grant, states have more flexibility in setting eligibility limits, benefit levels, and certain other program elements. Some eligibility requirements are included in the federal law under TANF, such as requirements to cooperate with child support enforcement, the lifetime benefit limit, and requirements regarding drug-related felonies (although states are able to opt out of lifetime bans). Recipients are also subject to work requirements, though certain populations are exempt. States are required to sanction families for failure to comply with requirements. However, states are able to set stricter requirements in some areas than are required under federal law. For example, in July 2015 (the most recent date for which information is available), 14 states set a lifetime limit on assistance receipt that is lower than 60 months, including one state (Connecticut) with a lifetime limit as low as 21 months. A number of these eligibility, work, and lifetime limit requirements are discussed in more detail later in this report. TANF must be periodically re-authorized by the federal government. TANF’s most recent re-authorization occurred in the Deficit Reduction Act of 2005. This re-authorization ended in federal fiscal 2010 (September 30, 2010). Since that time, TANF has operated on a series of temporary extensions, the most recent of which was approved on May 5, 2017, as part of the Consolidated Appropriations Act of 2017. The current extension lasts through federal fiscal 2018 (September 30, 2018).

3
Chapter 2. Temporary Assistance for Needy Families Funding and Spending
Funding Basic Block Grant The Personal Responsibility and Work Opportunity Reconciliation Act (PRWORA) established the rules for state grant amounts under Temporary Assistance for Needy Families (TANF) based on the federal share of expenditures in the predecessor programs. States could receive the greater of (1) the average of the federal share of expenditures from federal fiscal 1992 through 1994; (2) the federal share of expenditures in federal fiscal 1994; or (3) the federal share of expenditures in federal fiscal 1995. The basic block grant to all states, territories, and tribes has totaled $16.5 billion annually. Maryland annually receives $229.1 million, or 1.4%, of the total TANF basic block grant to states, territories, and tribes. State grants range from $21.8 million (Wyoming) to $3.7 billion (California).1 Maryland has received a base block grant amount of $229.1 million in every year of the program with the exception of fiscal 1997 (the first year of the program) and 2017. In fiscal 1997, Maryland received $183.0 million. Since fiscal 1998 (the first year in which Maryland received $229.1 million annually), the value of the block grant in inflation-adjusted dollars has decreased by more than 30.0%. Maryland, like all states, experienced a reduction to its base block grant in federal fiscal 2017 and will experience a reduction again in federal fiscal 2018 compared to prior years due to language in the Consolidated Appropriations Act of 2017, which reserves 0.33% of base block grant funds for research, technical assistance, and evaluation. According to the U.S. Department of Health and Human Services (HHS), Maryland’s base block grant will be reduced to $228.3 million in each year. The reduction nationwide is $54.4 million and further exacerbates the lost value of the block grant since the early years of the program. The federal fiscal 2018 budget proposed by President Donald J. Trump would make a more significant cut to the basic block grant. The budget proposal would reduce the basic block grant by 10%, which would be a reduction of $22.9 million in Maryland. The reason for the reduction is that the budget proposes to eliminate the Social Services Block Grant (SSBG), and since 10% of TANF is authorized to be transferred to that grant, without the SSBG, the funds are viewed as unnecessary. This type of reduction would likely have substantial consequences on the programs and cash assistance funded through TANF. It is unclear what the specific impact of this reduction on TANF programs would be. Maryland (like other states) would have to make decisions on how to allocate the reduction among TANF-funded programs. These choices could lead to impacts on benefits but could also instead reduce TANF spending in other noncore areas such as child welfare
1 Cumulatively, tribes receive $193.2 million. The territories of Puerto Rico ($71.6 million), Guam ($3.5 million), and the Virgin Islands ($2.8 million) also receive an allocation from the basic block grant.

4 Overview of the Temporary Assistance for Needy Families Program in Maryland
or administrative expenditures. A discussion of current uses of TANF is included later in this report. Contingency Funds
While the amount of funding from the block grant has remained unchanged, the PRWORA contained a limited mechanism to account for economic downturns. Specifically, a contingency fund is available to states that meet certain conditions: • an unemployment rate of at least 6.5%, that is 10.0% higher than in a three-month period
compared to the same three-month period in either of the two prior years; or
• Supplemental Nutrition Assistance Program (SNAP) (formerly known as food stamps) caseload over the most recent three-month period is at least 10.0% higher than the caseload in the corresponding period in fiscal 1994 or 1995.
To receive contingency funds, states must increase Maintenance of Effort (MOE) spending to 100% of the amount of the nonfederal funding that it spent on the predecessor programs in federal fiscal 1994. States must also match the federal funds received with an equal amount of MOE spending. The Congressional Research Service notes that the original contingency fund was depleted in early federal fiscal 2010 but that Congress has appropriated funds for this purpose since that time. The availability of these funds in the future is dependent on continued appropriations. Maryland has received contingency funds in each year since fiscal 2009, due to continuing to meet the SNAP caseload condition. Exhibit 2.1 provides information on the amount of contingency funds received by year, since fiscal 2009. Since fiscal 2014, Maryland’s contingency fund award has equaled about 10% of the State’s basic block grant.

Chapter 2. Temporary Assistance for Needy Families Funding and Spending 5
Exhibit 2.1 Contingency Funds Received by Maryland
Fiscal 2009-2017 ($ in Millions)
FY Amount Received
2009 $38.183 2010 8.561 2011 11.455 2012 19.928 2013 20.036 2014 22.749 2015 25.522 2016 22.499 2017 24.289 Total $193.23
Source: Department of Human Services The federal fiscal 2018 budget proposed by President Trump would eliminate funding for the contingency fund. Maryland (along with approximately 19 other states) has come to rely on this funding to supplement its basic block grant through most of the last decade. Emergency Funds The American Recovery and Reinvestment Act of 2009 created a temporary pool of emergency funds available for TANF totaling $5 billion. The authorization extended only through federal fiscal 2010 (September 30, 2010). Funds were available to reimburse jurisdictions up to 80% of the cost of increased spending for basic assistance, nonrecurrent short-term benefits, or subsidized employment. Jurisdictions had to show increased spending in a quarter over the same quarter in a base year (either federal fiscal 2007 or 2008). In total, Maryland received approximately $67 million in emergency funds, which were spent from fiscal 2009 through 2011. Other Funds The PRWORA also established sources of additional funding: (1) a supplemental grant for states with high population growth and low welfare spending totaling $800 million over four years; (2) a federal loan fund totaling $1.7 billion; (3) performance bonuses totaling $1.0 billion over five years; and (4) bonuses to reduce the number of out-of-wedlock births and abortions in the amount of $100 million annually. Of these four additional funding streams, the

6 Overview of the Temporary Assistance for Needy Families Program in Maryland
Department of Human Services (DHS) reports having received only an out-of-wedlock birth bonus of $25 million in fiscal 2005. Balance Under the block grant, states are able to retain funds for future use that are unspent during a given year. As a result, states can build balances depending on caseload trends and spending plans. These balances can be used as a buffer in the event that caseload increases require additional funds to be made available to support those eligible for benefits. However, the balance and additional funds can also be used to increase spending in certain other traditional spending areas or to spend in qualifying but noncore areas. Information about the TANF balance in Maryland prior to fiscal 2005 is unavailable. However, balance information beginning with fiscal 2005 is shown in Exhibit 2.2. Spending data shown in this exhibit may not match the spending detail described elsewhere in the report. DHS reports that certain spending, particularly TANF spending, transferred to other agencies is not always recorded as TANF in budget detail. DHS still captures this information in balance information. At the beginning of fiscal 2005, a limited balance was available (less than $1.5 million); however, by the close of fiscal 2005, DHS built a balance of $72.5 million. The increase in the balance resulted in part from the previously noted out-of-wedlock birth bonus received by Maryland in that year as well as a cancellation of a prior obligation ($17.1 million). The balance reached a high point at the close of fiscal 2006 ($84.6 million), before the balance began to decline. With the high balance, the uses of TANF within DHS in areas outside of the core TANF programs in the Family Investment Administration (FIA) began to increase. The decline of the balance accelerated during the Great Recession, in part due to caseload increases, but also in part due to the continued expansion of spending in noncore areas. For example, in fiscal 2010, $43.7 million of TANF was provided to the Maryland Higher Education Commission for scholarship programs. By the end of fiscal 2010, the balance had fallen to $11.7 million. DHS began to run a deficit in the TANF program by the end of fiscal 2011 and ran a deficit continuously through fiscal 2016. In federal fiscal 2015, according to data reported by HHS, Maryland was 1 of 15 states with no (or a nominal) TANF balance.

Chapter 2. Tem
porary Assistance for N
eedy Fam
ilies Funding and Spending
7
Exhibit 2.2
TANF Balance Fiscal 2005-2017
($ in Millions)
2005
Actual 2006
Actual 2007
Actual 2008
Actual 2009
Actual 2010
Actual 2011
Actual 2012
Actual 2013
Actual 2014
Actual 2015
Actual 2016
Actual 2017
Actual
Beginning Balance $1.4 $72.5 $84.6 $81.2 $43.5 $49.1 $11.7 -$49.6 -$45.0 -$13.1 -$6.8 -$16.0 -$20.4
TANF Grant 229.1 229.8 229.1 229.1 229.1 229.1 229.1 229.1 229.1 229.1 229.1 229.1 228.3 Penalty -1.6 Out-of-wedlock Birth Bonus 25.0
Contingency TANF 38.2 8.6 11.5 19.9 20.0 22.7 25.5 22.5 24.2
Emergency Fund 18.0 32.8 16.2
Canceled Encumbrances and Caseload Reduction 17.1 2.5 2.5 3.9 5.3
Available Funding (Balance + Income) $272.6 $302.3 $314.6 $312.8 $332.7 $319.6 $268.5 $199.4 $209.4 $238.8 $247.9 $235.6 $232.2
DHS Appropriation (Excluding Child Care Spending) -$180.6 -$187.9 -$203.6 -$239.4 -$265.9 -$239.0 -$295.9 -$242.6 -$241.8 -$245.5 -$263.8 -$256.0 -$228.4
Local Management Boards -19.5 -19.5 -14.9 -14.9 -7.3 -7.3 -7.3 -0.5

8 O
verview of the Tem
porary Assistance for N
eedy Fam
ilies Program in M
aryland
2005
Actual 2006
Actual 2007
Actual 2008
Actual 2009
Actual 2010
Actual 2011
Actual 2012
Actual 2013
Actual 2014
Actual 2015
Actual 2016
Actual 2017
Actual
MSDE: Healthy Families/Home Visiting Program -4.6 -4.6 -4.6 -4.6 -4.6 -1.3
Child Care Subsidy Program -10.3 -10.3 -10.3 -5.9 -13.3 -10.3 0.0
MSDE: Division of Business Services 0.0 0.0
MSDE: Rehabilitative Services -0.1 0.0 0.0
MHEC Scholarship -43.7 Total Expenditures -$200.1 -$217.7 -$233.4 -$269.3 -$283.6 -$307.9 -$318.1 -$242.6 -$241.8 -$245.5 -$263.8 -$256.0 -$228.4
Ending Balance $72.5 $84.6 $81.2 $43.5 $49.1 $11.7 -$49.6 -$45.0 -$13.1 -$6.8 -$16.0 -$20.4 $3.7
DHS: Department of Human Services MHEC: Maryland Higher Education Commission MSDE: Maryland State Department of Education TANF: Temporary Assistance for Needy Families Source: Department of Human Services

Chapter 2. Temporary Assistance for Needy Families Funding and Spending 9
DHS initially reduced the deficit by eliminating spending of TANF outside of the department, which brought spending more in line with revenue. However, DHS has also covered these deficits by using a portion of the next year’s grant to pay current bills. Actions taken by the General Assembly in the 2017 session attempted to assist the department in reducing the deficit. Specifically, the Budget Reconciliation and Financing Act of 2017 required expected surplus available in the Assistance Payments program to be used to reduce the TANF deficit. In addition, the General Assembly added budget bill language capping the level of TANF spending to the level in the budget as introduced (near the level of anticipated revenue during budget development), which was intended to reduce the likelihood of an increase in the deficit by overspending the available revenue. However, given the change in availability of the TANF block grant expected in fiscal 2018 due to the Consolidated Appropriations Act of 2017, the fiscal 2018 budget still potentially slightly overspends the revenue available. At the close of fiscal 2017, DHS had eliminated the deficit and had a TANF balance of $3.7 million.
Spending In total, Maryland has spent $4.9 billion of TANF funds through fiscal 2017.2 The largest share of spending occurred on Assistance Payments (43.8%) and the Work Opportunities Program (14.3%). Exhibits 2.3 and 2.4 summarize the distribution of TANF spending in Maryland in fiscal 2007 and 2017 to provide a comparison of the use of TANF funds in different years. As shown in these exhibits and discussed previously, TANF spending changed over time, in part due to the TANF deficit that reduced the availability of funds. In fiscal 2007, 12.0% of TANF was spent outside of DHS on child care, the Governor’s Office for Children and the Children’s Cabinet Interagency Fund, and the Maryland State Department of Education (MSDE). Conversely, in 2017, no TANF funds were spent outside of DHS. Assistance Payments accounted for 36.0% of TANF spending in fiscal 2007 but 42.5% in fiscal 2016.
2 TANF spending data is reported based on information provided in the annual Governor’s Budget Books, with the exception of fiscal 1997 and 2017. Fiscal 1997 and 2017 data were provided by DHS. DHS notes that at times, funds provided to other agencies are not reported as TANF spending in the Governor’s Budget Books. Therefore, the data does not capture all TANF spending in all years.

10 Overview of the Temporary Assistance for Needy Families Program in Maryland
Exhibit 2.3
TANF Spending Fiscal 2007
CWS: Child Welfare Services DHS: Department of Human Services FIA: Family Investment Administration IT: information technology TANF: Temporary Assistance for Needy Families Source: Governor’s Budget Books
Assistance Payments,
36%
Work Opportunities,
14%
Child Care Spending,4%
Local FIA(Other Eligibility),
10%
Local CWS,10%
Foster Care Maintenance
Payments,1%
IT,2%
Other DHS,15%
Non-DHS Spending,8%

Chapter 2. Temporary Assistance for Needy Families Funding and Spending 11
Exhibit 2.4
TANF Spending Fiscal 2017
CWS: Child Welfare Services DHS: Department of Human Services FIA: Family Investment Administration IT: information technology TANF: Temporary Assistance for Needy Families Source: Department of Human Services Core Spending Areas The three core areas of TANF spending are those areas directly related to cash assistance and transitioning individuals from cash assistance into jobs (child care assistance and the job placement programs). In Maryland, job placement and training programs are known as the Work Opportunities Program. As shown in Exhibits 2.3 and 2.4, in both fiscal 2007 and 2017, these core areas represent more than the 50% of TANF spending in Maryland.
With only two exceptions between fiscal 1997 and 2016, Maryland has spent 50.0% or more of TANF funds on a combination of the three core areas (Assistance Payments, Work Opportunities Program, and child care assistance). If spending on the local FIA program is included, spending in these areas has totaled more than 60.0% in all but three years and was 70.0% or higher in 11 years, as shown in Exhibit 2.5. Local FIA spending supports, among other
Assistance Payments,43%
Work Opportunities,14%
Local FIA (Other Eligibility),11%
Local CWS,8%
Foster Care Maintenance Payments,
5%
IT2%
Other DHS,17%

12 Overview of the Temporary Assistance for Needy Families Program in Maryland
activities, the caseworkers who determine eligibility and assist recipients. Although the TANF spending on local FIA was under 12.0% in most years from fiscal 1997 to 2017, the planned spending on this program in fiscal 2018 is 22.9%. This increase occurs, in part, as other federal fund support has declined due to the transfer of child care assistance eligibility away from DHS to MSDE and changes in Medicaid eligibility determination, which for income-based determinations has shifted from DHS to the Maryland Health Benefit Exchange. While the mix of spending in these core areas has changed, it is evident that Maryland has devoted a significant share of TANF funds to core areas. Additional detail on spending in core areas follows.
Exhibit 2.5 Core Spending
Fiscal 1997-2018 Allowance
FIA: Family Investment Administration Source: Department of Human Services; Governor’s Budget Books; Department of Legislative Services
0%
10%
20%
30%
40%
50%
60%
70%
80%
90%
100%
Spending on Core Areas Local FIA (Other Eligibility)
Chapter 2. Temporary Assistance for Needy Families Funding and Spending 13
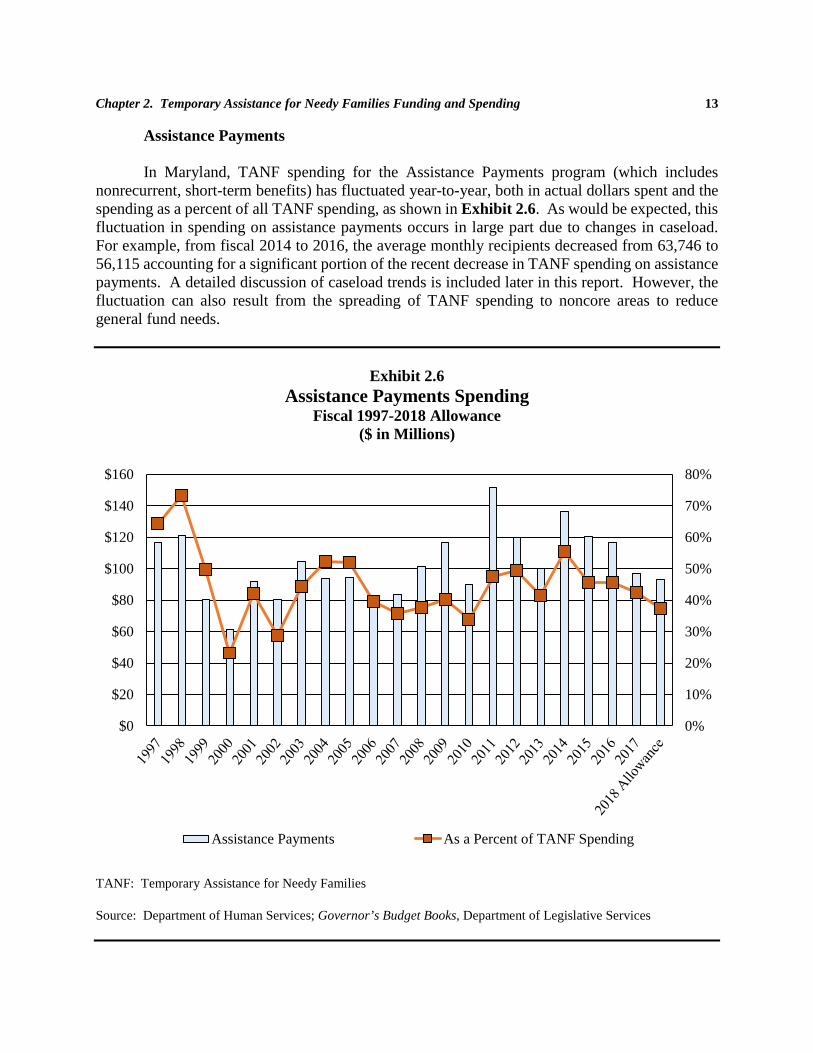
Assistance Payments In Maryland, TANF spending for the Assistance Payments program (which includes nonrecurrent, short-term benefits) has fluctuated year-to-year, both in actual dollars spent and the spending as a percent of all TANF spending, as shown in Exhibit 2.6. As would be expected, this fluctuation in spending on assistance payments occurs in large part due to changes in caseload. For example, from fiscal 2014 to 2016, the average monthly recipients decreased from 63,746 to 56,115 accounting for a significant portion of the recent decrease in TANF spending on assistance payments. A detailed discussion of caseload trends is included later in this report. However, the fluctuation can also result from the spreading of TANF spending to noncore areas to reduce general fund needs.
Exhibit 2.6 Assistance Payments Spending
Fiscal 1997-2018 Allowance ($ in Millions)
TANF: Temporary Assistance for Needy Families Source: Department of Human Services; Governor’s Budget Books, Department of Legislative Services
0%
10%
20%
30%
40%
50%
60%
70%
80%
$0
$20
$40
$60
$80
$100
$120
$140
$160
Assistance Payments As a Percent of TANF Spending

14 Overview of the Temporary Assistance for Needy Families Program in Maryland
In federal fiscal 2015, the most recent year for which data is available from HHS, assistance payments comprised 25.4% of national TANF spending or 30.0% of spending excluding transfers to the Child Care and Development Fund (CCDF) and SSBG. An additional 4.4% of TANF spending nationally is used for nonrecurrent, short-term benefits, which in Maryland include the Emergency Assistance to Families Program. As a percent of TANF expenditures, Assistance Payments program spending has ranged from a low of 23.9% in fiscal 2000, to a high of 73.3% in fiscal 1998.
In all but one year between fiscal 1997 and the 2018 allowance (fiscal 2000), DHS spent
at least $80.0 million of TANF on Assistance Payments. Planned TANF spending for Assistance Payments in fiscal 2018 of $93.3 million would be the lowest level since fiscal 2010. This reflects a decline in the caseload reducing the need for use of TANF on Assistance Payments as noted earlier and discussed in detail later in this report. Fluctuations in TANF spending on Assistance Payments in dollars and as a share of all TANF spending generally reflect impacts of changes in caseloads and the availability of other fund sources to support benefit payments, as well as the need for TANF in other areas. However, in some years, the need to meet MOE requirements impacts the amount of general funds in the Assistance Payments program or TANF spending throughout the budget. For example, in fiscal 2010, efforts to meet MOE accounted for use of TANF in nontraditional areas, while general fund spending in Assistance Payments was much higher than is typical.
Work Opportunities Program and Child Care Spending
According to data from HHS, nationally, in federal fiscal 2015, 9.5% of TANF was spent on work, education, and training programs while 8.0% was spent on early care and education (which includes both child care assistance and prekindergarten/head start spending). In addition to the spending on early care and education, nationally, 8.1% of TANF in federal fiscal 2015 was transferred to CCDF. Maryland’s spending on the Work Opportunities Program, as a percent of all TANF spending, has been relatively consistent throughout the history of TANF, as shown in Exhibit 2.7. In most years, spending on the program has ranged between 13% and 15%. TANF spending on this program has totaled more than $30.0 million in each year since fiscal 2007. DHS intends to continue the Work Opportunities Program spending in fiscal 2018 ($31.7 million) at essentially the level of fiscal 2016. Spending in both years, as a percent of all TANF spending, is less than 13% and are two of the five lowest years since fiscal 1997.

Chapter 2. Temporary Assistance for Needy Families Funding and Spending 15
Exhibit 2.7
Work Opportunities and Child Care Spending Fiscal 1997-2018 Allowance
TANF: Temporary Assistance for Needy Families
Source: Department of Human Services; Governor’s Budget Books; Department of Legislative Services No TANF spending on child care assistance in Maryland has occurred since fiscal 2012. DHS pulled back TANF spending in that year so that all spending occurred within DHS due to the deficit balance. Prior to fiscal 2012, TANF spending on child care assistance fluctuated. However, spending on child care assistance was more than 3.5% of TANF funds in 5 of the 10 years in which spending was recorded. There are several years (fiscal 2004 to 2006), in which no child care assistance spending was recorded. DHS suggested that in some years, although TANF was used, spending was not recorded as being from TANF. This is evident when viewing the TANF balance data presented earlier, which notes more than $10 million of spending on child care assistance in fiscal 2006. Therefore, while informative, these figures may not fully capture the State TANF spending on child care assistance.
0%
5%
10%
15%
20%
25%
Work Opportunities as a Percent of TANF Child Care Spending as a Percent of TANF

16 Overview of the Temporary Assistance for Needy Families Program in Maryland
Child Welfare Services and Foster Care Spending A significant area of noncore TANF spending in Maryland is in local child welfare services and foster care maintenance payments. Combined, these areas have represented more than 10.0% of TANF spending in 12 of the 21 years between fiscal 1997 and 2017, as shown in Exhibit 2.8. In four years, spending in these areas comprised more than 15.0% of TANF spending. Nationally, in federal fiscal 2015, child welfare services totaled 6.1% of TANF spending. However, additional activities related to child welfare services and foster care assistance are included among other activities as authorized under prior law, which totaled 8.1% of TANF spending in that year. As a result, while significant, Maryland’s use of TANF in this area is not out of step with other states.
Exhibit 2.8
Child Welfare Services and Foster Care Spending Fiscal 1997-2018 Allowance
($ in Millions)
TANF: Temporary Assistance for Needy Families Source: Department of Human Services; Governor’s Budget Books; Department of Legislative Services
0%
5%
10%
15%
20%
25%
30%
35%
40%
$0
$10
$20
$30
$40
$50
$60
$70
$80
Child Welfare Services/Foster Care Spending Spending as a Percent of TANF

Chapter 2. Temporary Assistance for Needy Families Funding and Spending 17
The actual dollar amount of spending on child welfare and foster care maintenance payments has varied from less than $1.0 million (in fiscal 1998, 1999, and 2004) to more than $60.0 million in fiscal 2002 and 2010. The variation in spending largely occurs in the area of local child welfare services. TANF spending on foster care maintenance payments has been relatively stable at $6.9 million in all but four years since fiscal 2005. The primary federal fund source for foster care and local child welfare services is the Title IV-E program. State matching fund eligibility under Title IV-E is tied to eligibility for Aid to Families with Dependent Children financial eligibility with no adjustments for inflation. As a result, over the years, it has become more difficult for states to obtain Title IV-E funding. At times, DHS has increased the use of TANF to make up for underattainment of Title IV-E funding, particularly in periods when general funds were limited. For example, the highest use of TANF to support local child welfare services occurred during the last recession in fiscal 2010 (a total of $54.7 million). TANF spending has been reduced from that high point in recent years and totaled $18.9 million in fiscal 2017. However, DHS anticipates using $30.7 million of TANF to support local child welfare services in fiscal 2018.

18 Overview of the Temporary Assistance for Needy Families Program in Maryland

19
Chapter 3. Eligibility and Other Requirements
Eligibility Requirements This section does not highlight all areas of eligibility, focusing rather on a few key areas including financial eligibility and provisions related to substance use screening. Other sections of the report highlight requirements related to work activities. Financial Eligibility Income As noted earlier, states have options in establishing eligibility for Temporary Assistance for Needy Families (TANF)-funded programs, including cash assistance. States use a variety of different methods in establishing income eligibility. In some states, the benefit calculation essentially serves as the income eligibility test. In these states, if an individual would receive a benefit under the state’s benefit calculation, the individual is considered eligible for a benefit. Alternatively, if the individual would not receive a benefit under the calculation, the individual is not considered eligible. For example, in Maryland, an individual is determined eligible as long as the benefit calculation would provide them with a benefit of at least $10. The maximum benefit, which varies by household size, is compared to a household’s net countable income. In fiscal 2017, the maximum benefit was $648 for a family of three. Net countable income includes both earned and some unearned income (e.g., child support, workers’ compensation, unemployment insurance) after subtracting an earned income disregard and deductions for child care resulting from employment, looking for employment, or education and job training, and child support paid to an individual outside of the assistance unit. The earned income disregard is typically 20%. Some states set eligibility guidelines such as using a percentage of the federal poverty level, while other states use their own or other need standards. Eligibility may vary for initial applicants compared to recipients seeking redeterminations. The following discussion focuses on initial eligibility. The discussion does not include all aspects of technical eligibility, rather highlighting certain key requirements.
The Urban Institute annually publishes a Welfare Rules Databook that provides a number of details about various states’ rules and requirements related to TANF programs.3 The publication presents a summary of the maximum income a household could have and meet the technical eligibility for each state. In some states, there is variation among local jurisdictions, and the most common figure is cited. In other states, different categories of programs have different eligibility requirements (such as households exempt from work requirements). Exhibit 3.1 provides 3 The Welfare Rules Databook published in July 2015 is the source of the multi-state comparisons in this report. The databook is found at: http://www.urban.org/policy-centers/income-and-benefits-policy-center/projects/welfare-rules-databook-and-database

20 Overview of the Temporary Assistance for Needy Families Program in Maryland
information on the maximum monthly income for households of three individuals in July 2015. As shown in this exhibit, Maryland’s maximum income at eligibility in July 2015 of $795 is in the bottom half of states (twenty-ninth highest among states). The maximum earnings at initial eligibility ranged from $0 in Wisconsin to $1,740 in Hawaii.
Exhibit 3.1 Maximum Monthly Earnings at Initial TANF Eligibility for a
Household of Three July 2015
State Maximum Earnings for Initial Eligibility Hawaii $1,740 Alaska 1,679 Nevada 1,660 South Carolina 1,524 California 1,346 North Dakota 1,331 Tennessee 1,315 Rhode Island 1,277 Wyoming 1,251 Massachusetts 1,143 (Nonexempt)/1,129 (Exempt) Vermont 1,103 Minnesota 1,089 Iowa 1,061 Washington 1,042 Maine 1,023 Nebraska 991 Idaho 972 Connecticut 908 Kentucky 908 New Mexico 883 New York 879 New Hampshire 844 Ohio 838 Illinois 837 South Dakota 837 Oklahoma 824 Montana 817 Michigan 803

Chapter 3. Eligibility and Other Requirements 21
State Maximum Earnings for Initial Eligibility Maryland 795 North Carolina 681 Pennsylvania 677 Utah 668 Virginia 640 New Jersey 636 Oregon 616 District of Columbia 588 Arizona 585 West Virginia 565 Missouri 557 Kansas 519 Georgia 514 Colorado 511 Mississippi 458 Delaware 428 Texas 402 Florida 393 Indiana 378 Louisiana 360 Arkansas 279 Alabama 269 Wisconsin 0
TANF: Temporary Assistance to Needy Families Source: Urban Institute Welfare Rules Databook: State TANF Policies as of July 2015 Asset Limits In addition to earnings criteria, most states have a maximum asset value (known as an asset limit) to be considered eligible or remain eligible for benefits. Asset limits can prevent households from accumulating savings that could assist the individual in ultimately leaving or remaining off cash assistance, as well as provide a buffer for unexpected bills or earnings declines. Given the low incomes of individuals applying for TANF cash benefits, it is unlikely individuals applying for benefits have significant savings. However, depending on the state exemptions for certain assets such as vehicles, these limits could hurt an individual’s ability to transition off assistance into work. According to the Welfare Rules Databook, as shown in Exhibit 3.2, in 2015, 42 states and the District of Columbia had asset limits. Maryland was 1 of 8 states with no asset limit. The

22 Overview of the Temporary Assistance for Needy Families Program in Maryland
size of asset limits varies, but the majority of limits allow for assets of only $2,000 or lower. Only 4 states allow for assets of greater than $5,000.
Exhibit 3.2 Dollar Value of Asset Limits
Calendar 2015
Asset Limit Number of States
$1,000 9 $2,000 16 $2,250 2 $2,500 5 $3,000 5 $3,500 1 $5,000 1 $6,000 2 $6,025 1 $10,000 1 No limit 8
Source: Urban Institute Welfare Rules Databook: State TANF Policies as of July 2015 States with asset limits provide for various exemptions to the asset limits. All states include some exemption for a vehicle for the household. This type of exemption allows for individuals to have an automobile that could provide transportation to work. However, the specific exemption varies among states. For example, 15 states exempt one car of any value, while 11 states exempt all vehicles for a household. Other states exempt a certain value of a vehicle (or a second vehicle). Two states exempt one vehicle per licensed driver. Having no current asset limit, Maryland has no need for a vehicle exemption. Other Eligibility/Application Requirements The Personal Responsibility and Work Opportunity Reconciliation Act (PRWORA) also restricted eligibility for both TANF and Supplemental Nutrition Assistance Program (SNAP) benefits for individuals with prior drug convictions. The PRWORA established a lifetime ban, but states were able to modify this ban. According to the Congressional Research Service, as of August 2016, only 10 states maintained a lifetime ban. Thirteen states and the District of Columbia had no ban for individuals with prior drug felonies. Twenty-seven states had a modified ban. At that time, Maryland had a modified ban for both SNAP and Temporary Cash Assistance (TCA) that subjected individuals with a felony conviction after August 22, 1996, of possession,

Chapter 3. Eligibility and Other Requirements 23
use, or distribution of a controlled dangerous substance (CDS) to testing and treatment for substance use for two years beginning on the date of the application. If an individual was found to be in violation of certain federal or State CDS laws, the individual was ineligible for benefits for one year after the date of the conviction and was subject to testing and treatment for two years beginning on the later of the date of release from incarceration or completion of any term of probation, parole, or mandatory supervision. However, Chapters 792 and 793 of 2017 modified these provisions. Under Chapters 792 and 793, individuals with a prior drug felony conviction are no longer subjected to the two-year testing and treatment requirements. In addition, Chapters 792 and 793 remove certain drug convictions from the one-year ban and the testing and treatment requirements. Beginning October 1, 2017, only those convicted under the volume dealer and drug kingpin statutes will be subjected to these requirements. The Center for Law and Social Policy (CLASP) noted in a March 2017 publication No More Double Punishments that four states (Alabama, Alaska, Georgia, and Texas) have modified or lifted the lifetime bans since 2015. In addition, Chapters 792 and 793 modify the penalties for failure to comply with testing and treatment requirements for those with a felony drug conviction to apply only to recipients rather than also applying to applicants. States may also have more general drug testing/screening requirements for applicants and recipients that include penalties. Some states have attempted to require all applicants or recipients to be drug tested. CLASP noted that the courts have ruled that these types of requirements are unconstitutional in two situations (Michigan in the earlier days of TANF and Florida in 2011). However, other states, including Maryland, have some type of drug screening, testing, and treatment requirements. Maryland’s Welfare Innovation Act of 2000 required addiction specialists to be placed in local departments of social services (LDSS). All TCA applicants are screened for substance use. Only after being screened are some applicants/recipients referred for testing or additional assessment and treatment. Applicants/recipients are not penalized for positive screening and tests, only for failure to comply with assessment, testing, and treatment if referred. Maryland’s general drug screening requirements are codified under Section 5-314 of the Human Services Article.
The Department of Human Services (DHS) and the Maryland Department of Health
(MDH) began placing addiction specialists on site at the LDSS in 2000. Local health departments or local addiction agencies provide supervision to the addiction specialists, though day-to-day supervision is conducted by LDSS. There are a total of 62 addiction specialists located throughout the various LDSS. DHS provides MDH approximately $3.45 million annually for this program.
The number of individuals screened varies from year-to-year primarily based on the
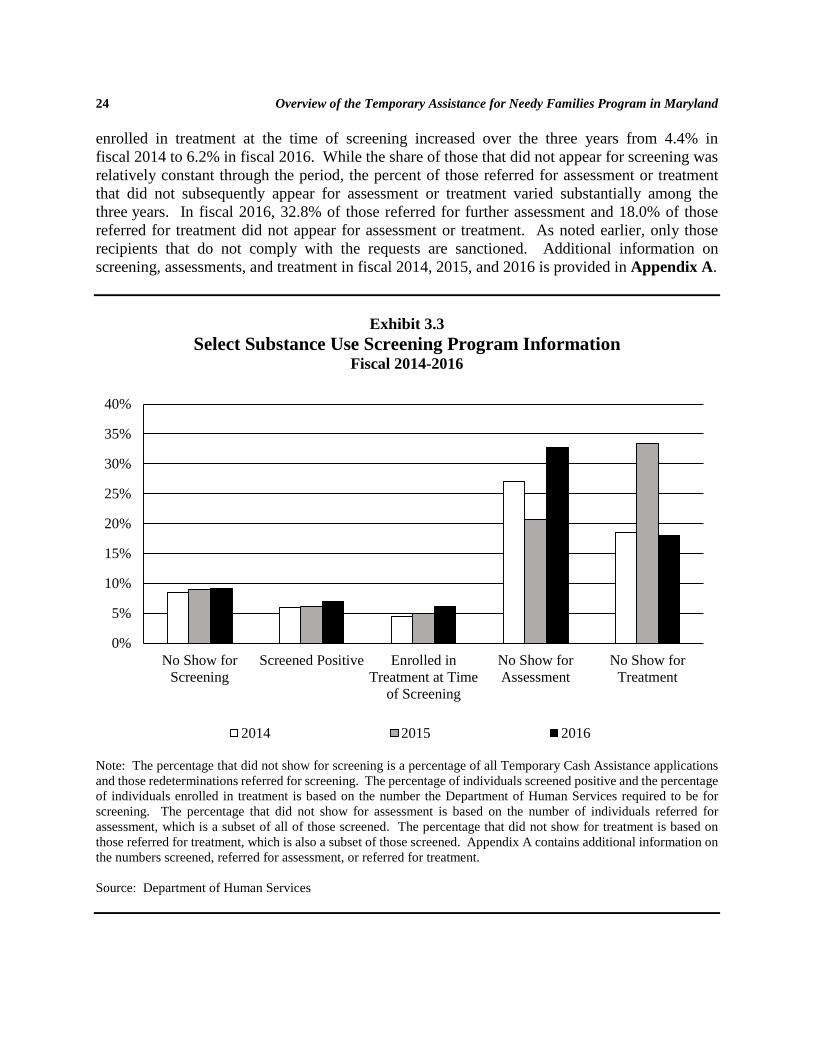
number of applications, though some individuals are also screened at redetermination. In fiscal 2016, 34,292 individuals including all applicants and some redeterminations were referred for screening. More than 90.0% of those in fiscal 2014 through 2016 were screened. As shown in Exhibit 3.3, in each of those years, between 6.0% and 7.0% of those individuals screened, screened positive for substance use. Of note, the percentage of those screened that were already
24 Overview of the Temporary Assistance for Needy Families Program in Maryland
enrolled in treatment at the time of screening increased over the three years from 4.4% in fiscal 2014 to 6.2% in fiscal 2016. While the share of those that did not appear for screening was relatively constant through the period, the percent of those referred for assessment or treatment that did not subsequently appear for assessment or treatment varied substantially among the three years. In fiscal 2016, 32.8% of those referred for further assessment and 18.0% of those referred for treatment did not appear for assessment or treatment. As noted earlier, only those recipients that do not comply with the requests are sanctioned. Additional information on screening, assessments, and treatment in fiscal 2014, 2015, and 2016 is provided in Appendix A.
Exhibit 3.3 Select Substance Use Screening Program Information
Fiscal 2014-2016
Note: The percentage that did not show for screening is a percentage of all Temporary Cash Assistance applications and those redeterminations referred for screening. The percentage of individuals screened positive and the percentage of individuals enrolled in treatment is based on the number the Department of Human Services required to be for screening. The percentage that did not show for assessment is based on the number of individuals referred for assessment, which is a subset of all of those screened. The percentage that did not show for treatment is based on those referred for treatment, which is also a subset of those screened. Appendix A contains additional information on the numbers screened, referred for assessment, or referred for treatment. Source: Department of Human Services
0%
5%
10%
15%
20%
25%
30%
35%
40%
No Show forScreening
Screened Positive Enrolled inTreatment at Time
of Screening
No Show forAssessment
No Show forTreatment
2014 2015 2016

Chapter 3. Eligibility and Other Requirements 25
For those penalized for noncompliance in Maryland, TCA benefits are reduced only for the adult or minor parent recipient. The remainder of the benefits will be provided to a third-party payee or compliant adult. The penalty, therefore, does not impact the whole family. Work-related Requirements Application Work-related requirements for cash assistance in some states may begin before receipt of benefits. According to the Welfare Rules Databook, in July 2015, 17 states required applicants to undertake at least some job search or employment-related activities at the time of application. Maryland is 1 of these 17 states. The types of activities that states require vary. Some states require individuals to apply to a certain number of jobs, while others require participation in a job readiness training or job search program. Georgia, for example, requires applicants to make 12 to 24 job contacts within six weeks of the application review. In Maryland, applicants must search for jobs for at least 20 hours per week for two weeks. Exhibit 3.4 summarizes the job search activity required at the time of application for states where these requirements exist. The exhibit also includes the penalty for noncompliance, which is typically denial of the application.
Exhibit 3.4 Job Search Requirements at TANF Application
July 2015
State Required Activity Penalty Alabama Apply to three jobs at businesses with openings. Denial of Application Alaska Participate in a four-week job search program. Reduction in Benefit Georgia Make 12 to 24 job contacts within six weeks of application
review. Denial of Application
Hawaii Complete orientation and intake within one week of application and complete one week of job readiness training within 21 days of intake.
Denial of Application
Idaho Participate in a job search program. Denial of Application Indiana Participate in a job search for four hours per day for 20 days
within the 60-day application period. Denial of Application
Maryland Search for jobs at least 20 hours per week for two weeks. Denial of Application
Michigan Participate in work activities including job search for between 21 and 30 days.
Denial of Application

26 Overview of the Temporary Assistance for Needy Families Program in Maryland
State Required Activity Penalty Minnesota Participate in a work activities program including job search
for four months. Ineligible until Compliance
Mississippi Make at least three job search contacts within 30 days. Denial of Application Nevada Determined by the local office. Denial of Application New Jersey Participate in a required job search placement plan for
between 15 and 30 days. Denial of Application
New York Determined by the local office. Denial of Application Pennsylvania Apply to three jobs per week while application is pending. Application May Be
Denied South
Carolina Contact at least five employer contacts within two weeks. Denial of Application
Vermont Report to the Department of Labor within two working days after the eligibility interview.
Denial of Application
Wisconsin Participate in a job search program. Denial of Application TANF: Temporary Assistance for Needy Families Source: Urban Institute Welfare Rules Databook: State TANF Policies as of July 2015 Work Participation Rate In aggregate, under TANF, states are required to meet a 50% work participation rate for all families or face a penalty. States with TANF-funded two-parent families must meet a 90% work participation rate. However, the work participation rate an individual state is required to meet may be lower than the standard 50% or 90%.
States can receive a percentage reduction to the required work participation rate based on caseload reductions (known as the caseload reduction credit). Since the Deficit Reduction Act (DRA), the base caseload used in determining the caseload reduction credit has been tied to the decline in the average monthly caseload between the prior year and federal fiscal 2005. The DRA also altered the activities and hours of participation that can count toward the work participation rate. For example, only a limited number of education activities are eligible to be counted.
The DRA established core activities for which any number of hours can count toward work
participation. Core activities include unsubsidized employment, subsidized employment, community service, work experience, and on-the-job training. Some core programs have limits to the number of weeks or months that can be counted (job search and readiness and vocational education training). Noncore activities only count if an individual is participating in at least

Chapter 3. Eligibility and Other Requirements 27
20 hours per week of core activities. Noncore activities including job skills training or education directly related to employment and attendance at a secondary school or in a GED program. Families must participate in work activities for an average of 30 hours per week (for a single parent household). For families with younger children, the requirement may be less.
According to data from the Department of Health and Human Services (HHS), in federal
fiscal 2015, Maryland’s required adjusted all families work participation rate was 21.0%. The actual participation rate was 51.5%. Maryland is not required to meet a two-parent rate because it does not have a TANF-funded or Maintenance of Effort-funded two-parent benefit. Other states had adjusted all families work participation rates ranging from 0.0% in 13 states to 50.0% in 12 states. According to HHS, only four states (Colorado, Nevada, Vermont, and Wisconsin) failed to meet the all families work participation rate, as shown in Exhibit 3.5.4 HHS stated that, overall, the all families work participation rate was 48.4% in federal fiscal 2015.
Exhibit 3.5 States Meeting All Families Adjusted Work Participation Rate
Federal Fiscal 2015
Note: All families rate work participation requirement is 50%, but individual state requirements are often lower due to caseload reduction credits and other adjustments. Source: U.S. Department of Health and Human Services
4 Territories are also subject to the work participation rate requirements. Data for territories is not included in Exhibits 13 or 14.

28 Overview of the Temporary Assistance for Needy Families Program in Maryland
Of the states subject to the two-parent families work participation rate, the adjusted standards ranged from 3.9% in Indiana to 90.0% in 7 states. In federal fiscal 2015, according to HHS, 14 of 27 states or territories failed to meet the two-parent families work participation rate as shown in Exhibit 3.6.
Exhibit 3.6 States Meeting Two-parent Families Adjusted Work Participation Rate
Federal Fiscal 2015
Note: All families rate work participation requirement is 50%, but individual state requirements are often lower due to caseload reduction credits and other adjustments. Source: U.S. Department of Health and Human Services

Chapter 3. Eligibility and Other Requirements 29
Work-related Requirements While compliance with the official work participation rate calculation is limited by federal
rules, states maintain flexibility in how programs are established and the functioning of the penalty structure for failure to comply. States are able to exempt certain households. Some states (Arkansas, Delaware, Massachusetts, Montana, Nebraska, New Hampshire, New Mexico, Oregon, South Carolina, Virginia, and Wisconsin) set different requirements for different categories of recipients. For example, in Delaware, one category of recipients must meet 30 hours of work activities per week with a maximum of 10 hours of education and training and have a broad set of allowable activities that include basic education, community service, and life skills training while another group of recipients has the minimum hours of work activities determined on a case-by-case basis, and no education or training hours can be counted. As another example, Virginia has one category of recipients that have no work requirements, while another category of recipients must meet 35 hours per week of work activities with up to 15 hours of education and training that may count. Maryland’s work-eligible and work-exempt caseload is discussed later in this report. Similarly, the timing for each state’s requirements to begin participation in work programs varies. According to the Welfare Rules Databook, in July 2015, as shown in Exhibit 3.7, most states required individuals to begin participating immediately upon benefit receipt. Six states, including Maryland, required individuals to begin participating upon application.
Exhibit 3.7 Timing of Work Requirements
July 2015
Timing of Requirement Number of States Immediately 35 Upon Application 6 After Assessment 3 Upon Signing Agreement 2 Within 24 Months of Benefit Receipt 2 31 Days After Application 1 After 2 Months of Benefit Receipt 1 Within 3 Months of Benefit Receipt 1
TANF: Temporary Assistance for Needy Families Note: Some programs have different requirements for different categories of cases (Arkansas, Delaware, Massachusetts, Montana, Nebraska, New Hampshire, New Mexico, Oregon, South Carolina, Virginia, and Wisconsin). As a result, the information included in the exhibit may not be the same for all cases within a state and, therefore, figures may differ from those shown. Source: Urban Institute Welfare Rules Databook: State TANF Policies as of July 2015

30 Overview of the Temporary Assistance for Needy Families Program in Maryland
Consistent with federal requirements, 36 states (including Maryland) required individuals to complete a minimum of 30 hours per week of work activities. However, 9 states required a higher level of participation than federal requirements dictate. For example, Mississippi required a minimum of 40 hours of work participation a week. A limited number of states did not prescribe a limit but determined a requirement on an individual basis.
Sixteen states limited the number of education and training hours that may be counted toward the work requirement. The most common limitation is 10 hours, a limitation that would be consistent with federal rules allowing noncore activities (education) after at least 20 hours of core activities are counted. However, five states set higher limits on the counting of education and training ranging from 12 hours to 20 hours. Maryland sets a limit of 16 hours of countable education and training activities. As with other work-related requirements, states can choose to set requirements that are different from federal rules, but those cases falling outside of the federal rules cannot be counted toward the work participation rate. Sanctions States are also able to set rules related to the type of sanction issued for noncompliance with work requirements. The sanctions may (but do not always) vary between the initial sanction and subsequent sanctions. As shown in the Welfare Rules Databook, in 2015, for initial sanctions, states exhibited significant variation in the amount of the sanction. As shown in Exhibit 3.8, the most common initial sanctions were the entire benefit, the adult portion of the benefit, and case closure. Combined, these three sanctions account for 32 states. Eleven states reduced a certain percentage of the benefit, while 1 state reduced a flat dollar amount. Maryland was 1 of the states that has an entire benefit sanction for the first instance of noncompliance. The length of time that the sanction applies is typically, but not always, a two-step test including either a certain period of time or at the time the individual comes into compliance. In some instances, the state requirement is the later of the two dates. Other states require the individual to reapply for benefits. When states have a time limitation (either alone or part of a two-step test), the time limitations vary from as few as 10 days to as long as four months. Nine states (including Maryland) simply require the individual to come into compliance before the end of the initial sanction.

Chapter 3. Eligibility and Other Requirements 31
Exhibit 3.8
Amount of Sanction for First Instance of Noncompliance July 2015
Initial Amount Number of States Entire Benefit 14 Adult Portion of Benefit 9 Case Is Closed 9 Pro Rata Portion of the Benefit 3 None 2 10% 1 25% 6 33% 1 40% 1 50% 2 $75 1 $5 Times the Hours of Nonparticipation 1 Greater of Adult Portion of Benefit or 40% 1
TANF: Temporary Assistance for Needy Families Note: Some states (Delaware, Massachusetts, Montana, New Hampshire, New Mexico, South Carolina, Virginia, and Wisconsin) have different sanction policies for different types of cases. As a result, the information included in the exhibit may not be the same for all cases within a state and therefore figures may differ from those shown. Source: Urban Institute Welfare Rules Databook: State TANF Policies as of July 2015 As noted, for a number of states, subsequent sanctions generally become more severe. Exhibit 3.9 shows the amount of the most severe sanction in July 2015 as described in the Welfare Rules Databook. The number of states that penalized noncompliance with work requirements by closing the case increases to 28 states for the most severe sanction, while it was only 9 states in the initial sanction. Similarly, a larger number of states (18) sanctioned the entire benefit as the most severe sanction compared to the initial sanction. Maryland reduces the entire benefit for both the initial and most severe sanction.

32 Overview of the Temporary Assistance for Needy Families Program in Maryland
Exhibit 3.9
Amount of Most Severe Sanction for Noncompliance July 2015
Amount of Most Severe Sanction Number of States Case Is Closed 28 Entire Benefit 18 Adult Portion of Benefit 2 25% of Benefit 1 $150 1 Pro Rata Portion of the Benefit 1
TANF: Temporary Assistance for Needy Families
Note: Some states (Delaware, Massachusetts, Montana, New Hampshire, New Mexico, South Carolina, Virginia, and Wisconsin) have different sanction policies for different types of cases. As a result, the information included in the exhibit may not be the same for all cases within a state, and therefore, figures may differ from those shown. Source: Urban Institute Welfare Rules Databook: State TANF Policies as of July 2015 As with the initial sanction, the length of the most severe sanction contains significant variation. Six states had a permanent sanction for the most severe sanction. A number of states required individuals to reapply for benefits after a period of delay (ranging from 1 month to 12 months). Some required the individual to be in compliance for a period of time before the sanction ends. For example, Maryland requires the individual to be in compliance for 1 month before the sanction ends. Other states continue to have similar two-part tests discussed earlier where the length of sanction is the longer of a set period of time (such as 3, 6, or 12 months) or when the individual is in compliance. Generally, the sanction level applied by Maryland tends to be more significant than most states, particularly at the initial sanction stage when fewer than half of states sanction the entire amount or close the case. However, the length of the sanction in Maryland is relatively limited compared to other states for both the initial and most severe sanction, requiring only a short delay after coming into compliance even for the most severe sanction. Benefit Limits Lifetime Limits The PRWORA imposed a 60-month lifetime limit for benefit receipt under TANF. However, states are able to lower the lifetime limit or create other types of limits on receipt of benefits. States are also able, if desired, to offer state-only programs under which households can

Chapter 3. Eligibility and Other Requirements 33
continue to receive benefits after the lifetime limit for federal benefits is reached. States may also allow up to 20% of households to continue receiving benefits beyond the lifetime limit under a “hardship exemption.” As shown in Exhibit 3.10, through July 2015, the majority of states, had maintained a lifetime limit of 60 months according to the Welfare Rules Databook. However, 12 states had shorter lifetime limits. In July 2015, the shortest lifetime limit was 21 months (Connecticut). One state (Massachusetts) had no lifetime limit. All but 2 states terminated benefits for the entire assistance unit after hitting the lifetime limit. In the other 2 states (California and Oregon), only the adult portion of the benefit terminated.
Exhibit 3.10 Lifetime Limit for TANF Funded Benefits
(in Months) July 2015
TANF: Temporary Assistance to Needy Families
Source: Urban Institute Welfare Rules Databook: State TANF Policies as of July 2015

34 Overview of the Temporary Assistance for Needy Families Program in Maryland
While the Welfare Rules Databook provides the overall state policy, some states may not actually enforce the lifetime limit. For example, in Maryland, the hardship exemption has been used throughout program history to avoid terminating benefits for households who have reached the lifetime limit. In fiscal 2016, for example, the annual average number of cases headed by adults that received assistance for more than 60 months (and were thus subject to the time limit) was 2,068, 9.7% of the total number of cases subject to the time limit. As this is under the 20.0% exemption limit, no one was removed from the caseload. Other states also use separate state programs, not funded through TANF, to continue to allow cases to receive benefits after reaching the lifetime limit.
Other Benefit Restrictions A limited number of states also have other types of restrictions that limit benefit receipt:
• In July 2015, according to the Welfare Rules Databook, 10 states had a limit on receipt of benefits within certain time periods although the restrictions in some of these states do not apply to all cases. Examples of these restrictions include limiting eligibility to 24 months out of a 60-month period in Louisiana, Rhode Island, and certain cases in Massachusetts, or allowing 24 months of eligibility followed by a period of ineligibility (12 months in Nevada, 36 months in North Carolina, and 24 months for certain cases in Virginia). In Texas, households are eligible for either 12, 24, or 36 months but ineligible for 60 months after that period. In all but 1 of the states with this type of limit, benefits are terminated for the entire unit after reaching the limit. In Texas, benefits are terminated only for the adult. Maryland does not have this type of benefit restriction.
• Sixteen states had some sort of family cap policy in July 2015, according to the
Welfare Rules Databook. These types of policies impact the amount of benefits available for each additional child born a certain period after the household began receiving assistance. In most of these states, the limitation is placed on children born 10 months after benefit receipt. However, one state restricts benefits for children born 8 months after the beginning of benefits (North Dakota) and one state (Arkansas) restricts benefits for all children born after the beginning of benefit receipt. In general, these policies do not allow for an increase in benefits for these children. A few states still allow for some smaller than normal increase in benefits for these children. Maryland does not have this type of restriction.

35
Chapter 4. Temporary Cash Assistance Caseload Cases Consistent with national trends, in the immediate aftermath of the transition from Aid to Families with Dependent Children to Temporary Assistance for Needy Families (TANF), the cash assistance caseload in Maryland significantly declined. Between fiscal 1997 and 2000, the average monthly number of Temporary Cash Assistance (TCA) recipients decreased by 54.9% (from 173,530 to 78,294). The average monthly caseload continued to decline, although at a much slower pace, in each year until the low point in fiscal 2007 (50,138), as shown in Exhibit 4.1. The caseload decline continued on a fiscal year basis despite a relatively mild recession in the early 2000s, although monthly caseloads did see occasional increases.
The average monthly number of recipients increased during the subsequent Great Recession, returning to a high of 72,413 (the highest since fiscal 2002) in fiscal 2012. The average monthly number of recipients has declined since that point. In fiscal 2017, the average monthly number of recipients (50,901) was the second lowest average in program history. The number of recipients in May 2017 (48,139) was the second lowest in program history and, even though the number of recipients slightly rebounded in June 2017, (48,470) the number of recipients in that month was the fifth lowest in program history.
Exhibit 4.1 Average Monthly Number of Recipients
Fiscal 1997-2017
Source: Department of Human Services
020,00040,00060,00080,000
100,000120,000140,000160,000180,000200,000

36 Overview of the Temporary Assistance for Needy Families Program in Maryland
Exhibit 4.2 provides a comparison of the year-over-year change in caseloads at the State and national level. As shown in this exhibit, the year-over-year changes in average monthly recipients is consistent in most years with the national trend. The primary exceptions are at the beginning of the Great Recession and as program participation began to recover from the Great Recession. These variations may be impacted by limitations in data that result in the State data being presented on the State fiscal year basis and the national data on the federal fiscal year basis. While both at the State and national level the average monthly number of recipients increased during the period impacted by the recession, Maryland experienced a higher rate of growth in each year. This may be influenced by changes in eligibility or other requirements in other states during this period.
Exhibit 4.2 Year-over-year Change in Average Monthly Recipients
Fiscal 1998-2016
Note: State data is presented on the State fiscal year. National data is presented on the federal fiscal year. Source: Department of Human Services; U.S. Department of Health and Human Services
One concern expressed during recent discussions at the federal level about transitioning public assistance programs to block grants is how the programs respond during economic downturns. Exhibit 4.3 presents a comparison of the year-over-year change in TCA recipients, Food Supplement Program (FSP) recipients, and Medicaid recipients since fiscal 2007 to show how each program responded during the Great Recession and ensuing recovery. FSP is the State program name for the Supplemental Nutrition Assistance Program. As shown in this exhibit, all
-30%-25%-20%-15%-10%-5%0%5%
10%15%20%
State Year-over-year Change National Year-over-year Change

Chapter 4. Temporary Cash Assistance Caseload 37
three programs experienced substantial year-over-year increases in recipients during the Great Recession and the immediate aftermath. All three programs had year-over-year growth of more than 10% during periods of the economic downturn. FSP experienced a consistently higher rate of year-over-year growth, a higher peak in year-over-year growth, and a longer sustained period of year-over-year growth than TCA. FSP did not experience a year-over-year decline in recipients until fiscal 2015 (August 2014), while TCA began experiencing year-over-year declines in recipients in fiscal 2012 (January 2012). Medicaid, excluding the expansion population, experienced a slower year-over-year increase than TCA during the Great Recession and did not have as high a peak as TCA. However, through December 2013, Medicaid had not experienced a year-over-year decline in caseload. While the peak year-over-year increase in TCA occurred at the official end of the recession, Medicaid did not have its peak year-over-year increase until January 2010 (seven months after the official end of the recession in June 2009).
Exhibit 4.3 Year-over-year Changes in TCA, FSP, and Medicaid Recipients
Fiscal 2007-2017 YTD
FSP: Food Supplement Program YTD: year-to-date TCA: Temporary Cash Assistance
Note: Medicaid enrollment figures excludes the fiscal 2009 expansion population, which made parents and caregivers up to 116% of the federal poverty level with children in Medicaid eligible for coverage. Medicaid enrollment excluding the expansion population is not available after December 2013 and is, therefore, excluded from this exhibit. Data is year-to-date through May 2017.
Source: Department of Human Services; Department of Legislative Services
-20%
-10%
0%
10%
20%
30%
40%
FSP Year-over-year Change TCA Year-over-year ChangeMedicaid Year-over-year Change
Great Recession

38 Overview of the Temporary Assistance for Needy Families Program in Maryland
Of note, the State undertook activities to encourage enrollment in FSP during this period, so a portion of the higher growth in FSP may be due to the outreach activities rather than solely as a response to the economic downturn. For example, while the number of TCA recipients has returned to prerecession levels in fiscal 2017, the number of FSP recipients is still more than twice the prerecession levels. In addition, FSP with its higher income eligibility threshold may naturally have longer lags in economic recovery or earlier leads in a recession because the program will capture more individuals who are underemployed. Cases by Jurisdiction
Exhibit 4.4 presents information on the share of cases by jurisdiction in fiscal 2016. As
shown in this exhibit, the TCA caseload in Maryland is generally concentrated in the more populous jurisdictions. The largest share of TCA cases in the state is in Baltimore City (40.3%). Only one other jurisdiction has more than 10.0% of the TCA cases in the State (Baltimore County). Nine jurisdictions have 1.0% or fewer of the total TCA caseload in the State.
Exhibit 4.4 Temporary Cash Assistance Cases as a Share of Total
Fiscal 2016
Note: Jurisdictional profile data includes all cases that received Temporary Cash Assistance for one month during the year. Source: University of Maryland School of Social Work, Life on Welfare: Temporary Cash Assistance Families and Recipients: 2016 Jurisdictional Profile

Chapter 4. Temporary Cash Assistance Caseload 39
While the most populous jurisdictions generally have the highest share of TCA cases, the distribution of recipients looks quite different when compared to the county population. Exhibit 4.5 provides information on TCA recipients as a share of the county population. Outside of Baltimore City, this exhibit shows TCA recipients as a share of the population are less concentrated in the more populous jurisdictions. Baltimore City has the highest share of TCA recipients as a share of the total population (3.9%). The only other jurisdictions with more than 1.5% of the estimated population that are TCA recipients are Dorchester, Somerset, and Wicomico counties.
Exhibit 4.5 Average Monthly TCA Recipients as a Share of the County Population
Fiscal 2016
TCA: Temporary Cash Assistance Note: Population figures are from the 2016 population estimates available through the Maryland State Data Center. Source: Department of Human Services; Maryland Department of Planning
Caseload Designations The TCA caseload can be divided into two main groups: (1) the core caseload; and
(2) cases headed by an employable adult. The core cases include child-only cases, women with

40 Overview of the Temporary Assistance for Needy Families Program in Maryland
children younger than age one, cases headed by individuals with disabilities, caretaker relatives, and other cases exempt from work requirements. With the exception of women with children younger than age one, the Department of Human Services (DHS) does not expect the core cases to transition off of cash assistance by seeking employment. Child-only cases, for example, typically leave the TCA rolls after reaching adulthood.
These distinctions in caseload designations are important due to the work requirements.
Work-exempt cases are not subject to these requirements, while work-eligible cases are and face sanctions for failure to comply with work requirements. Over time as work-eligible cases are able to transition to employment from TCA, one would expect to see the core caseload representing a higher share of TCA cases. Exhibit 4.6 provides data on the TCA caseload-by-caseload designation from July 2001 (the earliest data available) through 2016. This exhibit is based on cases not recipients; therefore, the number of cases will not match the information presented earlier on recipients.
Exhibit 4.6 Temporary Cash Assistance Caseload Characteristics
July 2001-2016
Note: Data is for cases in July of each year.
Source: Department of Human Services
9,583 9,344 9,283 9,217 8,840 8,690 8,402 8,1378,234 8,029 7,990 7,793 7,540 7,432 7,411 7,095
5,3783,395 3,054 3,296
3,5433,809
4,2265,353
6,2706,407 7,538
7,975 8,176 7,485 6,6413,422
11,90313,556
14,54613,499
10,5377,998
6,039 6,584 8,720 10,361 10,852 9,276 8,433 8,249 8,81510,602
0%
10%
20%
30%
40%
50%
60%
70%
80%
90%
100%
2001 2002 2003 2004 2005 2006 2007 2008 2009 2010 2011 2012 2013 2014 2015 2016
Child Only Other Work Exempt Employable

Chapter 4. Temporary Cash Assistance Caseload 41
As shown in Exhibit 4.6, the share of cases represented by the core caseload (shown as child only and other work exempt) increased from July 2003 through 2007 as would be expected. During the period impacted by the Great Recession, the share of cases that were designated as employable increased and topped 40% in both July 2010 and 2011. The increase in employable cases during the period impacted by the Great Recession would be expected as individuals who lost jobs or were unable to find work during the recession sought TCA. Following the recession, the share of cases falling into the work-exempt categories began to increase again.
However, in July 2016, the share of employable cases was higher than 50% for the
first time since July 2004. This increase resulted largely from a change by DHS to remove the long-term disabled caseload exemption, making these cases work-eligible. The number of cases with an individual with a disability decreased by 3,273 between July 2015 and July 2016, while work-eligible cases increased by a net of 1,787. In general, this data suggests that the caseload has responded in a manner expected after welfare reform, more cases in which the case head is able to work during a recession but fewer during other periods. However, it is notable that the employable cases remained above 30% of the total cases during the entire period. Caseload Designation by Jurisdiction The data presented previously reported statewide caseload designations on July of each year. However, the rates of work-eligible and work-exempt cases can vary substantially by jurisdiction. Exhibit 4.7 presents information on the share of each jurisdiction’s cases that were work eligible in fiscal 2016 based on caseload data presented by the University of Maryland School of Social Work (UM SSW). While statewide, over 50.0% of cases in July 2016 were work eligible, only four jurisdictions had more than 50.0% of its cases that were work eligible (St. Mary’s, Somerset, and Wicomico counties, and Baltimore City). Somerset County had the highest share of cases that were work eligible (55.4%). Four jurisdictions had fewer than 30.0% of its cases that were work eligible (Caroline, Talbot, Washington, and Wicomico counties).
As shown in Exhibit 4.6, a significant portion of the work-exempt cases are child only. These cases are expected to remain work exempt, while certain other cases may transition to work-eligible cases. In July 2016, 33.6% of cases were child only statewide, (approximately two-thirds of work-exempt cases). Exhibit 4.8 presents information on the share of each jurisdiction’s cases that were child only in fiscal 2016. St. Mary’s County, the jurisdiction with the highest share of work-eligible cases, had the lowest share of cases that were child only (21.2%). In total, eight jurisdictions had fewer than 30.0% of its cases that were child only. Two jurisdictions had more than 50.0% of its cases that were child only (Caroline and Worcester counties). These two counties also had the lowest share of work-eligible cases. Both jurisdictions have relatively small numbers of TCA cases (less than 250).

42 Overview of the Temporary Assistance for Needy Families Program in Maryland
Exhibit 4.7
Share of Cases That Are Work Eligible Fiscal 2016
Note: Jurisdictional profile data includes all cases that received Temporary Cash Assistance for one month during the year. Source: University of Maryland School of Social Work, Life on Welfare: Temporary Cash Assistance Families and Recipients: 2016 Jurisdictional Profile
Worcester

Chapter 4. Temporary Cash Assistance Caseload 43
Exhibit 4.8
Child-only Cases Fiscal 2016
Note: Jurisdictional profile data includes all cases that received Temporary Cash Assistance for one month during the year. Source: University of Maryland School of Social Work, Life on Welfare: Temporary Cash Assistance Families and Recipients: 2016 Jurisdictional Profile Reasons for Case Closure Statewide Over time, the reasons for TCA case closure have changed. UM SSW annually releases reports on caseload exits. This data shows that in the early years of welfare reform, the most common reasons for case closure related to failure to reapply for benefits and having income over the limit/starting work. In more recent years, the most common reason for case closure has been work sanctions. Exhibit 4.9 provides information on the five most commonly cited reasons for case closure as determined by UM SWW Caseload Exit series. As noted in this series, some causes, such as having income over the limit/start of work, may be understated because individuals may choose not to reapply because of a belief that the household will be ineligible due to income from employment. As shown in these exhibits, failure to comply with work requirements was not in the top five reasons for case closure in federal fiscal 1997 but in federal fiscal 2016 was the most common reason (29.9% of case closures). Having income over the limit/starting work
St. Mary’s

44 Overview of the Temporary Assistance for Needy Families Program in Maryland
combined represented 29.9% of case closures in federal fiscal 1997, but only 17.5% in federal fiscal 2016.
Exhibit 4.9 Top Five Reasons for Case Closure
Federal Fiscal 1997, 2006, 2016
1997 (n = 41,212) 2006 (n = 23,509) 2016 (n = 20,668) Failure to reapply 19.9% 17.5% 14.6% Income over limit 18.1% 19.9% 17.5% Failure to give eligibility information 13.7% 23.0% 19.8% Start of work 11.8% Request of client 8.9% Failure to comply with work
requirements
20.0%
29.9% Not eligible 5.6% 6.4% Source: University of Maryland School of Social Work, October 1996 – September 1997 Caseload Exits at the Local Level; University of Maryland School of Social Work, October 2005 – September 2006 Caseload Exits at the Local Level; University of Maryland School of Social Work, October 2015 – September 2016 Caseload Exits at the Local Level The period of the Great Recession had only a limited impact on the top reason for case closure. The share of cases closed due to having income over the limit/starting work remained relatively the same, and at 18.0%, was only marginally higher than in the most recent period (federal fiscal 2016). The primary difference during the Great Recession was an increase in the share of cases closed due to noncompliance with work requirements (which increased to 34.5% in federal fiscal 2009) and a reduction in the share of case closures due to failure to give eligibility information (12.5% in federal fiscal 2009). Sanctions as a reason for case closure increased due to federal policy changes rather than the Great Recession. Jurisdiction Level The primary reason for case closure varies by jurisdiction. Within any given jurisdiction, the most common primary reason for case closure has also often changed over time, consistent with statewide changes. In federal fiscal 1997, having income over the limit/started work was the top reason for case closure in 21 of 24 jurisdictions. In federal fiscal 2006, having income over the limit/started work was the top reason for case closure in 17 of 24 jurisdictions. However, as shown in Exhibit 4.10, in federal fiscal 2016, having income over the limit/started work was the

Chapter 4. Temporary Cash Assistance Caseload 45
top reason for case closure in only 8 jurisdictions, while work sanctions were the top reason in 11 jurisdictions.
Exhibit 4.10 Top Reason for Case Closure by Jurisdiction
Federal Fiscal 2016
Source: University of Maryland School of Social Work, October 2015 – September 2016 Caseload Exits at the Local Level Case Closure Due to Sanctions Statewide Exhibit 4.11 presents data on the year-by-year changes on the share of cases that closed due to work sanctions. In federal fiscal 1997, only 5.5% of case closures were due to a work sanction. This figure generally trended upward following that period through federal fiscal 2010. In the last several years, the use of work sanctions has fluctuated but remained above 25.0% in each year. The increase in the use of work sanctions would not be entirely unexpected given that Maryland altered its penalty for noncompliance over time. According to the Urban Institute Welfare Rules Databook, in 1996, the most severe sanction in Maryland for noncompliance was a reduction in benefits for the adult portion until compliance (or for six months). However, by 2002,

46 Overview of the Temporary Assistance for Needy Families Program in Maryland
Maryland’s most severe sanction for noncompliance was a full family sanction until the case was in compliance for one month. DHS explains changes in the sanction policy for noncompliance with work requirements resulted in an increase in case closures due to work sanctions around fiscal 2000. These changes included requiring recipients that had reached a cumulative 24-month limit on receipt of TANF to be in State-defined work activity or face a full family sanction for noncompliance unless the noncompliance was found to be for a good cause or the individual is determined to be exempt. The second uptick in case closures due to work sanctions resulted from federal policy changes due to the Deficit Reduction Act (DRA). The final rule changes related to the DRA went into effect October 1, 2008 (federal fiscal 2009).
Exhibit 4.11 Cases Closed Due to Sanctions
Federal Fiscal 1997-2016
Source: University of Maryland School of Social Work Caseload Exits at the Local Level Case closures due to sanctions related to child support noncompliance has also generally increased over time but has remained relatively infrequent. The percent of case closures due to
0%
5%
10%
15%
20%
25%
30%
35%
40%
45%
Work Child Support

Chapter 4. Temporary Cash Assistance Caseload 47
child support sanctions was the highest in federal fiscal 2016, reaching 5%. However, in most years, the percentage of case closures due to child support noncompliance was less than 3%. Jurisdiction Level The percent of case closures due to work sanctions varies by jurisdiction. In some jurisdictions, case closures for this reason are relatively uncommon, while in others work sanctions are a substantial share of closures. Exhibit 4.12 shows the percent of case closures due to work sanction by jurisdiction in federal fiscal 2016. The data is generally consistent with the past several years. In federal fiscal 2016, two jurisdictions had fewer than 10.0% of cases close due to work sanctions (Talbot and Worcester counties). Five jurisdictions had more than 30.0% of cases closed due to work sanctions. Anne Arundel County had the highest share of case closures due to work sanctions (38.6%).
Exhibit 4.12 Case Closures Due to Work Sanctions by Jurisdiction
Federal Fiscal 2016
Source: University of Maryland School of Social Work October 2015 – September 2016 Caseload Exits at the Local Level As discussed earlier, statewide rates of case closure due to child support noncompliance are low. A few individual jurisdictions experience higher rates of case closure due to child support
Worcester

48 Overview of the Temporary Assistance for Needy Families Program in Maryland
noncompliance, as shown in Exhibit 4.13. However, even in these jurisdictions, rates remained below 10.0% in federal fiscal 2016. In that year, Montgomery County had the highest percentage of case closures due to child support noncompliance (8.1%). Three other jurisdictions had more than 7.0% of case closures due to child support noncompliance (Dorchester, Prince George’s, and Worcester counties). DHS indicates that the higher rates of child support sanction in Dorchester and Worcester counties are the effects of small caseload sizes, which result in smaller numbers of sanctions producing higher rates. DHS does not note any specific cause of the higher rates of child support sanctions in Montgomery and Prince George’s counties. Four jurisdictions had no case closures due to child support noncompliance. Only one jurisdiction, Worcester County, has a share of case closures due to child support compliance equal to or higher than the share of case closures due to work sanctions in federal fiscal 2016.
Exhibit 4.13 Case Closures Due to Child Support Sanctions
Federal Fiscal 2016
Source: University of Maryland School of Social Work October 2015 – September 2016 Caseload Exits at the Local Level
Garrett Frederick
Queen Anne’s
Calvert

49
Chapter 5. Benefit Levels Cash Assistance Grant Levels States had certain flexibility to set benefit levels under Aid to Families with Dependent Children. As such, benefit levels were not equal across states even prior to the change in funding for cash assistance. According to the Welfare Rules Databook, the maximum benefit for a family of three in 1996 ranged from $120 in Mississippi to $923 in Alaska. A total of 14 states had a maximum benefit at that time greater than $500 while the same number had benefits of less than $300. In 2015, the maximum benefit for a family of three ranged from $170 in Mississippi to $923 in Alaska. In that year, 17 states had a maximum benefit greater than $500 (an increase of only 3 states since 1996), and 14 states (the same number as in 1996) still had a maximum benefit of less than $300.
According to the Welfare Rules Databook, 17 states had the same maximum benefit for a
family of three in July 2015 as the state had in July 1996. Six states (Arizona, Hawaii, Idaho, New Mexico, Oklahoma, and Washington) had a lower maximum benefit in July 2015 than they did in July 1996 (in nominal dollars). Arizona and Hawaii had decreases in maximum grant levels of more than 10.0%, while the other 4 states had decreases of less than 5.0%. The mean maximum benefit for a family of three in July 1996 was $393. In July 2015, the mean maximum benefit for a family of three had increased only 11.2% to $437. In inflation adjusted dollars, the mean maximum benefit in July 2015 was 26.7% lower than in July 1996.
As has been noted by the Center for Budget and Policy Priorities, and shown in the data provided by the Welfare Rules Databook, only two states (Wyoming and Maryland) had higher inflation adjusted cash assistance benefits in July 2015 than July 1996, based on the maximum benefit provided to a family of three. Both states had increases of greater than 10.0% in inflation adjusted dollars (Maryland increased 12.4%, and Wyoming increased 19.4%). Only one additional state saw the value of the benefit decline by less than 5.0% during this period (Texas).
Maryland
The maximum benefit for a three-person household in Maryland in July 2015 ($636) was the eighth highest among all states. In July 1996, Maryland’s maximum benefit for a three person household ($373) was the twenty-sixth highest among all states. While Maryland’s benefits as of July 2015 were relatively generous compared to other states, the cost of living in Maryland is relatively high compared to most states. According to the Missouri Economic Research and Information Center, for the second quarter of 2017, Maryland had the eighth highest cost of living.5 5 Missouri Economic Research and Information Center. (2017). Cost of Living Data Series Second Quarter 2017. This data may be accessed at: https://www.missourieconomy.org/indicators/cost_of_living/

50 Overview of the Temporary Assistance for Needy Families Program in Maryland
As a result, benefits in the State would be expected to be more generous than other states. Six of the 10 highest cost-of-living states were in the top 10 in benefit amounts in July 2015.
Temporary Cash Assistance (TCA) benefits in Maryland are calculated in a manner that
accounts for inflation. As such, Maryland is one of two states that saw an increase in the maximum benefit in inflation adjusted dollars. Under Section 5-316 of the Human Services Article, the Governor is required to include in the budget sufficient funds to provide a TCA benefit, when combined with federal Supplemental Nutrition Assistance Program (SNAP) benefits, equal to at least 61% of the State minimum living level (MLL). If the Governor does not provide this level of benefit, the Governor must report to the General Assembly on the reason for the lower funding level.
The MLL was first developed as part of the 1979 Governor’s Commission on Welfare
Grants. Joint Resolution 34 of 1980 requires the Department of Human Services (DHS) to use the finding of the commission (updated annually) as a basis for evaluating budgetary requirements of various public assistance programs. The original calculation was based on a four-person household, but in 1995 this calculation was recalibrated to a three person household to reflect the average household size. The MLL was calculated based on items a family would need and included nine components (food, rent, utilities, household furnishings, clothing and cleaning, personal care, transportation, medical care, and other consumption). It is updated annually only to account for inflation. The MLL and resulting TCA grant levels are determined statewide and do not account for regional differences in the cost of living.
There have been questions recently regarding whether 61% of the MLL is an adequate
benefit level because, by definition, it is only a portion of what is determined to be the minimum level needed. For federal fiscal 2017, DHS determined the MLL for a family of three was $1,900 per month, or $22,800 annually, slightly higher than the 2017 federal poverty level (FPL) ($20,420). The required 61% of the MLL for TCA and Food Supplement Program (FSP) in fiscal 2017 of $1,159 per month is 68% of the FPL. The 2016 Joint Chairmen’s Report requested DHS examine the feasibility of incrementally increasing the percent of the MLL that must be met over the next 10 years by 1 percentage point per year. In the response, DHS estimated that the maximum benefit for a family of three would increase from $648 in fiscal 2017 to $919 in fiscal 2027 ($210 higher than DHS would otherwise project). If, in fiscal 2017, the benefit level was calculated at 72% of the MLL (as would occur in fiscal 2027 scenario presented by DHS), the combined maximum benefit level of TCA and FSP would have been 80% of the FPL, compared to 68% under the existing calculation.
Federal SNAP benefits are set by the U.S. Department of Agriculture (USDA), including
the maximum benefit, the overall calculation, and certain deduction amounts. The USDA calculations take into account inflation although the maximum benefit will not necessarily increase each year. Even though DHS adjusts the MLL annually based on inflation, the MLL will not always increase, for example, when there is no inflation. Similarly, because the TCA benefit is based both on the MLL and the federal SNAP benefit, an increase in the MLL will not necessarily result in an increase in the TCA benefit. For example, the maximum benefit for a family of

Chapter 5. Benefit Levels 51
three remained the same from fiscal 2009 through 2012. During each of those years, the MLL increased (though minimally in some years), but the federally determined SNAP benefit was high enough to allow DHS to leave the TCA benefit unchanged and meet the 61% requirement. Exhibit 5.1 provides information on the maximum benefit for a family of three in nominal and 1996 dollars since 1996.
Exhibit 5.1 Maximum Cash Assistance Benefit for a Family of Three
Fiscal 1996-2016
Source: Bureau of Labor Statistics; Department of Human Services; Department of Legislative Services In fiscal 2016, accounting for inflation, the maximum benefit for a family of three in Maryland was approximately 11% higher than in 1996. In two different periods, the inflation adjusted value of the benefit declined for several years before the next increase. Both of these periods were around economic downturns. During the earlier period (fiscal 2002 through 2006), the nominal value of the benefit increased each year, but very minimally, while during the second period (fiscal 2009 through 2013), the nominal value of the benefit remained the same for all but one year.
$0
$100
$200
$300
$400
$500
$600
$700
Nominal Dollars 1996 Dollars

52 Overview of the Temporary Assistance for Needy Families Program in Maryland

53
Chapter 6. Outcomes for Temporary Cash Assistance Recipients and Former Recipients
Job Placement and Retention for Recipients
There are several ways of measuring the success of the Temporary Assistance for Needy Families (TANF) program in moving individuals off cash assistance into jobs. One measure is the reason for case closure. If the TANF work requirements were successful, the expectation is that a high percentage of cases would close due to having an income over the limit/starting work, while relatively few cases would close due to noncompliance with work requirements. As discussed previously, in earlier periods in Maryland cases closing due to income was the most common reason for case closure. Recent trends suggest the opposite has occurred with the number of jurisdictions in which income over limit was the top reason for case closure declining and case closures due to work sanctions increasing. Further study would be required to determine if case composition, economic conditions, or policy enforcement is driving this trend.
A second way of measuring success is the job placement and retention rate. Exhibit 6.1
shows the job placement rate from federal fiscal 1998 through 2016. As shown in this exhibit, the job placement rate generally increased in the initial years after welfare reform. The job placement rate suffered during the Great Recession, falling from 46.1% in federal fiscal 2008, to a low of 35.3% in federal fiscal 2010. However, the job placement rate has rebounded and reached new highs in federal fiscal 2015 and 2016 (approaching 60.0%). The job placement rate, however, is limited in the heights that may be reached due to the inclusion of work-exempt cases (such as child-only cases) in the calculation. In federal fiscal 2015 and 2016, more than 13,000 individuals were placed into jobs each year from Temporary Cash Assistance (TCA).

54 Overview of the Temporary Assistance for Needy Families Program in Maryland
Exhibit 6.1
Job Placement and Job Retention Federal Fiscal 1998-2016
Note: Job placement measures the total number of placements as a percentage of the average monthly Temporary Cash Assistance cases in each State fiscal year. Job retention measures the percentage of individuals who obtained employment in one calendar quarter and remained employed in the following quarter. Job retention rate information for federal fiscal 2016 is not expected to be available until November 2017. Source: Department of Human Services; Department of Budget and Management; Governor’s Budget Books; Department of Legislative Services The job retention rate has held relatively steady over the years. Through federal fiscal 2011, the job retention rate was between 73% and 75% in all but three years. Despite higher numbers of job placements since fiscal 2012, the job retention rate reached 79% in federal fiscal 2014 and 2015. This is a relatively short-term measure of job retention but is a positive sign.
0%
10%
20%
30%
40%
50%
60%
70%
80%
90%
100%
0
1,500
3,000
4,500
6,000
7,500
9,000
10,500
12,000
13,500
15,000
Job Placements (Number) Job Retention Job Placement Rate (Percent)

Chapter 6. Outcomes for Temporary Cash Assistance Recipients and Former Recipients 55
Outcomes for Recipients After Exit Employment and Earnings Another measure of job placement success is found in the annual Life After Welfare report, published by the University of Maryland School of Social Work. This series, produced annually, has been published since October 1997. In the 2016 update, the report focused only on leavers from January 2004 through March 2016. As a result, this study does not include comparisons with the earliest TCA leavers. However, the update still provides valuable comparisons on how individuals fare after leaving TCA and how this has changed over time. Exhibit 6.2 presents data on the percent of leavers who worked at some point in the year before receiving TCA and at some point in the year after leaving TCA for (1) mid-2000s recovery leavers (exited between January 2004 and March 2007); (2) Great Recession leavers (exited between April 2007 and December 2011); and (3) Great Recession recovery leavers (exited between January 2012 and March 2016). As shown in this exhibit, mid-2000s recovery leavers fared considerably better than leavers in the latter two periods. These leavers also were more likely to have worked at some point in the year prior to receiving TCA. Of the more recent leavers, the Great Recession recovery leavers had a higher rate of employment at some point in the year after exit than those who left during the Great Recession. Great Recession recovery leavers also had the greater increase between those who worked at some point in the year prior to receiving TCA and at some point in the year after leaving TCA. It is evident with this data that the economic conditions facing individuals upon exiting TCA greatly impact the ability to work after exit.
Exhibit 6.3 presents data on the median earnings for individuals in the year prior to receiving TCA and the year after exiting TCA for each group of leavers. Each of the three groups of leavers had higher median earnings in the year after exiting TCA than the year prior to receiving TCA. This is not surprising given the higher rates of employment in the year after exit and that to be eligible for TCA, individuals have insignificant earnings. However, as with the employment data, mid-2000s recovery leavers had the highest median earnings in the year after TCA exit of the three groups of leavers. The mid-2000s recovery leavers also had the largest increase in median earnings when comparing the year prior to TCA receipt and the year after exiting TCA. As with the employment data, the Great Recession recovery leavers fared better than Great Recession leavers. While Great Recession leavers had the higher median earnings in the year prior to TCA receipt, these leavers had the lower median earnings in the year after exiting. This again shows that economic conditions play a substantial factor in the employment outcomes of individuals exiting TCA.

56 Overview of the Temporary Assistance for Needy Families Program in Maryland
Exhibit 6.2
Employment Prior to and Receiving and After Leaving TCA
TCA: Temporary Cash Assistance 1 Due to the timing of the report, one year of employment data for the most recent TCA leavers is not yet available. Note: This exhibit is derived from data collected by the University of Maryland School of Social Work and presented in the Life After Welfare: Annual Update, December 2016. It follows a sample of leavers from October 1996 (although the data presented in the current report is only for leavers beginning January 2004) through March 2016, the sample excludes those that returned to TCA within 30 days. This data includes TCA leavers employed in jobs in Maryland covered by unemployment insurance. Source: University of Maryland School of Social Work, Life After Welfare: Annual Update, December 2016
63.6%57.9%
52.0%
68.8%
59.4% 62.2%
0%
10%
20%
30%
40%
50%
60%
70%
80%
Mid-2000s Recovery(n = 2,511 Pre-TCA and
2,519 Post TCA)
Great Recession(n = 3,716 Pre-TCA and
3,724 Post TCA)
Great Recession Recovery(n = 3,975 Pre-TCA and
3,068 Post TCA)¹
Worked at Some Point in the Year Before TCA Entry
Worked at Some Point in the Year After TCA Exit

Chapter 6. Outcomes for Temporary Cash Assistance Recipients and Former Recipients 57
Exhibit 6.3
Median Earnings Prior to and Receiving and After Leaving TCA (in 2016 Dollars)
TCA: Temporary Cash Assistance 1 Due to the timing of the report, one year of employment data for the most recent TCA leavers is not yet available. Note: This exhibit is derived from data collected by the University of Maryland School of Social Work and presented in the Life After Welfare: Annual Update, December 2016. It follows a sample of leavers from October 1996 (although the data presented in the current report is only for leavers beginning January 2004) through March 2016, the sample excludes those that returned to TCA within 30 days. This data includes TCA leavers employed in jobs in Maryland covered by unemployment insurance. Source: University of Maryland School of Social Work, Life After Welfare: Annual Update, December 2016
$4,694
$5,206
$4,598
$8,142
$7,585$7,815
$0
$1,000
$2,000
$3,000
$4,000
$5,000
$6,000
$7,000
$8,000
$9,000
Mid-2000s Recovery(n = 2,511 Pre-TCA and
2,519 Post TCA)
Great Recession(n = 3,716 Pre-TCA and
3,724 Post TCA)
Great Recession Recovery(n = 3,975 Pre-TCA and
3,068 Post TCA)¹
Median Annual Earnings in the Year Before TCA Entry
Median Annual Earnings in the Year After TCA Exit

58 Overview of the Temporary Assistance for Needy Families Program in Maryland
Returns to TCA Another measure of the success of TCA is whether the TCA exit is temporary or more permanent. Exhibit 6.4 provides information on the percent of cases that first returned to TCA after exit at 3 months, 6 months, and 12 months for each of the three groups of leavers. As shown in this exhibit, the mid-2000s recovery leavers had a lower share of cases return to TCA at both 3 and 6 months (a cumulative 20.6%) than the more recent leavers (over 23% in the two most recent periods). Great Recession recovery and Great Recession leavers had a similar share of cases return to TCA for the first time by 6 months (around 23.0%). These two groups also had a similar share of those that returned for the first time by 12 months (around 32.0%). The higher rates of return to TCA within 12 months after exit for the more recent leavers compared to the mid-2000s recovery leavers is likely further evidence that economic conditions upon exit matter in post TCA success.
Exhibit 6.4 Returns to TCA After Exit
TCA: Temporary Cash Assistance Note: Due to the timing of the report, one data after exit for the most recent TCA leavers is not yet available. This exhibit is derived from data collected by the University of Maryland School of Social Work and presented in the Life After Welfare: Annual Update, December 2016. It follows a sample of leavers from October 1996 (although the data presented in the current report is only for leavers beginning January 2004) through March 2016, the sample excludes those that returned to TCA within 30 days. Source: University of Maryland School of Social Work, Life After Welfare: Annual Update, December 2016
13.5% 14.7% 13.9%
7.1%8.4% 9.6%
9.1%9.1% 9.0%
0%
5%
10%
15%
20%
25%
30%
35%
Mid-2000s Recovery Great Recession Great Recession Recovery
3 Months 6 Months 12 Months

Chapter 6. Outcomes for Temporary Cash Assistance Recipients and Former Recipients 59
Continued Receipt of Public Assistance In addition to returns to TCA, those exiting may continue to receive other public assistance benefits. Exhibit 6.5 shows receipt of TCA, Medicaid, and the Food Supplement Program (FSP) benefits in the first five years after exit for all cohorts of leavers. As shown in this exhibit, TCA receipt is relatively low in the five years after exit, and the receipt declines over time. By four years after exit, less than a quarter of leavers are receiving TCA. However, Medicaid and FSP use remains greater than 50%, even after five years. Although receipt of both benefits decline over the five years, slightly more than 80% are receiving Medicaid after five years while more than two-thirds are receiving FSP. This indicates that while individuals may be earning too much money to return to TCA, income remains low enough to qualify for other benefits for the vast majority of those exiting TCA. As such, a significant share of families remain in precarious financial situations.
Exhibit 6.5 Receipt of Public Assistance
TCA: Temporary Cash Assistance
Note: Due to the timing of the report, five years of data is not available for all leavers. This exhibit is derived from data collected by the University of Maryland School of Social Work and presented in the Life After Welfare: Annual Update, December 2016. It follows a sample of leavers from October 1996 (although the data presented in the current report is only for leavers beginning January 2004 through March 2016, the sample excludes those that returned to TCA within 30 days. Due to the timing of the report, five years of data is not available for all leavers. Source: University of Maryland School of Social Work, Life After Welfare: Annual Update, December 2016
31.3% 30.4% 26.6% 24.3% 23.0%
96.6% 88.8% 85.6%82.1% 80.6%83.3%
74.0%70.7% 68.2% 67.1%
0%
10%
20%
30%
40%
50%
60%
70%
80%
90%
100%
Year 1 (n = 10,733) Year 2 (n = 9,743) Year 3 (n = 8,699) Year 4 (n = 7,601) Year 5 (n = 6,515)
TCA Medical Assistance Food Supplement

60 Overview of the Temporary Assistance for Needy Families Program in Maryland
Differentiated by cohort, however, there are some differences in the subsequent program participation. Exhibits 6.6, 6.7, and 6.8 provide information on program participation by cohort for TCA, Medicaid, and FSP. As shown in Exhibit 6.6, TCA receipt in the first two years after exit was higher for both the Great Recession and Great Recession recovery leavers than the mid-2000s recovery leavers. For example, 32.4% of Great Recession recovery leavers received TCA two years after exit compared to only 28.0% of mid-2000s recovery leavers. However, Great Recession leavers were receiving TCA at an equivalent level as mid-2000s recovery leavers by Year 4 and received TCA at a lower rate in Year 5 after exit. This indicates the economic conditions in the immediate aftermath of leaving TCA may have influenced the returns to TCA for the Great Recession leavers.
Exhibit 6.6 Subsequent Receipt After Exit of
Temporary Cash Assistance Benefits by Cohort
Note: This exhibit is derived from data collected by the University of Maryland School of Social Work for leavers beginning January 2004 through March 2016. The sample excludes those that returned to Temporary Cash Assistance within 30 days. Five years post exit is not available for the most recent Great Recession recovery leavers. In addition, small numbers in Year 4 after exit potentially skew the data and are therefore not presented. Source: Department of Human Services; University of Maryland School of Social Work
0%
5%
10%
15%
20%
25%
30%
35%
Year 1 Year 2 Year 3 Year 4 Year 5
Mid-2000s Recovery Great Recession Great Recession Recovery

Chapter 6. Outcomes for Temporary Cash Assistance Recipients and Former Recipients 61
Exhibit 6.7
Subsequent Receipt After Exit of Medical Assistance Benefits by Cohort
Note: This exhibit is derived from data collected by the University of Maryland School of Social Work for leavers beginning January 2004 through March 2016, the sample excludes those that returned to Temporary Cash Assistance within 30 days. Five years post exit is not available for the most recent Great Recession recovery leavers. In addition, small numbers in Year 4 after exit potentially skew the data and are therefore not presented. Source: Department of Human Services; University of Maryland School of Social Work As shown in Exhibit 6.7, the receipt of Medicaid benefits in the first year after exit is nearly identical for all three cohorts of leavers (around 96.5%). From Year 2 through 4 after exit, Great Recession leavers were receiving Medicaid at substantially higher rates than mid-2000s recovery leavers. By Year 5 after exit, the gap in receipt of Medicaid narrowed, though Great Recession leavers still received Medicaid at a slightly higher rate. As shown in Exhibit 6.7, more than 85.0% of Great Recession leavers received Medicaid in the first three years after exit. This higher rate of receipt is likely to continue in subsequent cohorts given the expansions of Medicaid eligibility in recent years.
0%
10%
20%
30%
40%
50%
60%
70%
80%
90%
100%
Year 1 Year 2 Year 3 Year 4 Year 5
Mid-2000s Recovery Great Recession Great Recession Recovery

62 Overview of the Temporary Assistance for Needy Families Program in Maryland
Exhibit 6.8
Subsequent Receipt After Exit of Food Supplement Program Benefits by Cohort
Note: This exhibit is derived from data collected by the University of Maryland School of Social Work for leavers beginning January 2004 through March 2016, the sample excludes those that returned to the Temporary Cash Assistance program within 30 days. Five years post exit is not available for the most recent Great Recession recovery leavers. In addition, small numbers in Year 4 after exit potentially skew the data and are therefore not presented. Source: Department of Human Services; University of Maryland School of Social Work Each successive cohort of leavers received FSP at a higher rate than the prior cohort, as shown in Exhibit 6.8. The gap had somewhat narrowed by Year 5. However, Great Recession leavers still received FSP at more than four percentage points higher than other cohorts. Specifically, 88.2% of Great Recession recovery leavers received FSP in the first year of exit and slightly more than 80.0% received FSP in the second year of exit compared to less than 80.0% in the first year and less than 70.0% in the second year for mid-2000s recovery leavers. These results may be influenced by FSP outreach activities in addition to economic conditions. Trends for the most recent cohorts of leavers bear watching as more data becomes available. No Great Recession recovery leavers had reached Year 5 after exit in the available data and the relatively small numbers in Year 4 make the data unreliable. However, trends indicate that those leaving TCA are earning incomes that keep them eligible for other benefits at a higher rate than in the past, providing ongoing concerns about the financial situation of those exiting TCA.
0%10%20%30%40%50%60%70%80%90%
100%
Year 1 Year 2 Year 3 Year 4 Year 5Mid-2000s Recovery Great Recession Great Recession Recovery

Chapter 6. Outcomes for Temporary Cash Assistance Recipients and Former Recipients 63
Comparison of Maryland Leaver Outcomes with Leavers in Other States Few recent studies were found that have examined the outcomes of leavers from cash assistance in other states. A couple of the studies that do present similar outcomes and are focused on all leavers in certain time periods, studies which are the most comparable to those done in Maryland, are summarized below. As shown, outcomes in Maryland are similar to Vermont in terms of public benefit receipt after exit. However, outcomes in Maryland appear lower in terms of employment and earnings after exit.
Vermont Vermont has reviewed outcomes one year post exit at three points in time (2003, 2008, and
2013). These time periods are generally comparable to the three current cohorts of leavers discussed in the Life After Welfare series in Maryland. The study regarding the 2013 leavers includes some comparisons with the earliest leavers and presents data that is generally comparable to the Life After Welfare series. The study of 2013 leavers6 noted that, for 2003 and 2013 leavers, 75% had earnings in the first year after exit, while 69% of 2008 leavers had earnings in the first year of exit. These figures are each considerably higher than those found in Maryland, as shown in Exhibit 6.2. One potential factor is that Vermont’s study includes income from self-employment as well as employment covered by Unemployment Insurance. This factor may partly explain the difference in the median annual earnings reported for 2013 leavers ($11,772) in Vermont compared to the Great Recession recovery leavers in Maryland ($7,815). However, the receipt of public assistance within one year after exit was relatively similar to Maryland. In Vermont, 31.0% of 2013 leavers returned to cash assistance benefits at least one time within the first year, while 32.5% of Great Recession recovery leavers did so in Maryland. In addition, 94.0% of 2013 leavers received Medicaid one year after exit and 87.0% received federal food assistance benefits one year after exit in Vermont, which is comparable to the Great Recession recovery leavers in Maryland rates of 96.5% for Medicaid and 88.2% for federal food assistance benefits. Colorado Colorado has also produced some reports on those exiting cash assistance. A report published in 2009 by the Lewin Group tracks those that left cash assistance in the first quarter of 2007.7 The study was conducted primarily through a survey, although some data is reported based
6 Black-Plumeau, Leslie and McIntyre, Robert (2015) Leaving Reach Up: How did the experiences of Vermont’s 2013 welfare leavers compare to earlier leavers? Prepared for the Economic Services Division, Vermont Department for Children and Families. 7 The Lewin Group (2009) Welfare Leavers in Colorado. Prepared for the Colorado Department of Human Services.

64 Overview of the Temporary Assistance for Needy Families Program in Maryland
on the earnings covered by Unemployment Insurance. The survey was conducted from August to November 2008 (which was 17 to 23 months after exit for the leavers). The sample included 494 individuals. Given the extended nature (rather than in the first year after exit) the data is not completely comparable to Maryland. In addition, much of the data is self-reported. However, the information may be instructive in a comparison with Maryland. The survey found a higher rate of individuals that had worked at some point after exit than was found in Maryland (83.0%). At the time of the survey, 53.0% of leavers were working in Colorado. Wage information was presented in a different format, but indicated that the median wage was slightly less than $9.25 per hour, with 9.0% of leavers having an hourly wage of more than $15.00. The survey also found fewer leavers reported having received cash assistance at some point after exit (11.0%), federal food assistance benefits (59.0%), and public health insurance (54.5%). Higher rates of public health benefit receipt was reported for children of the survey recipients (nearly 77.0%). Based on data on Unemployment Insurance covered employment, 79% of the leavers worked in at least one of the six quarters after exit and approximately 25% worked in all six quarters. Both the employment rates from the survey and Unemployment Insurance covered employment data indicate that leavers in Colorado were working at much higher rates post exit than in Maryland. Median quarterly earnings in the six quarters after exit ranged from $2,729 to $3,060. The Colorado study included a number of other measures not available in the Maryland reports. The study found that half of the leavers were food insecure, including 28% with very low food security. In addition, one-third of the leavers reported having no health insurance in the month prior to the survey. These findings point further to the notion that individuals leaving cash assistance may have earnings sufficient to limit or prevent returns to benefits, but many leavers remain in precarious financial situations.

65
Chapter 7. Conclusions Although not a feature of all block grants, the Temporary Assistance for Needy Families (TANF) program has suffered due to the lack of built-in inflationary increases. For most of the program’s existence, funding has remained level, which means it has lost value over time due to the effects of inflation. States have had to make more difficult spending choices due to this lost value than would have been required if there were inflationary increases. Reductions in the basic block grant in federal fiscal 2017, although small, are still of concern given the limited balance following years of deficits. While the transition from Aid to Families with Dependent Children (AFDC) to TANF provided states with some additional flexibility on the design of the program and the use of funds, not all of the outcomes of the transition have been positive. The flexibility of the block grant allows states to benefit from reduced caseloads by building balances to protect against caseload growth in the future and to spend TANF on additional programs that assist individuals in leaving Temporary Cash Assistance (TCA). However, it is tempting for states, including Maryland, to extend the TANF spending to allowable but peripherally related activities. This diversion of funds could limit investment in additional resources for this population that could reduce returns to the program and/or reliance on other assistance programs.
Additionally, while this practice of diversion is manageable in periods of declining caseload, during the Great Recession when caseloads rapidly increased, it led to deficits in the program that continued until fiscal 2017 and were only managed by advancing payments intended for the following fiscal year. Therefore, the limits to the investment in job training and other transition-related assistance (e.g., child care) are a function of both the lack of inflationary increases leading to lost value over time and the State’s diversion to eligible but noncore activities through the years. Creating a block grant is not the cause of limited investment, but the flexibility allowed makes it a tempting alternative to general funds for programs in need of dollars, which ultimately limits investments in the program. The trend of recipients both nationally and in Maryland indicate that the program has responded to economic conditions in the expected manner. The number of recipients increased on a year-over-year basis during both the years of the recession and in the immediate aftermath. However, in Maryland, compared to Food Supplement Program (FSP), the increase in recipients during the Great Recession occurred at a lower rate and for a shorter time period. A portion of this may be due to differences in eligibility in that FSP has a higher income eligibility and captures more of the underemployed population. Maryland did not respond to increasing recipients by altering eligibility criteria or making it more difficult for households to receive or maintain benefits during the Great Recession. However, Maryland is in the bottom half of states in terms of the maximum income for which a household is eligible for TCA. The 2016 Joint Chairmen’s Report (JCR) requested that the Department of Human Services (DHS) examine options for increasing eligibility for TCA. While DHS provided information on the potential impact on the TCA caseload

66 Overview of the Temporary Assistance for Needy Families Program in Maryland
of several options for increasing TCA eligibility, in its response, the department expressed concern about the ability to serve more families given the level funding of the block grant. In most states, the transition from AFDC to TANF has led ultimately to lost value in cash assistance benefits. As noted, Maryland is one of only two states that have had benefits increase in inflation-adjusted dollars between 1996 and 2015, a function of a statutory benefit calculation that indirectly includes inflationary increases. Ultimately, even though the program benefits have kept up with inflation and rank in the top 10 of states (as of July 2015), the benefits are calculated based on providing 61% of the minimum level needed to live in the State (in combination with FSP benefits). It is questionable whether this is an adequate level since it is below what the State determines as the minimum level needed. Only on rare occasions when the FSP benefits are increased nationally does the combined benefit exceed the minimum rate. The 2016 JCR requested that DHS examine the feasibility of increasing the percent of the minimum living level met by the combined benefits over the next 10 years. DHS examined the feasibility but expressed concern about the impact of such a change on other programs funded through TANF. The decision on the benefit level, as with eligibility, is a matter of the State’s policy decisions on how TANF should be used though the TANF grant is a limiting factor. The outcome data presented in the 2016 Life After Welfare Annual Update shows that individuals generally do better in the first year after exit (in terms of earnings and employment) than the year prior to entering TCA. However, in both measures, it is clear that exiting TCA in a period of good economic times is beneficial. Significantly, the ongoing Medicaid and FSP receipt of leavers five years after exit provides some indication that earnings remain low for individuals after leaving TCA even though relatively low numbers return to TCA. Further, receipt of FSP and Medicaid have been higher for recent cohorts through several years post exit compared to the earlier leavers. While this is likely impacted by changes in eligibility and/or outreach activities for the programs, the trends indicate that income remains low for individuals in all cohorts post exit.
Comparisons with other states are limited based on the few comparable studies. However Vermont reported similar rates of public assistance receipt in the year after exit as was found in Maryland. However, earnings and employment outcomes in Maryland appear worse than those in Colorado and Vermont with a lower share of leavers working and lower median earnings. Some outcomes appear limited by program policies. For example, federal rules limit the length of time vocational education training can count toward work participation (12 months) and the number of hours that can be counted for certain types of education and training (education and training related to employment often are only counted after an individual has participated in another activity for 20 hours per week). While states can alter these requirements to some extent, states are limited in that the additional hours or time would not be countable toward the work participation rate. Longer education and training periods, including lengths that would allow for the completion of some college degrees, might assist individuals in obtaining higher pay which could improve self-sufficiency outcomes. However, the current 12-month limit for vocational

Chapter 7. Conclusions 67
training is not adequate for many degrees and the limits in education and training hours that may count as a work activity also make completion of degrees more difficult.

68 Overview of the Temporary Assistance for Needy Families Program in Maryland

69
FY 2014 IVlaryland SATS Program Resulffi for TCA Participanffi
Transaci:ion Category
#Referred for Screening
fl Screened
# No Show for Screening
#Screened Positive for Substance Use
# Enrolled in Treatment at Time of Screening
#Screened Negative for Substance Use .
# Referred for Urinalysis (Drug Felon)
#Urinalysis Completed (Drug Felon)
# Referred for Urinalysis (Non-Drug Felon)
#Urinalysis Completed (Non-Drug Felon)
# Referred for Assessment
#Assessments Completed by TCA Assessor
·#Assessments Completed by LHD/Treatment Program
# No Show for Assessment
# Referred to Treatment (be)
#Case Closed {!n tx. but denied/closed other reason)
·# Entered treatment verified by TCA Assessor
# Case Manageimen.t 30 day check up
# Case·Managernent 60 day Check Up
#Case Management 90 day check up
# Successfully Referred fo another level of care/service
# No Show to treatment program
#Successfully· Di~charged
# Unsu~cessful!y. Discha~ged ·
# Placed on Waiting List for Medication Assisted Tx
TCA Applicant
37,704
34,392
3,312
2,076
1,479
30,837
359
286
2,563
2,236
2,206
1,022
559
604
1,528
331
1,234
2,279
2,217
2,888
197
294
255
455
8
TCA Redet . Totals
2,215 : 39.~~g:'
11 ·:. ::.;5,79) :.:

70
FY 2014 Maryland Treatment Participation Type for TCA Participants
TCA Applicant TCA
Redetermination
Treatm~nt Types
KEY Enr = Enrolled Tx =Treatment Ent= Entered
'Le:vel I Outp~tient.
Level 11.1 Intensive Outpatient
Level 111.1
Enr in Tx
396
204
Low~intenslty 28 Residential Level 111.3
Medium Intensity 73 Residential Level 111.5
High Intensity 35 Residential Level 111.7
Medically-monitored 7 Intensive Inpatient
Opioid Maintenance 736 Ther,cipy
Detoxification Services at 39
any level of treatment Totals
(includes referrals to 1518 other service levels}
Wait List
8
8
Ent Tx
714
341
Enr in Tx
26
15
3 3
18 10
21 3
10 8
272 75
7
1386 137
Wait List
0
Ent Tx
32
3
8
1
86
. . . . . \ ,"' :·· -:-:~ .- .
;_.:3'1·:· ' ... ·": .. -~:3 : \:.:
: . .i ,: . . > ·':~; ' 1"'1" .... s.. ) ,._ '. .:.. ··.
1655 . :5 "·. ·j 472

71

72
SFY 2015 Maryland Treatment Participation Type for TCA Participants
TCA Applicant TCA Redetermination TotalTCA
Treabnent Placements Current Month Enrolled Waiting Entered Enrolled Waiting Entered Enrolled Wailing Entered
Enrolled in Tx• I Waiting List"* I Entered Tx..,. in Tx* List** Tx*** inTx* List** Tx**'* inTx* List** Tx***
Level I Outpatient 410 0 559 13 0 19 423 0 578
Level 11.1 Intensive Outpatient 250 0 439 8 0 20 258 0 459
Level 111.1 Halfway House 37 0 4 0 0 1 37 0 5
Level 111.3 Lon~-Tenn Residential 129 0 8 3 0 4 132 0 12
Level 111.5 Therapeutic Community 74 0 3 0 0 0 74 0 3
Level 111.7 Intermediate Care Facility 23 0 13 0 0 0 23 0 13
Level I OMT Opioid Maintenance Therapy 941 2 68 37 0 1 978 2 69
Detoxification Services at anv level of treabnent 8 0 0 0 0 0 8 0 0
Totals 1.872 2 1,094 61 · o 45 1,933 2 1,139

73
SFY 2016 Maryland SATS Program Results for TCA Participants
TCA TCA Category Applicant Redet Totals
# Referred for Screening (1177) 33,604 688 34,292
#Screened (1176) 30,550 615 31 ,165
# No Show for Screening 3,054 73 3,127
#Screened Positive. for Substance Use 2,125 26 2,151
#Screened Negative for Substance Use 26,550 539 27,089
# Enrqlled in Treatment at Time of Screening• 1,875 50 1,925
#Referred for Assessment (1178) 2,125 26 2,151
#Assessments Completed by TCA Assessor 961 17 978
#Assessments Completed by LAAffx. Provider 459 9 468
# No Show for Assessment 705 NIA 705
#Referred for Urinalysis (Drug Felon) NIA NIA 0
#Completed Urinalysis (Drug Felon) NIA NIA 0
# Referred for Urinalysis (Non-Drug Felon) 1,316 11 1,327
#Completed Urinalysis (Non-Drug Felon) 926 23 949
#Referred to Treatment (1178) 1,420 26 1,446
# Entered treatment verified by TCA Assessor ... 1,159 26 1, 185
# No Show to treatment 261 NIA 261 # Case Closed ( In tx. But cased denledfclosed via DSS) 514 52 566
# Case Management 30 day check up 2,750 129 2,879
#Case Management 60 day check up 4,107 90 4,197
# Case Management 90 day check up 4,433 172 4,605
# Case Management 6 month check up 2,891 200 3,091 # Referred to another level of caretservice (negfcomp,) 325 14 339
# Successfully Discharged 226 26 252
# Unsucessfully Discharged 657 45 702
#Waiting List for Medicaton Assisted Tx. ONLY .. 0 0 0

74
SFY 2016 Maryland Treatment Participation Type for TCA Participants
TCA Applicant TCA Redetermination TotalTCA
Treabnent Placements Current Month Enrolled Waiting Entered Enrolled Waiting Entered Enrolled Waiting Entered
Enrolled in Tx* I Waiting List** I Entered Tx - in Tx* Lisr Tx*** in Tx* List•• Tx*'** inTx* List•• Tx*"*
Level I Outpatient 358 0 655 10 0 22 368 0 677
Level 11.1 Intensive Outpatient 299 0 335 5 0 3 304 0 338
Level 111.1 Halfway House 43 0 5 1 0 1 44 0 6
Level 111.3 Long-Term Residential 161 0 23 3 0 0 164 0 23
Level 111.5 Therapeutic Community 18 0 2 0 0 0 18 0 2
Level 111.7 Intermediate Care Facility 9 0 12 0 0 0 9 0 12
Level I OMT Opioid Maintenance Therapy 967 0 78 31 0 0 998 0 78
Detoxification Services at any level of treatment 20 0 49 0 0 0 20 0 49
Totals 1,875 0 1,159 50 0 ' 26 1.925 0 1,185