overview of the may 8 th 2009 severe storm event
DESCRIPTION
Overview of the May 8 th 2009 Severe Storm Event. Anthony Phillips Department of Geography Virginia Tech. Mesocyclone Track VA and NC. Thermodynamic Profiles KRNK and KGSO - 0000 UTC 9 May 2009. Mesoscale Analyses Virginia and North Carolina. Mesoscale Analyses Smyth County and SW VA. - PowerPoint PPT PresentationTRANSCRIPT

Overview of the May 8th 2009 Severe Storm Event
Anthony PhillipsDepartment of GeographyVirginia Tech

Mesocyclone Track VA and NC

Thermodynamic ProfilesKRNK and KGSO - 0000 UTC 9 May 2009
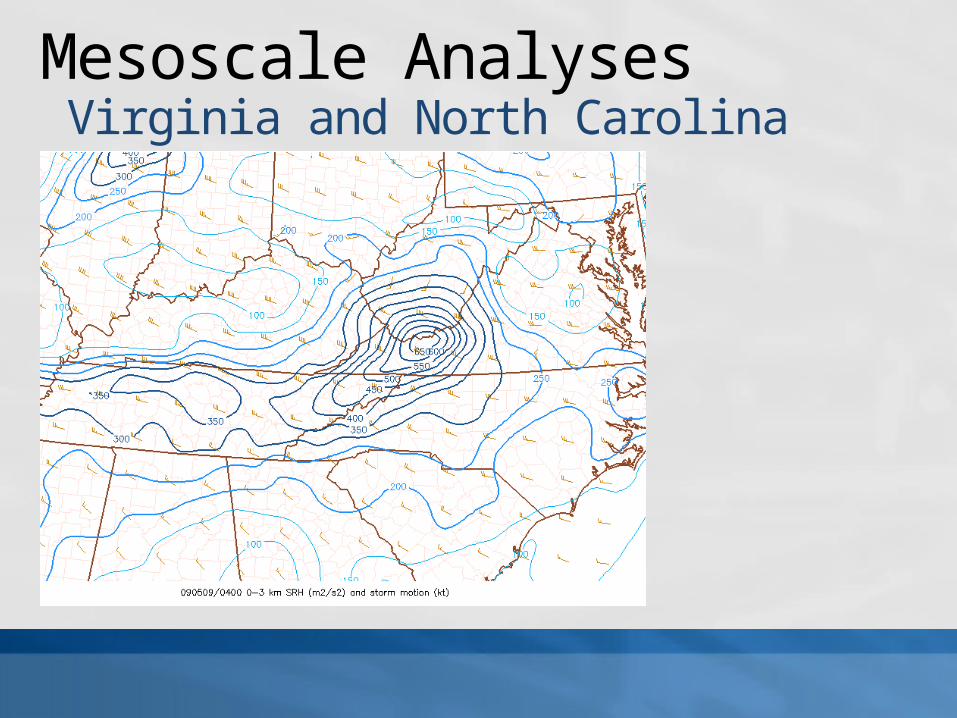
Mesoscale Analyses Virginia and North Carolina

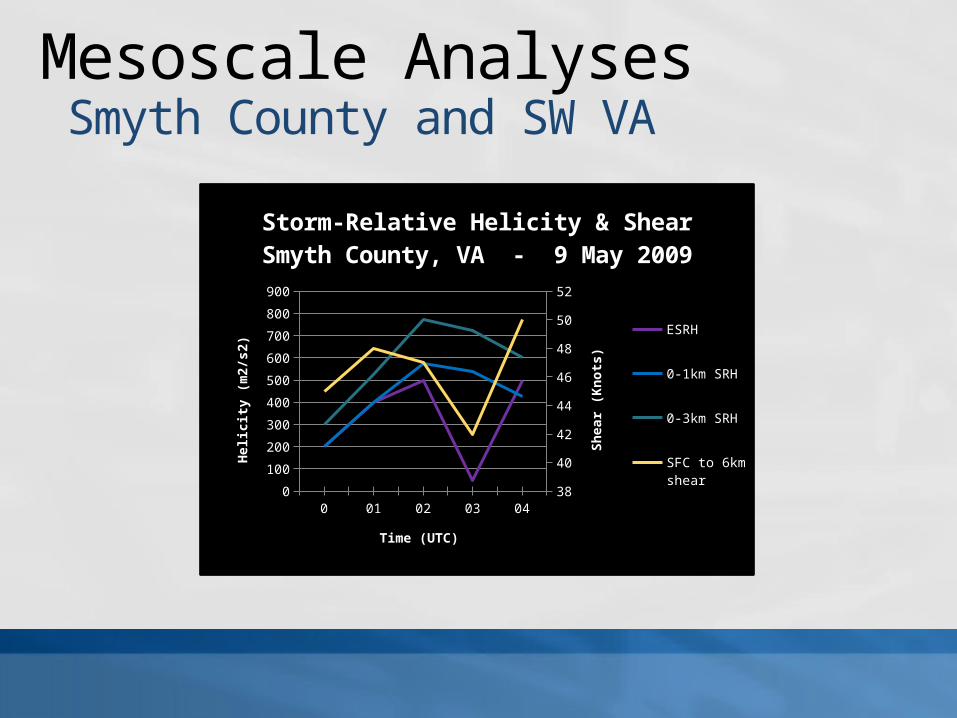
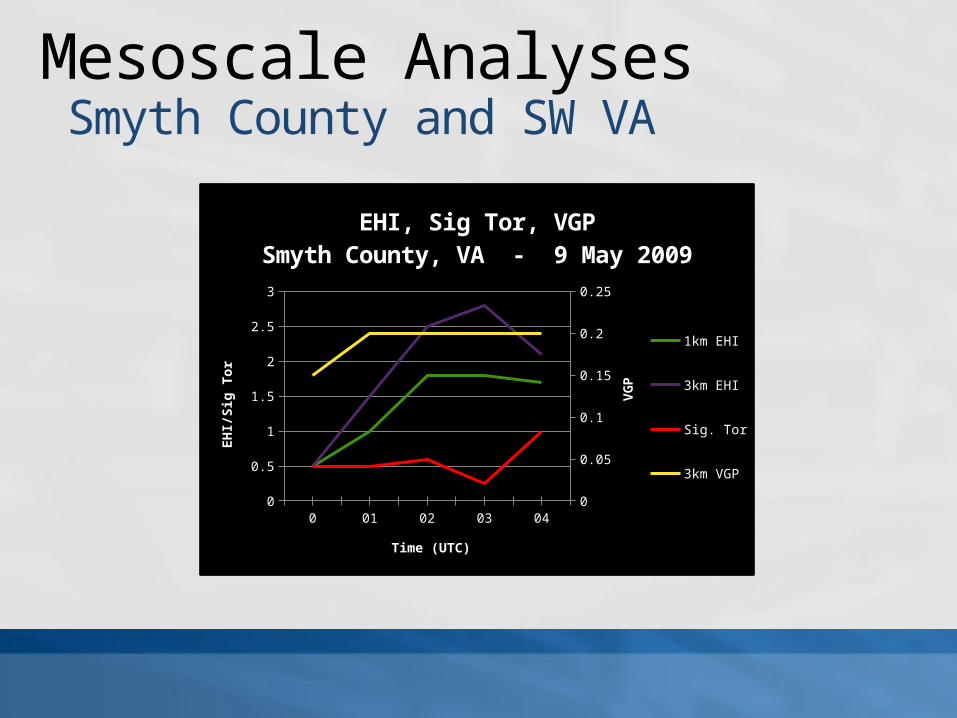
Mesoscale Analyses Smyth County and SW VA
0 01 02 03 04-100
0
100
200
300
400
500
600
CAPE/CINSmyth County, VA - 9 May 2009
0-3km MLCAPE
SBCAPE
SBCIN
Time (UTC)
CAPE
/CIN
(J/k
g)
Mesoscale Analyses Smyth County and SW VA
0 01 02 03 040
100
200
300
400
500
600
700
800
900
38
40
42
44
46
48
50
52
Storm-Relative Helicity & ShearSmyth County, VA - 9 May 2009
ESRH
0-1km SRH
0-3km SRH
SFC to 6km shear
Time (UTC)
Helic
ity (m
2/s2
)
Shea
r (Kn
ots)
Mesoscale Analyses Smyth County and SW VA
0 01 02 03 040
0.5
1
1.5
2
2.5
3
0
0.05
0.1
0.15
0.2
0.25
EHI, Sig Tor, VGPSmyth County, VA - 9 May 2009
1km EHI
3km EHI
Sig. Tor
3km VGP
Time (UTC)
EHI/
Sig
Tor
VGP
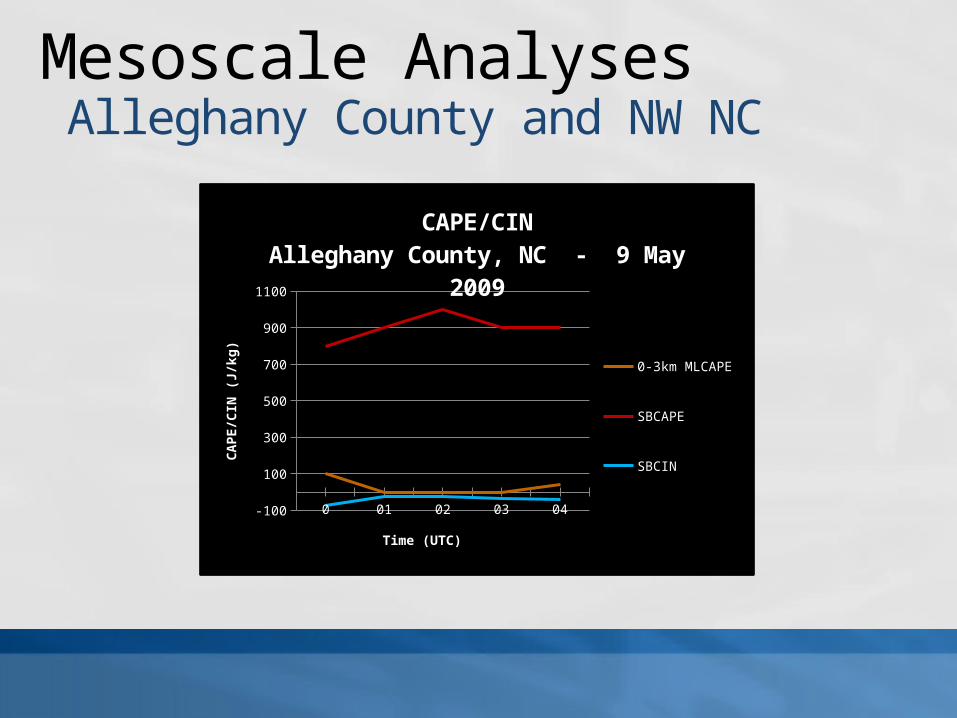
Mesoscale Analyses Alleghany County and NW NC
0 01 02 03 04-100
100
300
500
700
900
1100
CAPE/CINAlleghany County, NC - 9 May 2009
0-3km MLCAPE
SBCAPE
SBCIN
Time (UTC)
CAPE
/CIN
(J/k
g)

Mesoscale Analyses Alleghany County and NW NC
0 01 02 03 040
100
200
300
400
500
600
0
10
20
30
40
50
60
Storm-Relative Helicity & ShearAlleghany County, NC - 9 May 2009
ESRH
0-1km SRH
0-3km SRH
SFC to 6km shear
Time (UTC)
Helic
ity (m
2/s2
)
Shea
r (Kn
ots)
Mesoscale Analyses Alleghany County and NW NC
0 01 02 03 040
0.5
1
1.5
2
2.5
3
3.5
0
0.05
0.1
0.15
0.2
0.25
0.3
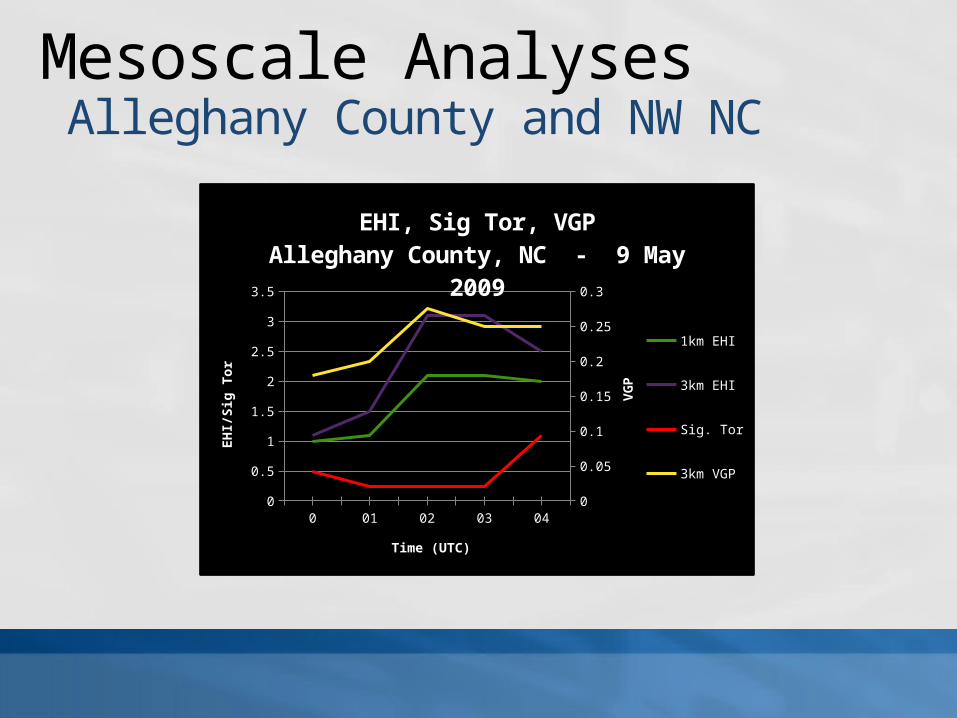
EHI, Sig Tor, VGPAlleghany County, NC - 9 May 2009
1km EHI
3km EHI
Sig. Tor
3km VGP
Time (UTC)
EHI/
Sig
Tor
VGP

Mesocyclone Analysis Meso strength
0230
0234
0238
0242
0247
0251
0255
0259
0304
0308
0312
0316
0321
0325
0329
0333
0337
0342
0346
0350
0354
0359
0.0
10.0
20.0
30.0
40.0
50.0
60.0
70.0
80.0
0.00
2.00
4.00
6.00
8.00
10.00
12.00
14.00
16.00
18.00
Mesocyclone Analysis9 May 2009
Meso Strength
Max Reflectivity
Meso Width (km)
Time (UTC)
Mes
o St
reng
th (k
ts)
Max
Refl
ectiv
ity (d
BZ)
Mes
o W
idth
(km
)
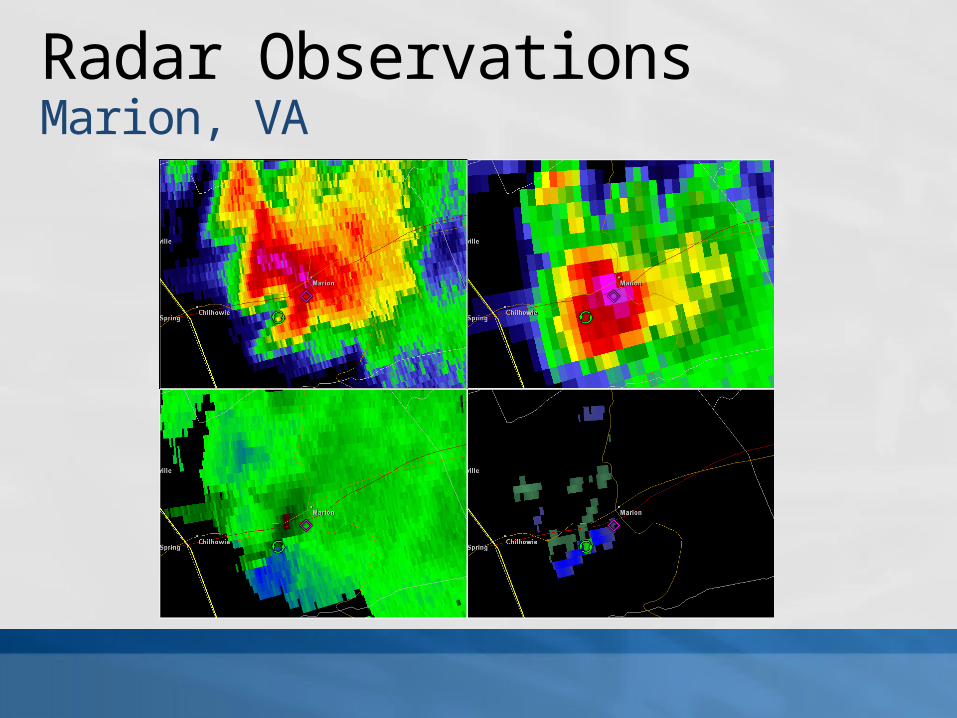
Radar ObservationsMarion, VA

Radar ObservationsMarion, VA
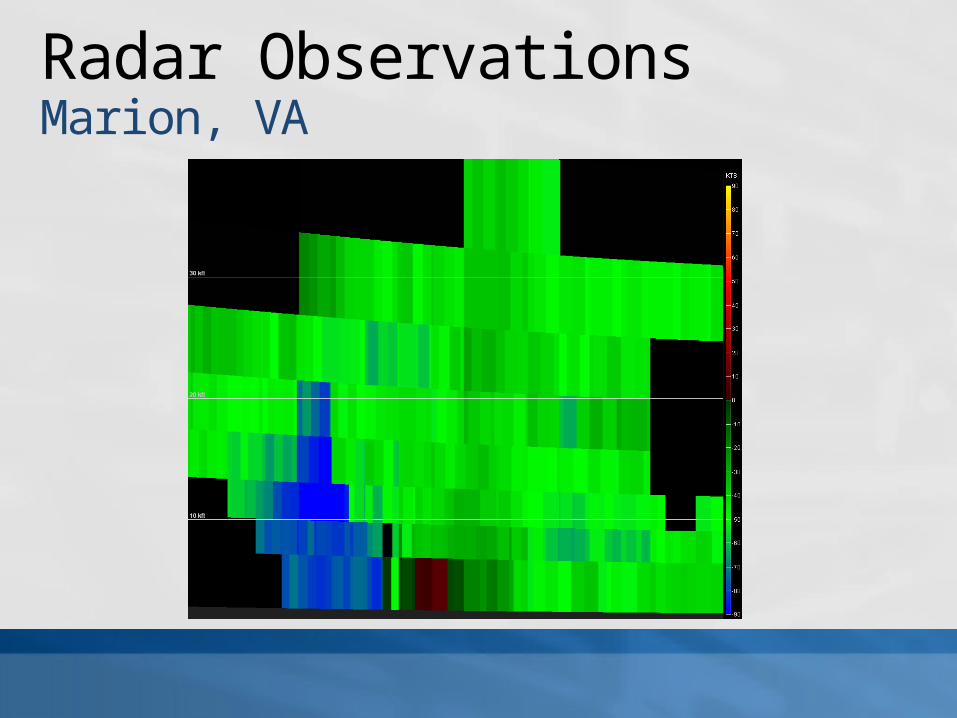
Radar ObservationsMarion, VA
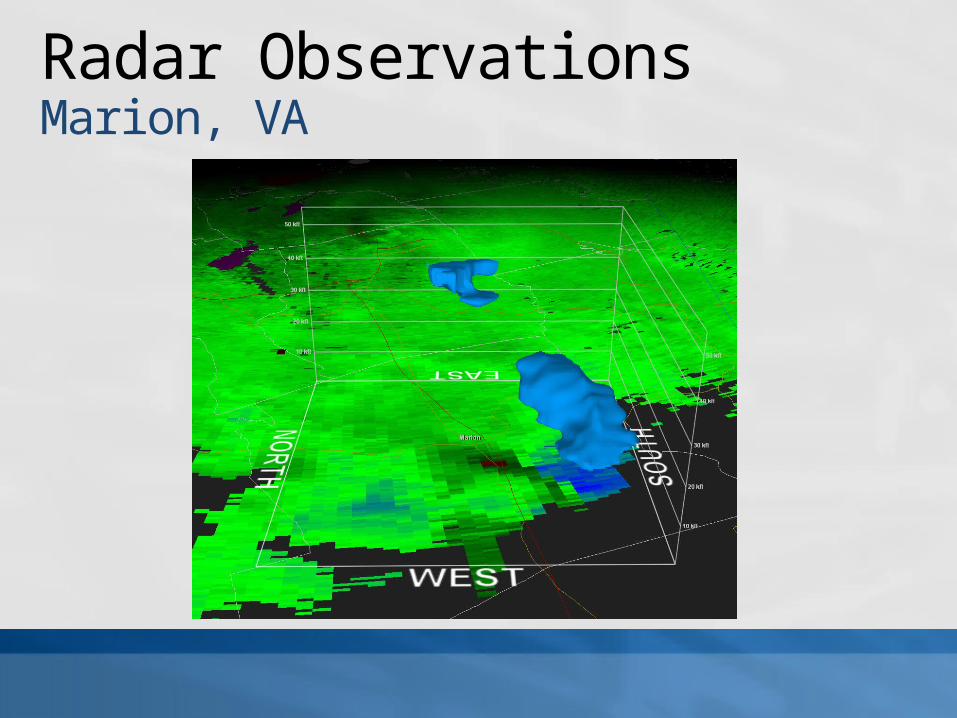
Radar ObservationsMarion, VA

Radar ObservationsAlleghany County, NC
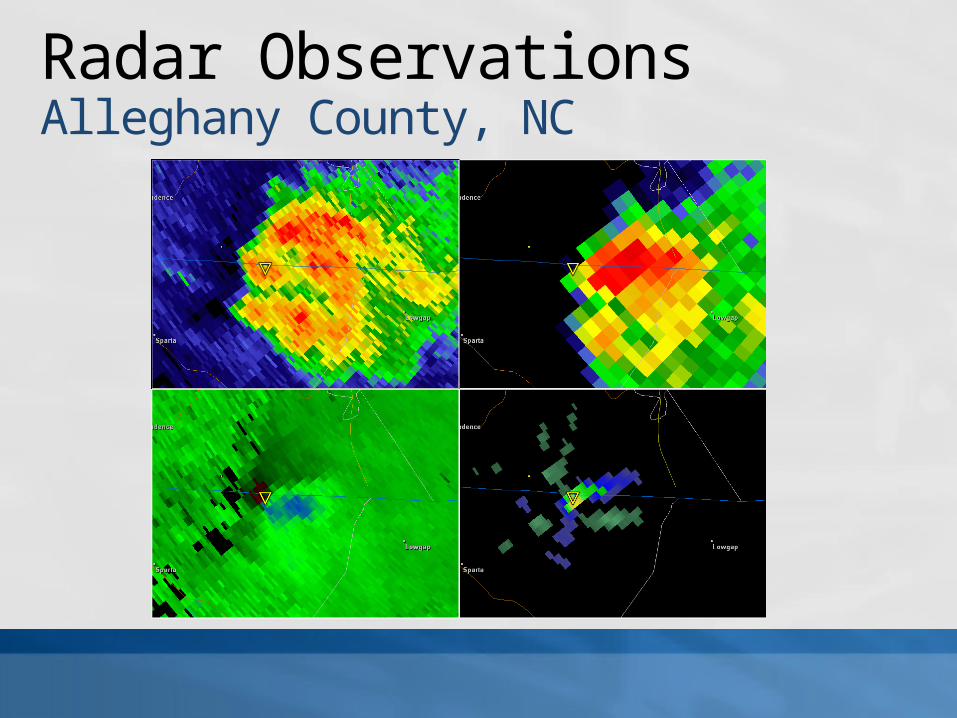
Radar ObservationsAlleghany County, NC

Radar ObservationsAlleghany County, NC
Synopsis and ConclusionWhat was learned
Reports of straight-line wind damage in Marion, VA might easily have been tornado damage. The supercell had…
increasing reflectivities at all tilts,a well-defined inflow notch and shallow v-notch,strong low and mid-level circulation,an overhanging weak echo region (WER),and tightening of the mesocyclone as it passed near Marion.

Synopsis and ConclusionWhat was learned
From radar observations, the SPC meso analyses were correct in predicting the greatest amounts of shear to the north.
Strong updrafts and rotation reached over 20 kft near Marion.Shear and rotation didn’t extend much above 10 kft with the Alleghany tornadoes.

Synopsis and ConclusionWhat was learned
A very good correlation exists between mesocyclone strength and tightening of rotationEven though the storm weakened while crossing the high country, it regained strength quickly before tornadogenesis occurred (conservation of potential vorticity)
Consider extending Tornado Warnings even if the storm has weakened since: 1) it’s had a history of rotation, and 2) it may likely re-intensify.

Synopsis and ConclusionWhat was learned
Finally…storms could have been even more severe had additional CAPE been present.
Questions?