overview of the european lubricant demand - kline & · pdf file © 2014 kline &...
TRANSCRIPT
www.KlineGroup.com
© 2014 Kline & Company
Overview of the European Lubricant Demand
17 September, 2014
A presentation at:
Alicante, Spain

© 2010 Kline & Company 1 © 2014 Kline & Company
Overview of Kline
About Kline & Company:
Corporate Overview:
Our Philosophy:
Kline is a respected provider of world-class consulting services and high-quality market intelligence that consistently lead to client successes in growing or improving their business.
Our focus is on providing solutions throughout the entire value chains of the industries we serve. We are large enough to have the blend of functional capabilities, industry experience, and geographical spread that successful projects require, yet small enough for clients to get our individualized full attention.
Our purpose is to help our clients succeed and our philosophy is built around this. Our clients value our people and the working relationships they form while working together.

© 2010 Kline & Company 2 © 2014 Kline & Company
Study Background
This presentation is based on Kline’s global series of including: Global Lubricant: Market Analysis and
Opportunities” “Global Lubricant Basetocks: Market
Analysis and Opportunities” This presentation will provide an overview
of synthetic lubricant demand and growth in key regions including Europe, North America, and providing a focus on selected emerging countries (Brazil, Russia, and China) All base year data refers to 2013 and
projections to 2023. All market numbers are in kilotonnes.
© 2010 Kline & Company 3 © 2014 Kline & Company
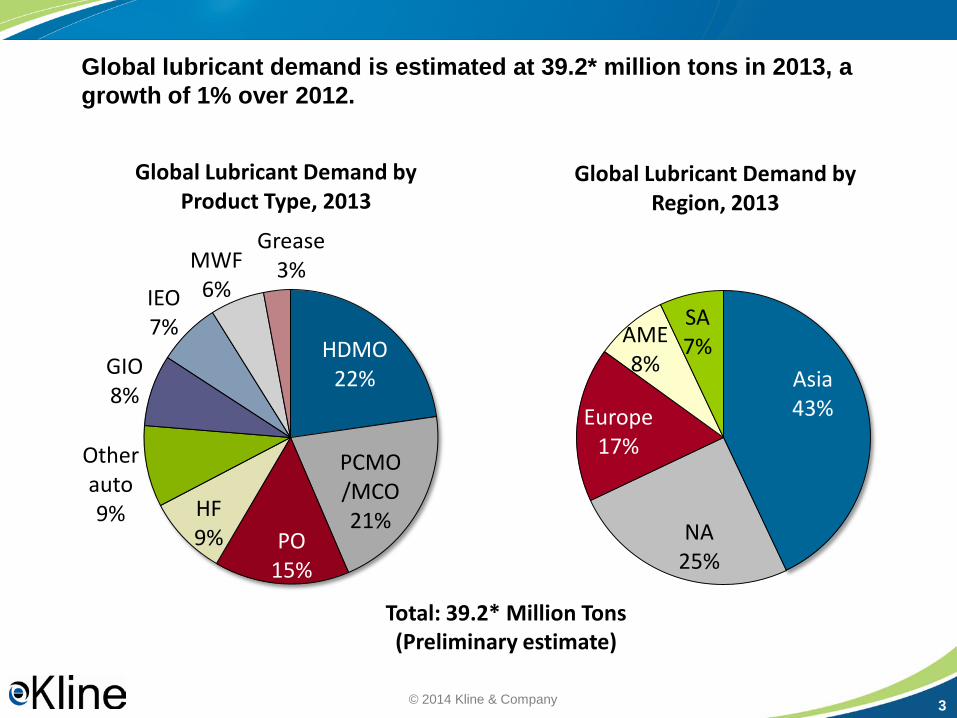
Global lubricant demand is estimated at 39.2* million tons in 2013, a growth of 1% over 2012.
HDMO 22%
PCMO /MCO 21%
PO 15%
HF 9%
Other auto 9%
GIO 8%
IEO 7%
MWF 6%
Grease 3%
Global Lubricant Demand by Product Type, 2013
Asia 43%
NA 25%
Europe 17%
AME 8%
SA 7%
Global Lubricant Demand by Region, 2013
Total: 39.2* Million Tons (Preliminary estimate)

© 2010 Kline & Company 4 © 2014 Kline & Company
How has the global lubricants market performed through the recession?
-10
-5
0
5
10
2007 2008 2009 2010 2011 2012 2013
Global GDP and Lube Demand Growth (%/Yr)
GDP growth* Lube demand growth
20
30
40
50
2007 2008 2009 2010 2011 2012 2013
Global Lubricant Consumption, 2007-2013 (Million Tons)
Global lubricants demand growth has generally tracked global GDP growth, but with
greater volatility
Global lubricants demand in 2013 has nearly recovered to the high water mark set
in 2007
* - Real GDP at market exchange rates.

© 2010 Kline & Company 5 © 2014 Kline & Company
From a variety of indicators, the message is clear – 2013H1 was bad for most of Europe’s major economies with a few exceptions
Country CV* PC* Steel prod
Germany -10.2% -8.1% 1.6%
UK 7.2% 10.0% -17.2%
Italy -19.5% -10.3% 17.3%
Spain -6.0% -4.9% -1.1%
France -9.4% -11.2% 4.5%
Retail sales in Eurozone grew for the first time in August 2013. Strong growth in Germany, modest in France. In Germany manufacturing PMI rose to
two year high and services PMI is the highest in six month French and Italian manufacturing PMI
turned to growth in July 2013. Tough Spain continued to decline, the
trajectory suggest it will return to growth shortly. Among other countries Poland has also
returned to growth, Turkey continues to stagnate, and contraction in Greece has slowed down.
Growth in 2013 H1 vs. 2012 H1
SOURCE: www.acea.be, Markit Economics, PMI Survey *CV = commercial vehicle registrations *PC = passenger car registrations

© 2010 Kline & Company 6 © 2014 Kline & Company
While things appear unchanged on the surface, a significant realignment of regional shares has occurred.
0%
20%
40%
60%
80%
100%
2007 2008 2009 2010 2011 2012
Global Lubricant Consumption Share by Region, 2007-2012
Asia N America Europe AME S America
European share in global lubricant demand has declined from about 24% to 17%. In contrast, Asian share in global lubricant demand has grown from 33% to 43% in the last five years.

© 2010 Kline & Company 7 © 2014 Kline & Company
Most European countries have experienced a significant contraction in demand during the recession.
-6
-4
-2
0
2
Turkey Russia Poland Germany Benelux France UK Iberia Italy
Europe Lubricant Demand Growth By Major Countries (2008-2013) , CAGR %
Major markets Other
The contraction in demand in major countries accelerated Europe’s reducing share in global lubricant demand. The situation has not changed in 2013.

© 2010 Kline & Company 8 © 2014 Kline & Company
Despite the contraction in the last five years, the top five lubricant markets in Europe account for nearly two-thirds of the region demand.
Russia
Germany
UK France Italy
Turkey
Iberia
Ukraine
Benelux Poland
Minor
Other
Europe Lubricant Consumption by Country, 2013
Total: 6.6 million tons

© 2010 Kline & Company 9 © 2014 Kline & Company
In contrast to its position in the overall market, Europe accounts for the highest share of the global synthetic and semi-synthetic lubricant demand.
0% 20% 40% 60% 80% 100%
Total
Mineral
Synthetic
Semi-synthetic
Regional Share in Global Lubricant Demand by Product Type, 2013 (%)
Europe Asia North America South America AME
Note: Excludes Process Oils.

© 2010 Kline & Company 10 © 2014 Kline & Company
Germany leads in penetration of synthetic and semi-synthetic lubricants.
0
25
50
75
100
Germany France UK Italy Poland Benelux Russia Turkey Other
Synthetic and Semi-synthetic Lubricant Penetration by Country, 2013 (%)
Synthetic Semi-synthetic Conventional
High penetration of synthetics coupled with demographic factors makes Europe a declining market even without other economic factors.
Note: Excludes Process Oils.

© 2010 Kline & Company 11 © 2014 Kline & Company
What drives lubricant market in Europe?
Increased lubricant consumption due to: −Economic recovery −Manufacturing recovery −Changing regional base oil supply
Other factors include:
−Socio-economic trends − Lubricant quality improvements −Focus on fuel economy and CO2 reduction

© 2010 Kline & Company 12 © 2014 Kline & Company
What is the global economic outlook?
-6
-4
-2
0
2
4
6
8
2009 2010 2011 2012 2013 2014 2015 2016 2017 2018
Real GDP* Growth Rate, 2009-2018 (%)
World North America Western Europe Asia & Australasia (incl Japan)
* GDP at market prices Source: www.eiu.com
Europe is projected to show improvement in economic growth rate.

© 2010 Kline & Company 13 © 2014 Kline & Company
Going by the purchasing manager index, most European countries are experiencing growth in manufacturing.
Country February January December Austria 53.0 54.1 54.1 Czech Republic 56.5 55.9 54.7 Euro Zone 53.2 54.0 52.7 France 49.7 49.3 47.0 Germany 54.8 56.5 54.3 Greece 51.3 51.2 49.6 Ireland 52.9 52.8 53.5 Italy 52.3 53.1 53.3 Netherlands 55.2 54.8 57.0 Poland 55.9 55.4 53.2 Russia 48.5 48.0 48.8 Spain 52.5 52.2 50.8 Turkey 53.4 52.7 53.5 U.K. 56.9 56.7 57.2 Source: www.markiteconomics.com
Manufacturing continues to contract in France and Russia

© 2010 Kline & Company 14 © 2014 Kline & Company
Example – Impact of growing synthetic and semi-synthetic products on overall PCMO demand.
0.9
1.0
1.1
1.2
1.3
2011 2013 2015 2017 2019 2021 2023
Vehicle Population and PCMO Consumption Growth in Select Countries*, 2011-2023
Vehicle population PCMO demand Synthetic and Semi-synthetic PCMO demand
* - Russia, Germany, UK, France, and Italy All data expressed as ratio of 2011 value

© 2010 Kline & Company 15 © 2014 Kline & Company
Emphasis on fuel economy, and a modernizing vehicle park, will drive an increase in the use of lighter viscosity PCMOs
0%
20%
40%
60%
80%
100%
2012 2017 2022 0Ws 5Ws 10Ws 15Ws Other multigrades Monogrades
PCMO Grade Shifts in Europe, 2012 to 2022
0%
20%
40%
60%
80%
100%
2012 2017 2022 0Ws / 5Ws 10Ws 15Ws Other multigrades Monogrades
HDMO Grade Shifts in Europe, 2012 to 2022
HDMO market will see moderate movement to lighter viscosity oils.

© 2010 Kline & Company 16 © 2014 Kline & Company
European Baseoil Supply, 2012-2021 (Million Tons)
0.0
2.0
4.0
6.0
8.0
10.0
European Lubricant Demand Growth (CAGR %, 2012 -16)
0
0.5
1
1.5
2
2.5
Synthetic Semi- Mineral
0
20
40
60
80
100
120
140
160
2013 2014 2015 2016 2017 2018 2019 2020 2021 2022 2023 Group I Group II/II+ Group III/III+ Naphthenics
KBD
While overall baseoil supply in Europe will be flat, share of Group II and Group III will grow rapidly. This will impact blending approach in the region and drive a further expansion of synthetics.

© 2010 Kline & Company 17 © 2014 Kline & Company
Lubricant consumption in Russia and Germany will drive demand in Europe
-2.0
-1.5
-1.0
-0.5
0.0
0.5
1.0
1.5 R
ussi
a
Ger
man
y
UK
Iber
ia
Fran
ce
Italy
Ben
elux
Lubricant demand growth by major countries in Europe, CAGR %
(2013-2021)
Largest European Lubricant Market
Germany
Russia
United Kingdom
France
Italy

© 2010 Kline & Company 18 © 2014 Kline & Company
The net impact of these market drivers will be a flat lubricant market in Europe.
3
4
5
6
7
8
2009
2010
2011
2012
2013
2014
2015
2016
2017
2018
2019
2020
2021
2022
Europe Lubricant Demand Outlook, 2009-2022 (Million Tons)
No growth (0.2%/yr growth) Contraction (-0.6%/yr growth) Historical
In the optimistic scenario, the overall demand will be flat with growth in some countries compensating the contraction in others.

© 2010 Kline & Company 19 © 2014 Kline & Company
European lubricant is a mature market but opportunities can still be pursued in various segments
Opportunities in Europe are not volume growth based, rather the growth that is expected to come from lubricants in the high performance categories
Market opportunities exist at both ends of the product spectrum – synthetic engine
oils and industrial lubricants– but present different challenges − Europe continues to be the largest market for high quality / high performance
lubricants as measured by penetration of synthetics and low viscosity engine oils.- Synthetic will grow 3x to 2x times faster than overall market
− Growing availability of Group II and Group III in this region will aid this trend − Group III supply in the region will expand significantly creating growth for Group
III based synthetic products. − In the industrial segment food-grade products showing biodegradability
credentials, but also fire resistant oils will continue to grow

© 2010 Kline & Company 20 © 2014 Kline & Company
European lubricant is a mature market but opportunities can still be pursued in various segments
To spot opportunities, lubricant marketers need to look beyond the Europe region as a whole. Opportunities exist at the country market level. Marketers need to think in terms of which market segment is addressable and which is not. − Lubricant marketers in Europe will need to look towards Eastern Europe and
East of the Suez for organic growth opportunities
Global reach, flexibility, quality consistency, strong reputation and reliability are key factors to succeed.

© 2010 Kline & Company 21 © 2014 Kline & Company 21
Questions or comments?

Americas ____________ Asia ___________ Europe ___________
If you require additional information about the contents of this document or the services that Kline provides, please contact:
Kline is a worldwide consulting and research firm dedicated to providing the kind of insight and knowledge that helps companies find a clear path to success. The firm has served the management consulting and market research needs of organizations in the chemicals, materials, energy, life sciences, and consumer products industries for over 50 years. For more information, visit www.KlineGroup.com.
Sharbel Luzuriaga Senior Consultant Phone: +420-222-33-00-19 Email: [email protected]
Kline & Company, Inc. 35 Waterview Blvd. Suite 305 Parsippany, NJ 07054 Phone: +1-973-435-6262 Fax: +1-973-435-6291 www.KlineGroup.com