overview of system of national accounts (sna) ii. introduction to sna
DESCRIPTION
Overview of System of National Accounts (SNA) II. Introduction to SNA. UN Statistical Institute for Asia and the Pacific. Definition of Output. Value of goods & services which are produced by an establishment in the economy Losses or wastages in production and distribution not counted - PowerPoint PPT PresentationTRANSCRIPT

Overview of System of National Accounts
(SNA)
II. Introduction to SNA
UN Statistical Institute for Asia and the Pacific
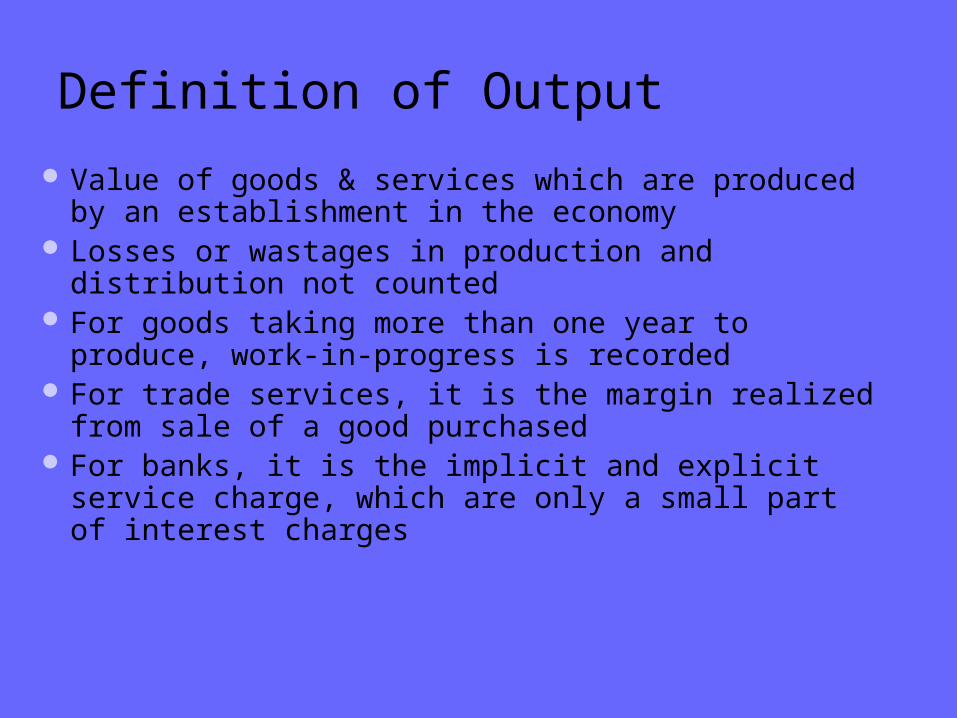
Definition of Output
Value of goods & services which are produced by an establishment in the economy
Losses or wastages in production and distribution not counted
For goods taking more than one year to produce, work-in-progress is recorded
For trade services, it is the margin realized from sale of a good purchased
For banks, it is the implicit and explicit service charge, which are only a small part of interest charges

Definition of Output continued..
For Insurance – it is the service charge Non-market products – it is the production cost
General government NPIs Own account constructions Own account R&D Own account software development
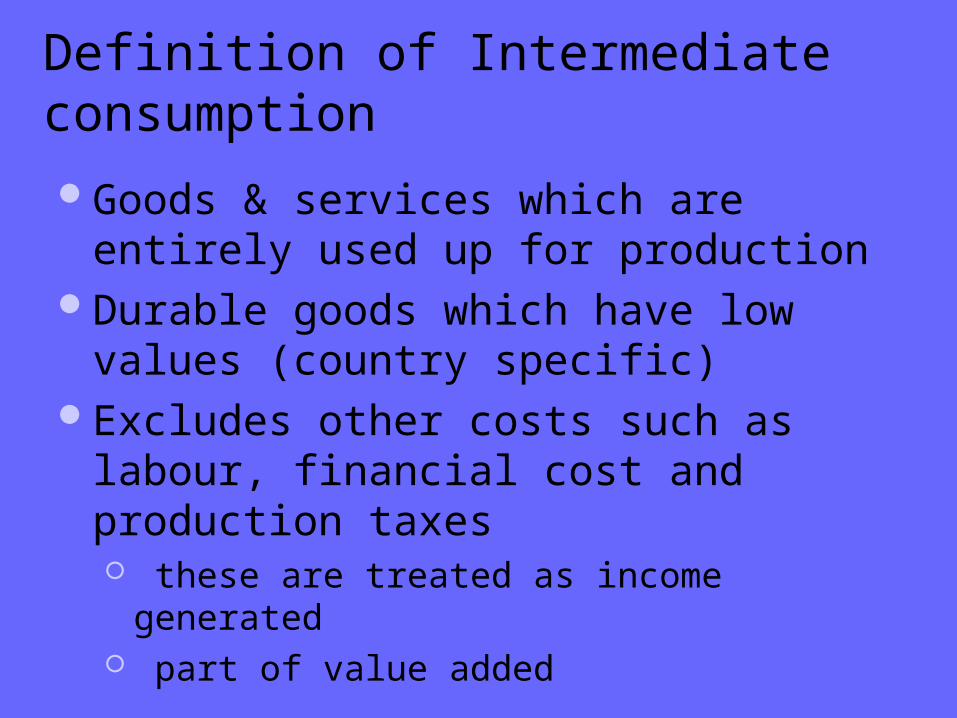
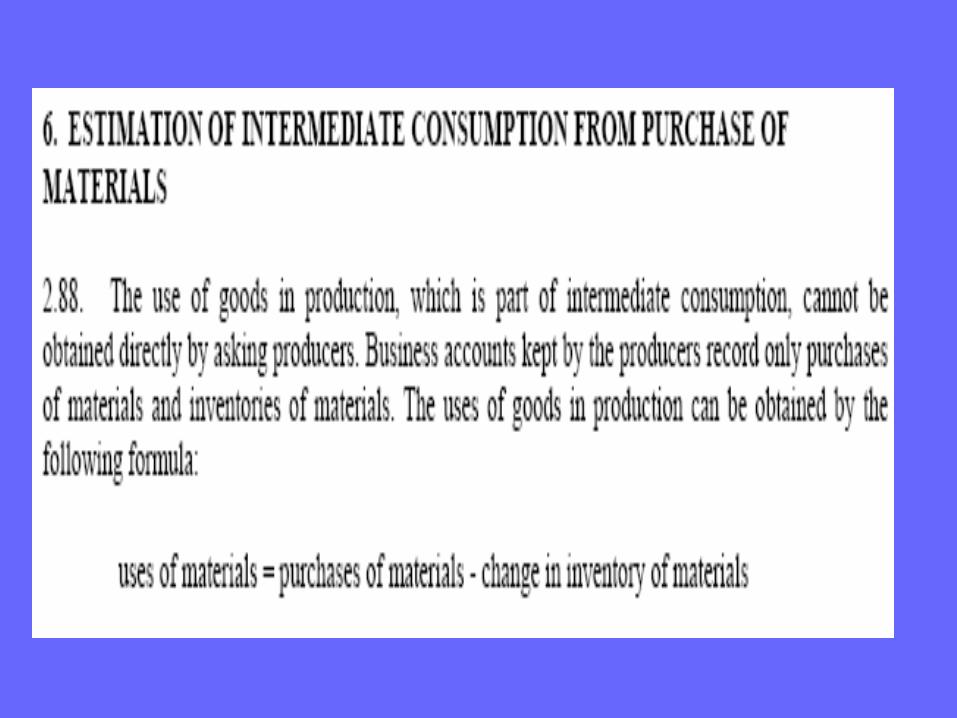
Definition of Intermediate consumption
Goods & services which are entirely used up for production
Durable goods which have low values (country specific)
Excludes other costs such as labour, financial cost and production taxes these are treated as income generated part of value added

Definition of Final consumption Goods & services used by households or
community. FCE (final con exp) of households FCE of general government FCE of NPIs serving households
For households all durables are part of final consumption (except purchases , own construction or improvements of residential buildings, which are part of GCF)
Service of owner occupied dwellings are FC Payment for licenses, passports, permits ..

Definition of Imports and Exports of Gs & Ss
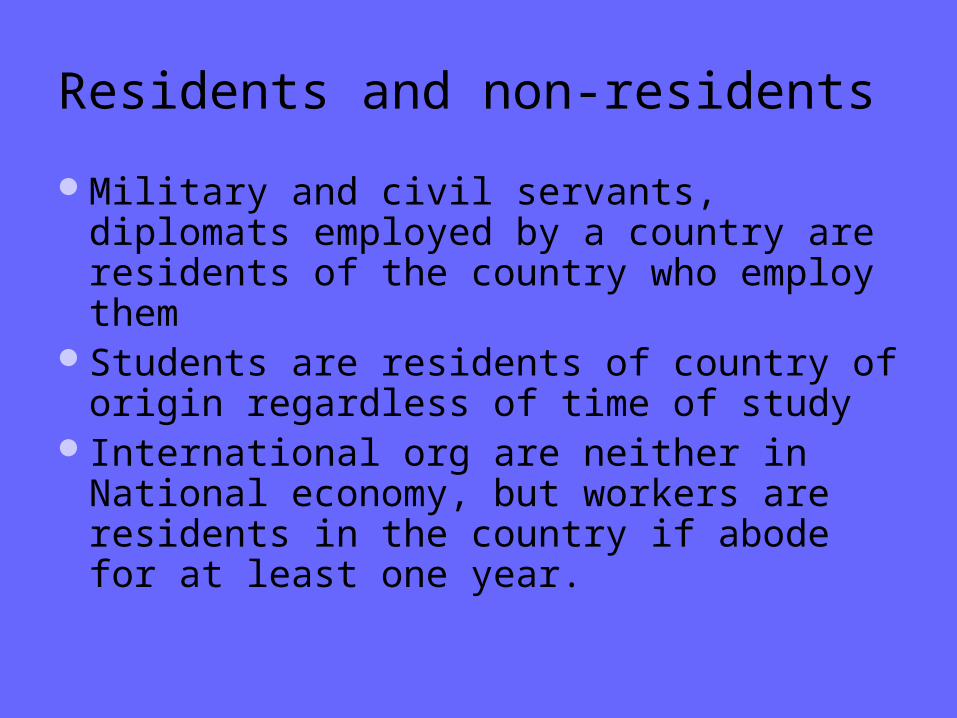
Residents and non-residents
Military and civil servants, diplomats employed by a country are residents of the country who employ them
Students are residents of country of origin regardless of time of study
International org are neither in National economy, but workers are residents in the country if abode for at least one year.

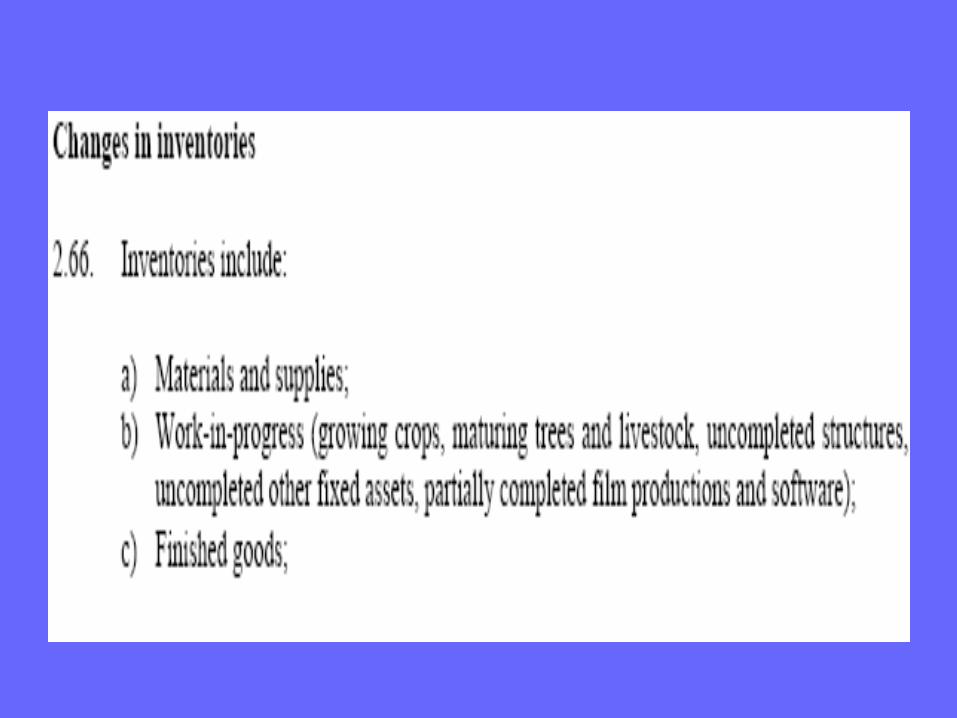
Definition of Gross fixed capital formation Investment in Capital goods Measures the additions to the capital stock of
buildings, equipment and inventories.. ie the addition to the capacity to produce more in
the future Land, natural resources etc are not, because the
change of ownership will not increase the non-produced assets (cost of transfer only included)
Components: Gross fixed capital formation Changes in inventories Acquisition less disposals of valuables (jewelry..)

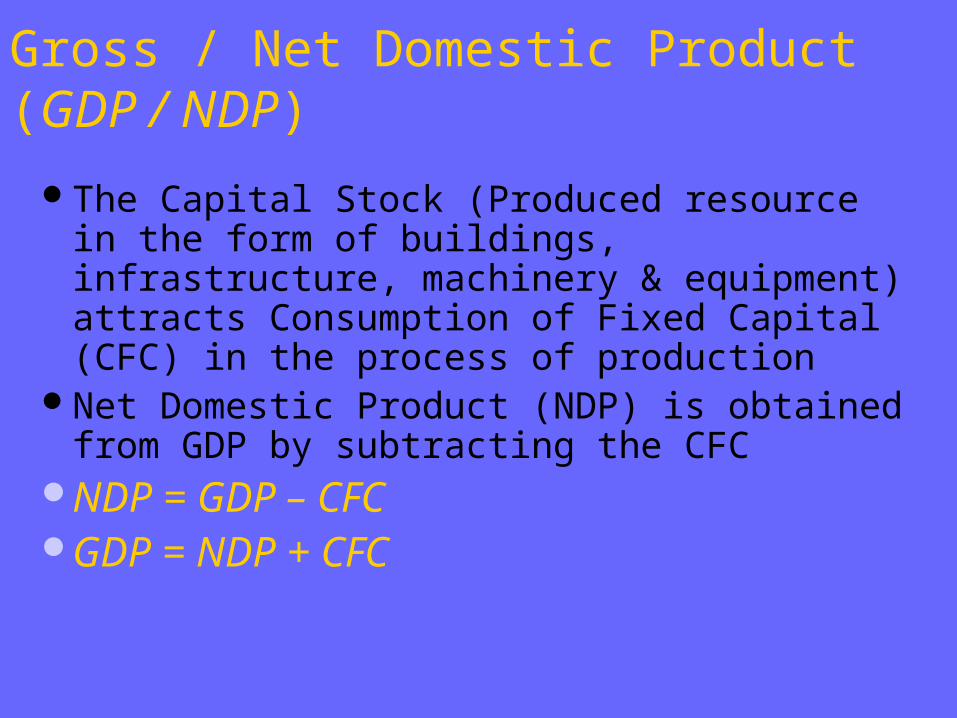
Gross / Net Domestic Product (GDP / NDP)
The Capital Stock (Produced resource in the form of buildings, infrastructure, machinery & equipment) attracts Consumption of Fixed Capital (CFC) in the process of production
Net Domestic Product (NDP) is obtained from GDP by subtracting the CFC
NDP = GDP – CFCGDP = NDP + CFC
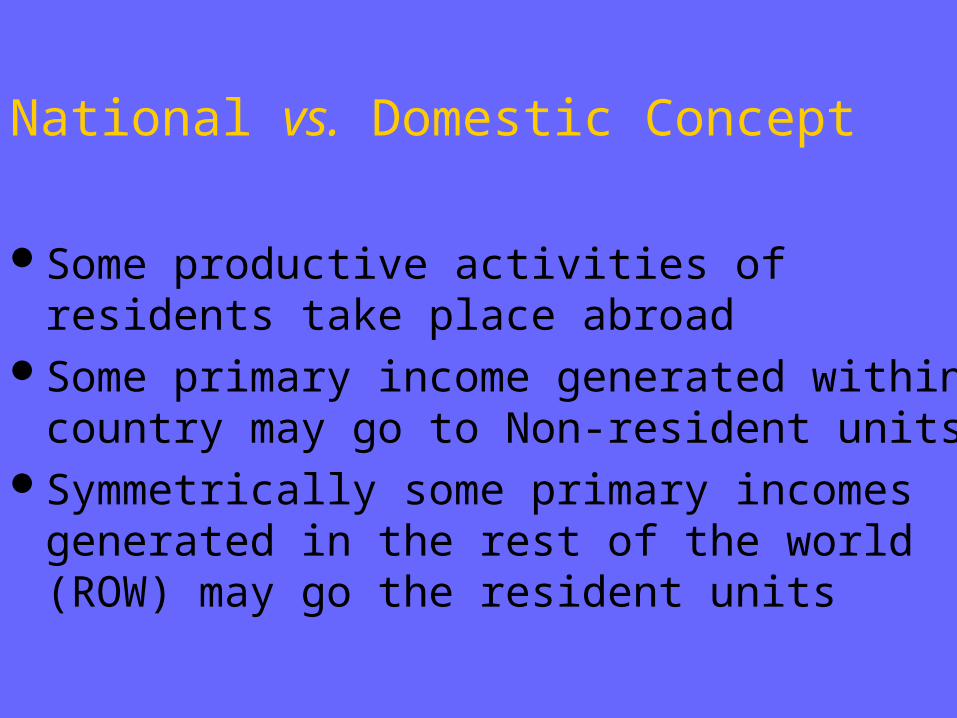
National vs. Domestic Concept
Some productive activities of residents take place abroad
Some primary income generated within country may go to Non-resident units
Symmetrically some primary incomes generated in the rest of the world (ROW) may go the resident units

GNDI
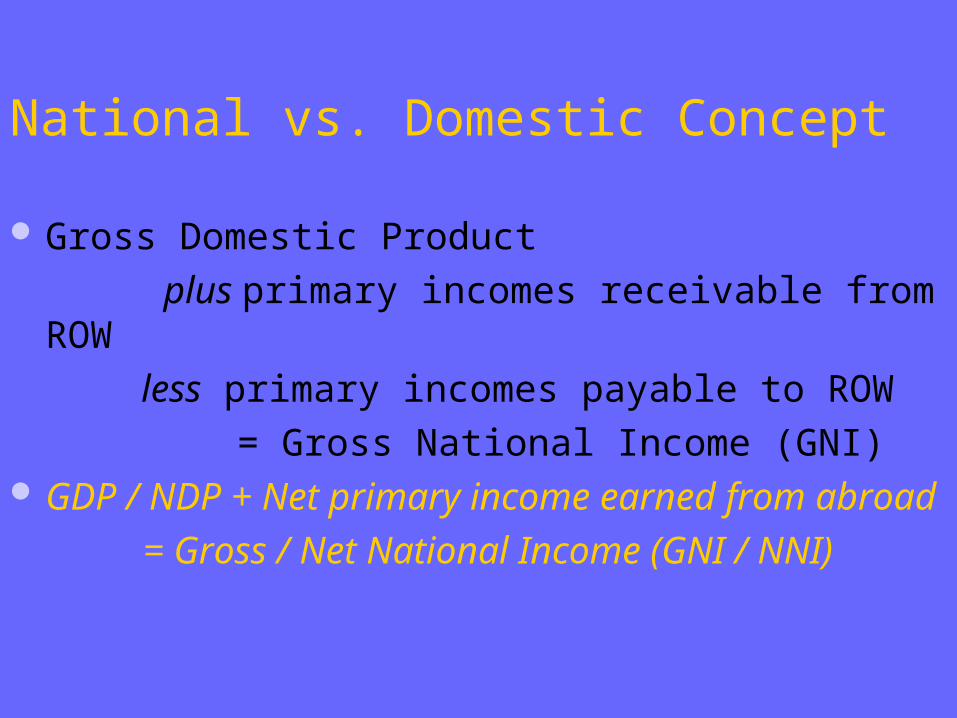
National vs. Domestic Concept
Gross Domestic Product
plus primary incomes receivable from ROW
less primary incomes payable to ROW
= Gross National Income (GNI) GDP / NDP + Net primary income earned from abroad
= Gross / Net National Income (GNI / NNI)

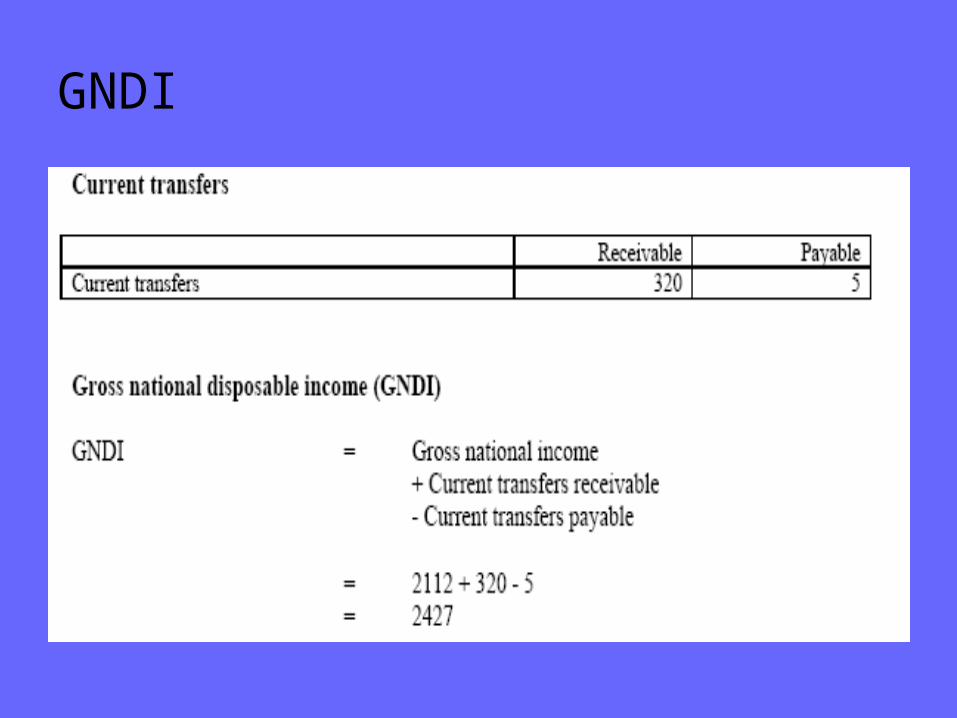
Gross National Disposable Income (GNDI)- Concept
All GNI is not available for final uses domestically Some of the income is transferred to other countries,
and vice-versa Gross National Disposable Income (GNDI)
= GNI + current transfers from the ROW
- current transfers to the ROW


Gross National Disposable Income (GNDI)- Concept (Contd.)
Gross national disposable income is the income available for consumption and saving
Gross National Disposable Income (GNDI)
= Final Consumption Expenditure
+ Gross Saving


Gross Saving, Gross Capital Formation & Net Lending
Gross Saving = GNDI - Final Consumption
Gross saving together with
net capital transfers from ROW provides resources for investment in non-financial assets (called Gross Capital Formation)

Gross savings
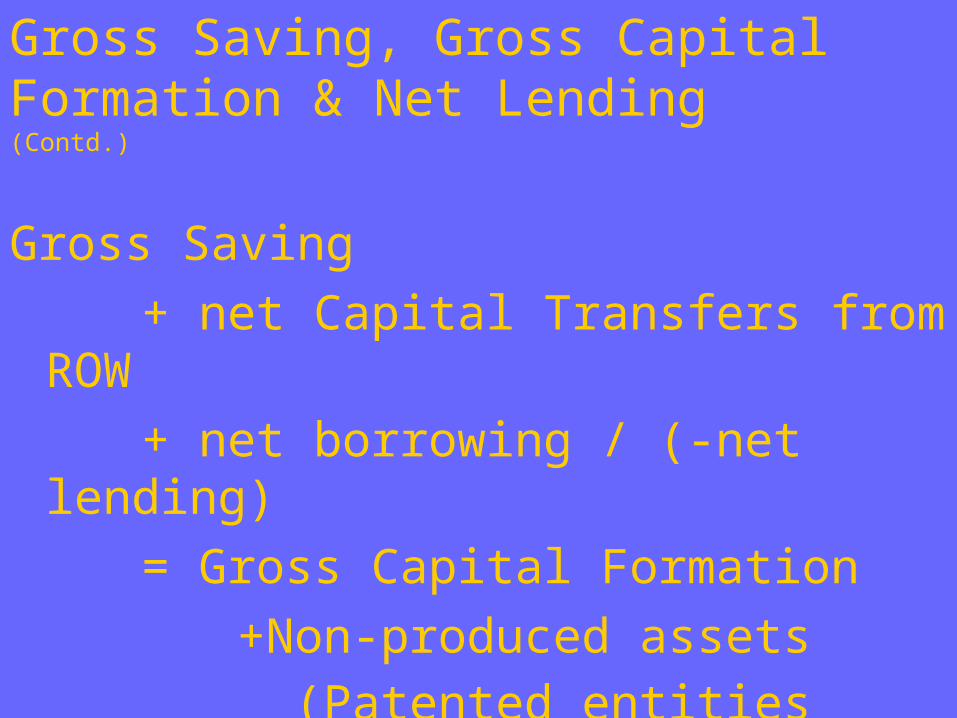
Gross Saving, Gross Capital Formation & Net Lending (Contd.)
Gross Saving
+ net Capital Transfers from ROW
+ net borrowing / (-net lending)
= Gross Capital Formation
+Non-produced assets (Patented entities only)

Gross Saving, Gross Capital Formation & Net Lending (Contd.)
Gross Capital Formation= Gross Fixed Capital Formation
+ Change in Stocks
(Gross saving + net capital transfers) – GCF
= Net lending (+) / Net borrowing (-)
National Income (NI )
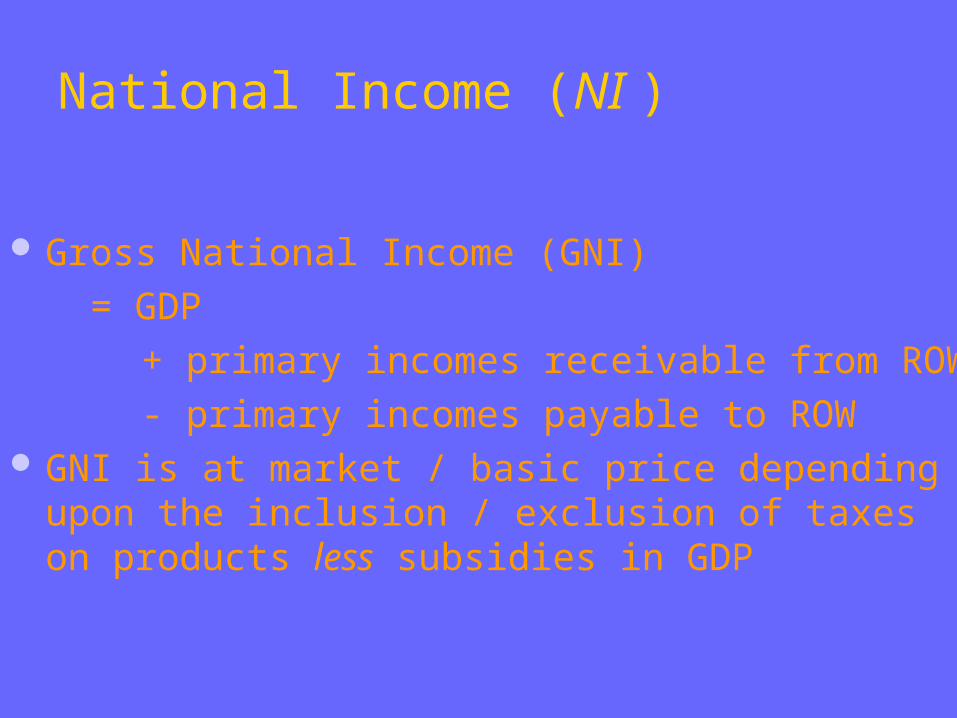
Gross National Income (GNI)
= GDP
+ primary incomes receivable from ROW
- primary incomes payable to ROW GNI is at market / basic price depending upon the
inclusion / exclusion of taxes on products less subsidies in GDP

National Income (NI ) ...contd.
GNI -CFC
= NNI (Net National Income)Per capita income
= NNI divided by mid year population
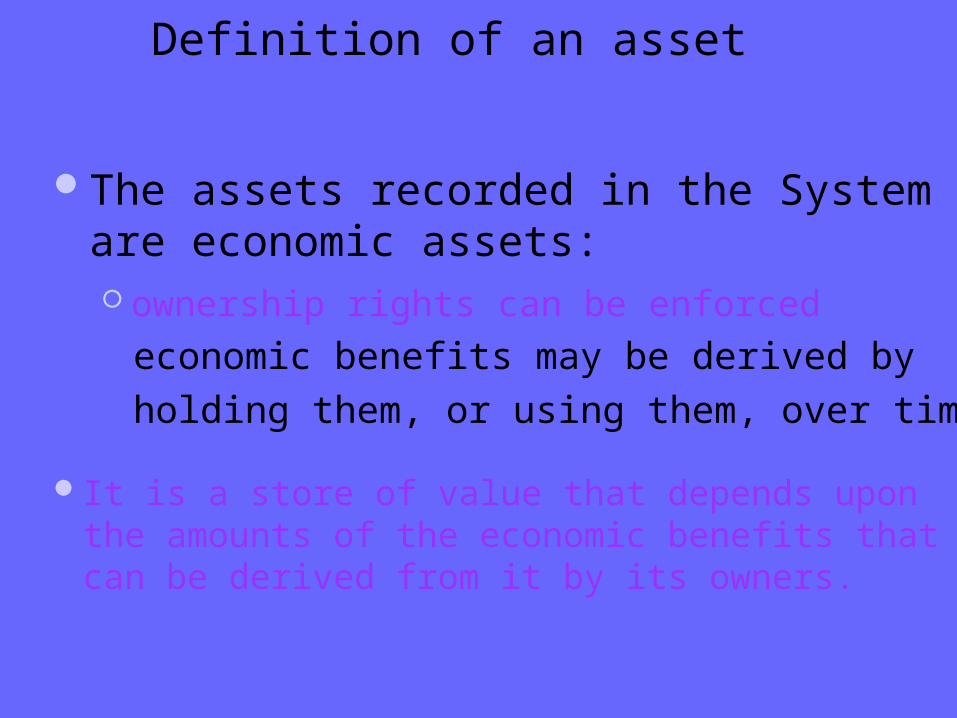
Definition of an asset
The assets recorded in the System are economic assets: ownership rights can be enforced economic benefits may be derived by
holding them, or using them, over time
It is a store of value that depends upon the amounts of the economic benefits that can be derived from it by its owners.

Definition of an asset (cont)
(a) Using assets such as machinery in production
This value (discounted for inflation) does not usually remain constant but often diminish with the passage of time.
Different kinds of benefits may be derived such as
(b) Property incomes: for example, interest, dividends, rents, etc., received by the owners of financial assets and non-produced assets;
(c) Some assets may be held purely as stores of values (precious metals or stones, etc.) without any other benefits being derived from them.
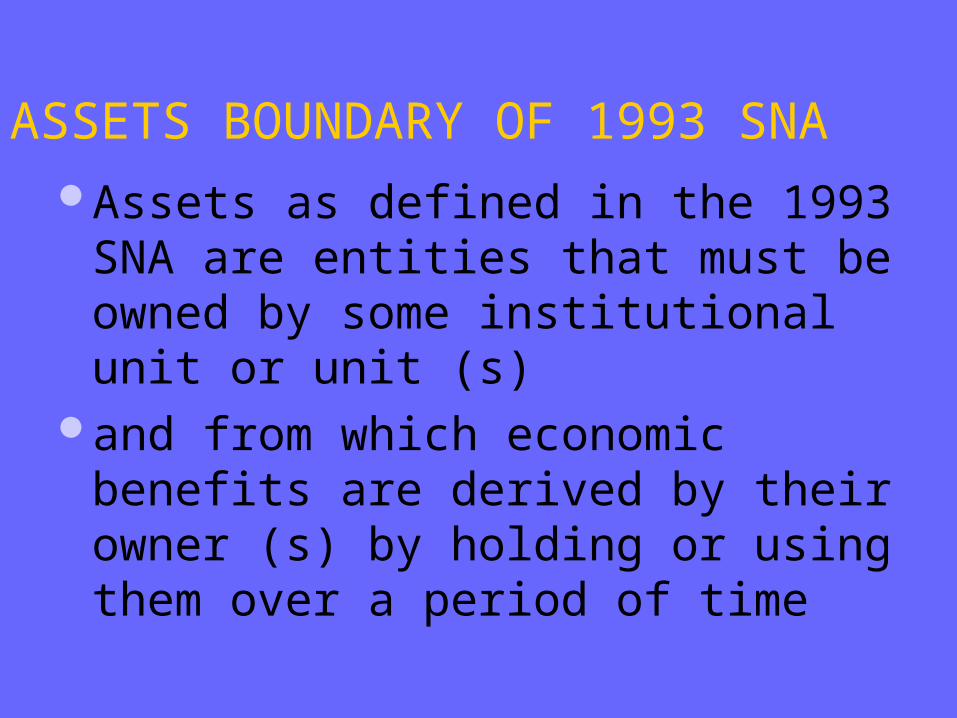
ASSETS BOUNDARY OF 1993 SNA
Assets as defined in the 1993 SNA are entities that must be owned by some institutional unit or unit (s)
and from which economic benefits are derived by their owner (s) by holding or using them over a period of time

Asset boundary
All entities which meet the definition of an asset appear on the balance sheet of the economy.
Value represents the market’s view of the total of the benefits embodied in the asset.
All assets can be represented by a monetary value

Types of assets
It exists, like land and sub-soil assets; or Appears over time and is valued/recognised
when there is an equivalent market price
Non-produced
Produced
Enter via production or imports Leave via being exhausted, sold to residents for
use other than as asset, sold to non-residents
May leave via depletion or impairment

ASSETS BROAD CLASSIFICATION
Assets
Financial
Non-Financial
Produced
Non-Produced

Produced
Financial assets
Fixed
Non-produced
Inventories Valuables
Intangible Tangible
- Patented entities
- Leases and contracts
- Purchased goodwill
- Mineral exploration- Computer software- Entertainment, literary or artistic originals- Other
- Buildings- Structures- Machinery
& Equipment
Tangible Intangible
Assets in the 1993 SNA
Non-financial assets
- Land- Subsoil assets- Non-cult biological
resources- Water resources
Produced
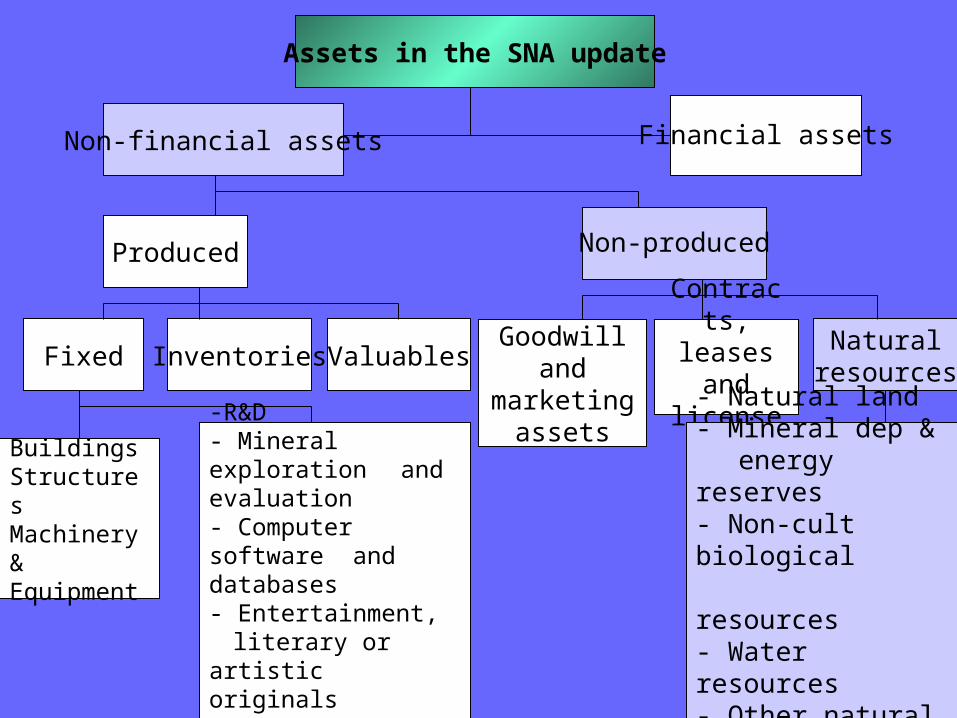
Assets in the SNA update
Financial assets
Fixed
Non-produced
Inventories ValuablesNatural
resources
Contracts, leases
and licenses
Goodwill and
marketing assets
-R&D - Mineral exploration
and evaluation - Computer software
and databases- Entertainment, literary or artistic originals - Other IP products
BuildingsStructuresMachinery & Equipment
Non-financial assets
- Natural land- Mineral dep & energy reserves- Non-cult biological resources- Water resources- Other natural resources

NATIONAL ACCOUNTS
All transactions within a time period
Between the economic agents
Constituting the national economy

NATIONAL ACCOUNTS (Contd.)
Sequence of accounts
P
Production
Primary Distribution of Income
Secondary Distribution of Income
Use of Income
Capital
Changes in Balance Sheet
Financial


NATIONAL ACCOUNTS
All transactions within a time period
Between the economic agents
Constituting the national economy
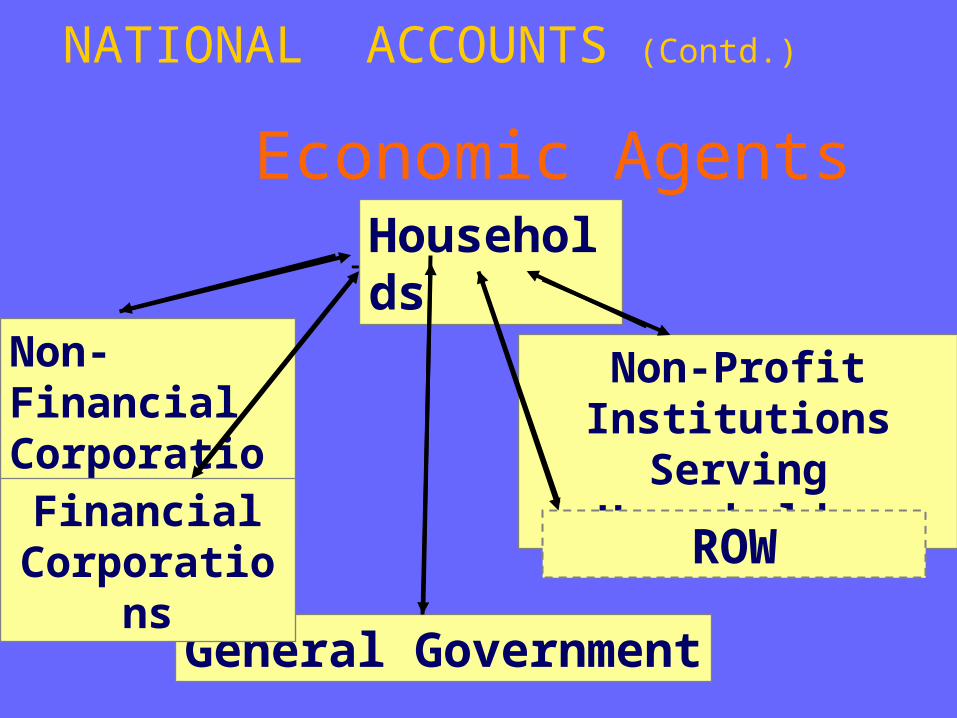
NATIONAL ACCOUNTS (Contd.)
Economic Agents
P Households
Non-Profit InstitutionsServing Households
ROW
General Government
Non-FinancialCorporations
FinancialCorporations

NATIONAL ACCOUNTS
All transactions within a time period
Between the economic agents
Constituting the national economy

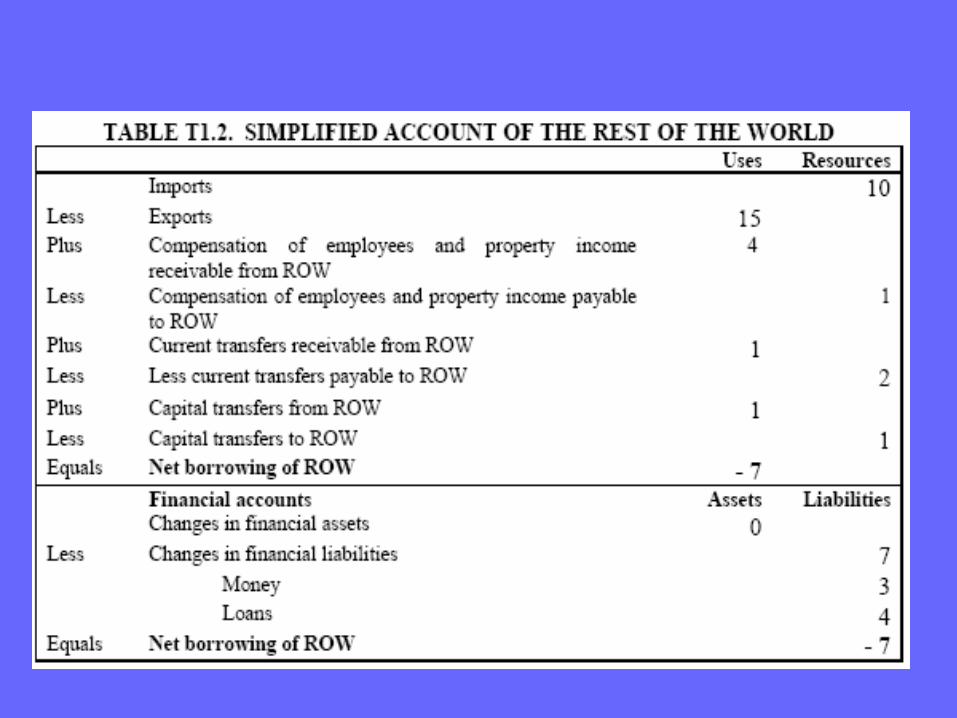
Account for the rest of the world (ROW)
Principles: Transactions recorded from the perspective of
ROW All transactions are recorded twice, as
receivables in the domestic economy and as payable in the ROW account and vise versa. (eg: current transfers receivable from ROW in Domestic economy is recorded as payable to ROW in ROW account)


Goods and services account
Characteristics:Brings together total supply and uses of
Gs & SsIt is balanced by itselfResources recorded on the right side and
uses on the left side


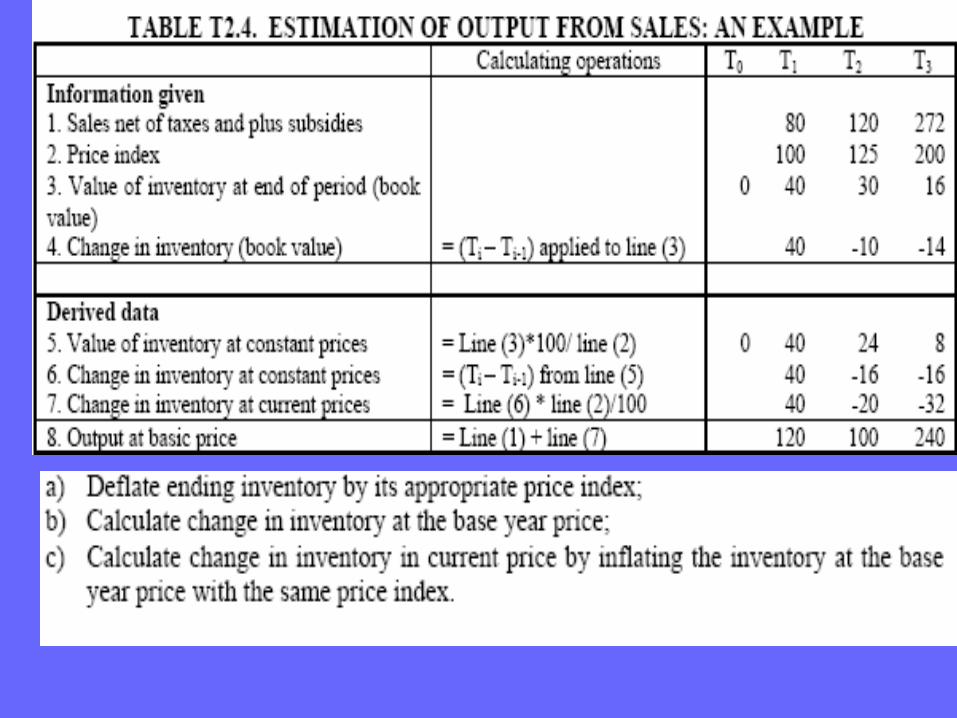

Supply and Use tables
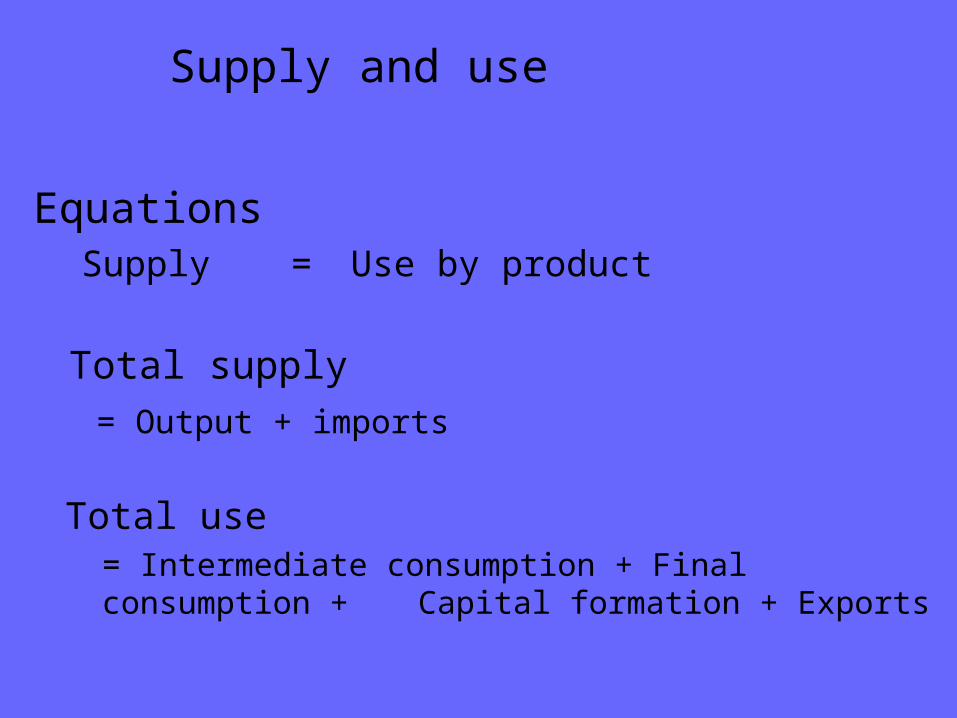
Supply and use
EquationsSupply = Use by product
Total use = Intermediate consumption + Final consumption +
Capital formation + Exports
Total supply
= Output + imports

Supply table
Industry Total Imports
fob
Cif/ fob adj.
Total product supply at basic prices
Trade and transport margin
Import duties
Taxes less subsidies on products
Total supply at purchasers’ prices
1 2 3
Product 1 156 24 180 15 195 33 2 11 241
Product 2 9 80 89 8 97 27 1 6 131
Trade and transport and insurance
62 62 1 -2 61 -60 0 1
Cif/fob adjustment
-2 2 0
Total output at basic prices
165 104 62 330 22 0 352 3 17 373
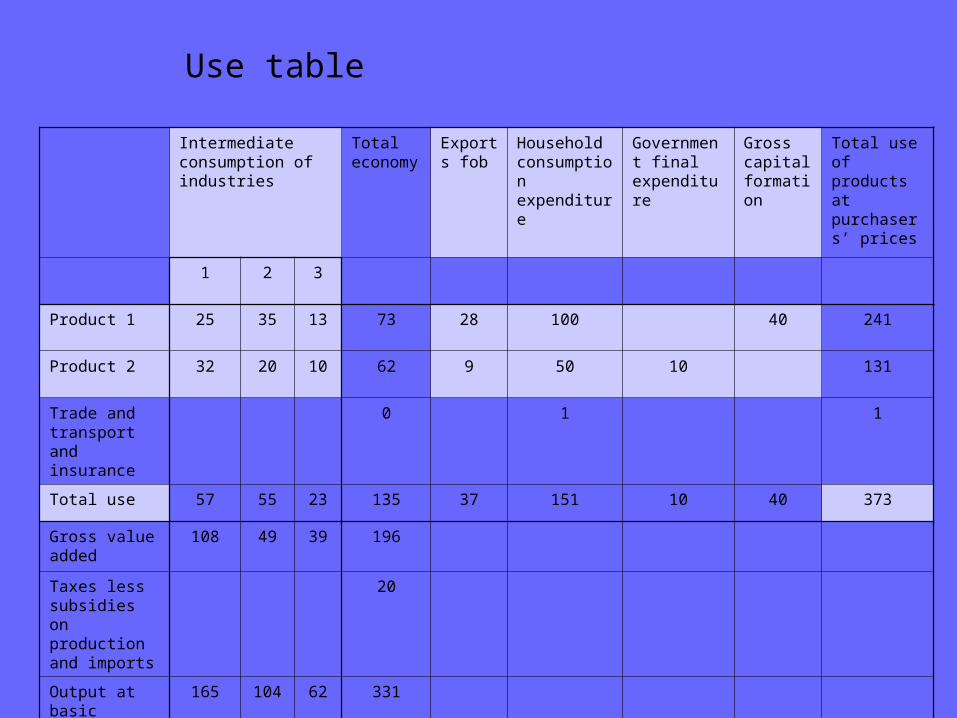
Use table
Intermediate consumption of industries
Total economy
Exports fob
Household consumption expenditure
Government final expenditure
Gross capital formation
Total use of products at purchasers’ prices
1 2 3
Product 1 25 35 13 73 28 100 40 241
Product 2 32 20 10 62 9 50 10 131
Trade and transport and insurance
0 1 1
Total use 57 55 23 135 37 151 10 40 373
Gross value added
108 49 39 196
Taxes less subsidies on production and imports
20
Output at basic prices
165 104 62 331

Role of supply and use table
Compilation tool Verification Reconciliation Balancing
for Benchmark estimates Annual national accounts in constant prices
extrapolated using volume indexes or deflating using price indexes
Quarterly national accounts using price and volume indexes from short-term indicators

Source data Annual establishment/enterprise surveys and profit
and loss/balance sheets of enterprises
Administrative data
Business registers, employment, production, volume and price information, etc.
Balance of payments on exports and imports of services
Custom data on exports and imports of goods
Household budget surveys
Government revenue and expenditure budgets
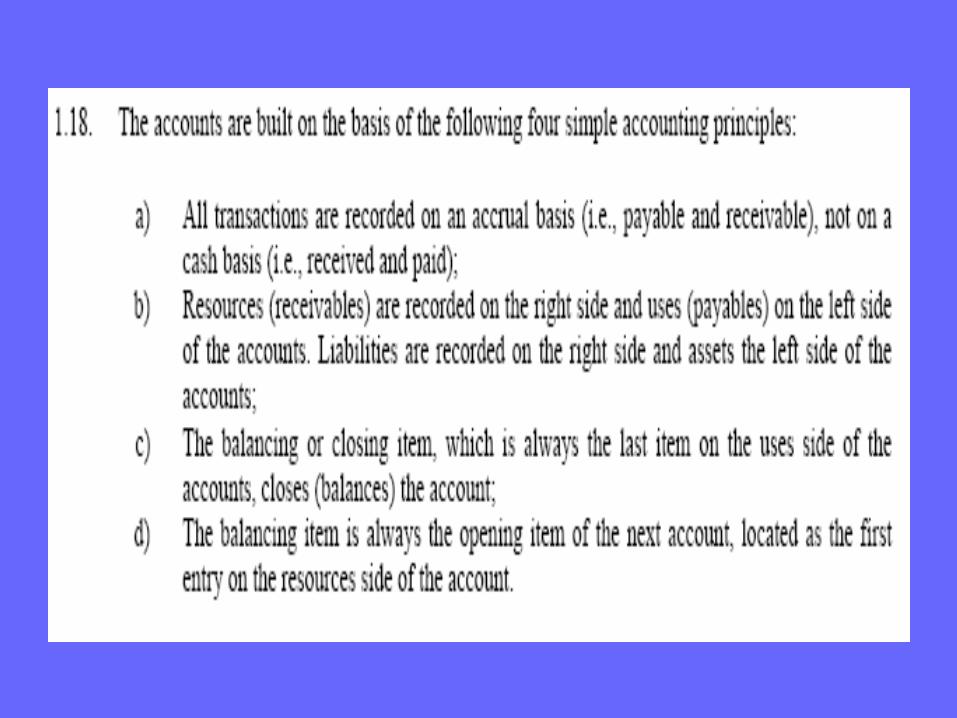
Data can be derived from a variety of different sources, such as administrative and business records, as well as specially conducted censuses and surveys. In practise, however, macroeconomic accounts can seldom be built up by simply aggregating the relevant micro-data.
(SNA 93:12)