overview of synchrophasor applications...2014/10/22 · recognition of the synchrophasor technology...
TRANSCRIPT

Overview of Synchrophasor
Applications
Dmitry Kosterev
Bonneville Power Administration
1

Recognition of the
Synchrophasor
Technology at the
World-Wide Stage:
BPA synchrophasor
project received
2013 Platt’s Global
Energy Award for
Grid Optimization
2

PMU Installations
• PMU installations and system design are driven by requirements of planned applications
• Stand alone or relay upgrade ?
• Redundancy ?
• PMU status monitoring ?
• Critical Cyber Asset ?
• Measurements: voltage and current phasors, active and reactive power, ABC phase values, digital status
3

Typical Control Room Architecture
Phasor Data
Concentrator*
Phasor
Gateway
Utility
PMUs
SCADA
2sec
Historian
Application
Server
Client
Visualization~200 Kmps
~18 Kmps
4
*PDCs:
• ePDC
• SEL
• openPDC
• other
Wide-Area Network
Inter-utility Data Exchange
Alarms
Bonneville Power – OSI Soft
PI as a platform, custom
applications
California ISO – EPG RTDMS
Peak RC – Alstom Grid
PG&E – Alstom Grid
SCE – General Electric
Several smaller utilities use
SEL
Open source GPA
54 PMUs
60sps

Western Interconnection Sycnhrophasor
Program
Utility
PDC
PMU
1
PMU
N
Utility 1
Peak RC / CISO
Utility
PDC
PMU
1
PMU
N
Utility N
Local
Apps
Local
Apps
RC PDC
RC
Archive
RC
Apps
WISP WAN*
*Operated by Harris
19 participants exchanging
data on WISP WAN 5

Overview of Applications
• Event Analysis
• Model Validation
• Frequency Response Analysis
• Frequency Disturbance Detection
• Islanding Detection
• Oscillation Detection and Mode Meter
• Voltage Stability
• State Estimation
• Equipment Malfunction
• Development Pipeline
6

Event Analysis
7

Event Analysis
• Maturity: 9/10
• Event Analysis is the most mature application of the synchropahsor technology since mid 1990s
• Synchronized-wide-area PMU data is used to time-align events to correctly determine sequence of events, their causes and effects
• NERC PRC-002 Reliability Standard (out for ballot) sets placement requirements for disturbance monitoring devices– Regional entities (e.g. WECC) have their own guidelines in
place
8

September 8, 2011 Pacific Southwest Outage
• Disturbance evolved over about 11 minutes
• There were several phases of multiple switching actions
• Timing of events reported by utilities was different, a few by several minutes
9
SCADA PMU
• Time-synchronized data from three PMUs was used to align switching events precisely in about 2 hours versus months
• PMU data was also essential for model validation studies to simulate the event in time sequence power flow and transient stability programs

Trending Real-Time Data
10

Trend Displays
• “A good trend is your friend”
• Trend displays provide “pulse” on the system state
• A good trend display supports decision-making
– the goal is to help operate the system, and not to amuse
– customization is often required to align with operating procedures
• A good trend display needs to include:
– High-resolution synchrophasor trends
– Long-term SCADA trends and respective operating limits
– Results of analytical applications
• An example is on next page…
11

OSI Soft PI Process Book display is shown aboveSEL Synchrowave, EPG RTDMS, Alstom Phasorpoint, Space Time Insight
have trending apps, a number of utilities developed their own displays12

Power Plant Model Validation
13

Power Plant Model Validation
• Maturity: 8/10– Users: transmission planners, generator owners
– in use at BPA in various forms since 2000, programmatic since 2009
– Currently works with GE PSLF
– PSS®E and TSAT are adding same capabilities
• PPMV Application has been used:– compliance with NERC MOD -026/27 Standards
– determination of power plant operating practices
– Identifying model inaccuracies even after stage testing was done
– detection of generator control failures
• PPMV can produce disturbance performance reports for the entire generating fleet (monitored by PMUs)
14

Power Plant Model Validation
• Periodic validation is required by NERC MOD-026,-027
Reliability Standards
• Cost-effective alternative to staged tests (assuming a
good baseline model exists)
• PMUs allow more frequent model validation, becomes
a clinical tool in detecting control abnormalities
• Make PMU/DDR installation a part of youe
generation interconnection requirements (visit
www.naspi.org for typical language)
15

Using PMU Data for Model Validation
Disturbance play-in capabilities are added to GE PSLF in 2001
16
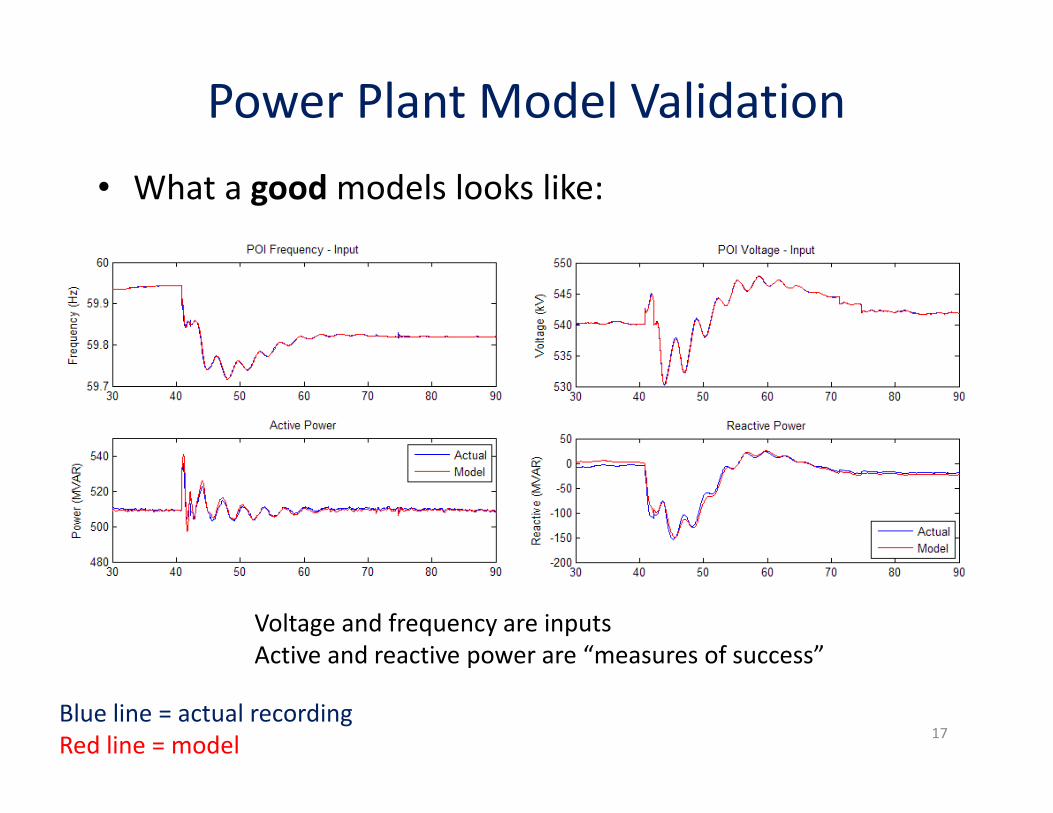
Power Plant Model Validation
• What a good models looks like:
Blue line = actual recording
Red line = model
Voltage and frequency are inputs
Active and reactive power are “measures of success”
17

Power Plant Model Validation
• What a bad model looks like:
Blue line = actual recording
Red line = model
Voltage and frequency are inputs
Active and reactive power are “measures of success”
18

Model Calibration
• Can PMU data be used for model calibration ?
• Yes, PMUs can complement model development, there are successful case studies – engineering expertise and knowledge of generator controls is essential
• But, beware of curve fitting exercises19

Model Calibration
• EPRI Power Plant Parameter Derivation (PPPD) is most mature, a user group is established including 23 participants
• Bernie Lesieutre @ University of Wisconsin uses a unique approach of pattern matching – which is useful to provide insight in model inaccuracies
• Others:
– MATLAB
– University of Texas – Particle Swarm Optimization
– PNNL – Kalman filter
– Georgia Tech – super-calibrator
– Idaho Power developed in-house optimizers
20

Power Plant Model Validation
• Power Plant Model Validation (PPMV) application
– works with GE PSLF
– PTI PSS®E functionality is being added
• Data and model management layer is added as a
stand-alone program (PNNL)
• Model validation reports for 20 GW of BPA
generating fleet are produced within minutes
• Working on expanding to wind and solar plant
validation (need point-on-wave data)
21

Detecting Abnormal Control Behavior
• Once a good model is established,
PPMV becomes a clinical tool for detecting control
abnormalities
0 10 20 30 40 50 60 70 80 90 100480
490
500
510
520
530
540
550
Time (sec)
Act
ive
Pow
er
[MW
]
Power
Observed
Expected
22

Detecting Abnormal Control Behavior
… and control failures
2 3 4 5 6 7 8 9 10500
520
540
560
580
600
620
640
660
680
700
Time (sec)
Act
ive
Po
wer
[MW
]
Power
Observed
Expected
23

Load Modeling
24

Load Modeling
• Load plays greater role in
system stability
• Load modeling efforts are
under way to develop and
implement composite load
model
• Model validation efforts are essential
• Positive sequence data is not sufficient, point-on-
wave disturbance recordings are needed
– Micro-PMU project
– Extended triggering is feasible at PMU – used by BPA
400
420
440
460
480
500
520
540
560
-10 0 10 20 30 40
25

System Model Validation
26

System Model Validation
• Periodic verification of system models is
required by MOD-033 Reliability Standards
• PMU data of system frequency, voltages, path
flows is essential for credible model validation
• In the West, there is a long history of system
model validation, on 1 to 2 system model
validation studies are done each year
27

System Model Validation
0 10 20 30 40 50 60 70 8059.7
59.75
59.8
59.85
59.9
59.95
60
60.05
60.1
Time (sec)
Fre
qu
en
cy
(Hz)
Malin Frequency
0 10 20 30 40 50 60 70 8059.7
59.75
59.8
59.85
59.9
59.95
60
60.05
60.1
Time (sec)
Fre
qu
en
cy
(Hz)
Custer Frequency
Actual
Simulated
Actual
Simulated
0 10 20 30 40 50 60 70 801500
2000
2500
3000
3500
Time (sec)
Pow
er
(MW
)
COI Power
0 10 20 30 40 50 60 70 800
200
400
600
800
1000
1200
1400
Time (sec)
Pow
er
(MW
)
Custer - Ingledow Power
Actual
Simulated
Actual
Simulated
FREQUENCY ACTIVE POWER
28

Frequency Response
Analysis
-20 -10 0 10 20 30 40 50 60 70 8059.86
59.88
59.9
59.92
59.94
59.96
59.98
60
60.02
A
B
C
Time (sec)
Fre
quen
cy
(Hz)
29

Frequency Response
FERC defines in RM13-11:
“Frequency response is a measure of an
Interconnection’s ability to stabilize frequency
immediately following the sudden loss of
generation or load, and is a critical component
of the reliable operation of the Bulk-Power
System, particularly during disturbances and
recoveries.”
30

Frequency Response
• NERC BAL-003-1 Frequency Response and Frequency Bias Setting Reliability Standard is approved
• No loss of load is permitted for resource contingencies:
31

NERC BAL-003-1
• Interconnection Frequency Response Obligation is calculated in MW per 0.1 Hz at settling frequency (point B)
• IFRO is prorated among Balancing Authorities (BAs) based on annual load and generation
• BAs are responsible for providing frequency response, – BA FRM is measured as change in BA interchange
over the delta frequency between initial and settling values
• Formation of Reserve Sharing Groups is permitted
32

33
BPA – PNNL Frequency Response Analysis Application

BA Frequency Response Measure Calculation
BA FRM = (PINT_B – PINT_A + BA GEN LOSS) / ( FA – FB)
FA
FB
PINT_APINT_B
FC
34

Western Interconnection Performance
35
WECC IFRO is about 950 MW per 0.1 Hz, system performance is about 1,440 MW per 0.1 Hz

Balancing Authority Performance
Interchange response is measured for compliance with NERC BAL-003-1
Generation response is calculated to determine how much frequency response to acquire
36

Frequency Response Analysis Tool
• Maturity: 6 /10– Users: Balancing Authorities, Reliability Coordinators
• Frequency Response Analysis Tool (FRAT):
• What is does now– Has been used in WECC for interconnection-wide frequency
response analysis since 2012
– BA frequency response analysis is added in 2014
• Work in Progress
– Produce NERC FRS 1 and 2 Forms
– Power plant response analysis is under development
– Power pick-up on transmission paths is under development
37

Frequency Event Detection
38
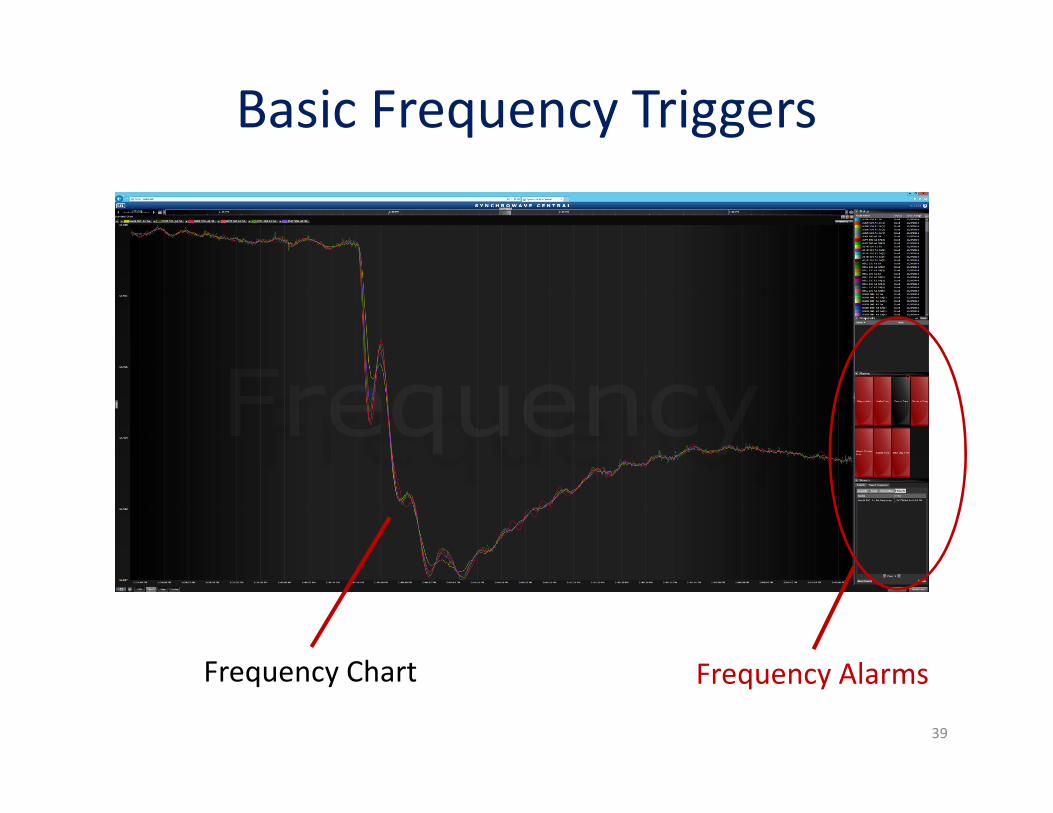
Basic Frequency Triggers
39
Frequency AlarmsFrequency Chart

Frequency Event Detection
• Maturity: 7/10
• Users: dispatchers, operating and planning engineers
• FNET
• BPA FDM– Identify origin of frequency event by the propagation
of “frequency wave”
– Triggers on frequency deviation, ranks PMUs based on frequency deviation and its rate of change
– Future development:• Add power pick-up on major paths
40

Frequency Event Detection
41
SYNCHROPHASOR: 9/24/2014 2:19:24.39999 AMFREQUENCY DISTURBANCE EVENT MAP CLOSE
Events:
GARRISON
JOHN DAY
LOWER
BIG EDDYTROUTDALE
FERRYMONUMENTALCENTRAL
ROCK CREEK
SLATT
WAUTOMA
BONNEVILLE
KEELER
NORTH
PEARL
OSTRANDER
ALVEY
ALLSTON
MARION
PAUL
GRIZZLY
SCHULTZ
SUMMER LAKE
ECHO LAKE
CAPT JACK
MONROE
MALIN
CUSTER
BELL
0.005
ASHE
COULEEGRANDCHIEF
JOSEPH
CRAIG
HEMINGWAY
NAVAJO
COLSTRIP
INTERMTN
SYLMAR
LUGO
LANGDON
GENESSEE
FDM SUMMARYLOAD EVENTTx12 Tx24 TxPRTNR
Number of PMUs in Event:
ALARM EVENT
Frequency Change Magnitude: .1471
31
VINCENT
ADELANTO
PALOVERDE
FOUR CORNERS
MCNARY

Frequency Event Detection
42

Frequency Event Detection
43

Reconnection of Alberta to WECC
44

Islanding of Alberta
45

Islanding Detection
46

Island Detection
47

Phase Angle Differences
48

Islanding Detection
• Maturity: 7/10
• Users: dispatchers, operating engineers
• The application could be very useful during system restoration from outages caused by natural disasters
• The value of using PMUs for island detection during hurricane Katrina is well documented by Floyd Galvin at Entergy
49

Oscillation Detection
50

Oscillation Detection
• Maturity: 8/10
• Users: dispatchers, operating and planning engineers
• Scans power plants, interties, HVDC and SVCs for growing or sustained high energy oscillations
• Developed by Dan Trundowski at Montana Tech
• Operational at BPA since October 1, 2013, alarms dispatchers
• Dispatcher training is performed
• A number of events has been detected
51

Oscillation Detection
52

Oscillation Detection
53

Oscillation Detection – Wind Power Plant
54

Oscillation Detection – Wind Power Plant
55
12:30 12:00 11:30 10:00 9:30 9:00
3/6/2014 12:47:48 PMFREQUENCY
59.95
59.97
59.98
59.99
60
60.01
60.02
60.03
60.05
12:30 12:00 11:30 10:00 9:30 9:00
3/6/2014 12:47:48 PMJOHN DAY - BIGLOW MW
-450
-350
-300
-250
-200
-150
-100
-0
12:30 12:00 11:30 10:00 9:30 9:00
3/6/2014 12:47:48 PMJOHN DAY VOLTAGE
235,500
236,500
237,000
237,500
238,000
238,500
239,000
239,500
240,500
12:30 12:00 11:30 10:00 9:30 9:00
3/6/2014 12:47:48 PMJOHN DAY - BIGLOW MVAR
-20
0
10
20
30
40
50
60
80
FREQUENCY VOLTAGE
ACTIVE POWER REACTIVE POWERBEFORE
AFTER
16:00 17:00
4/15/2014 4:14:59 PMJOHN DAY - BIGLOW MVAR
-20
0
10
20
30
40
60
16:00 17:00
4/15/2014 4:14:59 PMJOHN DAY - BIGLOW MW
-450
-350
-300
-250
-200
-150
-50
16:00 17:00
4/15/2014 4:14:59 PMJOHN DAY VOLTAGE
236,000
237,000
238,000
239,000
240,000
241,000
242,000
16:00 17:00
4/15/2014 4:14:59 PMFREQUENCY
59.95
59.97
59.98
59.99
60
60.01
60.02
60.03
60.05FREQUENCY VOLTAGE
ACTIVE POWER REACTIVE POWER

Mode Meter
56

Mode Meter
• Maturity: 5/10
• Users: dispatchers, operating and planning
engineers
• Pro-active: estimates damping of inter-area
power oscillations from ambient data
• Developed by Dan Trundowski at Montana
Tech, University of Wyoming, PNNL
• Implemented, under evaluation
• Operating procedures are under development
57

Voltage Stability
58

Voltage Stability Situational Awareness
• You need to know
where you are
• You need to know
where the edge is, and
• You need to know how
far from the edge is
safe to be – the
operating limit
YOU
EDGE
SAFE
LIMIT

Voltage Stability Situational Awareness
Measurements tell where you are, measurements do not tell you where the edge is
You need a model to estimate where the edge is
• Full-topology voltage stability solutions (for wide-area voltage stability)– V&R ROSE – uses state estimator model for voltage
stability analysis, PMU data is used between snapshots
• Implemented at New England ISO
• Evaluated at Peak RC
60

Voltage Stability Situational Awareness
• Reduced topology voltage stability solutions
- Renesaller Polytechnic Institute
- Evaluated at BPA and SCE
• Thevenin Equivalent
– ABB VIP, EPRI VIP, Quanta/Alstom Grid RVII
• Application is limited to simple radial systems
• PV-Slope Sensitivity
– Electric Power Group
• Lagging indicator
• Reactive Reserves
61

State Estimator
62

State Estimator
• Leading state estimators can take phasor
measurements as inputs
• Peak RC and BPA integrated phasor
measurements in Alstom Grid state estimator
• Linear State Estimators
– Used for line parameter verification at Dominion
– Used for data calibration
• WECC-funded work at EPG
63

Equipment Mis-Opertaion
64

Equipment Mis-operation and Control
Failures
• US DOE Paper on using PMUs for detecting equipment mis-operation and control failures
• Documented cases:– Predicting transformer failure
– Control system failure at generators
– Control system failure at HVDC line
– Forced oscillations rock major tie-lines
65

Data Quality
66

Data Quality
• Data availability and quality are essential for
applications
• DOE CERTS funded development of applications for
monitoring data quality and developing best data
management practices – competitive solicitation
was awarded to EPG
• WECC funded a project on developing an application
for PMU data calibration – competitive solicitation
was awarded to EPG
• EPG PDVC application is available
67

Application Pipeline
68

Application Pipeline
• Research pipeline is very long with advanced applications, a few more mature are noted here
• Data mining– PNNL statistical application for finding system
abnormalities and close calls
– EPG data mining application
• Voltage stability controls– Synchrophasor-based reactive switching controller is
being implemented at BPA
– Voltage controller is evaluated at SCE
• Oscillation Damping Controls– PDCI modulation is evaluated by BPA, SCE and Sandia
• Wide Area Monitoring, Protection and Control (WAMPAC) by PG&E
69

Questions ?
70