overview of sea ice data assimilation activities at ... · ecmwf-wwrp/thorpex workshop on polar...
TRANSCRIPT
ECMWF-WWRP/THORPEX Workshop on polar prediction, 24 - 27 June 2013 1
Overview of sea ice data assimilation activities at Environment Canada
M. Buehner1, A. Caya1, T. Carrieres2, L. Pogson2, and M. Lajoie3
1 Data Assimilation and Satellite Meteorology Research, Environment Canada 2 Canadian Ice Service, Environment Canada
3 Data Assimilation and Quality Control Development, Environment Canada
This paper describes recent upgrades made to a regional ice analysis system and a new global ice analysis, both developed at Environment Canada. While the regional system is primarily aimed to satisfy the operational requirements of the Canadian Ice Service, the global system is designed to provide more accurate and reliable sea ice information for the Canadian numerical weather prediction systems. Objective verification scores computed from independent data are used to evaluate the accuracy of the analyses from both systems. These demonstrate that the improved regional system is consistently more accurate than the previous version and the new global ice analyses are significantly more accurate than the currently operational system.
1. Introduction
Sea ice analyses are required for a variety of applications. Such analyses, specifically for assisting the planning of marine transportation and other marine activities, are currently produced by the Canadian Ice Service (CIS) through the manual analysis of a wide variety of satellite, aircraft and in situ observations (Carrieres et al. 1996). The application of numerical sea ice models also requires sea ice analyses to specify the initial conditions (e.g. Pellerin et al., 2004). Atmospheric models used for numerical weather prediction (NWP) require ice information as a lower boundary condition for computing the radiative, thermal and humidity fluxes.
A series of improvements have recently been implemented for the regional ice analysis system that represents the analysis component of the Canadian Regional Ice Prediction System (RIPS; Buehner et al. 2013). It is primarily aimed at supporting CIS operational services for ice-infested waters around North America, including for Canada’s two arctic METAREAs. A global configuration of the same system has also been developed for global NWP and other global applications. The strategy for developing these systems has been, as much as possible, to apply existing techniques and public domain research, including the three-dimensional variational data assimilation approach (3D-Var) upon which the systems are based.
The outline of this paper is as follows. Section 2 provides a description of the improvements recently made to the regional ice analysis system and the impact from these improvements on verification measures. Section 3 describes the new global configuration of the ice analysis system and verification scores as compared with the existing Canadian ice analysis system used for operational NWP applications. In Section 4 a summary and a brief description of current areas of active research are given.

BUEHNER, M.: SEA ICE DATA ASSIMILATION
2 ECMWF-WWRP/THORPEX Workshop on polar prediction, 24 - 27 June 2013
2. Recent improvements to the Regional Ice Prediction System
2.1. Description of the previous version
A brief description of the first version of the analysis component of RIPS is now given (more details can be found in the study by Buehner et al. 2013). The analysis domain (Figure 1) covers all of the ice affected waters surrounding North America extending from west of the Bering Strait to east of Greenland and from south of the Great Lakes to just beyond the North Pole. Only ice concentration is estimated on a grid with ~5 km spacing and 1640x1080 horizontal grid points. The assimilation algorithm is known as 3D-Var with first guess at the appropriate time (FGAT). All observations within the assimilation time window are considered when producing the analysis at the centre of the 6h window. There is no sea ice model used yet in the data assimilation cycle, but instead the previous analysis is used as the background state. Four analyses (valid at 0, 6, 12, and 18 UTC) are produced each day.
The observations assimilated are total ice concentration values derived from a variety of sources. Observations from the passive microwave sensor SSM/I onboard the Defence Meteorological Satellite Program satellite F15 are assimilated. The retrieved ice concentration is calculated from observed brightness temperatures using the NASA Team 2 (NT2) sea ice algorithm (Markus and Cavalieri, 2000). The footprint size of the passive microwave channels used in the NT2 algorithm is significantly larger than the grid spacing of the analysis. To avoid contaminating small scale details that are not represented in these ice concentration retrievals, a so-called “footprint operator” is used as part of the observation operator. This footprint operator averages the gridded ice concentration (from either the background state or the analysis increment) over all grid points within a distance from the observation location equal to the footprint radius of the sensor, thus simulating the spatial averaging effect of the actual satellite measurement.
Daily ice charts are prepared manually in near real-time by CIS (Carrieres et al. 1996). These charts are subjective analyses of the instantaneous ice concentration based on several types of remotely sensed data, ship and aircraft reports, and the analysis from the previous day. In addition, CIS performs subjective analyses of RADARSAT synthetic aperture radar (SAR) images that include estimates of ice concentration. Both types of manual analyses are assimilated after being converted into gridded form at a resolution close to that of the analysis grid and therefore a simple bilinear horizontal interpolation is used in the observation operator for this data source.
The quality control of the observations is an important aspect of any data assimilation system. There are two levels of quality control employed in the present system. The first is a type of “background-check” to eliminate entire swaths of remotely sensed data that are unusable due to a sensor failure on the satellite for example, or to eliminate data extracted from an entire CIS daily ice chart or RADARSAT image analysis because of a technical problem that has corrupted the data. The second level of quality control is only applied to retrievals from passive microwave satellite data and is necessary to reject incorrect ice concentration retrievals from the NT2 algorithm. Known problems with the NT2 algorithm and passive microwave data in general include: contamination from meteorological processes not related to ice, for example mistaking the wind-roughened sea surface for ice; and bias during the season when melt-ponds form on the surface of the ice and cannot be distinguished from open water. Most importantly, no retrievals from passive microwave data are

BUEHNER, M.: SEA ICE DATA ASSIMILATION
ECMWF-WWRP/THORPEX Workshop on polar prediction, 24 - 27 June 2013 3
assimilated when the surface air temperature is above freezing to reduce the negative impacts from some of these problems.
Figure 1: Graphical product showing typical ice concentration analysis over the entire horizontal domain of RIPS on 7 January, 2013.
2.2. Assimilation of SSMIS data
The first modification to the configuration of the RIPS analysis component is the assimilation of ice concentration retrievals from SSMIS sensors, which are very similar to SSM/I. The same NT2 retrieval algorithm is used as for SSM/I. Since SSMIS data from three additional satellites is available, this represents a very large increase in the total volume of assimilated observations. The impact is evaluated by comparing the RIPS analyses both with and without SSMIS data assimilated against the IMS daily ice extent product. The IMS product is manually generated each day at the U.S. National Ice Center (NIC) showing the presence of ice or open water on a 4 km grid (Helfrich et al., 2007). It is generated by using information from a wide variety of satellite imagery, mapped products and surface observations and covers the entire RIPS domain. To compare the ice concentration against the IMS ice extent, the ice concentrations are converted into a binary ice/open-water value using a threshold of 40% ice concentration. From this binary data the frequency bias is computed as the number of ice grid points in the RIPS analysis divided by the number of ice grid points in the IMS product. In addition, the total proportion correct is computed as the proportion of grid points in the domain for which the RIPS analysis and the IMS product agree. These two measures are shown in Figure 2 over all of 2010 for the experiment with (red) and without (blue) SSMIS data assimilated. This shows a systematic improvement from including SSMIS data, especially during the summer and towards the end of the year.

BUEHNER, M.: SEA ICE DATA ASSIMILATION
4 ECMWF-WWRP/THORPEX Workshop on polar prediction, 24 - 27 June 2013
Figure 2: Analysis verification scores versus the IMS ice extent product over all of 2010 showing the impact of assimilating ice concentration retrievals from SSMIS instruments (red) as compared with the previous version of RIPS (blue). The left panel is the proportion of grid points where the ice extent derived from the RIPS analysis and the IMS manual analysis agree. The right panel shows the ratio of the total number of grid points containing ice in the RIPS analysis divided by the same number for the IMS product (frequency bias). All grid points north of 65°N are included in the verification.
2.3. Assimilation of ASCAT data
In addition to the passive microwave satellite data from SSM/I and SSMIS instruments, data from the active radar scatterometer instrument ASCAT was also assimilated. These data are in the form of three measured backscatters made from three distinct look angles for each location on the surface. Most of the data are assimilated after being converted into a measure of anisotropy, which is computed as the mean relative difference between the three backscatters. The basic idea is that over open water the wind creates capillary waves that cause the amplitude of the three backscatters to differ from each other depending on the orientation of the waves with respect to the three look directions. Over ice the three backscatters tend to have similar amplitudes, since the scattering is more random. However, a significant amount of data cannot be reliably used for estimating ice concentration and is therefore rejected by various quality control procedures. For example, when wind speed is very low the three backscatters over open water can also be very similar to each other, making it difficult to distinguish ice from open water and therefore data in these conditions are not assimilated when the surface wind speed is below a specified threshold.
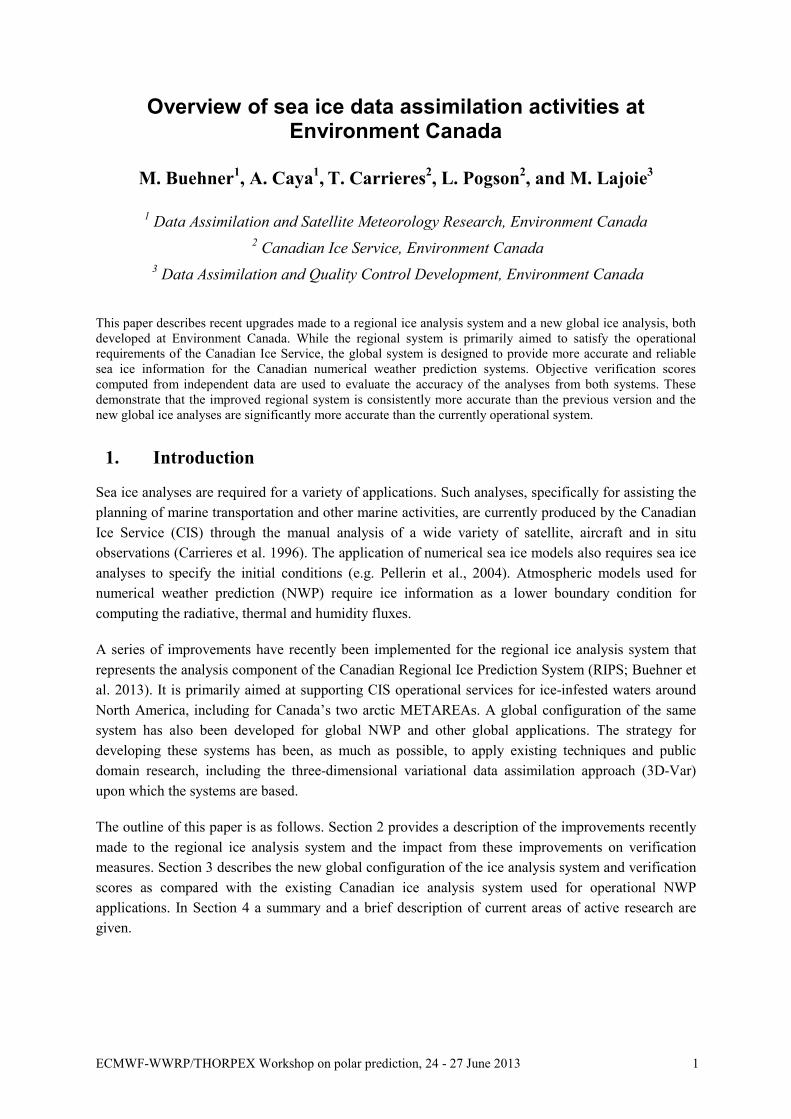
Figure 3 shows the impact of assimilating ASCAT data in addition to SSMI and SSMIS, again using the IMS ice extent product for the verification. A small positive impact is seen for the total proportion correct during the summer months. This is a period during which the quality of the analyses is at its lowest due to difficulties with measuring sea ice concentration from passive microwave data when melting is occurring on the surface. Because of this, a large amount of the passive microwave data is rejected during summer, specifically whenever the surface air temperature is above freezing. In contrast, it appears that ASCAT data, used in the way described above, can still provide useful information during summer and is therefore not subjected to the same quality control procedure based on air temperature. This likely explains why ASCAT data has a larger impact during summer.
BUEHNER, M.: SEA ICE DATA ASSIMILATION
ECMWF-WWRP/THORPEX Workshop on polar prediction, 24 - 27 June 2013 5
Figure 3: Similar to the previous figure, except showing the impact of also assimilating ASCAT data (red) as compared a version of RIPS without ASCAT data (blue). In both experiments all data are assimilated as in the previous version of RIPS in addition to SSMIS data.
2.4. Adjustment of ice concentration estimates with high uncertainty
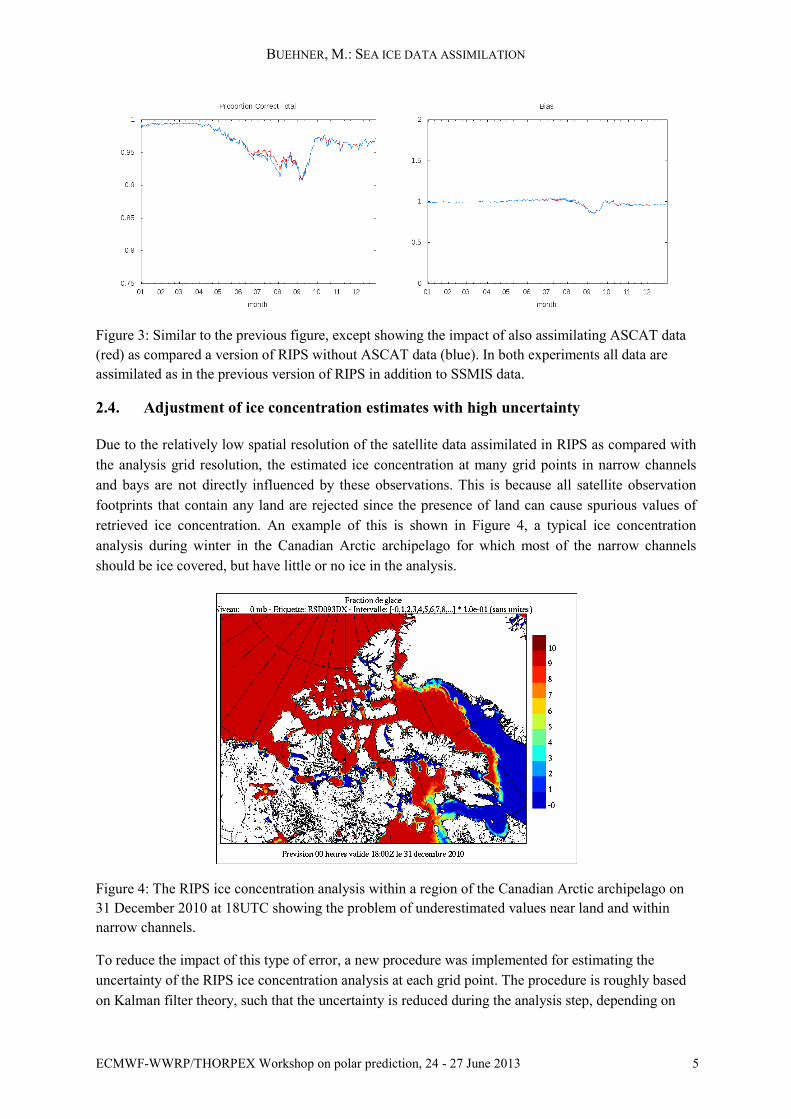
Due to the relatively low spatial resolution of the satellite data assimilated in RIPS as compared with the analysis grid resolution, the estimated ice concentration at many grid points in narrow channels and bays are not directly influenced by these observations. This is because all satellite observation footprints that contain any land are rejected since the presence of land can cause spurious values of retrieved ice concentration. An example of this is shown in Figure 4, a typical ice concentration analysis during winter in the Canadian Arctic archipelago for which most of the narrow channels should be ice covered, but have little or no ice in the analysis.
Figure 4: The RIPS ice concentration analysis within a region of the Canadian Arctic archipelago on 31 December 2010 at 18UTC showing the problem of underestimated values near land and within narrow channels.
To reduce the impact of this type of error, a new procedure was implemented for estimating the uncertainty of the RIPS ice concentration analysis at each grid point. The procedure is roughly based on Kalman filter theory, such that the uncertainty is reduced during the analysis step, depending on

BUEHNER, M.: SEA ICE DATA ASSIMILATION
6 ECMWF-WWRP/THORPEX Workshop on polar prediction, 24 - 27 June 2013
the number and relative accuracy of the assimilated observations near a particular grid point, and the uncertainty is increased during the “forecast” step, depending on the local horizontal variation in ice concentration. The net effect is that grid points in narrow channels and bays have a high estimated analysis error standard deviation (stddev) because of the lack of nearby assimilated observations, whereas other locations with recently assimilated observations have a much lower analysis error std dev. This estimated analysis error stddev is then used to identify grid points in the analysis considered highly uncertain, when the stddev is greater than the specified threshold of 0.6. For these highly uncertain grid points the ice concentration estimates are adjusted by replacing them with values obtained from applying an interpolation/extrapolation procedure that spreads the information from nearby grid points where the analysis error stddev is below the 0.6 threshold. As a result, the ice concentration analysis in narrow channels and bays are actually computed by extrapolating/interpolating from the values at grid points just adjacent to these areas where a sufficient number of observations were recently assimilated. Figure 5 shows that same analysis as in Figure 4, except with the estimated ice concentrations at all highly uncertain locations replaced with interpolated/extrapolated values. Note how most of the narrow channels and bays are now completely ice covered. Figure 6 shows similar analysis verification scores as Figures 2 and 3, except showing the impact of applying the adjustment procedure just described. Both experiments have SSMIS and ASCAT data assimilated. Note that the largest improvements from the adjustment procedure occur during summer and towards the end of the year when the ice is respectively either melting or reforming in the narrow channels and bays.
Figure 5: Similar to the previous figure, except showing the ice concentration after they have been modified through an adjustment procedure applied at all grid points with high uncertainty (i.e. high estimated analysis error stddev).

BUEHNER, M.: SEA ICE DATA ASSIMILATION
ECMWF-WWRP/THORPEX Workshop on polar prediction, 24 - 27 June 2013 7
Figure 6: Similar to Figure 3, except showing the impact of applying the adjustment procedure that replaces the ice concentration estimates at all grid points with high uncertainty (red) as compared with an experiment that does not use this procedure. In both experiments all data are assimilated as in the previous version of RIPS in addition to SSMIS and ASCAT data.
2.5. Impact from all changes
Figure 7 shows the impact on the analysis verification scores from incorporating the three major changes discussed previously: assimilation of SSMIS data, assimilation of ASCAT data, and application of an adjustment procedure for highly uncertain ice concentration estimates. The largest improvement in the total proportion correct is seen during the summer and towards the end of the year. Also, note that the previous version of the system has significantly less ice and lower proportion correct at the end of the year as compared with the beginning. This is due to initializing the experiments at the beginning of the year using an ice concentration field from a different system that has complete ice coverage in all channels and bays in the Arctic. It is only because of the correction procedure for highly uncertain estimates that the scores in the new version of the system are now very similar at the end of the year as compared with the beginning. It should be noted that this was much less of a problem at the time of implementation for the original version of RIPS due to the assimilation of the higher resolution AMSR-E data, which was no longer available after October 2011 (though it is not included in any of the experiments presented in this paper).
Figure 7: Similar to the previous figure, except showing the impact of all changes to RIPS described in this paper (red) as compared with an experiment equivalent with the previous version of RIPS (blue).
BUEHNER, M.: SEA ICE DATA ASSIMILATION
8 ECMWF-WWRP/THORPEX Workshop on polar prediction, 24 - 27 June 2013
3. A new Global Ice Analysis System
3.1. System description
A version of the sea ice analysis system was recently developed for the purpose of providing reliable global sea ice concentration analyses to the Canadian NWP systems. This sea ice analysis system uses the same approach and computer codes for processing the observations and for data assimilation as the regional system described in the previous section. The main difference with the regional system is that this configuration uses a global grid with ~10 km spacing. Also, the current version of the global analysis system does not yet assimilate ASCAT data, but instead only uses data from the SSM/I and SSMIS instruments in addition to the CIS manual ice charts. Other differences were made to provide more realistic analyses for lakes that are too small to be influenced by any of the assimilated satellite observations.
3.2. Analysis verification results
Several types of objective evaluations were performed to compare the accuracy of the new global ice analysis system with the currently operational system. The current system is based on a simple gridding and data averaging procedure, instead of a proper data assimilation approach, to combine information from SSM/I ice concentration retrievals and CIS manual ice charts on a grid with 35 km spacing. Because this system solely relies on SSM/I data from one satellite platform for the majority of the global analysis domain, it is much less reliable than the new system that also assimilates data from three SSMIS instruments. Figure 8 shows the stddev of the difference between concentrations from the new 10 km global ice analyses and concentrations derived from bi-weekly manual ice charts produced at the NIC for the domain covering all of the northern hemisphere (red). Also shown is the same comparison, but using concentrations from the currently operational 35 km ice analysis system (green). Throughout all of 2010 the new system results in a lower stddev except near the end of the year when the two systems produce analyses with similar accuracy. Figure 9 shows the ice concentration bias relative to the NIC manual ice charts, again for the new global analysis system (red) and the currently operational system (green). For the first half of the year, the amplitude of the bias is smaller for the new system, however, for the second half of the year the amplitude is more similar, but with opposite sign.

BUEHNER, M.: SEA ICE DATA ASSIMILATION
ECMWF-WWRP/THORPEX Workshop on polar prediction, 24 - 27 June 2013 9
Figure 8: The stddev of the difference between concentrations from the new global ice analysis system and from all available NIC manual ice charts for the entire northern hemisphere over 2010 (red). The same quantity is also shown for the difference between ice concentrations from the currently operational global ice analysis and the NIC manual ice charts (green).
Figure 9: Similar to the previous figure, except showing the ice concentration bias.
4. Summary and future work
This paper has provided a brief summary of recent work to improve the analysis component of a regional ice prediction system and also to develop a new global ice analysis system. Both new systems were shown to represent significant improvements over existing systems at Environment Canada.
Research is underway to further improve these systems. The assimilation of recently available higher resolution passive microwave data from the AMSR2 instrument will soon be added to both systems and should improve ice concentration estimates, especially near land and in narrow channels and bays. Research on how to incorporate even higher resolution information by assimilating data from visible/infra-red sensors (e.g. AVHRR) and synthetic aperture radar sensors (e.g. RADARSAT-2) is

BUEHNER, M.: SEA ICE DATA ASSIMILATION
10 ECMWF-WWRP/THORPEX Workshop on polar prediction, 24 - 27 June 2013
also well advanced. Work has begun to include a sea-ice model within the data assimilation cycle for providing a more accurate background state than simply persisting the previous analysis. The use of a sea ice model in the assimilation cycle will facilitate the inclusion of ice thickness as an additional analysis variable and therefore research on the assimilation of thickness data will be pursued.
5. References
Buehner, M., A. Caya, L. Pogson, T. Carrieres and P. Pestieau, 2013: “A New Environment Canada Regional Ice Analysis System.” Atmosphere-Ocean, 51, 18–34.
Carrieres, T.; B. Greenan, S. Prinsenberg and I.K. Peterson, 1996: “Comparison of Canadian ice charts with surface observations off Newfoundland, winter 1992.” Atmosphere-Ocean, 34, 207–236.
Helfrich S. R., D. McNamara, B. H. Ramsay, T. Baldwin and T. Kasheta, 2007: “Enhancements to, and forthcoming developments in the Interactive Multisensor Snow and Ice Mapping System (IMS).” Hydrol. Process., 21, 1576–1586.
Markus, T., and D. J. Cavalieri, 2000: “An enhancement of the NASA team sea ice algorithm.” IEEE Trans. Geos. Rem. Sensing, 38, 1387–1398.
Pellerin, P., H. Ritchie, F. J. Saucier, F. Roy, S. Desjardins, M. Valin, and V. Lee, 2004: “Impact of a Two-Way Coupling between an Atmospheric and an Ocean-Ice Model over the Gulf of St. Lawrence.” Mon. Wea. Rev., 132, 1379–1398.