overview of ontario marginalization index (onmarg) … (bmi ≥ 25 kg/m2) self rated health...
TRANSCRIPT

Overview of the Ontario
Marginalization Index (ON-Marg) July 6th, 2012
1

What you can expect…
▫ Answers to the following:
▫ What is ON-Marg?
▫ Why was ON-Marg developed?
▫ What makes up ON-Marg?
▫ How is it currently being used?
▫ How else can it be used?
▫ Where to find ON-Marg?
2

Origin of Deprivation Indices
• Deprivation indices have been used for decades in the UK and elsewhere – Carstairs, Townsend indices
• In Canada, we have seen adoption of INSPQ deprivation index (Pampalon)
• Other deprivation indices in Canada – SERI (Manitoba), VANDI
• NZDep developed in New Zealand to provide a national standard
▫ Results across studies can be compared on the same scale
• In Canada today, marginalization more appropriate (and broader) than deprivation
3
Area-Based Measures
• Usually based on aggregated personal information (e.g. from the census)
• Assumed to be capturing group characteristics that are more than the sum of individual characteristics
4

Area as an Individual-Level Proxy
• Some research uses area-based measures as a proxy for individual-level data when none is otherwise available
• Not everyone living in a marginalized area is marginalized – ecological fallacy
• NZDep - Acknowledging not all deprived people live in deprived areas, it was found that only 25-30% of the poor, those with no formal education and those belonging to the lowest occupational class lived in the most deprived quintiles
5
Purpose of ON-Marg
• To show differences in marginalization between areas
• To understand inequities in various measures of health and social well-being, either between population groups or between geographical areas
6

Creating ON-Marg
7
• Census-based, geographically derived index
• Developed originally as CAN-Marg in 2001 with census tracts (urban areas)
• 42 census measures used in principal components factor analysis
• Measures with low factor loadings were removed on an iterative basis
• Four factors emerged with 18 CT measures.

Dimensions of ON-Marg
8
42 Census Variables
Factor analysis
18 variables
Residential Instability
Material Deprivation
Ethnic Concentration
Dependency
Validation
• We repeated factor analysis using the same 18 census measures for dissemination areas (DAs) (2001 & 2006) and 2006 CTs
• Found to be empirically and theoretically stable across time and area, including rural areas
• Proved to be reliable across:
▫ Census years (2001 and 2006)
▫ Census geographies (CTs and DAs)
9

Dimensions and Census Indicators
10
Residential Instability Material Deprivation Dependency
Ethnic
Concentration^ Proportion of the population
living alone
Proportion of the population
who are non -youth (16+)*
Crowding - average number
of persons per dwelling*
Proportion of dwellings that
are apartment buildings
Proportion of the population
that is single/ divorced/
widowed*
Proportion of dwellings that
are not owned*
Proportion of the population
who moved within the past 5
years
Proportion of the population
aged 20+ without a high-
school diploma **
Proportion of families who
are single parent families
Proportion of the population
receiving government transfer
payments
Proportion of the population
15+ who are unemployed
Proportion of households that
are low-income**
Proportion of households
living in dwellings that are in
need of major repair
Proportion of the
population who are
aged 65 and older
Dependency ratio
(total population 0-14
and 65+/total
population 15-64)
Proportion of the
population not
participating in labour
force (15+)
Proportion of the
population who are
recent immigrants (5yr)
Proportion of the
population who self-
identified as visible
minority

Using ON-Marg
• Each dimension represents a separate index with a standardized factor score for each area
▫ E.g. the material deprivation index ranges from a score of -2 (low deprivation) to +6 (high deprivation)
• Each dimension/index is also available in quintiles
▫ Q1 represents least deprived and Q5 the most deprived
11

Using ON-Marg
• Factor scores and quintile values are provided for every CT and DA in Ontario
12
instability_q_
CT06
deprivation_q_
CT06
dependency_q_C
T06
Ethniccon_q_
CT06
instability_C
T06
deprivation_
CT06
ethniccon_CT
06
dependency_
CT06
4 5 5 4 0.423422705 2.232990549 1.579814359 0.112671704
4 2 2 5 0.110892514 -0.539482787 -0.785339194 1.585061652
1 3 4 1 -0.908261873 -0.405595467 0.328543469 -0.954919773
3 3 4 1 -0.442368856 -0.002279728 0.167787271 -0.881859276
2 3 4 1 -0.837361813 -0.265881512 0.287255487 -0.81291657
1 2 4 2 -1.086845078 -0.508196924 0.349883641 -0.716724807
Quintiles Factor scores

Higher Order Geographic Levels
• ON-Marg is available for public health units, sub-LHINs, LHINs, census divisions, census sub-divisions, and consolidated municipal service manager areas.
• Weighted population factor scores can be used to create custom scores for other areas.
13
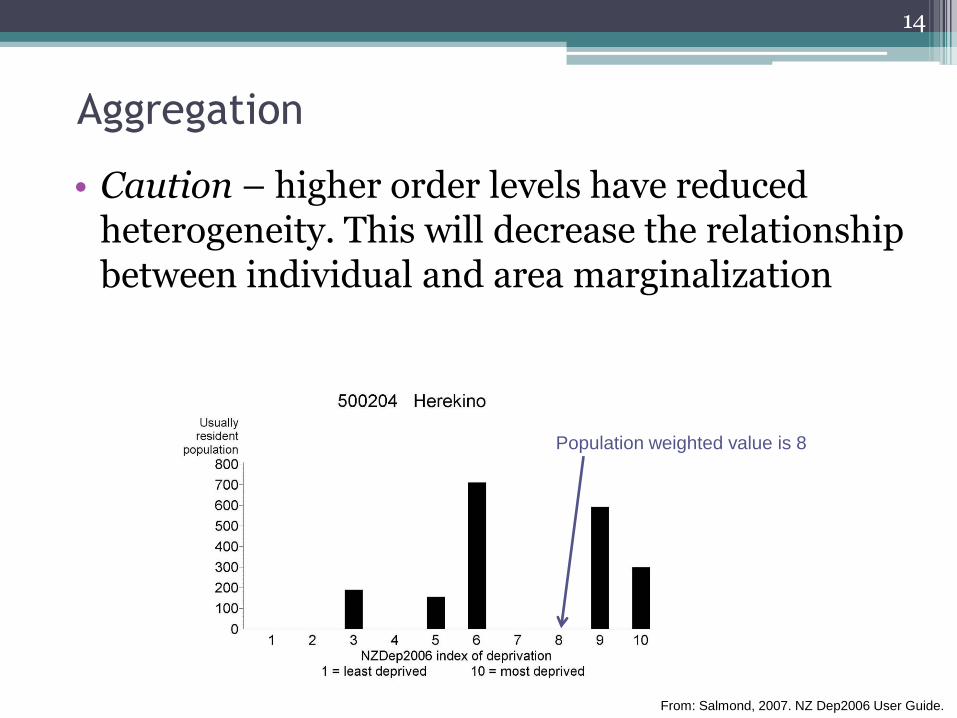
Aggregation
• Caution – higher order levels have reduced heterogeneity. This will decrease the relationship between individual and area marginalization
14
From: Salmond, 2007. NZ Dep2006 User Guide.
Population weighted value is 8

ON-Marg Uses To Date
• So far the index has largely been used in an academic environment
• CAN-Marg (precursor to ON-Marg) has been shown to be associated many health outcomes including hypertension, depression, body mass index and infant birth weight as published in a series of peer-reviewed journal articles
15

Health Indicators and Marginalization
16
Current smoker Asthma
Binge drinking (>5 drinks, ≥ once/month)
COPD (age 30+), Emphysema (age 30+), Chronic Bronchitis
Flu shot in past year Self-reported health/perceptions
Overweight (BMI ≥ 25 kg/m2) Self rated health (poor/fair)
Inactive Self rated mental health (poor/fair)
Diabetes Self-perceived stress (quite a bit/extremely)
Hypertension Mood disorder/Anxiety
Heart Disease Disability/Activity limitation (sometimes/often)

CAN-Marg and Hypertension
17
Female Male
(Matheson and White, 2009)

ON-Marg and Food Access
18
Percentage of neighbourhoods with at least 1 supermarket
within a 10-min walk in Hamilton and Toronto by level of
neighbourhood deprivation (2006/07)
5.0%5.8%
9.9%
11.6%10.7%
13.7%12.7%
11.0%
14.2%
10.3%
Q1-least
deprived
Q2 Q3 Q4 Q5-most
deprived
Q1-least
deprived
Q2 Q3 Q4 Q5-most
deprived
Deprivation Quintile
Hamilton Toronto
(Polsky, 2011)

Deprivation in Toronto (CTs)
19 19
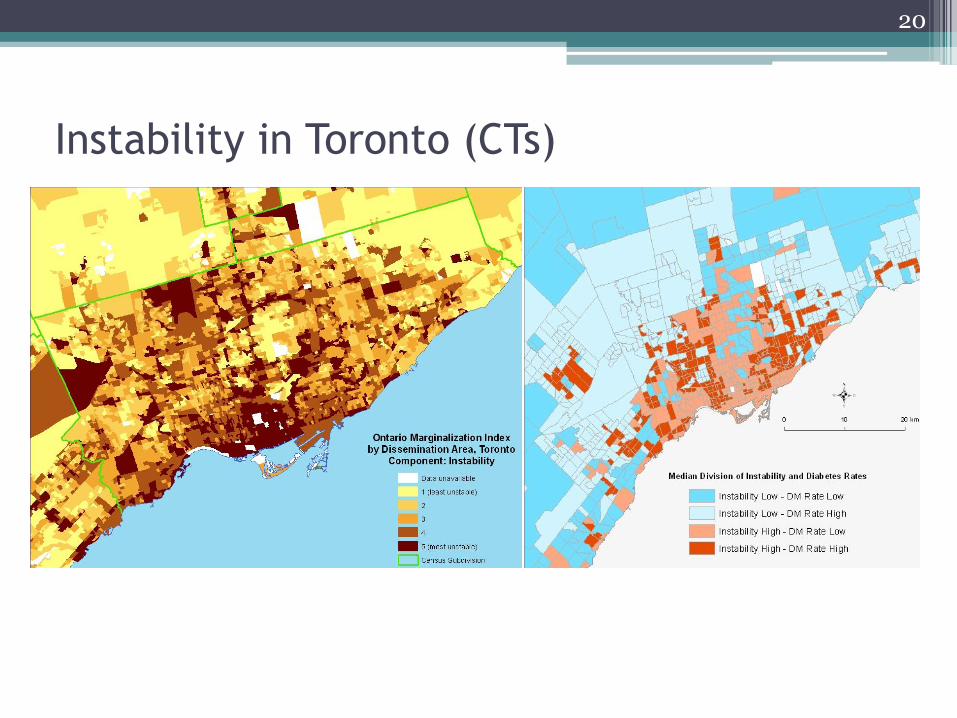
Instability in Toronto (CTs)
20

Dependency in Toronto (Neighbourhoods)
21
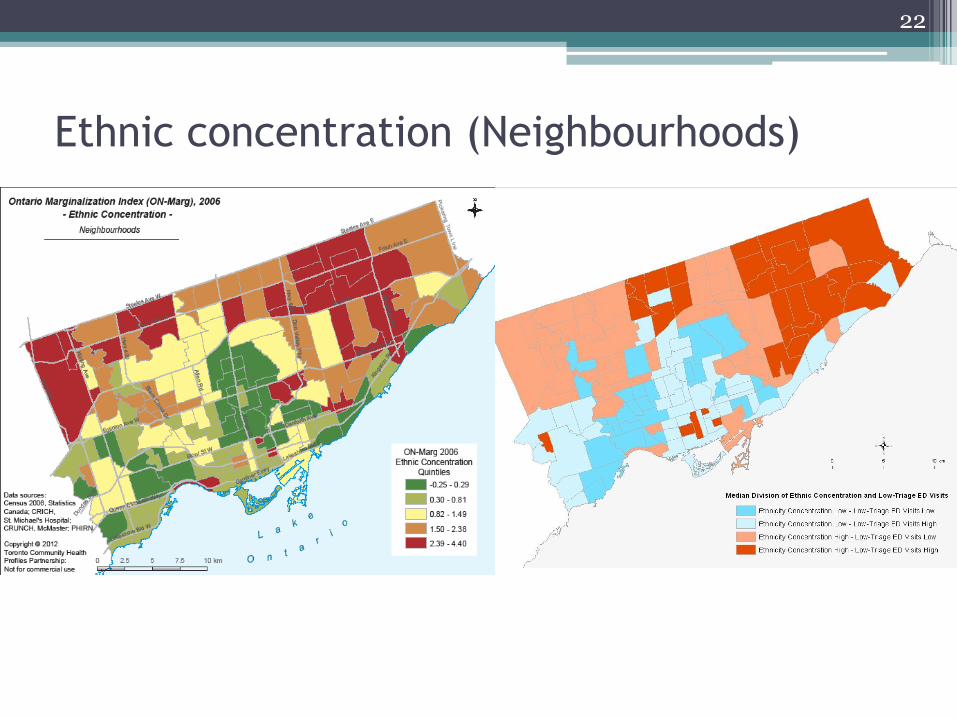
Ethnic concentration (Neighbourhoods)
22

Potential Uses of the ONMarg
1. Planning and needs assessment
2. Monitoring inequities
3. Resource allocation
4. Advocacy
5. Research
• The benefit to ON-Marg is that it allows comparability across studies in Ontario
23

Strengths & Considerations
Strengths:
• Simple to use.
• Easily understood by non-technical audiences.
• Accounts for multiple dimensions of marginalization.
• Generally aligns with current evidence related to marginalization relationships.
Considerations:
• Must apply appropriate dimension of interest and carefully consider combining dimensions.
24

Potential Error
• ON-Marg is recommended as an area measure, but in certain situations it could be used as proxy for individual marginalization
▫ Smallest level of geography (i.e. DA) should be used to minimize error
▫ Measurement error must be acknowledged when presenting results
• NZDep only found a weak correlation between individual and area level deprivation at the smallest level of geography
25

CAN-Marg & ON-Marg USERS
26
St. Michael’s Hospital
• Research focus (Canadian & Ontario) – injury, low birth weight, hypertension, pedestrian and cycling collisions, immigrant health.
Region of Peel Health Services
• Early Childhood Development Indicators, Smoking, Emergency Room Visits.
Institute of Health Policy, Management and Evaluation, University of Toronto
• Injury
Institute for Clinical Evaluative Sciences
• Child health
Child Health Evaluative Sciences, SickKids Hospital
• Child obesity
Ministry of Child and Youth Services
• Early Childhood Development Indicators
Collaborations
CIHI initiatives for CAN-Marg
• Link to website
• CPHA Panel – June 11 2012
• Validation paper CJPH - pending
Public Health Ontario (PHO) initiatives for ON-Marg (June 2012)
• Link to Health Equity Impact Assessment (HEIA)
• Link to Ontario Health Program Planner at PHO
• Link to Association of Public Health Epidemiologists of Ontario (APHEO )for launch
• Webinar July 13 2012
27

Where to get ON-Marg
• Available in excel format
• ON-Marg, as well as a comprehensive User Guide are available here:
http://www.crunch.mcmaster.ca/ontario-marginalization-index
28

CAN-Marg Peer Reviewed Articles 1 Matheson, F. I., Moineddin, R., Dunn, J. R., Creatore, M. I., Gozdyra, P., & Glazier, R. H. (2006).
Urban neighborhoods, chronic stress, gender and depression. Social Science & Medicine, 63, 2604-2616.
2 Matheson, F. I., Moineddin, R., & Glazier, R. H. (2008). The weight of place: A multilevel analysis of gender, neighborhood material deprivation, and body mass index among Canadian adults. Social Science & Medicine, 66, 675-690.
3 Matheson, F. I., White, H. L., Moineddin, R., Dunn, J. R., & Glazier, R. H. (2010). Neighbourhood chronic stress and gender inequalities in hypertension among Canadian adults: a multilevel analysis. Journal of Epidemiology and Community Health, 64, 705-713.
4 Urquia, M. L., Frank, J. W., Glazier, R. H., Moineddin, R., Matheson, F. I., & Gagnon, A. J. (2009). Neighborhood context and infant birthweight among recent immigrant mothers: a multilevel analysis. American Journal of Public Health, 99, 285-293.
5 Lee, P. P. S. (2010). Injury and Neighborhood Marginalization: Does it Matter Where You Live? MSc University of Toronto, Toronto.
6 Matheson, F. I., LaFreniere, M. C., White, H. L., Moineddin, R., Dunn, J. R., & Glazier, R. H. Influence of neighborhood deprivation, gender and ethno-racial origin on smoking behavior of Canadian youth. Preventive Medicine, In Press, Corrected Proof.
7 Matheson, F. I., White, H. L., Moineddin, R., Dunn, J. R., & Glazier, R. H. (2011). Drinking in context: the influence of gender and neighbourhood deprivation on alcohol consumption. Journal of Epidemiology and Community Health.
8 Matheson, F.I., Dunn, J.R., Smith, K.L., Moineddin, R., Glazier, R.H. (2012) Development of the Canadian Marginalization Index: a new tool for the study of inequality. Canadian Journal of Public Health. In Press.
29
CONTACTS Jim Dunn
Flora Matheson
Katherine Smith
30
St. Michael’s Hospital Centre for Research on Inner City Health (CRICH)
[email protected] [email protected]
McMaster University Chair in Research on Urban Neighbourhoods,
Community Health and Housing (CRUNCH)