overview of mm in asia - comtecgroup · overview of mm in asia ... (list) research supports janssen...
TRANSCRIPT

www.comtecmed.com/comy | [email protected]
Weerasak Nawarawong
Overview of MM in Asia
Disclosure of Conflict of Interest (List)
Research supports Janssen Pharmaceutical Company
Receipt of honoraria Bristol-Myer Squibb
Department of Medicine, Faculty of Medicine,
Chiang Mai University, Chiang Mai, Thailand.

www.comtecmed.com/comy | [email protected]
Outlines • Clinical Profiles of MM in Asia
• Thrombosis in Asian Myeloma Patients Treated with Thalidomide
• Hepatitis B virus infection in Asian Myeloma Patients
• Pulmonary Complications in Myeloma Patients Treated with Bortezomib

www.comtecmed.com/comy | [email protected]
Clinical profiles of multiple myeloma in Asia: An Asian Myeloma Network(AMN) Study
[under the auspice of International Myeloma foundation(IMF)]
• The collection of data of 3,405 multiple myeloma patients from 7 countries which are member of AMN: China,
Hong Kong, Japan, Korea, Singapore, Taiwan, and Thailand.
• Each country contribute around 500 myeloma patients diagnosed between 1986 to 2011.
• The clinical and laboratory data are retrospectively analyzed.

www.comtecmed.com/comy | [email protected]
Clinical characteristics (n=3405) Total China HK Japan Korea Singapore Taiwan Thailand
No of center 23 3 1 3 3 2 1 10
No of patients 3405 798 109 601 587 493 414 403
% 100.0 23.4 3.2 17.7 17.2 14.5 12.2 11.8
Age
median 62 59 65 66 61 62 63 59
range 19-106 23-106 35-93 29-90 23-93 25-93 24-90 19-95
< 65 58.5% 68.4% 48.6% 42.1% 63.7% 55.6% 53.1% 67.5%
≥ 65 41.5% 31.6% 51.4% 57.9% 36.3% 44.4% 46.9% 32.5%
Gender Female 44.4% 38.6% 32.1% 49.4% 46.7% 48.7% 35.0% 53.1%
Male 55.6% 61.4% 67.9% 50.6% 53.3% 51.3% 65.0% 46.9%
Type
N 3129 736 99 594 587 481 406 226
IgG 55.2% 50.4% 48.5% 58.8% 48.6% 63.4% 50.2% 65.5%
IgA 22.0% 23.2% 18.2% 19.7% 24.2% 20.8% 23.9% 19.5%
IgD 3.1% 6.0% 7.1% 3.4% 1.5% 1.0% 3.2% 0.0%
LCD 17.9% 17.8% 23.2% 17.3% 20.6% 13.3% 20.9% 15%
Non-secretory 1.9% 2.3% 0.0% 0.7% 4.3% 1.2% 1.5% 0.0%
Hemoglobin
N 3271 759 104 572 587 470 377 402
≥10.0 g/dl 39.3% 37.4% 44.2% 46.2% 41.9% 40.2% 37.4% 29.1%
<10.0 g/dl 60.7% 62.6% 55.8% 53.8% 58.1% 59.8% 62.6% 70.9%
Platelets
3157 734 15 574 587 468 376 403
<70 X 109/l 8.8% 10.1% 6.7% 12.9% 5.6% 5.3% 10.1% 7.9%
≥70 X 109/l 91.2% 89.9% 93.3% 87.1% 94.4% 94.7% 89.9% 92.1%
Bone lesion
N 2661 201 88 570 581 404 414 403
yes 60.2% 74.6% 73.9% 80.0% 67.3% 46.3% 57.2% 28.5%
no 39.8% 25.4% 26.1% 20.0% 32.7% 53.7% 42.8% 71.5%
Extramedullary plasmacytoma
N 3093 797 99 580 585 353 414 265
presence 15.4% 15.6% 20.2% 5.2% 23.9% 14.2% 12.6% 22.6%
absence 84.6% 84.4% 79.8% 94.8% 76.1% 85.8% 87.4% 77.4%
Kim K, Lee JH et al. Am J Hematol, 2014

www.comtecmed.com/comy | [email protected]
Total China Hong Kong Japan Korea Singapore Taiwan Thailand
No of patients 3405 798 109 601 587 493 414 403
Serum creatinine
3173 709 71 571 587 462 373 400
<2.0 mg/dl 76.6% 76.0% 80.3% 83.9% 82.8% 75.1% 69.2% 66.5%
≥2.0 mg/dl 23.4% 24.0% 19.7% 16.1% 17.2% 24.9% 30.8% 33.5%
Serum albumin
3030 686 93 588 587 454 235 387
<3.5 g/dl 52.0% 51.6% 52.7% 40.6% 52.0% 63.9% 39.6% 63.3%
≥3.5 g/dl 48.0% 48.4% 47.3% 59.4% 48.0% 36.1% 60.4% 36.7%
Serum beta 2-
macroglobulin
2857 660 62 507 587 403 324 314
<3.5 mg/l 34.5% 29.1% 37.1% 41.6% 35.6% 39.7% 37.3% 22.6%
3.5–5.5 mg/l 23.4% 22.0% 35.5% 26.0% 25.9% 24.3% 18.8% 18.5%
>5.5 mg/l 42.1% 48.9% 27.4% 32.3% 38.5% 36.0% 43.8% 58.9%
ISS
2984 775 59 532 587 446 273 312
I 19.9% 16.5% 25.4% 30.8% 22.1% 15.5% 18.3% 12.2%
II 36.1% 32.8% 45.8% 36.8% 39.4% 44.4% 29.7% 28.5%
III 44.0% 50.7% 28.8% 32.3% 38.5% 40.1% 52.0% 59.3%
Serum calcium
3063 670 69 570 587 408 367 392
≥10.5 mg/dl 16.7% 13.1% 40.6% 13.5% 11.9% 13.5% 19.6% 31.1%
<10.5 mg/dl 83.3% 86.9% 59.4% 86.5% 88.1% 86.5% 80.4% 68.9%
Plasma cells of BM
N 3042 723 64 529 587 385 382 372
<30% 41.1% 51.6% 42.2% 55.6% 35.9% 36.4% 30.9% 23.1%
30–70% 40.5% 36.8% 35.9% 35.9% 45.3% 48.1% 41.9% 38.2%
>70% 18.4% 11.6% 21.9% 8.5% 18.7% 15.6% 27.2% 38.7%
Kim K, Lee JH et al. Am J Hematol, 2014

www.comtecmed.com/comy | [email protected]
Cytogenetic of the Patients
N(%) OS(months) P value
Conventional Cytogenetics
Total 1681 47
Abnormal 546 (32.5%) 34 <0.001
Normal 1135 (67.5%) 53
Cytogenetic Ploidy
Total 1660 47
Diploidy 1164 (70.1%) 53 <0.001
Hyperdiploidy 245 (14.8%) 37
Nonhyperdiploidy 251 (15.1%) 28
Cytogenetic 13q deletion
Total 1647 48 <0.001
Yes 201 (12.2%) 24
No 1446 (87.8) 52
t(11;14) (FISH)
Total 683 54 0.936
Yes 119 (17.4%) 47
No 564 (82.6%) 54
t(4;14) (FISH)
Total 637 53 0.02
Yes 67 (10.5%) 34
No 570 (89.5) 60
t(14;16) (FISH)
Total 498 66 0.365
Yes 22 (4.4%) NR
No 476 (95.6) 66
FISH 17p deletion
Total 854 51 0.061
Yes 114 (13.3%) 38
No 740 (87.7%) 54 Kim K, Lee JH et al. Am J Hematol, 2014
www.comtecmed.com/comy | [email protected]
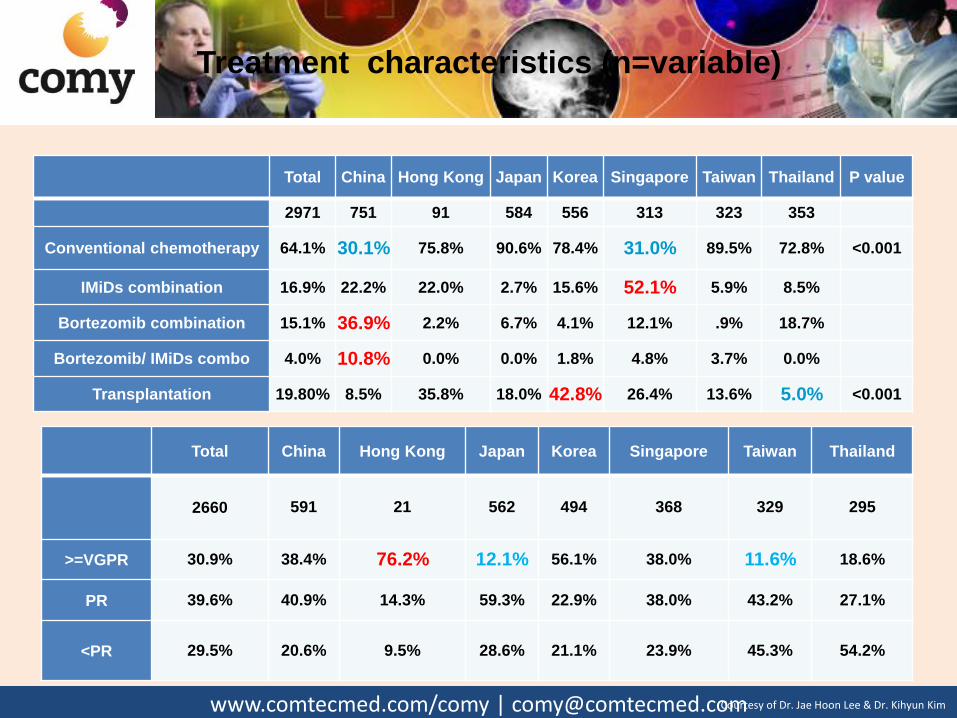
Total China Hong Kong Japan Korea Singapore Taiwan Thailand P value
2971 751 91 584 556 313 323 353
Conventional chemotherapy 64.1% 30.1% 75.8% 90.6% 78.4% 31.0% 89.5% 72.8% <0.001
IMiDs combination 16.9% 22.2% 22.0% 2.7% 15.6% 52.1% 5.9% 8.5%
Bortezomib combination 15.1% 36.9% 2.2% 6.7% 4.1% 12.1% .9% 18.7%
Bortezomib/ IMiDs combo 4.0% 10.8% 0.0% 0.0% 1.8% 4.8% 3.7% 0.0%
Transplantation 19.80% 8.5% 35.8% 18.0% 42.8% 26.4% 13.6% 5.0% <0.001
Total China Hong Kong Japan Korea Singapore Taiwan Thailand
2660 591 21 562 494 368 329 295
>=VGPR 30.9% 38.4% 76.2% 12.1% 56.1% 38.0% 11.6% 18.6%
PR 39.6% 40.9% 14.3% 59.3% 22.9% 38.0% 43.2% 27.1%
<PR 29.5% 20.6% 9.5% 28.6% 21.1% 23.9% 45.3% 54.2%
Treatment characteristics (n=variable)
Courtesy of Dr. Jae Hoon Lee & Dr. Kihyun Kim

www.comtecmed.com/comy | [email protected]
Overall Survival
OS of 3405 Asian myeloma patients OS according to the year of diagnosis
Median OS 47 months
[1986–2001 (n=486) vs. 2002–2011 (n=2,919) 35 vs. 49 months, P < 0.001
Kim K, Lee JH et al. Am J Hematol, 2014

www.comtecmed.com/comy | [email protected]
Treatment and Prognostic Significance
N OS (months) P value
ASCT (N=3,371) Yes 666 (19.8%) 79 <0.001
No 2705 (80.2%) 41
First-line treatment (N=2,970) New drugs 1067 (35.9%) 49 0.098
• IMiDs-based 502 (16.9%) 49 0.286
• Bortezomib-based 447 (15.1%) 51
• Bortzomib and IMiDs 118 (4.0%) 53
Conventional 1903 (64.1%) 48
Response to first-line treatment (N=2,660) ≥ VGPR 821 (30.9%) 69 <0.001
• CR 450 (16.9%) 68 <0.001
• nCR 124 (4.7%) 64
• VGPR 247 (9.3%) 77
PR 1053 (39.6%) 50
< PR 786 (29.5%) 34
• MR 102 (3.8%) 42
• SD 481 (18.1%) 34
• PD 203 (7.6%) 22 Kim K, Lee JH et al. Am J Hematol, 2014

www.comtecmed.com/comy | [email protected]
P-435. Advanced presenting features and short survival among Thai patients with multiple myeloma
Weerasak Nawarawong1,Lalita Norasetthada1, Teeraya Puavili2, Ekapun Karoopongse3,
Panisinee Lawasut4 and, on behalf of the Thai Myeloma Working Group.
1 Division of Hematology, Department of Medicine, Maharaj Nakorn Chiangmai, Chiangmai, Thailand 2 Division of Hematology, Department of Medicine, Ramathibodi Hospital, Bangkok, Thailand 3 Division of Hematology, Department of Medicine, Siriraj Hospital, Bangkok, Thailand 4 Division of Hematology, Department of Medicine, King Chulalongkorn Memorial Hospital, Bangkok, Thailand
• From 2002 to 2007, 1,207 patients with newly diagnosed MM • The median event free survival (EFS) and overall survival (OS) were 8 months (95% CI: 6.9-9.0 ) and 18 months (95% CI: 15.7-20.2)

www.comtecmed.com/comy | [email protected]
Characteristics No. (% of available data)
Front-line therapy
Melphalan-Prednisolone
Vincristine-Adriamycin-Dexamethasone
Dexamethasone
Novel agent based regimens
551 (53.5%)
302 (29.3%)
106 (10.3%)
39 (3.9%)
Autologous stem cell transplantation 48 (4%)

www.comtecmed.com/comy | [email protected]
Thrombosis in Asian Myeloma Patients
Treated with Thalidomide
www.comtecmed.com/comy | [email protected]
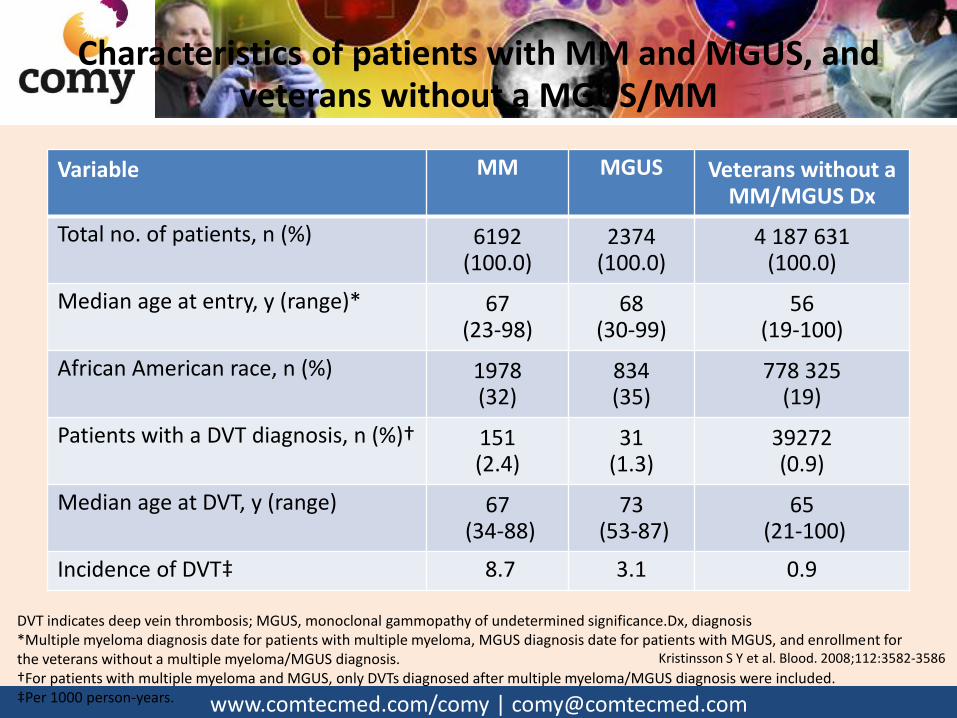
Characteristics of patients with MM and MGUS, and veterans without a MGUS/MM
Variable MM MGUS Veterans without a
MM/MGUS Dx
Total no. of patients, n (%) 6192 (100.0)
2374 (100.0)
4 187 631 (100.0)
Median age at entry, y (range)* 67 (23-98)
68 (30-99)
56 (19-100)
African American race, n (%) 1978 (32)
834 (35)
778 325 (19)
Patients with a DVT diagnosis, n (%)† 151 (2.4)
31 (1.3)
39272 (0.9)
Median age at DVT, y (range) 67 (34-88)
73 (53-87)
65 (21-100)
Incidence of DVT‡ 8.7 3.1 0.9
DVT indicates deep vein thrombosis; MGUS, monoclonal gammopathy of undetermined significance.Dx, diagnosis *Multiple myeloma diagnosis date for patients with multiple myeloma, MGUS diagnosis date for patients with MGUS, and enrollment for the veterans without a multiple myeloma/MGUS diagnosis. †For patients with multiple myeloma and MGUS, only DVTs diagnosed after multiple myeloma/MGUS diagnosis were included. ‡Per 1000 person-years.
Kristinsson S Y et al. Blood. 2008;112:3582-3586

www.comtecmed.com/comy | [email protected]
Incidence of VTE in Newly diagnosed MM trials without thromboprophylaxis
Treatment Number of patients
VTE (%)
Reference
Melphalan-prednisone 196 4 Facon et al 2007
126 2 Palumbo et al 2006
229 6 Hulin et al 2009
Dexamethasone 102 3 Rajkumar et al 2006
Thalidomide alone 28 4 Web er et al 2003
31 3 Rajkumar et al 2003
Thalidomide-dexamethasone 102 17 Rajkumar et al 2006
50 12 Rajkumar et al 2002
19 26 Cavo et al 2004
Melphalan-prednisone-thalidomide 125 12 Facon et al 2007
65 17 Palumbo et al 2006
229 6 Hulin et al 2009
Thalidomide-chemotherapy(alkylating agent) 54 11 Wu et al 2006
Thalidomide-chemotherapy(anthracycline) 39 10 Zervas et al 2004
162 34 Barlogie et al 2006 Kristinsson SY. Hematology(ASH education book) 2010;437

www.comtecmed.com/comy | [email protected]
Incidence of VTE in relapse/refractory MM trials without thromboprophylaxis
Treatment Number of patients
VTE (%)
Reference
Thalidomide alone 169 2 Barlogie et al 2001
66 5 Prince et al 2005
Thalidomide-dexamethasone 45 7 Osman et al 2001
120 2 Palumbo et al 2004
Melphalan-prednisone-thalidomide 50 11 Offidani et al 2004
Thalidomide-chemotherapy(±anthracycline) 19 58 Baz et al 2005
192(ND/R) 16 Zangari et al 2002
Kristinsson SY. Hematology(ASH education book) 2010;437
VTE, venous thromboembolism;ND, newly diagnosis; R, relapse

www.comtecmed.com/comy | [email protected]
• Between 2003 and 2007, 360 MM patients received thalidomide. • 155 for initial therapy, 157 for progressive disease, 48 for relapsed disease. • 140 patients received TE prophylaxis.[ 135 aspirin (100-300 mg), 3 warfarin 2 LMWH] • 9 patients with a previous history of TE received aspirin as their TE prophylaxis.

www.comtecmed.com/comy | [email protected]
Thromboembolic events(TE)
• 12 were venous thromboembolism, and 2 were arterial. • The overall incidence of TE was 3.9%. • The site of the venous TE
– lungs (7 patients) – lower extremities (4 patients) – upper extremities (1 patient) – neck (1 patient).
• One patient had both pulmonary and lower extremity TE • Arterial embolisms developed in the cerebral and peripheral
arteries. • The thalidomide treatment to the development of TE(TTDT) of 14
patients with TE ranged from 0 to 51.3 months, and median value was 5.1 months
Koh Y et al. Ann Hematol. 2010;89:201


www.comtecmed.com/comy | [email protected]
• Between 2004 and 2010, 66 MM patients National Cheng Kung University Hospital (NCKUH)had been treated with thalidomide
• 30 pts used thalidomide-based regimens for frontline therapy:
– thalidomide alone (T alone) (n=1)
– thalidomide and dexamethasone (TD) (n=13)
– thalidomide, melphalan, and prednisolone (MPT) (n=16).
• 36 pts used thalidomide-based regimens for relapsed/refractory MM:
– Thalidomide alone (n=15)
– Thalidomid-Dexamethasone (n=10)
– Melphalan-Prednisolone-Thalidomide (n =9)
– Thalidomide and interferon-alpha (n=2).
• Thromboprophylaxis was given in only 4 patients(6.1 %) Wu SY et al. Ann Hematol. 2012;91:1773
www.comtecmed.com/comy | [email protected]
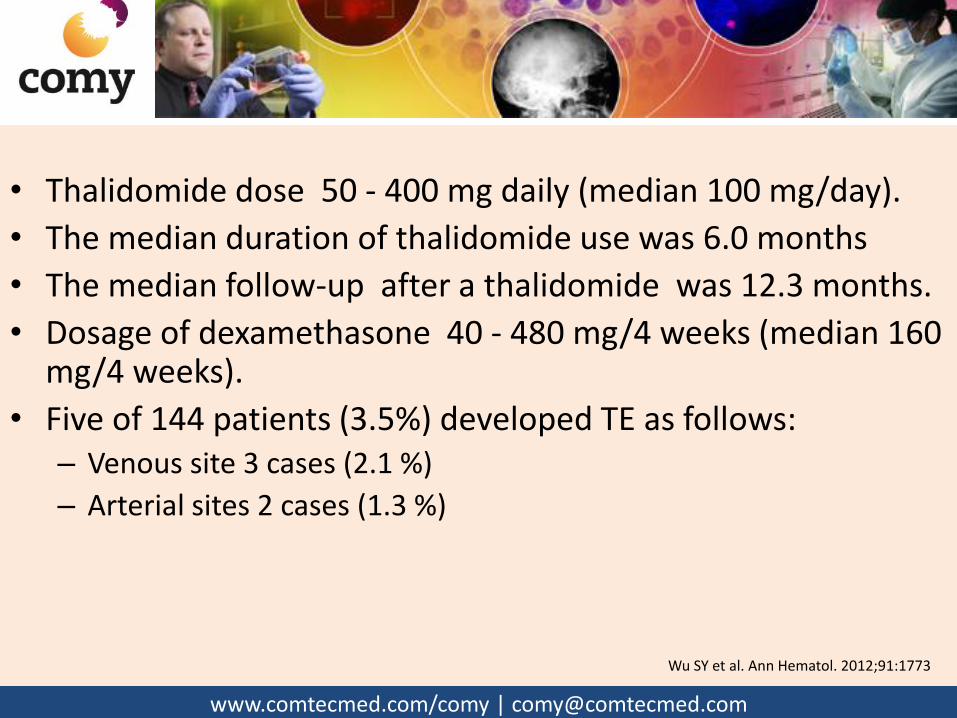
• Thalidomide dose 50 - 400 mg daily (median 100 mg/day).
• The median duration of thalidomide use was 6.0 months
• The median follow-up after a thalidomide was 12.3 months.
• Dosage of dexamethasone 40 - 480 mg/4 weeks (median 160 mg/4 weeks).
• Five of 144 patients (3.5%) developed TE as follows: – Venous site 3 cases (2.1 %)
– Arterial sites 2 cases (1.3 %)
Wu SY et al. Ann Hematol. 2012;91:1773

www.comtecmed.com/comy | [email protected]

www.comtecmed.com/comy | [email protected]
Summary of Asian Trials on MM treated by Thal. with Dex. or Thal. Alone
First author Ref
Disease status Thal. starting dose (mg)
Thal. target dose (mg)
Dex dose (mg)
VTE incidence (%)
No.
Grover, 2002 [1] RRMM 200 800 0 23
Okikawa, 2003 [2] RRMM 200 400 14.30 14
Huang, 2003 [3] RRMM 100 800 0 50
Huang, 2003 [3] RRMM 100 800 60 4 25
Kinoshita, 2005 [4] RRMM 200 800 320 0 17
Kamikawa, 2006 [5] RRMM 100 200 0 8
Murakami, 2007 [6] RRMM 100 200 112 4.55 66
Chiou, 2007 [7] RRMM 200 800 0 12
Sharma, 2007 [8] RRMM 200 600–800 8.30 12
Yuan, 2007 [9] NDMM 100 200–300 240–480 2.60 39
Hattori, 2008 [10] RRMM 200 400 160 0 30
Hattori, 2008 [10] RRMM 200
400 0 61
Murakami, 2009 [11] RRMM 100 400 0 37
Abbreviation: Thal, thalidomide; Dex, dexamethasone; VTE, venous thromboembolism; NDMM, newly diagnosed multiple myeloma; RRMM, relapsed refractory multiple myeloma
1. Grover JK, et al. Ann Oncol. 2002;13:1636 2. Okikawa Y, et al. Rinsho Ketsueki. 2003;44:368 3. Huang S-Y et al. Ann Hematol. 2003;82:558 4. Kinoshita T, et al. Ann Oncol. 2005;16:V206(abstr no. 579) 5. Kamikawa R, et al. Biol Pharmaceut Bull. 2006;29:2331 6. Murakami H, et al. Eur J Haematol. 2007;79:234 7. Chiou T-J, et al. Cancer Invest. 2007;25:140 8. Sharma A, et al. Indian J Cancer. 2007;44:108 9. Yuan Z-G, et al. Chinese J Cancer. 2007;26:1369 10. Hattori Y, et al. Cancer Sci. 2008;99:1243 11. Murakami H, et al. Int J Hematol. 2009;89:636 Shyu VB-H , et al. Asia-Pac J of Oncol & Hematol 2010;2:41
www.comtecmed.com/comy | [email protected]
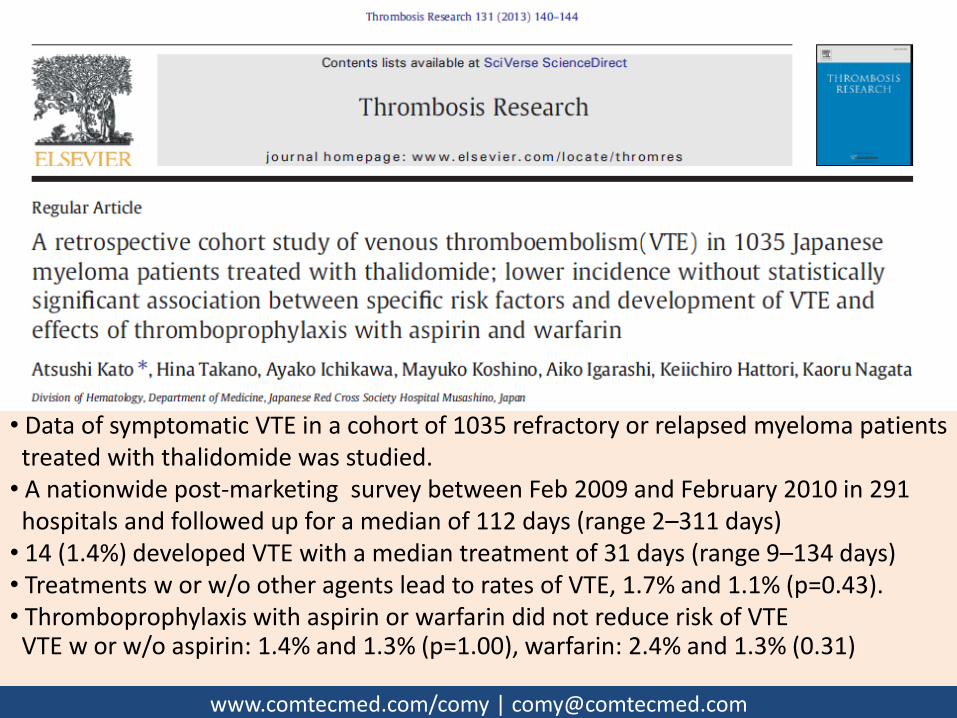
• Data of symptomatic VTE in a cohort of 1035 refractory or relapsed myeloma patients treated with thalidomide was studied. • A nationwide post-marketing survey between Feb 2009 and February 2010 in 291 hospitals and followed up for a median of 112 days (range 2–311 days) • 14 (1.4%) developed VTE with a median treatment of 31 days (range 9–134 days) • Treatments w or w/o other agents lead to rates of VTE, 1.7% and 1.1% (p=0.43). • Thromboprophylaxis with aspirin or warfarin did not reduce risk of VTE VTE w or w/o aspirin: 1.4% and 1.3% (p=1.00), warfarin: 2.4% and 1.3% (0.31)


www.comtecmed.com/comy | [email protected]
Prevalence of chronic hepatitis B virus infection among adults
http://wwwnc.cdc.gov/travel/yellowbook/2014/chapter-3-infectious-diseases-related-to-travel/hepatitis-b

www.comtecmed.com/comy | [email protected]
A retrospective case-control trial of 299 patients with MM and 299 patients with acute leukemia (AL) diagnosed at the First Affiliated Hospital of Sun Yat-sen University in Guangzhou, China from Jan 1996 to Sep 2008 and were followed up to May 2010.

www.comtecmed.com/comy | [email protected]
Prevalence of hepatitis B and C virus infection in MM and AL groups.
MM group (cases) AL group (controls)
Factor No. % No. % P-value Adjusted OR
95% CI
Sex 1
Male 198 66.2 198 66.2
Female 101 33.8 101 33.8
Age 0.49
Range 24-91 20-87
Median 58 58
HBsAg+ 58 19.4 36 12 0.014 1.76 1.12-2.76
Anti-HCV 6 2 2 0.7 0.14
Huang B et al. Leuk Lymphoma. 2012;53:270

www.comtecmed.com/comy | [email protected]
Numbers of patients with MM diagnosed in each year who were HBsAg + and HBsAg -
Huang B et al. Leuk Lymphoma. 2012;53:270
www.comtecmed.com/comy | [email protected]
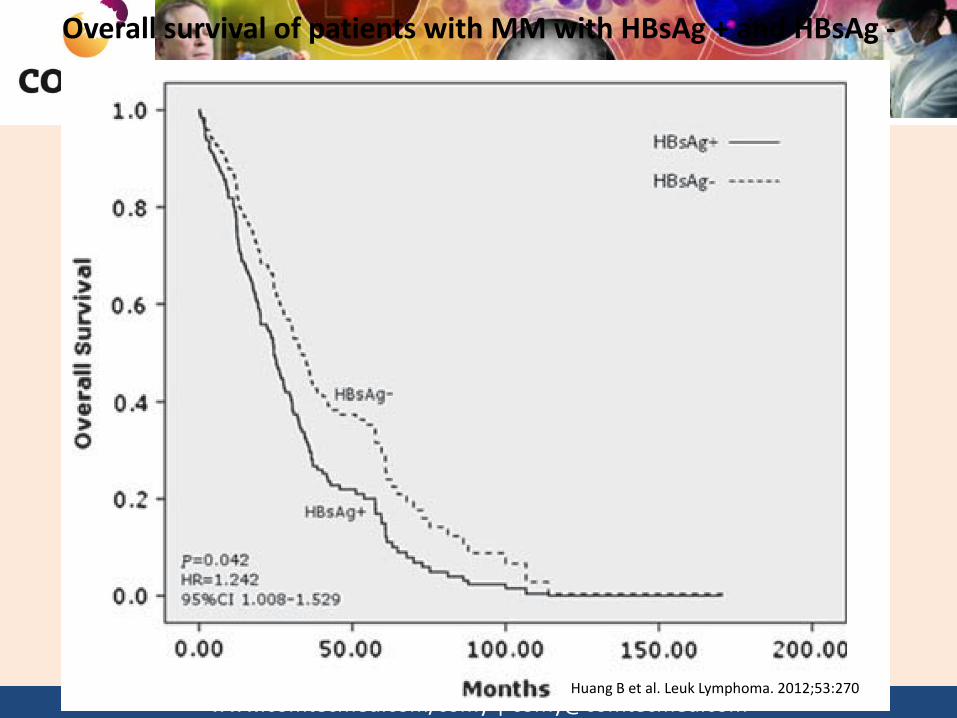
Overall survival of patients with MM with HBsAg + and HBsAg -
Huang B et al. Leuk Lymphoma. 2012;53:270

www.comtecmed.com/comy | [email protected]
Summary of studies (with ≥ 50 enrolled patients) exploring the prevalence of chronic hepatitis B virus
infection in multiple myeloma patients
Author Year No. Country No. of Pt. (%) of HBV carriers
% of HBV Among controls
2005Takai1 Japan 124 4(3.2) 1.2
2008 Anderson 2 U.S. 9,995 31(0.3) 0.2
2008 Okan 3 Japan 67 2(3.0) 4.9
2011 Franceschi 4 EU 238 6(2.5) 0.6
2011 Teng 5 Taiwan 155 17(11.0) 17.3
1. Takai S, et al. Eur J Haematol. 2005;74:158 2. Anderson LA, et al. Cancer Epidemiol Biomarkers Prev. 2008;17:3069 3. Okan V, et al. Int J Hematol. 2008;88:403
4. Franceschi S, et al. Cancer Epidemiol Biomarkers Prev. 2011;20:208 5. Teng C-J et al. Clinics (Sao Paulo). 2011;66:2055
www.comtecmed.com/comy | [email protected]

www.comtecmed.com/comy | [email protected]
Hepatitis B virus infection status is an independent risk factor for multiple myeloma patients after
autologous hematopoietic stem cell transplantation
• A retrospective analysis of HBV infections in 70 MM patients who received a sequential bortezomib-containing induction therapy and ASCT from Jun 2006 to Feb 2012
• Among the 70 patients – 11 (15.7 %) were HBsAg+ – 23 (33.3 %) were HBcAb+
• The median follow-up times for the HBsAg+ and the HBsAg- were 27.0 (7.6-85.2) months and 28.7 (7.1-111.0) months
• The 1-yr, 2-yr, and 3-yr OS rates of the HBsAg+ VS HBsAg-: – 90.9 vs 98.2%(1-year) – 80.8 vs 94%(2-year) – 34.6 vs 84.6 %(3-year)(p=0.008)
Li J, et al. Tumour Biol. 2013;34:1723-8

www.comtecmed.com/comy | [email protected]
Overall survival (OS) of patients with an HBsAg+ or HBsAg− status
Li J, et al. Tumour Biol. 2013;34:1723-8
p=0.008

www.comtecmed.com/comy | [email protected]
Hepatitis B Reactivation in Multiple Myeloma Beysel S, Yegın ZA, Yagci M.
Bortezomib-associated late hepatitis B reactivation in a case of multiple myeloma.
Turk J Gastroenterol. 2010;21(2):197-8.
Yoshida T, Kusumoto S, Inagaki A, Mori F, Ito A, Ri M, Ishida T, Komatsu H, Iida
S, Sugauchi F, Tanaka Y, Mizokami M, Ueda R.
Reactivation of hepatitis B virus in HBsAg-negative patients with multiple myeloma: two case reports. Int J Hematol. 2010;91(5):844-9
Mya DH, Han ST, Linn YC, Hwang WY, Goh YT, Tan DC.
Risk of hepatitis B reactivation and the role of novel agents and stem-cell transplantation in multiple myeloma patients with hepatitis B virus
(HBV) infection. Ann Oncol. 2012;23(2):421-6.
Goldberg R, Smith E, Bell S, Thompson A, Desmond PV.
Bortezomib monotherapy in patients with multiple myeloma is associated with reactivation of hepatitis B.
Intern Med J. 2013;43(7):835-6

www.comtecmed.com/comy | [email protected]
Phases of HBV reactivation
Hwang JP, Lok A S-F. Nat. Rev. Gastroenterol. Hepatol. 2014;11:209

www.comtecmed.com/comy | [email protected]
Types of HBV reactivation
Baseline HBV Status
Initiation of immunosuppressive
therapy
Reactivation
HBsAg+/anti-HBc+ HBV DNA+
HBsAg+/anti-HBc+ HBV DNA–
HBsAg–/anti-HBc+ HBV DNA–
Appearance of HBV DNA without HBsAg: HBV DNA– to HBV DNA+
Reverse seroconversion: HBsAg– to HBsAg+ (HBV DNA±)
Appearance of HBV DNA: HBV DNA– to HBV DNA+
Rise in HBV DNA level compared with baseline
Hwang JP, Lok A S-F. Nat. Rev. Gastroenterol. Hepatol. 2014;11:209

www.comtecmed.com/comy | [email protected]
Scre
en
all
pat
ien
ts b
efo
re
imm
un
osu
pp
ress
ive
ther
apy
Usual medical care
Prophylactic antiviral therapy‡
Prophylactic antiviral therapy‡
Monitoring§
Reactivation Pre-emptive
antiviral therapy∏
No reactivation
Usual medical care
Risk*
Results
Check HBV DNA levels
HBsAg+/anti-HBc+
HBsAg–/anti-HBc+
HBsAg–/anti-HBc–
High
Moderate
Low
A management algorithm for patients with HBV infection prior to starting immunosuppressive therapy
Algorithm based on scientific literature when available and opinions of the authors when literature lacked data. *Risk: stratify patients by risk of reactivation (see Table 2). ‡Prophylactic antiviral therapy: patients at high or moderate risk of reactivation (see Table 2) should start antiviral therapy and be assessed for virologic response through HBV DNA testing every 3 months. §Monitoring: check HBV DNA and ALT every 3 months; check HBsAg in patients who were HBsAg–/anti-HBc+ before immunosuppressive therapy. ∏Pre-emptive antiviral therapy: initiate antiviral therapy if ALT levels are elevated, HBV DNA levels are elevated, or appearance of HBV DNA or HBsAg in patients who had undetectable HBV DNA or HBsAg before immunosuppressive thereapy, respectively. Abbreviations: +, positive; –, negative; anti-HBc, anti-hepatitis B core antibody IgG; HBsAg, hepatitis B surface antigen.
Hwang JP, Lok A S-F. Nat. Rev. Gastroenterol. Hepatol. 2014;11:209

www.comtecmed.com/comy | [email protected]
Risk stratification for HBV reactivation Level of risk HBsAg+ HBsAg– and anti-HBc+* Antiviral therapy
High risk
• Chemotherapy • anti-CD20 and/or anti-CD52 agents • immunosuppressive therapy for transplantation (stem cell, solid organ) • steroids in combination with other immunosuppressive
• Chemotherapy for haematological malignancies • anti-CD20 and/or anti-CD52 agents
Prophylaxis
Moderate risk • Anti-TNF agents • maintenance low dose steroids alone‡ • other immunosuppressive therapy without steroids‡
• Chemotherapy for solid tumours‡ • immunosuppressive therapy for transplantation (stem cell, solid organ)‡ • steroids in combination with other immunosuppressive therapy‡
Prophylaxis or pre-emptive
Low risk Steroids alone for a few days‡ • Anti-TNF agent‡ • maintenance on low-dose steroids alone‡ • other immunosuppressive therapy without steroids‡
No prophylaxis
*Risk of HBV reactivation in HBsAg–/anti-HBc+ patients with detectable serum HBV DNA at baseline should be considered the same as HBsAg+ patients. ‡HBV reactivation has been reported in these settings, but there is limited data to classify risk. Abbreviations: +, positive; –, negative; anti-HBc, anti-hepatitis B core antibody IgG; HBsAg, hepatitis B surface antigen. Hwang JP, Lok A S-F. Nat. Rev. Gastroenterol. Hepatol. 2014;11:209

www.comtecmed.com/comy | [email protected]
Pulmonary Complications in Myeloma Patients Treated with Bortezomib

www.comtecmed.com/comy | [email protected]

www.comtecmed.com/comy | [email protected]
Previous reports of pulmonary complications after bortezomib treatment of multiple myeloma
Reference 1 2 3 4 5 6 7
Number 1 4 1 1 1 5 1(2 Episodes)
Gender Male Female(all) Male Male Male Male(3), Female(2) Male
Age 65 47,59,48,53 66 51 66 72,51,72,68,72 67
Type of Myeloma
IgM IgG, IgA, IgD,B-J protein - IgG - IgG(3), IgD(1) IgG
Previous lung disease
No No(2), Yes(2) No No Yes No(all) No
Status of disease
Not know Relapse (4) Relapse Relapse Refractory Relapse(3) Refractory (1) ND(1)
ND(1) Relapse(1)
Time/ dose after bortezomib
3 doses 7, 19, 10, 1 43 44 42 4,5,8,29,32 1) 4 doses 2) 4 doses
Respiratory symptoms
ARF Cough (1), Fever (1),
Dyspnea (4)
Cough, Dyspnea
Dyspnea
ARF Fever(4), Dyspnea(4), Breath lessness(2), Cough(1), ARF (1)
1) Hypoxia , Fever 2) ARF
Chest X-ray findings
Diffuse GGO
Pleural effusion (3), Pulmonary infiltrates (3) Pulmonary edema (1),
Pulmonary infiltrates
Pulmonary infiltrates
Pulmonary lesion, Pleural
effusion
Pulmonary edema(3), Pleural effusion(2),
Pulmonary infiltrates(2), GGO(1)
1)Bibasilar parenchymal disease.
2)Diffuse parenchymal lung disease with GGO
Response to steroids
Yes Yes(2) No(2) Yes Yes Yes No 1) Yes 2) No
Outcomes Alive Alive(2) Dead(2) Alive
Alive Alive Dead(all) 1) Alive 2) Dead
1. Ohri A, et al. Am J Ther 2006;13:553 2) Miyakoshi S, et al. Blood 2006;107:3492 3) Boyer JE, et al. Blood 2006;108:1113 4) Pitini V, et al. Leuk Res 2007;31:1023 5) Zappasodi P, et al. J Clin Oncol 2007;25:3380 6) Dun X, et al. Hematol Oncol 2010;28:49 7) Wirk B. J Clin Oncol 2012;30:e379
Abbreviations: ARF, acute respiratory failure; GGO, ground-glass opacities; ND, Newly diagnosed

www.comtecmed.com/comy | [email protected]

www.comtecmed.com/comy | [email protected]
Frequency of reported pulmonary events
All the patients (n = 1010)
Number of cases (% with 95% CI)
Number of deaths (% with 95% CI)
Mortality (% with 95% CI)
Reported pulmonary-related adverse events
160 (15.8%, 13.7–18.2)
17 (1.7%, 1.1–2.7)
17 ⁄ 160 (10.6%, 6.7–16.4)
Reported pulmonary-related adverse events other than bortezomib-induced lung disease (non-BILD)
115 (11.4%,8.3-12.0)
12 (1.2%,0.7-2.1)
12/115 (10.4%, 6.1-17.4)
Physician-reported bortezomib-induced lung disease (BILD)
45 (4.5%,3.3-5.9)
5 (0.5%,0.2-1.2)
5/45 (11.1%, 4.2-22.1)
Yoshizawa K, et al. Cancer Sci 2014;105:195–201

www.comtecmed.com/comy | [email protected]
Classification of bortezomib-induced lung disease (BILD) based on the radiological pattern determined by the Lung Injury
Medical Expert Panel BILD Radiologic patterns Outcomes
Recovered ⁄ improved
Recovered not confirmed
Death
Interstitial pneumonia (n = 18)
Diffuse alveolar damage type (DAD)1 (n = 3)
1 - 2
Hypersensitivity pneumonitis type (HP)2 (n = 8)
7 1 -
Non-DAD non-HP type3 (n = 7)
6 1 -
Vascular hyperpermeability (n = 3)
Capillary leak syndrome (CLS)-like4 (n = 3)
3 - -
Hypoxia without significant radiological findings5 (n = 4)
- 4 - -
Total: 25 patients 21 2 2
Yoshizawa K, et al. Cancer Sci 2014;105:195–201
1 Patchy or diffuse distribution of infiltration or ground-glass opacities accompanying structural distortion (e.g. contraction bronchiectasis) 2Faint and homogeneous ground-glass opacities with neither volume loss nor contraction bronchiectasis 3Presence of abnormal shadows different from Diffuse alveolar damage(DAD) or Hypersensivity Pneumonitis(HP) patterns 4Thickening of the interstitium or bronchial wall and narrowing of bronchial lumens with frequent pleural or cardiac effusion without evidence of concurrent heart failure 5Significant decrease in the saturation of oxygen without obvious radiological abnormalities
