overview of lmir trust - lippo malls indonesia retail...
TRANSCRIPT

1Q 2011 Results Presentation28 April 2011

DisclaimerCertain statements in this presentation concerning our future growth prospects are forward-looking
statements, which involve a number of risks and uncertainties that could cause actual results to differ
materially from those in such forward-looking statements. These forward-looking statements reflect our
current views with respect to future events and financial performance and are subject to certain risks and
uncertainties, which could cause actual results to differ materially from historical results or those
anticipated. The risks and uncertainties relating to these statements include, but are not limited to, risks
and uncertainties regarding fluctuations in earnings, our ability to manage growth, intense competition in
the Indonesian retail industry including those factors which may affect our ability to attract and retain
suitable tenants, our ability to manage our operations, reduced demand for retail spaces, our ability to
successfully complete and integrate potential acquisitions, liability for damages on our property portfolios,
the success of the retail malls and retail spaces we currently own, withdrawal of tax incentives, political
instability, and legal restrictions on raising capital or acquiring real property in Indonesia. In addition to
the foregoing factors, a description of certain other risks and uncertainties which could cause actual results
to differ materially can be found in the section captioned "Risk Factors" in our preliminary prospectus
lodged with the Monetary Authority of Singapore on 19 October 2007. Although we believe the
expectations reflected in such forward-looking statements are based upon reasonable assumptions, we can
give no assurance that our expectations will be attained. You are cautioned not to place undue reliance on
these forward-looking statements, which are based on the current view of management on future events.
We undertake no obligation to publicly update or revise any forward looking statements, whether as a
result of new information, future events or otherwise.
2

3
Overview of LMIR Trust

Overview of LMIR Trust
Portfolio of Indonesian Retail Assets
valued at S$1.082 billion1 including
8 retail malls and 7 retail spaces
Strategically located within large
population catchment areas : the
Retail Malls are located in Greater
Jakarta (5), Bandung (2), and Medan
(1)
Portfolio is well positioned in terms
of target segment and diversified
tenant base to benefit from
Indonesia’s flourishing economy
and favorable demographics
Low gearing provides funding
opportunities for future growth
Notes:
1 Adopted valuation from KJPP Rengganis as at 31 December 2010 in IDR, converted to SGD at the year end exchange rate 4
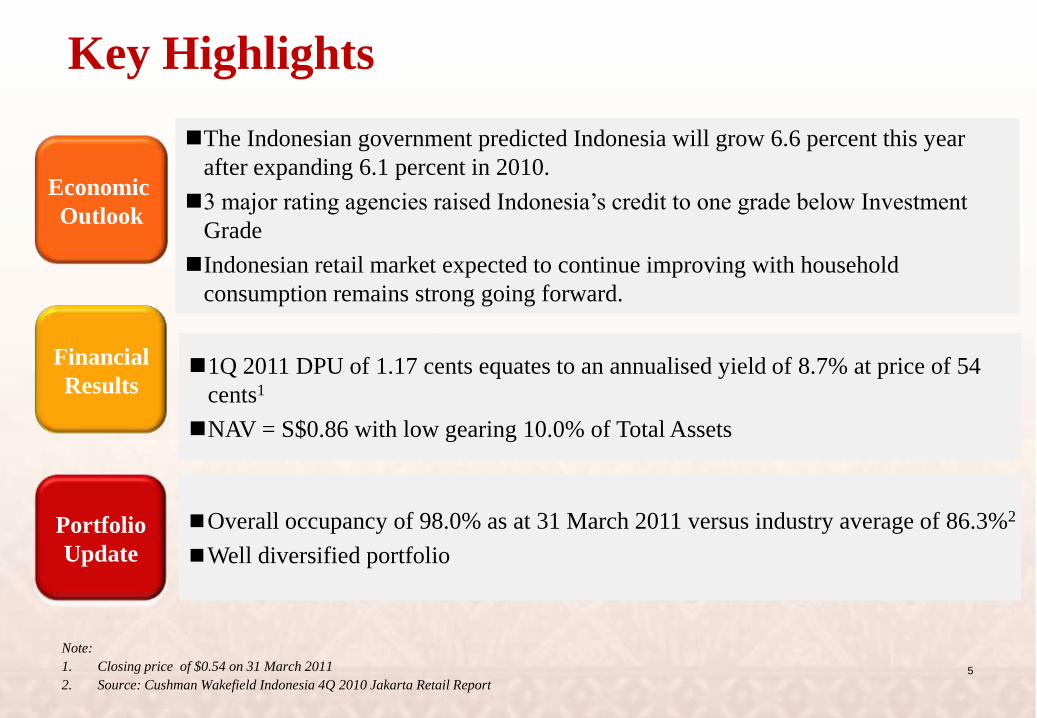
Key Highlights
Overall occupancy of 98.0% as at 31 March 2011 versus industry average of 86.3%2
Well diversified portfolio
Financial
Results
Portfolio
Update
1Q 2011 DPU of 1.17 cents equates to an annualised yield of 8.7% at price of 54
cents1
NAV = S$0.86 with low gearing 10.0% of Total Assets
Note:
1. Closing price of $0.54 on 31 March 2011
2. Source: Cushman Wakefield Indonesia 4Q 2010 Jakarta Retail Report
Economic
Outlook
The Indonesian government predicted Indonesia will grow 6.6 percent this year
after expanding 6.1 percent in 2010.
3 major rating agencies raised Indonesia’s credit to one grade below Investment
Grade
Indonesian retail market expected to continue improving with household
consumption remains strong going forward.
5
6
Financial Results

1Q 2011 Financial Results – P&L
Notes:
1. Based on 1.0803 billion units in issue as at 31 March 2011
2. Based on the closing price of $.0.54 as at 31 March 2011 7
Actual
1Q 2011
Actual
1Q 2010
Variance
(%)
Remarks
(S$'000) (S$'000)
Gross Revenue 32,772 23,280 40.8
Mainly due to:
(i) Inclusion of service charges & utilities recoveries
income from 7 retail malls since 2Q 2010
(ii) Average rate increase in renewed lease during the
year
Property Expenses (10,419) (2,935) NM
Mainly due to:
Cost relating to the operating of the retail malls since 2Q
2010
Net Property income 22,353 20,345 9.9The higher gross revenue offset by higher property
operating expenses resulted in higher net property income
Distribution income 12,667 12,877 (1.6)
Mainly due to income tax on the service charges and
utilities recoveries and realised loss on the cross currency
swap
Distribution per unit
(cents) 1 1.17
Distribution yield2 (%) 8.7

1Q 2011 Financial Results – Balance Sheet
Notes:
1. Adopted valuation from KJPP Rengganis as at 31 December 2010 in IDR, converted to SGD at the year end exchange rate
2. DB loan expires on 24 March 2012. Interest cost is fixed at 2.03% until 31 May 2011 plus margin and costs.
31-Mar-11 31-Dec-10
(S$ million) (S$ million)
Non Current Assets 1,112.7 1,082.4
Current Assets 135.4 130.1
Total Debt 125.0 125.0
Other Liabilities 191.2 185.6
Net Assets 931.9 901.9
Net Asset Value S$0.86 S$0.83
Average Cost of Debt 7.7%p.a 7.7% p a
Total Units in Issue 1,083.3 1,081.7
8
Gearing Ratio 10.0% 10.3%

Distribution Details
Total DPU
-Tax-Exempt
-Capital
Books Closure Date
1.17 c
0.94 c
0.23 c
9 May 2011
Since listing in Nov 2007, LMIR Trust has maintained a payout policy of 100% of distributable income
Distribution Payment Date 31 May 2011
1 January 2011 – 31 March 2011
9

10
Unit Price Performance in 1Q 2011
Notes:
Starting from 2011, LMIR Trust
unit price has slightly
outperformed the SREIT, JCI and
the STI index in the 1st Quarter
2011
Market capitalization was S$585
million1 as of 31 March 2011
LMIRT unit price has been trading
at a discount of 37% to NAV at
end of March 2011
Notes:
1.Based on the closing price of $0.54 as at 31 March 2011
0.700
0.800
0.900
1.000
1.100
1.200
1.300
Jan-11 Feb-11 Apr-11
JCI LMRT SP Equity FSSTI Index FSTREI Index

11
Portfolio Performance
12
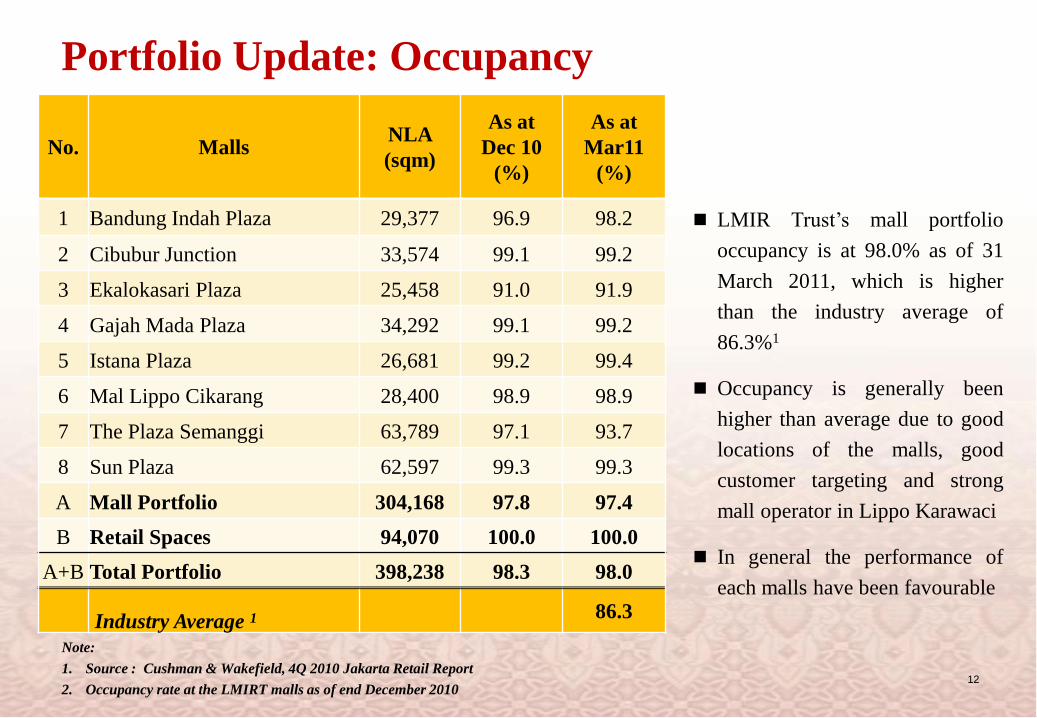
Portfolio Update: Occupancy
LMIR Trust’s mall portfolio
occupancy is at 98.0% as of 31
March 2011, which is higher
than the industry average of
86.3%1
Occupancy is generally been
higher than average due to good
locations of the malls, good
customer targeting and strong
mall operator in Lippo Karawaci
In general the performance of
each malls have been favourable
Note:
1. Source : Cushman & Wakefield, 4Q 2010 Jakarta Retail Report
2. Occupancy rate at the LMIRT malls as of end December 2010
No. MallsNLA
(sqm)
As at
Dec 10
(%)
As at
Mar11
(%)
1 Bandung Indah Plaza 29,377 96.9 98.2
2 Cibubur Junction 33,574 99.1 99.2
3 Ekalokasari Plaza 25,458 91.0 91.9
4 Gajah Mada Plaza 34,292 99.1 99.2
5 Istana Plaza 26,681 99.2 99.4
6 Mal Lippo Cikarang 28,400 98.9 98.9
7 The Plaza Semanggi 63,789 97.1 93.7
8 Sun Plaza 62,597 99.3 99.3
A Mall Portfolio 304,168 97.8 97.4
B Retail Spaces 94,070 100.0 100.0
A+B Total Portfolio 398,238 98.3 98.0
Industry Average 186.3
13
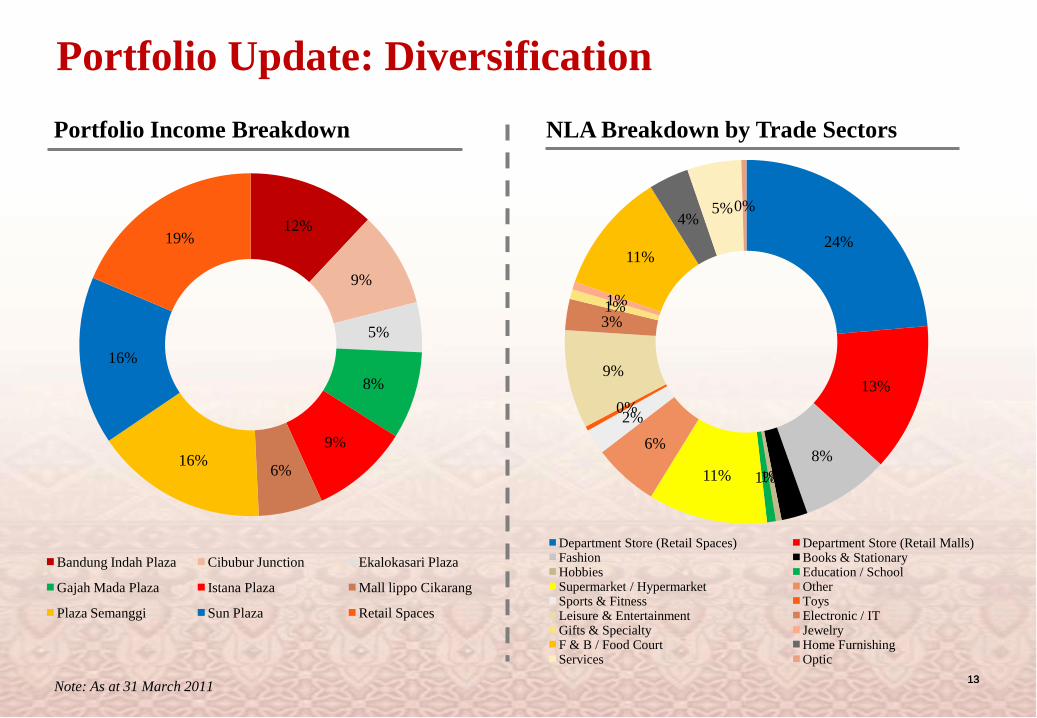
Portfolio Update: Diversification
Note: As at 31 March 201113
NLA Breakdown by Trade SectorsPortfolio Income Breakdown
12%
9%
5%
8%
9%
6%16%
16%
19%
Bandung Indah Plaza Cibubur Junction Ekalokasari Plaza
Gajah Mada Plaza Istana Plaza Mall lippo Cikarang
Plaza Semanggi Sun Plaza Retail Spaces
24%
13%
8%2%1%1%11%
6%
2%0%
9%
3%1%1%
11%
4%5%0%
Department Store (Retail Spaces) Department Store (Retail Malls)Fashion Books & StationaryHobbies Education / SchoolSupermarket / Hypermarket OtherSports & Fitness ToysLeisure & Entertainment Electronic / ITGifts & Specialty JewelryF & B / Food Court Home FurnishingServices Optic

18.6%
3.7%
3.7%
0.9%
0.7%
0.7%
0.6%
0.6%
0.5%
0.5%
0.5%
0.0% 2.0% 4.0% 6.0% 8.0% 10.0% 12.0% 14.0% 16.0% 18.0% 20.0%
Matahari (Retail Spaces)
Hypermart
Matahari (Retail Malls)
Centro
Giant Super Store
Gramedia
Solaria
Ace Hardware
Electronic Solution
Cinema 21
SOGO Dept. Store
14
Top 10 Tenants by Gross Income
Note: As at 31 March 2011
Total 31.1% of
portfolio
gross income
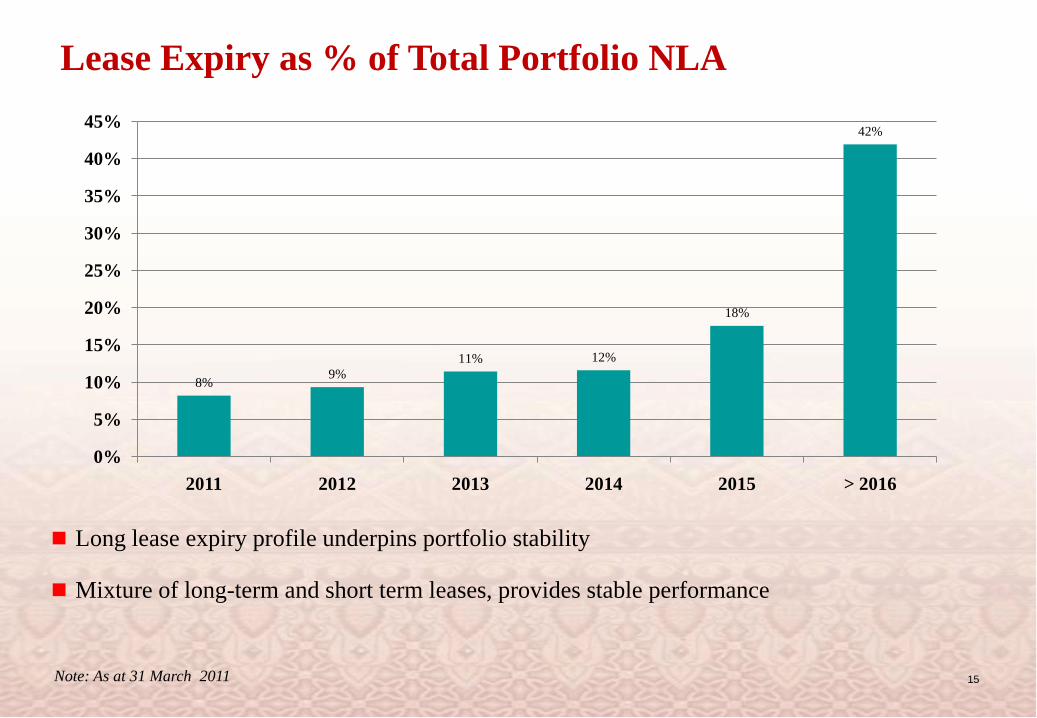
Lease Expiry as % of Total Portfolio NLA
15
Long lease expiry profile underpins portfolio stability
Mixture of long-term and short term leases, provides stable performance
Note: As at 31 March 2011
8%9%
11% 12%
18%
42%
0%
5%
10%
15%
20%
25%
30%
35%
40%
45%
2011 2012 2013 2014 2015 > 2016

16
LMIR Trust Growth Strategies

Targeted Growth Strategies
17
Large available pipeline from
both Sponsor and third parties.
ROFR over malls from Sponsor
A fragmented and diverse retail
market provides further
acquisition growth opportunities
Improving macroeconomic
fundamentals
Growing & affluent urban middle
income class
Active portfolio management and
tenant re-mixing / re-positioning
strategies
5 AEIs were completed in 2010, with total NLA around 6,894 sqm
of space, and total ROI is expected to be above 30%
KALIMANTAN
JAVA
SULAWESI
IRIAN JAYA
MALUKU
MALLS IN GREATER JAKARTA
N
PACIFIC OCEAN
INDIAN OCEAN
BANTENPROVINCE
WEST JAKARTA
SOUTH JAKARTA
WEST JAVAPROVINCE
EAST JAKARTA
CENTER OFJAKARTA
JAVA SEA
NORTH JAKARTA
Grand Palladium Medan
GTC Makassar
Malang Town Square
City of Tomorrow Mall
Metropolis Town Square
WTC Matahari
Lippo Cikarang Mall
Gajah Mada Plaza
Pejaten Village
Depok Town Square Bellanova Country Mall
Tamini SquareBekasi Trade Mall
The Plaza Semanggi
Pluit Village
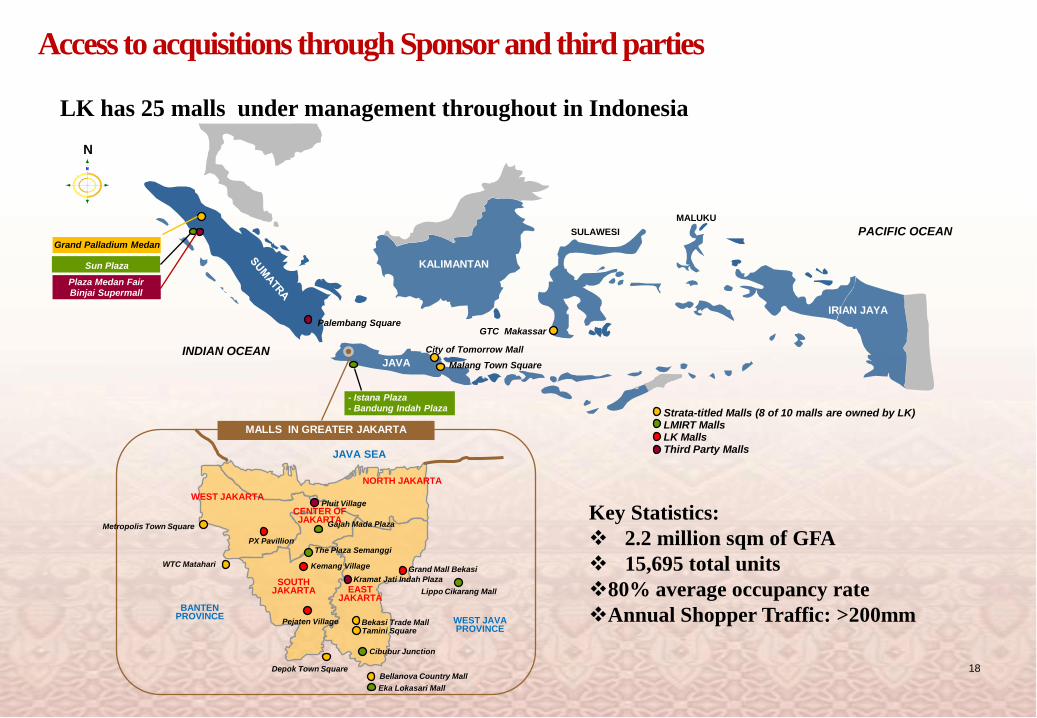
LK has 25 malls under management throughout in Indonesia
Eka Lokasari Mall
Palembang Square
Kramat Jati Indah Plaza
- Istana Plaza- Bandung Indah Plaza
Cibubur Junction
Key Statistics:
2.2 million sqm of GFA
15,695 total units
80% average occupancy rate
Annual Shopper Traffic: >200mm
Plaza Medan FairBinjai Supermall
Sun Plaza
Strata-titled Malls (8 of 10 malls are owned by LK)LMIRT Malls LK MallsThird Party Malls
PX Pavillion
Kemang Village
Access to acquisitions through Sponsor and third parties
18
Grand Mall Bekasi

19
Summary
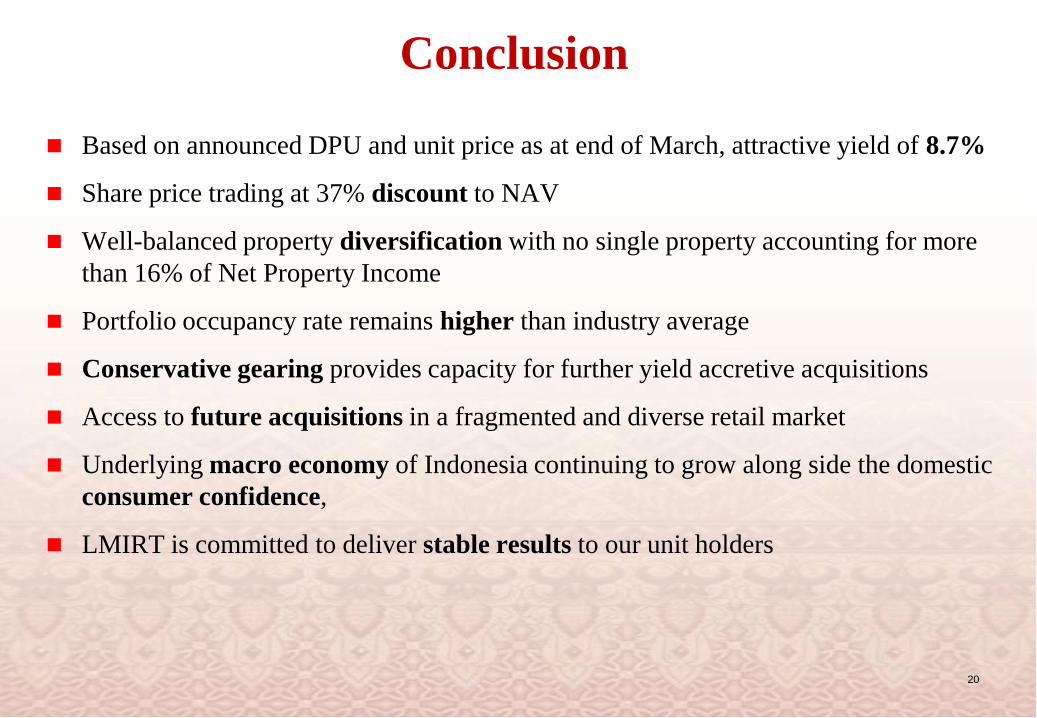
Conclusion
Based on announced DPU and unit price as at end of March, attractive yield of 8.7%
Share price trading at 37% discount to NAV
Well-balanced property diversification with no single property accounting for more
than 16% of Net Property Income
Portfolio occupancy rate remains higher than industry average
Conservative gearing provides capacity for further yield accretive acquisitions
Access to future acquisitions in a fragmented and diverse retail market
Underlying macro economy of Indonesia continuing to grow along side the domestic
consumer confidence,
LMIRT is committed to deliver stable results to our unit holders
20

21
Thank You

22
Appendix

Major Indonesian Conglomerate
Matahari &
HypermartFirst Media
Urban
Development
Large Scale
Integrated
Development
Retail Malls HealthcareHotels &
Hospitality
Property &
Portfolio
Management
Indonesia
OthersPropertyRetail OthersProperty &
HospitalityRetail
Regional presence in China, Macau,
Hong Kong, Philippines, Korea, Singapore
PT Lippo Karawaci Tbk
23

LMIR Trust Management Ltd
60% 40%
REIT Manager:
Singapore’s leading real
estate company
Indonesia’s premier
real estate company
Partnership between two leading real estate forces
197.7 million units
18.3% in LMIR Trust
127.3 million units
11.78% in LMIR Trust
• Leading real estate
company in
Singapore with
Asian focus.
• Owns and manages
over S$14.4 billion
of real estate assets
pan Asia.
• Owner/Manager of
one of Asia’s best
malls #
• Lippo is one of
Indonesia’s largest
conglomerates
• Lippo Karawaci
(“LK”) is the largest
listed property company
in Indonesia.
• LK has the most
integrated business
model of all property
companies in
Indonesia.
• LK rated by 3 rating
agencies-B by
S&P, B1 by Moody’s
and B+ by Fitch.
24
# According to report by Asiaone news

25
Quality and strategically located Retail Malls
THE PLAZA SEMANGGI GAJAH MADA PLAZA
CIBUBUR JUNCTION EKALOKASARI PLAZA
Location : Central Jakarta
NLA : 34,278 sqm
GFA : 66,160 sqm
Appraised Value : S$105.6 m
Location : East Jakarta
NLA : 33,574 sqm
GFA : 49,341 sqm
Appraised Value : S$71.1 m
Location : South Jakarta
NLA : 63,786 sqm
GFA : 91,232 sqm
Appraised Value : S$193.7 m
Location : Bogor
NLA : 25,458 sqm
GFA : 39,895 sqm
Appraised Value : S$52.9 m

26
Quality and strategically located Retail Malls
SUN PLAZAMAL LIPPO CIKARANG
BANDUNG INDAH PLAZA ISTANA PLAZA
Location : Cikarang
NLA : 28,263 sqm
GFA : 37,418sqm
Appraised Value : S$67.7 m
Location : Bandung
NLA : 29,377 sqm
GFA : 55,196 sqm
Appraised Value : S$116.9 m
Location : Bandung
NLA : 26,677 sqm
GFA : 37,434 sqm
Appraised Value : S$103.9 m
Location : Medan
NLA : 62,597 sqm
GFA : 73,871 sqm
Appraised Value : S$179.7 m

Retail Spaces Master-leased to Matahari
Mall WTC Matahari UnitsMetropolis Town
Square UnitsDepok Town Square Units Java Supermall Units
Malang Town Square
UnitsPlaza Madiun Grand Palladium Unit
LMIR Trust’s portfolio includes 7 Retail Spaces with total NLA of 94,070 sqm, master-leased to
Matahari for a period of 10+10 years, with fixed rental growth of 8% p.a. for the first 4 years
and a revenue sharing formula thereafter
NLA : 11,184 sqm NLA : 15,248 sqm NLA : 13,045 sqm NLA : 11,082 sqm
NLA : 11,065 sqm NLA : 13,417 sqmNLA : 19,029 sqm
5 of the 7 Retail Spaces reside in strata-titled malls built by the Sponsor 27

Annual Portfolio Revaluations 2010
28
Note: Exchange rate as at 31 December 2010: Rupiah
1. Represents the book value in LMIR Trust’s balance sheet as at 31 December 2010 based on either the most recent valuation plus any subsequent capital expenditure or if
acquired recently purchase price plus any capital expenditure and other acquisition costs committed.
2. Valuation date for all properties is 31 December 2010
Property
IDR' million SGD' million
Valuation as at
31 Dec 2009
Valuation as at
31 Dec 2010
Valuation as at
31 Dec 2010
Gajah Mada Plaza 669,200 745,000 105.6
Cibubur Junction 491,100 502,000 71.1
The Plaza Semanggi 1,238,500 1,367,000 193.7
Mal Lippo Cikarang 443,500 478,000 67.7
Ekalokasari Plaza 343,500 373,000 52.9
Bandung Indah Plaza 796,200 825,000 116.9
Istana Plaza 642,800 733,000 103.9
Sun Plaza 1,175,200 1,268,000 179.7
TOTAL RETAIL MALLS 5,800,000 6,291,000 891.5
TOTAL RETAIL SPACES 1,276,890 1,344,800 190.6
TOTAL PORTFOLIO 7,076,890.0 7,635,800.0 1,082.0