overview of climate change in vermontalanbetts.com/workspace/uploads/vermontclimatechange-rc...half...
TRANSCRIPT

Overview of Climate Change in Vermont
Dr. Alan K. BettsAtmospheric Research, Pittsford, VT 05763
[email protected]://alanbetts.com
Resource Conservation & Development Conference
Quechee, VT
October 26, 2012

Climate of Vermont• Climate is a
mean (10-30y)• Tmax
, T, Tmin
• Large seasonal range in VT
• Freezing T of water critical to climate
Mean

Earth sustains life
• Burning fossil fuels is increasing greenhouse gases and melting polar ice
• Climate is warming and extreme weather is increasing
January 2, 2012: NASA

NASA-GISS, 2011
War-time ocean data problems
+1o F
2100: +5oF
0o F
Global Temperature Rise 1880 –
Present
2010
Increasing Aerosols

• Half the Arctic Sea Ice Melted in 2012
• Open water in Oct. Nov. gives warmer Fall in Northeast
Sept 16, 2012
At the end of Nov. 2011 Hudson Bay was still nearly ice-free
• Positive feedbacks:
• Less ice, less reflection of sunlight
• More evaporation, larger vapor greenhouse effect
• Ice thin: most 1-yr-old

June 2012 snow cover minimum
• Arctic warming rapidly– Melting fast
• New England winters also– Same positive feedbacks
Steep fall since 2003
≈
500,000 km2/yr

What Is Happening to Vermont?
• PAST 40/50 years (CO2
forcing detectible)
• Warming twice as fast in winter than summer• Winter severity decreasing• Lakes frozen less
by 7
days / decade
• Growing season longer by 3-4 days / decade• Spring coming earlier by 2-3 days / decade
• Extremes increasing• Evaporation increases with T• More ‘quasi-stationary weather patterns’

Vermont Temperature Trends 1961-2008
• Summer +0.4°F / decade
• Winter +0.9°F / decade• Larger variability, larger trend
• Less snow (and increased water vapor) drive larger winter warming

Lake Freeze-up & Ice-out Changing Frozen Period Shrinking Fast
• Ice-out earlier
by 2.9 (±1.0)
days / decade• Freeze-up later by 3.9 (±1.1)
days / decade
• Rivers and soils similar?
Frozen period trend -7 days/decade
- Apr 1

Hydrology is Sensitive to ClimateHydrology is Sensitive to Climate
•• Spring runoff Spring runoff dominates the dominates the annual annual hydrographhydrograph
•• Occurring Occurring significantly significantly earlier in northern earlier in northern New England in New England in recent yearsrecent years–– --3 days/decade3 days/decade
•• Timing related to Timing related to air temperaturesair temperatures
1900 1920 1940 1960 1980 2000
Year
Mar 11
Mar 21
Mar 31
Apr 10
Apr 20
Apr 30
May 10
LOESS smooths of winter/spring center of volume dates for 13 longest-record rivers in New England
Dat
e
Hodgkins and others, 2003
Lent (2010), USGS, Me

Winter Hardiness Zones –
winter cold extremes
Change in 16 years
Minimum winter T
4: -30 to -20oF
5: -20 to -10oF
6: -10 to 0oF

• USDA : VT Hardiness Zone Map 1976-2005 – mean 1990 – South into zone 6
• Half-zone in 16 yrs = 3.1oF/ decade
– triple the rise-rate of winter mean T
• http://planthardiness.ars.usda. gov/PHZMWeb/
Detailed Map (most recent)

Bennington & Brattleboro are almost zone 6
• Hardy peaches: 2012• Pests: winter survival
• What is this?

Bennington & Brattleboro are almost zone 6
• Hardy peaches– 2012
• What is this?
• Avocado– Didn’t survive frost– Late century: CT– Our grand-children

Lilac Leaf and Bloom
• Leaf-out -2.9 days/decade; Bloom -1.6 days/decade• Large year-to-year variation related to temperature:
2 to 3 days/ oF
- Apr 10

Lilac Leaf-out and Ice-out Coupled
• Lilac leaf and lake ice-out both depend on Feb. Mar. and April temperatures
• Trends indicate earlier spring

Sugar Maples in Spring
• Ice-out, lilac leaf, maple bud elongation correlated• Lilac bloom and maple leaf-out correlated
Data: Sandy Wilmot, ANR

First and Last Frosts Changing
• Growing season for frost-sensitive plants increasing 3.7 days / decade
• A help for growing “local food”

Shrinking Winter: Pittsford, VT (Freeze-up used to be mid-November)
January 7, 2007December 2006: • Warmest on record
January 10, 2008Warm Fall:• Record Arctic sea-ice melt • Snow cover in December,
ground unfrozen

October 2011– March 2012
• Warmest 6 months on record• My garden frozen only 67 days• No permanent snow cover
west of Green Mountains• Contrast snowy winter 2010-11
January 2, 2012 March 11, 2012
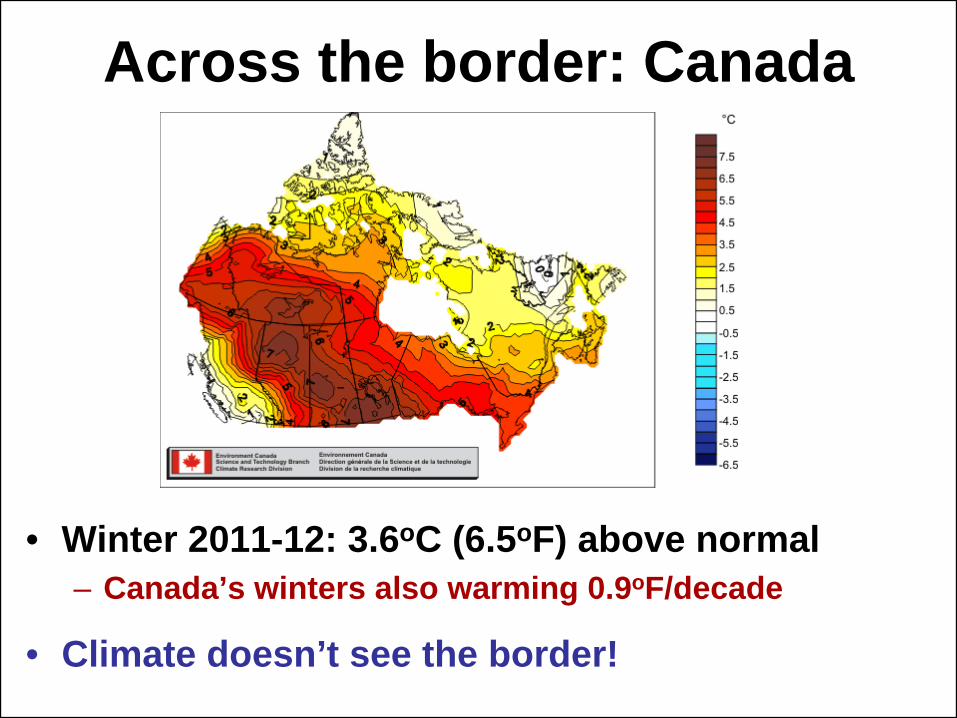
Across the border: Canada
• Winter 2011-12: 3.6oC (6.5oF) above normal– Canada’s winters also warming 0.9oF/decade
• Climate doesn’t see the border!

Early Spring: Daffodils, Forsythia 79oF on March 22, 2012
Pittsford Vermont
3/22/12
Pittsford Vermont
3/24/12

This Year Exceptionally
Warm• Burlington Area Extremes • Highest Average
Temperature degrees F • Days: 9/1/2011 - 8/31/2012 • Length of period: 365 days • Years: 1850-2012 • Rank Value Ending Date • 1 50.4 8/31/2012• 2 48.4 8/31/2002,
8/31/1949 • 4 48.2 8/31/2010 • 5 48.0 8/31/1999 • 6 47.9 8/31/2006 • 7 47.8 8/31/1991,
8/31/1995 • 9 47.6 8/31/1899,
8/31/1903
(Scott Whittier: NWS-BTV) http://www.ncdc.noaa.gov/temp-and-precip/maps.php

Increasing Temperature Extremes is “Global Warming”
• Frequency of occurrence (vertical axis) of local June-July-
August temperature anomalies for Northern Hemisphere land in units of local standard deviation (horizontal axis). The normal (gaussian) distribution bell curve is shown in green.
• Large increase in anomalies > +3σ
is global warming– Increased from baseline 0.15% to 10% in 45 years
(Hansen, 2012)

Vermont Winter 2006
• Sun is low; snow reflects sunlight, except where there are trees -
shadows
• Sunlight reflected, stays cold; little evaporation, clear sky; earth cools to space
• Positive feedback: Less snow, warmer winters (2012)

Spring Climate Transition
• Before leaf-outLittle evaporation
Dry atmosphere, low humidity Low water vapor greenhouse
Large cooling at nightLarge diurnal temp. range
giving warm days, cool nights and frost
• After leaf-outLarge evaporation
Wet atmosphere, low cloudbase
Small cooling at night Reduced maximum temperature Reduced chance of frost
• Spring is coming earlier: 2012 was extreme

Summer dry-down
• Wet in spring• Soil moisture falls:
summer dry-down• Low humidity &
little rain
• Can lock-in drought in central US: as 2012
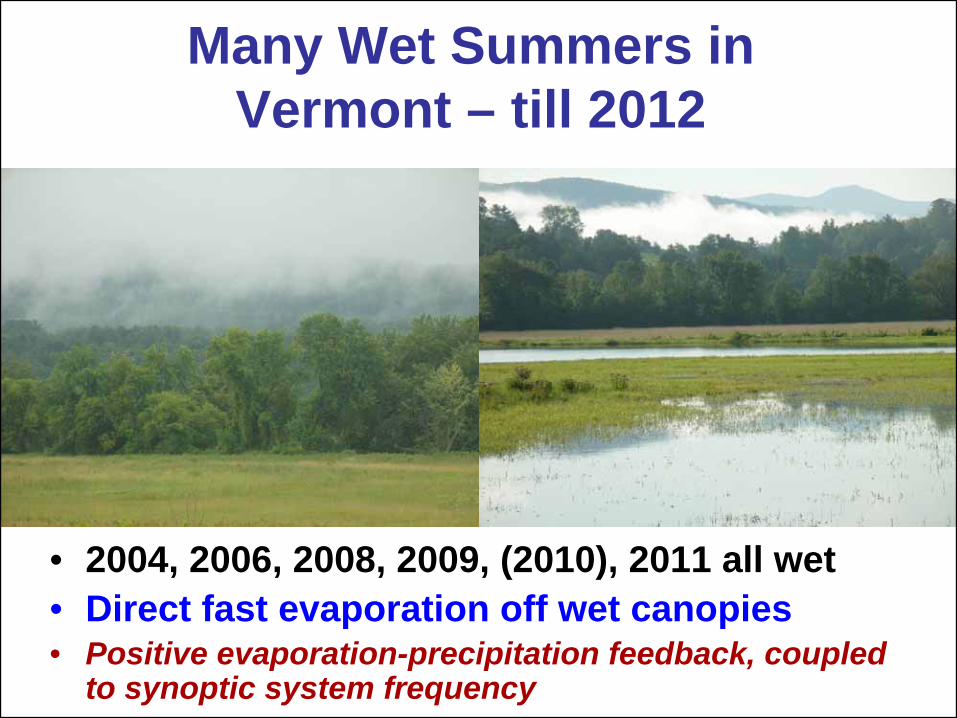
Many Wet Summers in Vermont –
till 2012
• 2004, 2006, 2008, 2009, (2010), 2011 all wet • Direct fast evaporation off wet canopies• Positive evaporation-precipitation feedback, coupled
to synoptic system frequency
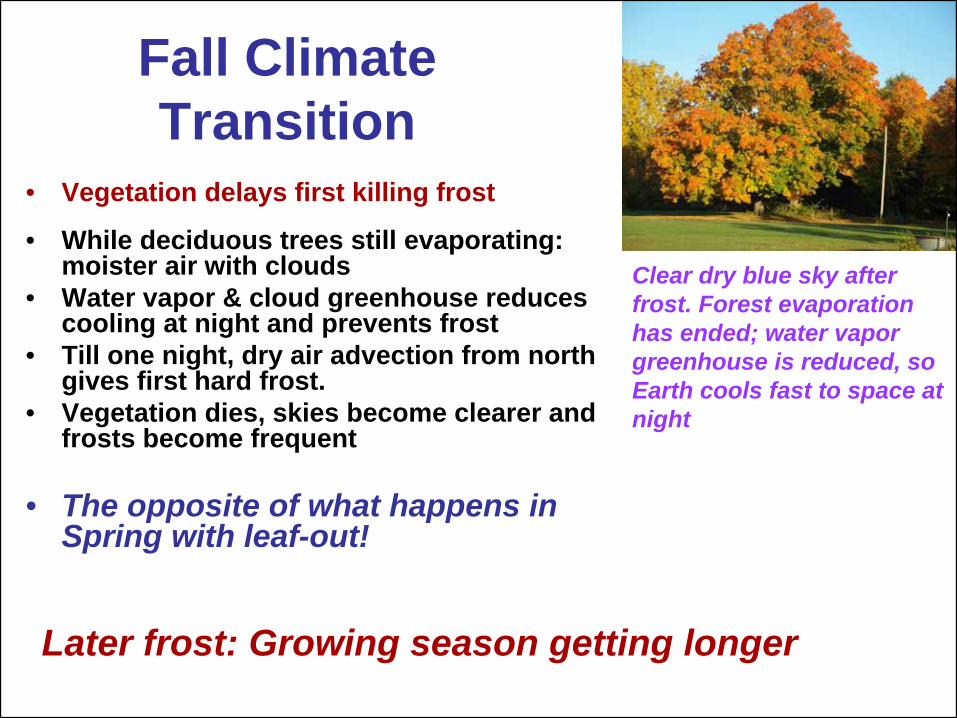
Fall Climate Transition
• Vegetation delays first killing frost
• While deciduous trees still evaporating: moister air with clouds
• Water vapor & cloud greenhouse reduces cooling at night and prevents frost
• Till one night, dry air advection from north gives first hard frost.
• Vegetation dies, skies become clearer and frosts become frequent
• The opposite of what happens in Spring with leaf-out!
Clear dry blue sky after frost. Forest evaporation has ended; water vapor greenhouse is reduced, so Earth cools fast to space at night
Later frost: Growing season getting longer

Carbon Dioxide Is Increasing
Winter
Summer Upward trend + 2ppm/ year

2009 Was “Good”
for the Earth
Need 80% drop by 2050
-
4%/year
Emission
Scenarios
Back on growth: 2010, 2011

Only Half of Total CO2
Emissions Remain in the Atmosphere
Updated from Le Quéré
et al. (2009). Nature Geoscience; Data: NOAA 2010, CDIAC 2010
Total CO2
emissions
Atmosphere
CO
2Pa
rtiti
onin
g (P
gCy-
1 )
1960 20101970 1990 20001980
10
8
6
4
2
Half to oceans & forests
It takes at least a century to remove CO2
from the atmosphere, and many centuries to remove it from oceans

Rising
Ocean Acidity Threatens Organisms
• From the Tropics to the Arctic, the seas are sucking up emissions of CO2
—from burned fossil fuels
• When CO2
dissolves in water, carbonic acid is produced; the oceans are becoming more acidic
(Ruttiman, Nature,31 Aug. 2006)

Rise of Greenhouse Gases (GHG) Shift Energy Balance of Planet
• The atmosphere is transparent to light
from the sun, but not to infrared radiation
from the earth
• GHG:
H2
O, CO2
, CH4
, O3
, CFCs
trap the infrared from the surface, giving climate suitable for life by warming planet 60oF
• Rise of CO2
alone has only a small warming effect
BUT…
Water, Snow & Ice Give Positive Radiative Feedbacks
• As Earth warms, evaporation and water vapor increase
and this is 3X amplifier
on CO2
rise
• As Earth warms, snow & ice decrease and reduced SW reflection amplifies warming
in
Arctic in summer and mid-latitudes in winter
• Doubling CO2
will warm globe about 5°F (3°C) • Much more in the cold regions and over land,
which responds faster than oceans

Global Warming Is Unequivocal IPCC: February 2, 2007
Since 1970, a rise in:• Global surface temperature• Lower atmosphere temperatures• Global sea-surface temperatures• Global sea level• Ocean heat content• Water vapor• Rainfall intensity• Extratropical precipitation• Hurricane intensity• Drought• Extreme high temperatures• Heat waves
(www.ipcc.ch)
Decrease in:• NH snow extent• Arctic sea ice• Glaciers• Ocean pH (increasing acidity)

2020-2029
2090-2099
“Committed”
Still up to us!
[oC]
(We did nothing for the last 20
years)
(We could halve this if we act now)
Predicted Change in Temperature2020-2029 and 2090-2099, relative to 1980-1999 (oC)

Vermont’s Future with High
and Low
GHG Emissions
NECIA, 2007
What about tropics?
What about skiing?
Business as usual

Very Heavy Precipitation Is Increasing• Precipitation Extremes• Most of the observed
increase in precipitation during the last 50 years
has come from the increasing frequency and intensity of heavy downpours.
• 67% increase in Northeast
• Little change or a decrease in the frequency of light and moderate precipitation
• NE stormflow
increasing (Lent, USGS, 2010)

Stormflow changes1950-2006
Increasesin blue
Summer stormflow
increases20-50%
Lent (2010)USGS, Me

Projected Mean Precipitation
Increase by 2090
• Wetter - North• Drier - South• For NE
– +15% in winter– +10% in spring– +5% in fall– No change summer– But heavier rain &
more drought• (Unshaded
– less confident)

Extreme Weather (precip.)• Precip. is condensation of atmospheric water
vapor -
large latent heat release drives storms• Saturation vapor pressure at cloud-base
increases steeply with temperature (6%/oC)
• Quasi-stationary large-scale flow means longer rain events in low-pressure convergent regions, and longer droughts in high-pressure divergent regions
• As climate changes, quasi-stationary large- scale modes appear to be more frequent– Cause may be Arctic warming
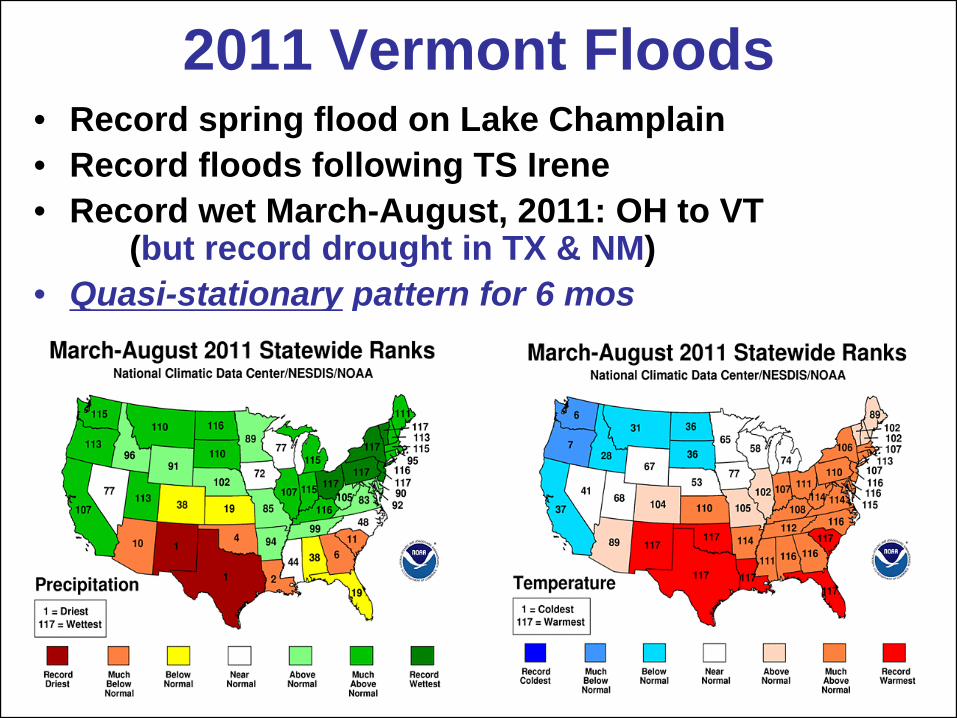
2011 Vermont Floods• Record spring flood on Lake Champlain• Record floods following TS Irene• Record wet March-August, 2011: OH to VT
(but record drought in TX & NM)• Quasi-stationary pattern for 6 mos

2011 Classic VT Flood Situations• Spring flood: heavy rain and warm weather,
melting large snowpack from 2010 winter– 70F (4/11) and 80F(5/27) + heavy rain– record April, May rainfall: 3X at BTV– Severe Winooski flood– Lake Champlain record flood stage of 103ft
• Irene flood: tropical storm
moved up east of Green Mountains– dumped 6-8 ins rain on wet soils– Extreme flooding– (Floyd on 9/17/1999 had similar rain -
but with dry
soils there was less flooding)

As Arctic warms, jet stream patterns are slowing down and amplifying, giving more extreme weather
(Francis and Vavrus, 2012) Image - NASA


Sea-level Rise Will Eventually Flood Coastal Cities
• Late 20th-century sea-level rise: 1 foot / century
• 21st
century: Likely to triple to 3 -
4 feet / century• And continue for centuries (accelerating
for business as usual)
• http://www.nature.com/news/us-northeast-coast-is-hotspot-for-rising- sea-levels-1.10880

Many Challenges Face Us
• Extreme weather: Floods, fires, & drought-
32 weather disasters >$1B in 2011
• Melting
Arctic and permafrost—methane release is positive feedback
• Ecosystem collapse,
including perhaps forest and ocean ecosystems
• Collapse of unsustainable human population

Can We Stop “Dangerous Climate Change”?
• Yes:
Quickly stabilize atmospheric CO2
• This means an 80% drop in CO2
emissions!
• This is very difficult• Fossil fuels have driven our industrial growth and
population growth for 200 years• Our “lifestyle”
has become dependent on fossil
fuels

Efficiency Comes First
• We need to double or triple our energy efficiency because…• We cannot replace current fossil fuel use
with biofuels & renewable energy
• Oil and gas reserves are limited, but coal, shale-gas & shale-oil reserves are sufficient to push CO2
to 1,000 ppm—and in time melt icecaps
• Can we “sequester”
CO2
(put it back in the earth)?

Why Is It Difficult for Us?
• Fossil fuels reserves are worth $20-30T– Regulating emissions of CO2
is an “unfair cost”
to the “free market”
– Yet we are still subsidizing fossil fuels
• Politics lost in fantasy– Ignoring Earth system and climate issues

Why Is It Difficult for Us?• The “American dream”
is crumbling
• “Economic growth”
based on fossil fuels, debt, and consumerism is unsustainable
— and a disaster for
the planet!
• Individual “rights”
and the needs of humanity must be balanced
against the needs of the
earth’s ecosystem
• We don’t know how to
guide and manage technology
—so the result is tremendous
successes and catastrophic failures

What Do We Need?• So we need honest, truthful, smart
pathways
forward • That will not frighten people
into paralysis
• That will spread hope, not anger or despair
• That sidestep ideological barriers with new language
• That develop adaptive governance• The US Constitution gives no rights to the Earth
• That respect Earth system processes & limits

Discussion• This talk http://alanbetts.com/talks
• Rutland Herald articles at http://alanbetts.com/writings
• Interesting papers at http://alanbetts.com/research
– Vermont Climate Change Indicators
– Seasonal Climate Transitions in New England