overview - fletcher building (cps) 9. 24.0; 22.0. ... all steel products such as rollforming, ... 1....
TRANSCRIPT

ABN-AMRO NZ Day 4 March 2008
2
Disclaimer
This presentation contains not only a review of operations, but also some forward looking statements about Fletcher Building and the environment in which the company operates. Because these statements are forward looking, Fletcher Building’s actual results could differ materially. Media releases, management commentary and analysts presentations, including those relating to the February 2008 half year results, are all available on the company’s website and contain additional information about matters which could cause Fletcher Building’s performance to differ from any forward looking statements in this presentation. Please read this presentation in the wider context of material previously published by Fletcher Building.

ABN-AMRO NZ Day 4 March 2008
COMPANY OVERVIEW

ABN-AMRO NZ Day 4 March 2008
4
Countries: Operations in 11 countriesAnnual Turnover: NZ$7+ billionMarket Capitalisation: NZ$4.8 billionDual Listed: NZX/ASX Demerged: March 2001Employees: 20,000+
Shareholders: NZ 43%Aus 35%USA 12%Other 10%
Fletcher Building is Australasia’s largest building and construction materials supplier, by market capitalisation, with leading market positions in USA and Europe

ABN-AMRO NZ Day 4 March 2008
5
Market leading businesses
Steel
Rollforming & Steel PaintingSteel MerchantsLong Steel
Electric Arc FurnaceReinforcing bar,mesh and wire Scrap
Revenue - 17%
Distribution
Building Materials Distribution
62 PlaceMakersstores
Revenue - 16%
Infrastructure
ConstructionConcrete
CementReadymixAggregatesConcreteProductsRocla Pipesand Quarries
Revenue - 26%
Building Products
PlasterboardInsulation Metal Roof TilesOther Business
AluminiumSinkwareForman GroupAccess Floors
Revenue - 11%
Laminates& Panels
Revenue - 30%
The Laminex GroupMDFParticleboardLPMHPL
FormicaHPL

ABN-AMRO NZ Day 4 March 2008
6
Diversification of revenue is improving
17%
Revenue by RegionPercentage
Revenue by DivisionPercentage
1H071H08
52
30
7 63 2
60
35
1 0 1 3
NZ Australia NthAmerica
Europe Asia Other
11
16
26
30
17
12
17
32
1920
BuildingProducts
Distribution Infrastructure Laminates& Panels
Steel
Formica
ABN-AMRO NZ Day 4 March 2008
7
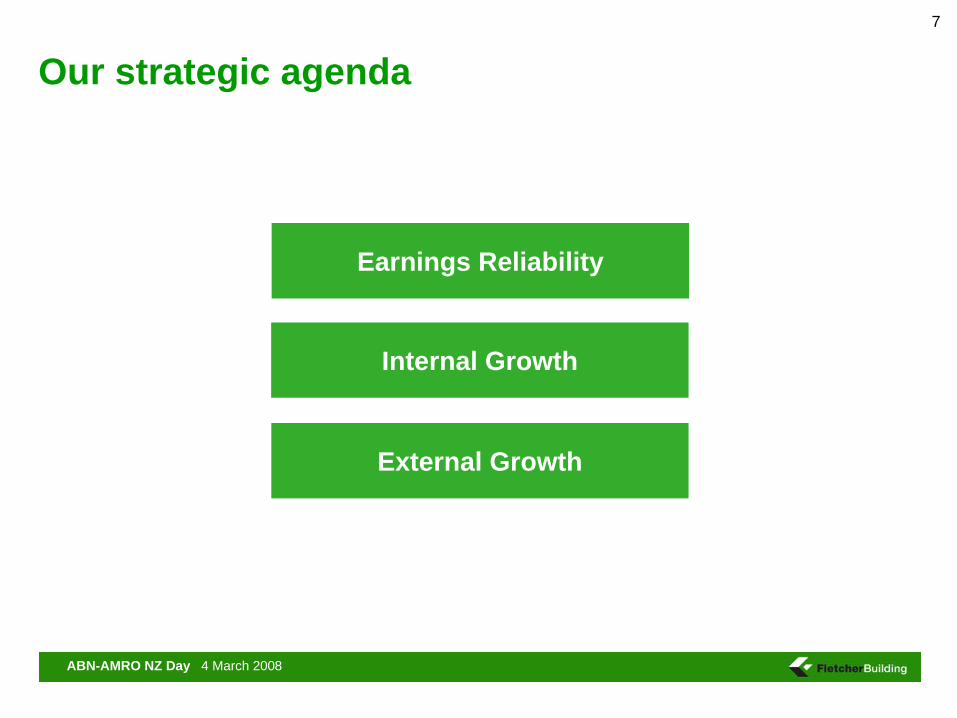
Our strategic agenda
Internal Growth
External Growth
Earnings Reliability
ABN-AMRO NZ Day 4 March 2008
8
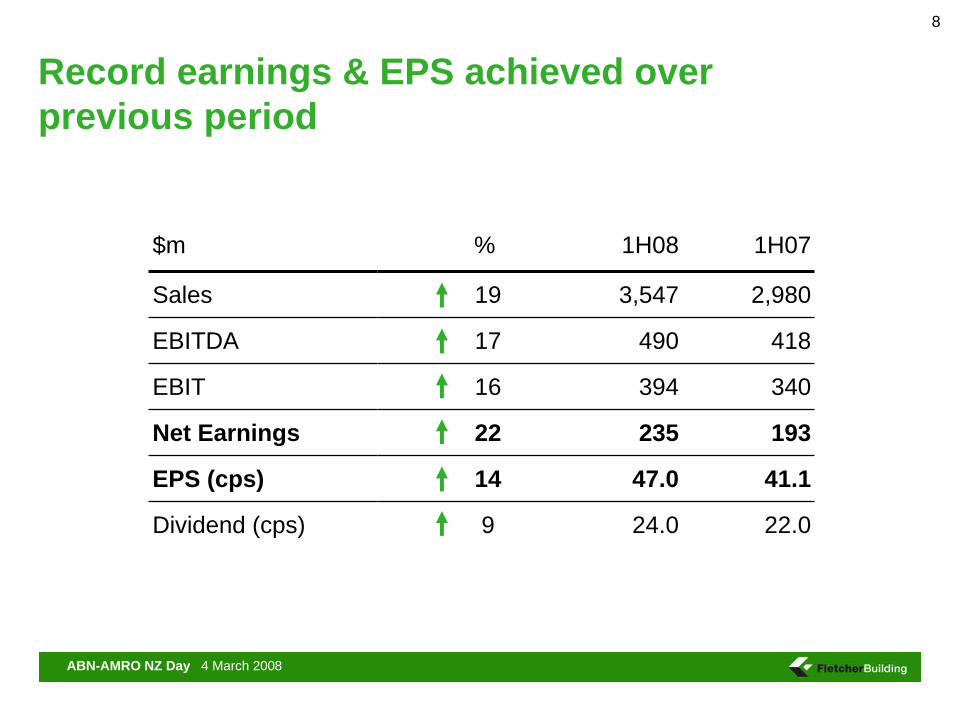
$m % 1H08 1H07
Sales 19 3,547 2,980
EBITDA 17 490 418
EBIT 16 394 340
Net Earnings 22 235 193
EPS (cps) 14 47.0 41.1
Dividend (cps) 9 24.0 22.0
Record earnings & EPS achieved over previous period

ABN-AMRO NZ Day 4 March 2008
MARKET FORECASTS

ABN-AMRO NZ Day 4 March 2008
10
New Zealand - Volume of work commenced
Source: Infometrics March 2008 data = June Years
Infrastructure WPIPResidential consents
Residential incl A&A WPIP Non Residential WPIP
-9% -6% +12% +4% +9%
010000200003000040000
2004 2005 2006 2007 2008 2009 2010 2011 2012
-2% +8% +6% -1% +5%
010002000300040005000
2004 2005 2006 2007 2008 2009 2010 2011 2012
$m 1995/96 prices
+1% -3% +1% -3% +0%
460048005000520054005600
2004 2005 2006 2007 2008 2009 2010 2011 2012
$m 1995/96 prices
010002000300040005000
2004 2005 2006 2007 2008 2009 2010 2011 2012
$m 1995/96 prices
-4% +5% +3% +3% +1%

ABN-AMRO NZ Day 4 March 2008
11
Australia - Volume of work commenced
Source : BIS Shrapnel December 2007 data = June Years
Residential approvals Infrastructure WPIP
Residential incl A&A WPIP Non Residential WPIP
+1% +9% +13% +7%
050
100150200250
2004 2005 2006 2007 2008 2009 2010 2011
'000s
+7% +0% +3% +3%
0
20
40
60
2004 2005 2006 2007 2008 2009 2010 2011
$bn 2004/05 prices
+7% +5% +11% +11%
0
20
40
60
2004 2005 2006 2007 2008 2009 2010 2011
$bn 2004/05 prices
+6% -2% +1% -3%
0
10
20
30
2004 2005 2006 2007 2008 2009 2010 2011
$bn 2004/05 prices
ABN-AMRO NZ Day 4 March 2008
12
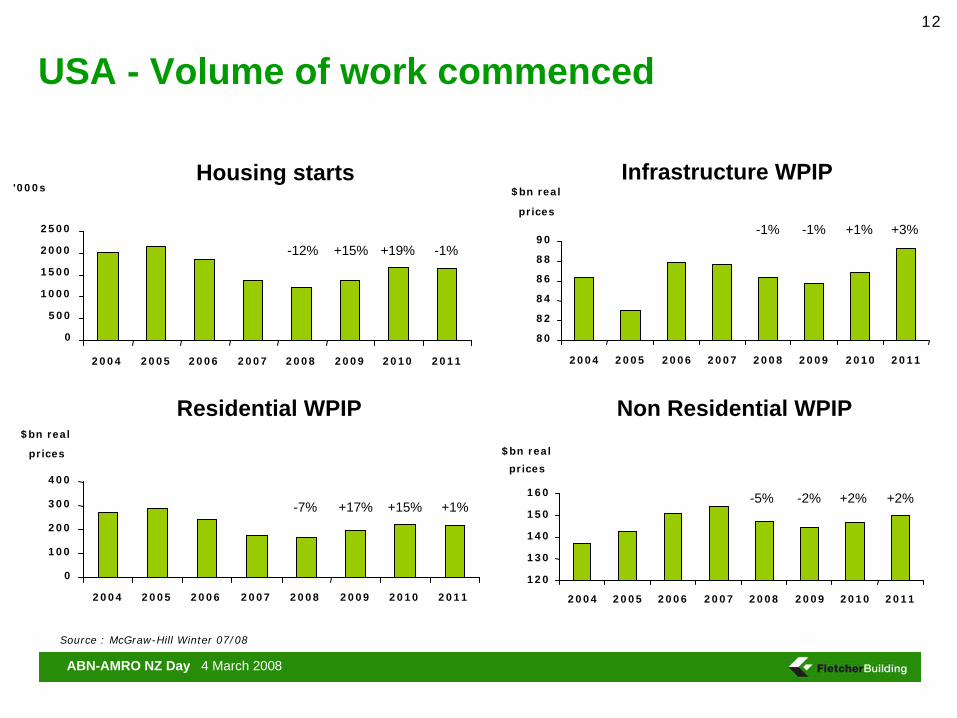
USA - Volume of work commenced
Source : McGraw-Hill Winter 07/08
Housing starts
0
500
1000
1500
2000
2500
2004 2005 2006 2007 2008 2009 2010 2011
'000sInfrastructure WPIP
Residential WPIP
0
100
200
300
400
2004 2005 2006 2007 2008 2009 2010 2011
$bn real
prices
-12% +15% +19% -1%
-7% +17% +15% +1%
80
82
84
86
88
90
2004 2005 2006 2007 2008 2009 2010 2011
$bn real
prices
Non Residential WPIP
-1% -1% +1% +3%
120
130
140
150
160
2004 2005 2006 2007 2008 2009 2010 2011
$bn real
prices
-5% -2% +2% +2%

ABN-AMRO NZ Day 4 March 2008
GROWTH

ABN-AMRO NZ Day 4 March 2008
Growth projects: Internal pipeline remains strongBuilding Products• New Christchurch distribution centre underway• Furnace rebuild at Auckland glasswool plant in progress• Completion of Hungarian roof tile plant in 2009
Distribution• Upgrades to Cromwell, Taranaki, Ohakune,
Thames, Christchurch Frame & Truss• Site acquired in Warkworth• Major IT project underway
Infrastructure• Australian quarry expansion• Cement terminal in Auckland• Cameron’s Quarry acquired in Bay of Plenty
Laminates & Panels• Particleboard upgrade in Australia• China HPL press• 20% investment in Dongwha to secure MDF supply
Steel• Acquisition of Fair Dinkum Homes and Sheds
Stay in BusinessGrowth of Productivity
HISTORICAL CAPEX SPEND*$million
109
122 121
79
105
116
131
61
Jun 05 Jun 06 Jun 07 Dec 07
* Excludes major acquisitions

ABN-AMRO NZ Day 4 March 2008
DIVISIONAL REVIEWS

ABN-AMRO NZ Day 4 March 2008
16
Earnings for all divisions increased in the first half despite challenging market conditions
74
42
145
91
47
72
39
122
65
46
Building Products Distribution Infrastructure Laminates & Panels Steel
Dec 2007Dec 2006
+2.8% +7.7% +18.9% +40% +2.2%
*
* Includes Formica acquired 2 July 2007
$m

ABN-AMRO NZ Day 4 March 2008
Building ProductsPlasterboard• Leading NZ market position
Insulation• No.1 in Australasia with 60% of Australian
and 70% of NZ bulk insulation market
Metal Roof Tiles• Largest manufacturer of steel roof tiles
worldwide
Other• Fletcher Aluminium• Tasman Sinkware• Forman Insulation
-
20
40
60
80
100
120
140
160
180
2003 2004 2005 2006 2007 2008
EB
ITD
A (
$M
)
-
5.0
10.0
15.0
20.0
25.0
30.0
35.0
EB
ITD
A m
argin
(%
)
EBITDA H1 EBITDA H2 EBITDA Margin
Notes:- The Tasman Building Products Group was acquired on
30 September 2003- Insulation Solutions was acquired on 1 March 2005- The Forman Group was acquired on 1 December 2006
Notes: - All Steel products such as rollforming, steel painting, long steel and steel
merchants were reorganized from the Building Products division to form the Steel division in October 2006. The above numbers have been fully adjusted to exclude such steel products from the Building Products numbers since 2003
- EBITDA reference excludes unusual items
Historical earnings

ABN-AMRO NZ Day 4 March 2008
Building ProductsPlasterboard• Business stable
Insulation• Overall strong despite NSW weakness
Metal Roof Tiles• Strong volumes offset by FX translation
Other• Moulding business divested
Market Statistics Change H1 2008 vs H1 2007
1.6%
6.1%
2.7%
5.4%
0.0%
1.0%
2.0%
3.0%
4.0%
5.0%
6.0%
7.0%
Consents Residential WPIP
New Zealand Australia
Sales VolumesChange H1 2008 vs H1 2007
0.0%
1.4%
11.0%
-5.0%
0.0%
5.0%
10.0%
15.0%
Plasterboard Glass wool Roof tiles
$m % 1H08 1H07
Sales 9.3 376 344
EBIT 2.8 74 72
Margin % -5.7 19.7 20.9
Funds 2.7 572 557
Return on Funds % 6.8 25.9 27.81
1. Proforma return adjusted for acquisition

ABN-AMRO NZ Day 4 March 2008
Building Products – Growth driversPlasterboard• Performance boards• Increasing average house size • Air quality
Insulation• Energy efficiency• Regulations
Metal Roof Tiles• Japan/Europe penetration

ABN-AMRO NZ Day 4 March 2008
Distribution – PlaceMakers• 62 outlets across New Zealand
• 34% market share trade of core building materials
• No.1 in key building materials
• Trade focus – 80+% of sales
• Joint Venture rather than franchise (55 of 62) outlets in Joint Venture
Historical earnings
-
10
20
30
40
50
60
70
80
90
100
2003 2004 2005 2006 2007 2008
EBIT
DA
($M
)
-
5.0
10.0
EBIT
DA m
argin
(%
)
EBITDA H1 EBITDA H2 EBITDA Margin
ABN-AMRO NZ Day 4 March 2008
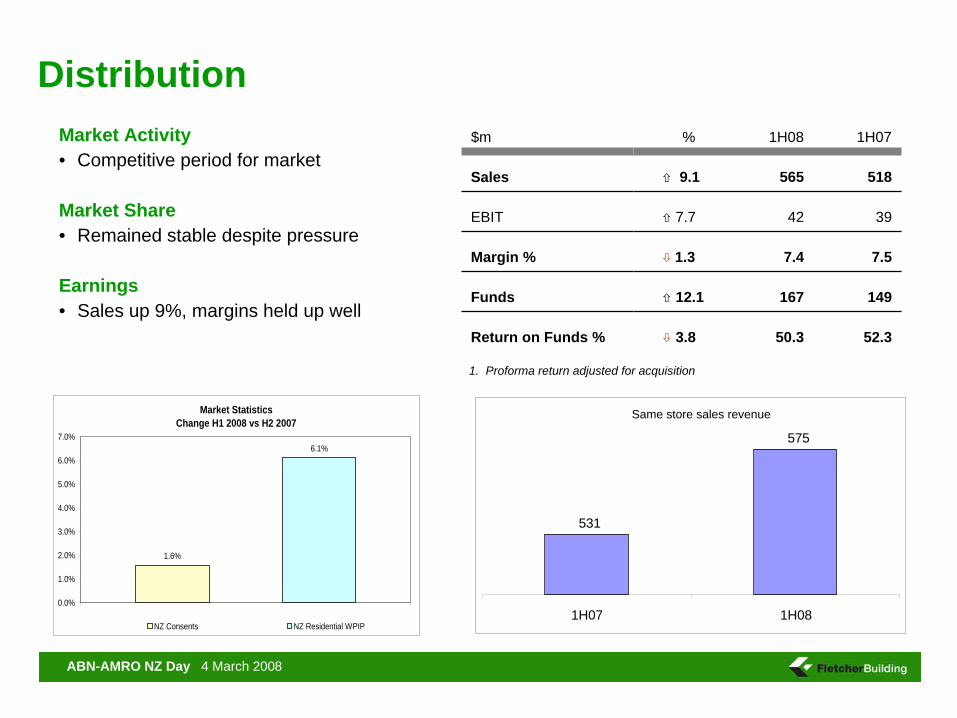
DistributionMarket Activity• Competitive period for market
Market Share• Remained stable despite pressure
Earnings• Sales up 9%, margins held up well
$m % 1H08 1H07
Sales 9.1 565 518
EBIT 7.7 42 39
Margin % 1.3 7.4 7.5
Funds 12.1 167 149
Return on Funds % 3.8 50.3 52.3
1. Proforma return adjusted for acquisition
Market Statistics Change H1 2008 vs H2 2007
1.6%
6.1%
0.0%
1.0%
2.0%
3.0%
4.0%
5.0%
6.0%
7.0%
NZ Consents NZ Residential WPIP
Same store sales revenue
531
575
1H07 1H08

ABN-AMRO NZ Day 4 March 2008
22
Distribution – Growth drivers• Joint Venture partner model
• Acquisition of independents
• New store locations
• Store upgrade / enhancement
• Product extensions e.g. kitchen components

ABN-AMRO NZ Day 4 March 2008
Infrastructure
Concrete• 25% of NZ aggregates market• 50% of NZ cement market• 33% of NZ readymix concrete market• 35% of Australian concrete pipe market• 55% of NZ pre-cast and concrete pipe market
Construction• New Zealand’s leading construction company• Commercial (buildings)• Engineering (infrastructure)• South Pacific (general)• One of New Zealand’s larger home builders
Market Shares
Note: Rocla Pipeline Products and Rocla Quarry Products were acquired on 1 March 2005
-
50
100
150
200
250
300
350
2003 2004 2005 2006 2007 2008
EB
ITD
A (
$M
)
-
5.0
10.0
15.0
20.0
EB
ITD
A m
argin
(%
)
EBITDA H1 EBITDA H2 EBITDA Margin
Historical earnings
ABN-AMRO NZ Day 4 March 2008
24
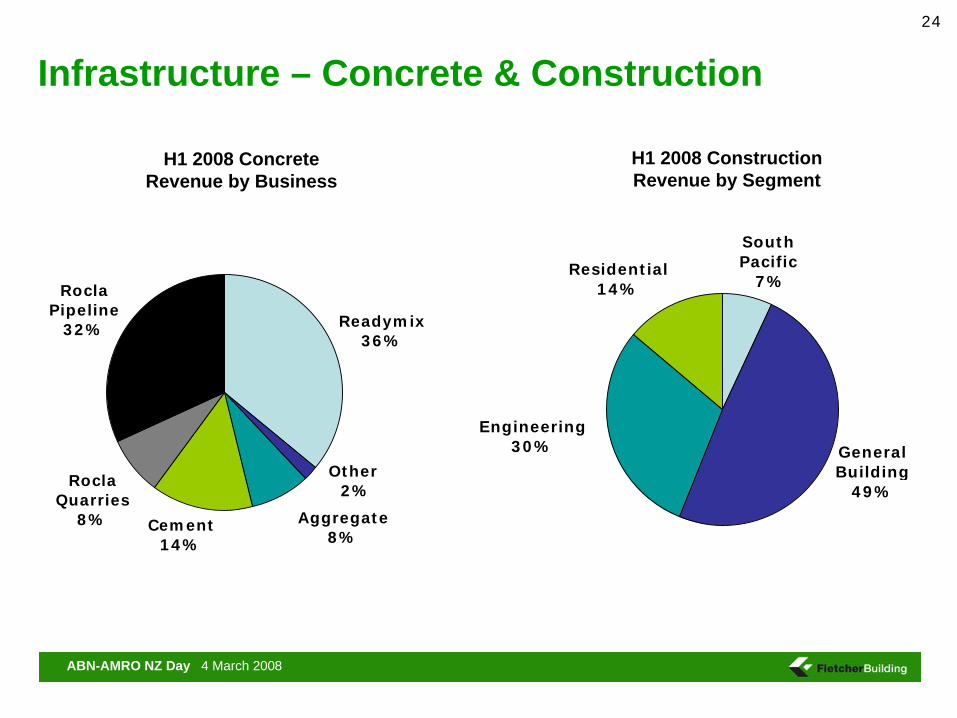
Infrastructure – Concrete & Construction
Readymix 36%
Rocla Pipeline
32%
Rocla Quarries
8% Cement 14%
Aggregate 8%
Other 2%
Engineering30%
Residential14%
South Pacific 7%
General Building
49%
H1 2008 Concrete Revenue by Business
H1 2008 ConstructionRevenue by Segment
ABN-AMRO NZ Day 4 March 2008
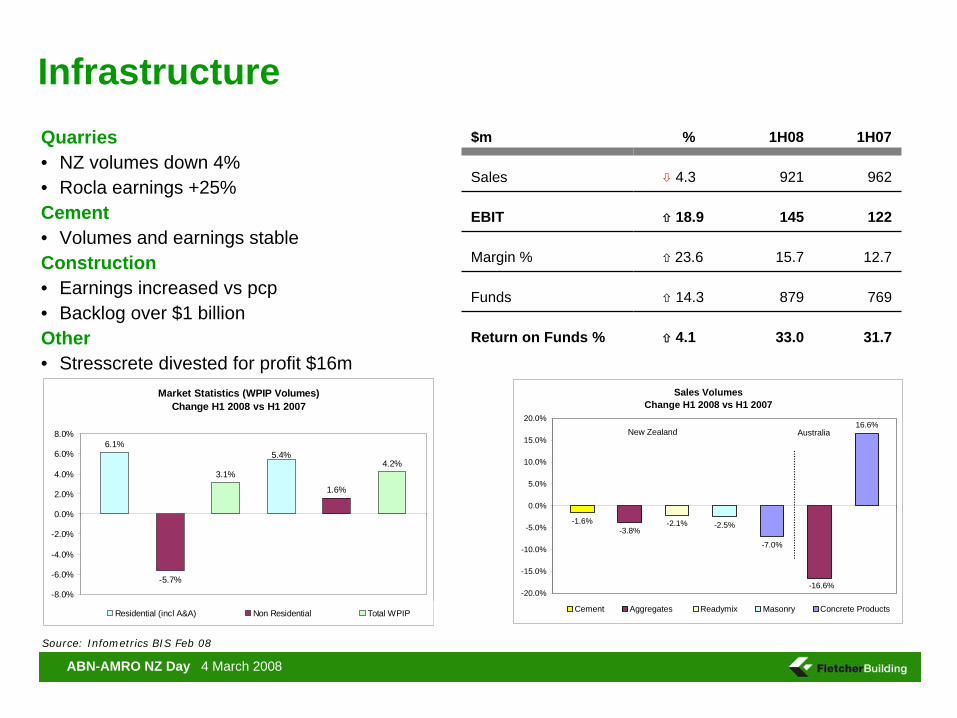
InfrastructureQuarries• NZ volumes down 4%• Rocla earnings +25%Cement• Volumes and earnings stableConstruction• Earnings increased vs pcp• Backlog over $1 billionOther• Stresscrete divested for profit $16m
Sales VolumesChange H1 2008 vs H1 2007
-1.6%-3.8%
-2.1% -2.5%
-7.0%
16.6%
-16.6%-20.0%
-15.0%
-10.0%
-5.0%
0.0%
5.0%
10.0%
15.0%
20.0%
Cement Aggregates Readymix Masonry Concrete Products
New Zealand AustraliaNew Zealand
$m % 1H08 1H07
Sales 4.3 921 962
EBIT 18.9 145 122
Margin % 23.6 15.7 12.7
Funds 14.3 879 769
Return on Funds % 4.1 33.0 31.7
Source: Infometrics BIS Feb 08
Market Statistics (WPIP Volumes) Change H1 2008 vs H1 2007
6.1%
-5.7%
3.1%
1.6%
4.2%5.4%
-8.0%
-6.0%
-4.0%
-2.0%
0.0%
2.0%
4.0%
6.0%
8.0%
Residential (incl A&A) Non Residential Total WPIP

ABN-AMRO NZ Day 4 March 2008
Infrastructure – Growth driversCement• Productivity improvements from recent kiln
upgrade
Aggregates• Geographic expansion e.g. Cameron's• Quarry end use
Construction• Over NZ$1 billion backlog of work

ABN-AMRO NZ Day 4 March 2008
Laminates & Panels• Leading high pressure laminate and
decorative surfaces
• Decorated board – No.1¹
• Medium density fibreboard – No.2¹
• Particleboard – No.2¹
• Over 50 owned distribution outlets across Australasia
-20406080
100120140160180200
2003 2004 2005 2006 2007 2008
EB
ITD
A (
$M
)
-
5.0
10.0
15.0
20.0
EB
ITD
A m
arg
in (
%)
EBITDA H1 EBITDA H2 EBITDA Margin
Historical earnings
Notes: - EBITDA reference excludes unusual items1 Estimated Australasian market share
ABN-AMRO NZ Day 4 March 2008
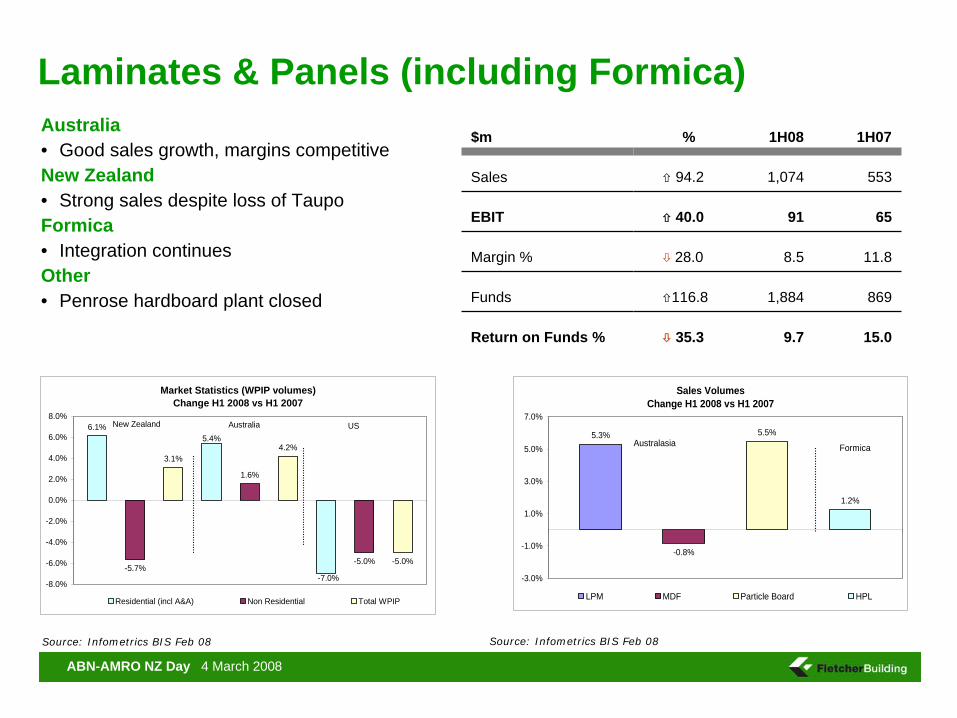
Laminates & Panels (including Formica)Australia• Good sales growth, margins competitiveNew Zealand• Strong sales despite loss of TaupoFormica• Integration continuesOther• Penrose hardboard plant closed
Source: Infometrics BIS Feb 08
Market Statistics (WPIP volumes)Change H1 2008 vs H1 2007
6.1%
-5.7%
3.1%
1.6%
4.2%
-5.0% -5.0%
5.4%
-7.0%-8.0%
-6.0%
-4.0%
-2.0%
0.0%
2.0%
4.0%
6.0%
8.0%
Residential (incl A&A) Non Residential Total WPIP
New Zealand Australia US
Sales VolumesChange H1 2008 vs H1 2007
5.3%
-0.8%
5.5%
1.2%
-3.0%
-1.0%
1.0%
3.0%
5.0%
7.0%
LPM MDF Particle Board HPL
Australasia Formica
$m % 1H08 1H07
Sales 94.2 1,074 553
EBIT 40.0 91 65
Margin % 28.0 8.5 11.8
Funds 116.8 1,884 869
Return on Funds % 35.3 9.7 15.0
Source: Infometrics BIS Feb 08

ABN-AMRO NZ Day 4 March 2008
Laminates & Panels – Growth driversLaminex• Product extension e.g. componentry• Particleboard upgrade• HPL sourcing from Asia
Formica• USA manufacturing consolidation• Asian sourcing solid surfaces• Asian and Eastern European growth• Laminex / Formica synergies
Source: Infometrics BIS Feb 08
ABN-AMRO NZ Day 4 March 2008
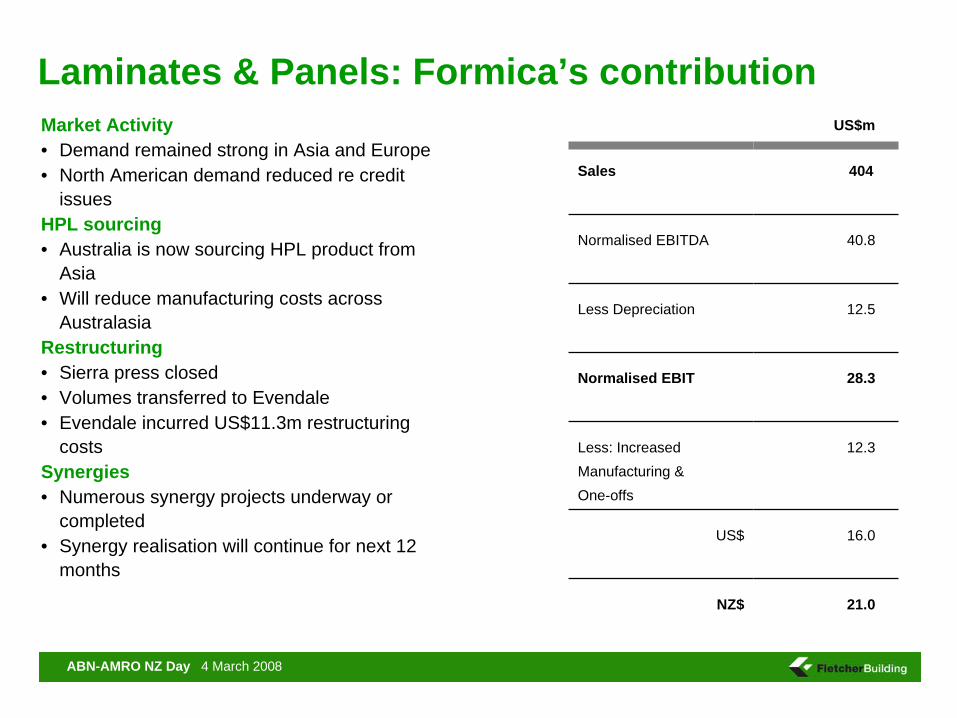
Laminates & Panels: Formica’s contributionMarket Activity• Demand remained strong in Asia and Europe• North American demand reduced re credit
issuesHPL sourcing• Australia is now sourcing HPL product from
Asia• Will reduce manufacturing costs across
AustralasiaRestructuring• Sierra press closed• Volumes transferred to Evendale• Evendale incurred US$11.3m restructuring
costsSynergies• Numerous synergy projects underway or
completed• Synergy realisation will continue for next 12
months
US$m
Sales 404
Normalised EBITDA 40.8
Less Depreciation 12.5
Normalised EBIT 28.3
Less: Increased Manufacturing & One-offs
12.3
US$ 16.0
NZ$ 21.0

ABN-AMRO NZ Day 4 March 2008
SteelRollforming & Steel Painting• 30% of Australian market
– Stramit– Dimond
Long Steel Products• >80% of NZ market• Reinforcing bar, flats, rod and wire• 50% Sims Pacific Metals• NZ’s sole electric arc furnace
Steel Merchants• 60-70% of New Zealand market
Note: Stramit Building Products was acquired on 1 March 2005
Notes: - All Steel products such as rollforming, steel painting, long steel and steel merchants
were reorganized from the Building Products division to form the Steel division in October 2006. The above numbers have been fully adjusted to include such steel products from the Building Products numbers since 2003
- EBITDA reference excludes unusual items
Historical earnings
-
20
40
60
80
100
120
2003 2004 2005 2006 2007 2008
EBIT
DA
($M
)
-
5.0
10.0
15.0
EBIT
DA
mar
gin
(%
)
EBITDA H1 EBITDA H2 EBITDA Margin

ABN-AMRO NZ Day 4 March 2008
SteelRollforming• Stramit, Dimond and Pacific Coilcoaters
improved earnings
Long Steel• Earnings down slightly on pcp• Significant improvement on last 6 months
Steel Merchants• EasySteel performed well in difficult market
Market Statistics (WPIP volumes)Change H1 2008 vs H1 2007
8.0%
6.1%
4.6%
5.4%
0.0%
1.0%
2.0%
3.0%
4.0%
5.0%
6.0%
7.0%
8.0%
9.0%
Infrastructure WPIP Residential WPIP
New Zealand Australia
Sales VolumesChange H1 2008 vs H1 2007
-8.6%
38.9%
-5.5%
25.8%
-1.3%
-20.0%
-10.0%
0.0%
10.0%
20.0%
30.0%
40.0%
50.0%
Long Steel- domestic Long Steel- export Rollforming Distribution
New Zealand Australia
$m % 1H08 1H07
Sales 1.5 611 602
EBIT 2.2 47 46
Margin % 1.3 7.7 7.6
Funds 14.3 542 474
Return on funds % 10.8 17.3 19.4
Source: Infometrics BIS Feb 08

ABN-AMRO NZ Day 4 March 2008
Steel – Growth driversRollforming• Production extension – pre-engineered building• Industry rationalisation
Long Steel• Industry rationalisation• Capacity utilisation/expansion• Export growth
Source: Infometrics BIS Feb 08

ABN-AMRO NZ Day 4 March 2008
FINANCIALS

ABN-AMRO NZ Day 4 March 2008
35
Net earnings increased 21.8% from the previous period
$m % 1H08 1H07
EBIT 15.9 394 340
Interest 48.9 67 45
Tax 9.8 83 92
Minority Interest 10.0 9 10
Net Earnings 21.8 235 193

ABN-AMRO NZ Day 4 March 2008
36
Balance Sheet
$m % 1H08 1H07
Operating Cashflow 7.9 245 227
Net Debt (ND) 148.9 1,628 654
Net Debt / Equity % 7.0 39.7 37.1
Interest Cover 21.5 7.3 x 9.3 x
Return on Funds % 21.8 20.4 26.1

ABN-AMRO NZ Day 4 March 2008
37
Net debt movement
961,6281218
(37)
990
14092
654
(337)
0
400
800
1200
1600
2000O
pen
ing d
ebt
Cas
h f
rom
ops
Work
ing c
apital
Cap
ex
Acq
uis
itio
ns
Div
estm
ents
Div
iden
ds
Min
Dis
tn
FX o
n d
ebt
Act
ual
deb
t31 D
ec 0
7
NZ$ m

ABN-AMRO NZ Day 4 March 2008
OUTLOOK

ABN-AMRO NZ Day 4 March 2008
Outlook for next few years market activityNew Zealand• Strong infrastructure market• Steady non-residential, offsetting expected weakness in residential markets
Australia• Residential expected to remain steady• Non-residential and infrastructure activity declining
US• Significant decline in US housing forecast to impact on non-residential activity• Government spending on health and education provides some offset to this decline
Europe• Forecast declines in major residential markets of Spain and UK• Eastern Europe expected to be strong
Asia• Continued market growth expected in a competitive environment
Source: Infometrics BIS Feb 08

ABN-AMRO NZ Day 4 March 2008
Outlook 2008Markets• Economic uncertainty in key markets complicates forecasting financial performance
Formica• Continued focus on integrating Formica with existing business lines • Completion of restructuring and profit improvement projects• Realisation of expected synergies
Strategy• Continue to reassess business portfolio and exit non-strategic operations• Pursuit of growth in key areas will be the primary focus• Acquisitions will be considered on an opportunistic basis
Outlook• We maintain our guidance for the full year to 30 June 2008 of a NPAT between
NZ$450-460 million which is in line with the analysts consensus forecast
Source: Infometrics BIS Feb 08
