overview financial restructuring discussions, business ......overview of the financial restructuring...
TRANSCRIPT

Overview of the Financial Restructuring Discussions,
Business Plan 2017-2019 & Q1 2017 results
May 12th, 2017

Disclaimer
2
This presentation has been prepared by CGG S.A. (“CGG”) in the context of the negotiations between it and certain of its creditors and other
stakeholders in respect of a potential restructuring plan. It is not intended for, and may not be used for, any other purposes.
This document contains forward-looking statements, which involve risks and uncertainties, including statements regarding certain key financial
indicators. Such forward-looking statements are management objectives and do not constitute profit forecasts as defined in European regulation
(EC) 809/2004 . The business plan highlights presented herein are notably based on hypotheses built by the management and market
environment estimates. Forward-looking statements for the 2017, 2018 and 2019 financial years have been established in an unstable and volatile
environment which make it difficult to determine with a satisfactory degree of certainty the future performances of the group.
Although CGG believes its business plan highlights presented herein are based on its reasonable assumptions at the time about future events,
these statements are subject to numerous risks and uncertainties. As a result, actual results may differ materially from those that we expected.
A description of the risks to which the CGG group is exposed appears in section 3 “Risk Factors” of the CGG’s “Document de référence” and in
Item 3 of CGG’s annual report on Form 20-F, filed with the French financial markets authority (AMF) and the Securities and Exchange Commission
(SEC), respectively, on 1 May 2017. The forward-looking statements contained in this document are based upon information available to CGG on
the date of this document. CGG does not undertake to update or revise any of these statements to take account of events or circumstances arising
after the date of this document or to take account of the occurrence of unexpected events.

Agenda
Q1 2017 results
Update on the Financial Restructuring Process
2017-2019 Business Plan
Characteristics of the targeted Financial Restructuring
Main Economic Terms of the Company’s Proposal
Conclusion
3

1st Quarter 2017 Financial Results Year-on-year stable EBITDA in a traditionally low seasonal quarter

Q1 2017 key highlights: in line with expectations
5
Revenue at $249m
GGR stable, with resilient Mutli-Client quarterly performance in traditional low seasonality
Particularly low Equipment sales
Acquisition down due to reduced fleet in stable price environment
EBITDAs at $29m
Operating income at $(67)m
Marine asset-light strategy Launch of Global Seismic AS, co-owned with Eidesvik
Up to 5 vessels chartered by CGG
Reduced operating vessels charter rate
Oceanic Vega, at work in Mexico in Q1 2017
Nano-scale geoscience, GeoConsulting, Robertson

6
Total revenue at $158m, (4)% y-o-y
Multi-Client at $72m, up 32% y-o-y
Multi-Client sales particularly active in North Sea and GOM
Prefunding sales at $53m and after-sales at $19m
High cash prefunding rate at 110%
Stable 29% fleet allocation to multi-client programs
Fleet allocation to multi-client programs expected to be c. 40% in Q2 and c. 35% in Q3 2017
Subsurface Imaging (SI) & Reservoir at $86m, down (21)% y-o-y
Completion of large reprocessing contracts Lag time between acquiring and processing data
EBITDAs at $80m
Operating income at $18m, a 12% margin
Margin improvement y-o-y driven by higher after-sales
GGR: resilient in low seasonal quarter

7
Total sales at $32m, down (56)% y-o-y
Sales split: 58% Land and 42% Marine Land sales: low volume with however downhole
business strengthening Marine sales: only driven by repair and
maintenance this quarter Internal sales at $7m versus $11m in Q1 2016
EBITDAs at $(9)m
Operating income at $(16)m
Continued efforts to further reduce breakeven
Highly sensitive to volume
Equipment: particularly low activity

Total revenue at $67m, down (25)% y-o-y
Marine revenue at $45m, down (23)% y-o-y
Fleet reduction from c. 6 vessels in Q1 2016 to 5 vessels in Q1 2017 with stable allocation to marine contractual activities (71% in Q1 2017)
Outstanding fleet operational performance with 98% production rate and 91% availability rate
Land & Multi-Physics total revenue at $22m, down (29)% y-o-y
Low market activity, slow client decision process
EBITDAs at $(25)m
Operating Income at $(39)m Impacted by mobilization on 2 large surveys and vessel swap
Contractual Data Acquisition: continuing competitive market environment
8

EBITDAs at $(8)m
Including Coral maritime shake down costs
Operating Income at $(20)m
Amortization of excess streamers and lay-up costs
Global Seismic Shipping AS enforced in Q2
5 cold-stacked vessels transferred to the new company
Non-Operated Resources (N.O.R)
9

Q1 2017: P&L
Group EBITDAs at $29m, EBITDAs excluding NOR at $37m
Group OPINC at $(67)m, OPINC excluding NOR at $(47)m
Net Income at $(145)m 10
In Million $ Q1 2016 Q1 2017Total Revenue 313 249Group EBITDAs excluding NOR 37 37
NOR (10) (8)
Group EBITDAs 27 29Group OPINC excluding NOR (54) (47)
NOR (27) (20)
Group OPINC (81) (67)Equity from Investments 5 3
Non-recurring charges (6) (30)
Net financial costs (41) (48)
Taxes (6) (2)
Net Income (130) (145)

EBITDAs at $29m, up 6% y-o-y
Operating Cash Flow at $34m, down (86)% y-o-y
As anticipated, low positive working capital effect at $13m in Q1 2017 compared to a very strong $218m in Q1 2016
Capex at $68m, down (23)% y-o-y
Multi-client cash capex at $48m
Industrial capex at $13m
Free Cash Flow at $(74) m versus $118m last year
Cash-outs related to the Transformation Plan:
• $(45)m in Q1
• Including $(9)m related to financial restructuring cash costs
11
Q1 2017: low Free Cash Flow as expected

12
Debt and Liquidity by end March Group Net Debt at $2,335m as of March 2017
Group Liquidity at $391m
Maintenance covenants disapplied at March–end
Q1 2017: debt evolution
* Negative FCF including cash NRC

Outlook
13
Market conditions: 2017 outlook unchanged
2017 operating results expected to be in line with 2016
Multi-client cash capex expected to be at $250-300m, with cash prefunding rate above 70% and industrial capex at $75-100m
Cash generation expected to be lower in 2017 due to lack of positive change in working capital versus 2016
Industrial Transformation Plan mostly achieved
Financial restructuring ongoing
To align CGG capital structure with business plan perspectives

Update on the Financial Restructuring Process

Status on Restructuring Discussions (I)
15
In the light of market environment assumptions assumed in the 2017-2019 Business Plan and of the corresponding industrial and financial expected performance, CGG proposed on March 3rd, to significantly reduce debt levels and related cash interest costs to align them with its cash-flows.
The envisaged financial restructuring path would involve the full conversion of unsecured debt into equity and the extension of the secured debt maturities
The Company, under the aegis of the Mandataire Ad Hoc designated early March, wished then to engage restructuring discussions with its main stakeholders: the Lenders holding Secured and Guaranteed Debt for a c. $0.8bn principal amount, the Holders of Unsecured and Guaranteed Senior Notes for a c. $1.9bn amount, the Holders of Unsecured and Not Guaranteed Convertible Bonds for a c. $0.4bn principal amount, and the Shareholders
CGG’s stakeholders have organized themselves into committees / ad hoc groups with legal and financial advisors to facilitate such restructuring discussions, collectively the “Stakeholders” • the “Secured Lenders Coordinating Committee” • the “ad hoc Committee of Senior Notes” (HYB) • JGInvestment in its capacity and as a representative of the masses of holders of OCEANEs (Convertible Bonds) • DNCA • Two other significant shareholders, Bpifrance Participations and AMS Energie

Status on Restructuring Discussions (II)
16
A number of creditors and shareholders signed non-disclosure agreements (NDA) with the company to begin more detailed discussions on the terms of a restructuring, under the aegis of the Mandataire ad hoc. The terms of these non-disclosure agreements required the cleansing of the information provided herein
Discussions have focused on the terms of a transaction which addresses the capital structure constraints of the company. CGG has informed the stakeholders of the importance of reaching an agreement in advance of the 2020 Senior Notes interest payment due on May 15th
Extensive discussions between CGG and its Stakeholders over several weeks on the terms of a financial restructuring plan to address its capital structure constraints
The Company has put forward a proposal that is in its corporate interest, preserves the Group’s integrity and provides a framework for long-term sustainability for the Company’s businesses, employees and customers. In addition, it offers to current Shareholders an opportunity to participate in the Company recovery.
This proposal is supported by DNCA (in its capacity of a long standing institutional shareholder, bondholder and convertible bondholder of the Company) and the Secured Lenders Coordinating Committee. The proposal does not have the support of other Stakeholders. The proposals put forward by other Stakeholders can be seen in the in the ‘Overview of the Business Plan & Financial Restructuring Proposal’ presentation.
We will continue to negotiate the terms of a comprehensive restructuring transaction that meets the Company’s key objectives with our Stakeholders, and will strive to obtain sufficient support from all of their constituencies, although there can be no assurances in that respect.

2017-2019 Business Plan

SHORTAGE IN OIL RESERVES TRIGGERING A NEW EXPLORATION CYCLE
Unconventional: a strong swing factor
Clear shortage in oil reserves expected by 2020 due to the current scant exploration efforts and the low rate of discoveries in the past few years
Business plan anticipates a modest increase in exploration beginning H2 2018
RESURGENCE IN THE OIL PRICE
Price recently stabilized at around $40-50/barrel
Business Plan based on oil price remaining in the region of $50-65/barrel over the next 2 years
$53 $50
$70
$80 $80 $80
2015A 2016E 2017E 2018E 2019E 2020E
Brent Crude ($/bbl) Brent Futures ($/bbl)
Market Environment
18 Source: Bloomberg, Bernstein Estimates, Brokers’ Estimates
Brent Crude Evolution ($/bbl) Reserve Replacement Ratio and Exploration Spending
0%
10%
20%
30%
0%
50%
100%
150%
200%
1994 1996 1998 2000 2002 2004 2006 2008 2010 2012 2014 2016
Reserve Replacement Ratio Exploration Spending (% of E&P Spending)
13%
35%

Market Environment by Segment
19
Geology, Geophysics & Reservoir: Resilient market in 2016, will remain impacted by the fall in E&P investments and by the diminished appetite for offshore exploration Multi-Client: A market under pressure, but demand increasing vs. contractual A more competitive landscape with one competitor leveraging on its strong balance sheet Client sales tend to materialize after securing a block in a licensing round
Subsurface Imaging and Reservoir: A 2017 market expected to further decrease from lag time between shooting and processing data
DEEPWATER EXPLORATION & APPRAISAL SPENDING ($ BN) SUBSURFACE IMAGING: 3RD PARTY RECEIVED BIDS JANUARY 2013 TILL MAY 2016 (12 MONTHS RUNNING AVERAGE)
05
101520253035404550
2006 2008 2010 2012 2014 2016 2018E 2020E
020406080
100120140
01/0
1/13
01/0
3/13
01/0
5/13
01/0
7/13
01/0
9/13
01/1
1/13
01/0
1/14
01/0
3/14
01/0
5/14
01/0
7/14
01/0
9/14
01/1
1/14
01/0
1/15
01/0
3/15
01/0
5/15
01/0
7/15
01/0
9/15
01/1
1/15
01/0
1/16
01/0
3/16
01/0
5/16
Total Received Rolling 12 MonthsTotal Received wo Cancelled Rolling 12 Months
Source: Wood Mackenzie Exploration Service

Market Environment by Segment (cont'd)
20
Equipment: after a 70% decline in two years, market now stabilizing No sign of an imminent upturn; however market could improve by 2018
Sercel’s market shares well preserved
Marine equipment market will be driven by need to replace streamers reaching end of useful life. Replacement cycle should begin in 2018, depending on clients’ financing capacity
Land rebound should be driven by demand for latest technology products and large crews in the Middle East
Contractual data acquisition: depressed market with no expected improvement in 2017 Marine: Market & prices stabilized at the lowest level
Increasing use of seismic vessels for Multi-Client surveys, either at the request of clients (increasing number of calls for tenders), or due to the contractors’ choice (WesternGeco, CGG)
Changes in prices by 2017-2018 very difficult to predict due to the “elasticity of supply” (numerous cold-stacked vessels could return)
Land
Lower number of projects and calls for tenders, in line with the drop in E&P investments
Pressure on prices due to number of market participants with idle teams

Value Creation in Geosciences Market
21
Rebound of E&P Capex before the end of the decade Developing new oil & gas reserves needed Supply-side short-fall Exploration rebound before 2020
Enhancing the recovery of existing oil & gas fields required Key issue for existing oil producers of mature fields More production expenses dedicated to geosciences to get a better understanding of oil field behaviors
Flexible business models Inception of non-conventional resources in energy world making future less predictable
Tight management of assets & human resources
Providing customers with the best out of their data Value to come from sharper imaging, improved predictions, better interpretation, etc.
Winners to be “flexible asset-light data value-driven” with less dependence on contractual acquisition But strong value in keeping an integrated group to provide complete geoscience solutions to our
customers

Strong Value in Keeping an Integrated Group to Provide Complete Geoscience Solutions to Our Customers
22
Sercel (Equipment)
Data Acquisition
Subsurface Imaging & Reservoir
Multi - Client
CGG JVs (Argas, SBGS - acquisition in specific territories…)
Supplier
Product testing
Intelligence on acquisition patterns
New data
Imaging
Shared customer relationships/cross-selling
Imaging
Interpretation
New/old data
Vessel utilization optimization Capacity assistance and expertise
Privileged Access
Privileged Access

CGG Strategy for Value Creation
23
Industrial transformation plan completed with a new business mix : GGR 60%+, Equipment 20-25% and Data Acquisition 15-20%
A more flexible company cost structure Sercel break-even point drastically lowered, leading to a high sensitivity to revenue increase
Very limited new investments needed for our 5 seismic vessel fleet
Adaptation of the Imaging & Reservoir headcount focusing on profitable centers
Asset-light model, Contractual Data Acquisition capital employed now down to 11% (from 48%) Capital Employed of Contractual Data Acquisition at $0.4 BN as of Q4 2016 from $3.4 BN as of Q3 2013
Overall Capital Employed decreased at $3.5 BN as of Q4 2016 from $7.1 BN as of Q3 2013
An ability to provide more content to geophysical data with our geoscience expertise Comprehensive range of leading geological, geophysical and reservoir capabilities
Integration at the heart of our strategy with Multi-Client embedding all available in-house expertise
Technology and Service quality for innovative solutions and technological step-changes

Selected Financial Targets
24
FYE 31/12 2016A 2017E 2018E 2019E
Revenue $1.2 BN
In line with 2016A results
~$1.5 BN ~$2.0 BN
EBITDA Margin (1) 27.4% 35.0% - 40.0% 37.5% - 42.5%
MC Capex $295 MM $275 – 325 MM
Industrial Capex $71 MM $100 – 125 MM
R&D Capex $34 MM Stable at c.$35 MM
Change in Working Capital $198 MM Negative – In line with revenue growth
(excluding ~$50 MM Pemex accelerated factoring in 2017)
Cash Transformation Cost $167 MM $80 MM $15 MM $10 MM
(1) Company historical Seasonality of EBITDA is significantly weighted to H2. H1 2017 is expected to be impacted by fleet transition, more contractual activity than multi-client and lower volumes in Sercel

2013A MID-TERM OBJECTIVE
Business Mix Evolution
2016A
44%
34%
22%
ContractualAcquisition
GGR Equipment
~60%+
~20-25%
~15-20%
ContractualAcquisition
GGR Equipment
Total revenue: $1.2 BN Total revenue: ~$2.0 BN
19%
66%
15%
ContractualAcquisition
GGR Equipment
Total revenue: $3.8 BN
25

383
401
2016
Geology, Geophysics & Reservoir (GGR)
26
Multi-Client to be highly selective in terms of new programs in order to maintain a good pre-funding level above 70%
Multi-Client growth expected from after sales which will be driven by StagSeis data in GOM, Brazilian licensing rounds and Mexico
Subsurface Imaging & Reservoir (“SIR”) market to recover from 2018 onwards
Sustained market for SIR reprocessing
MC Revenue SI & Reservoir
GGR Revenue (In million $)
784
• GGR revenues back close to 2015 level in 2019
• c.20% growth per year over the recovering period 2018-2019
• Multi-Client revenues representing between 50% and 55% of GGR revenues
(1) Does not include approximately 25% of SIR business volumes which represent internal sales
(1)
2016
Equipment
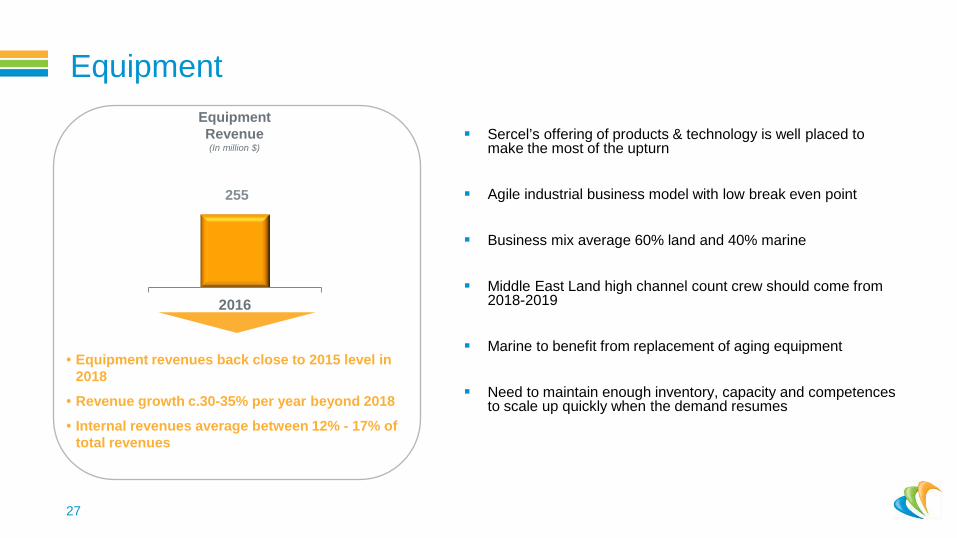
27
Sercel’s offering of products & technology is well placed to make the most of the upturn
Agile industrial business model with low break even point
Business mix average 60% land and 40% marine
Middle East Land high channel count crew should come from 2018-2019
Marine to benefit from replacement of aging equipment
Need to maintain enough inventory, capacity and competences to scale up quickly when the demand resumes
Equipment Revenue (In million $)
• Equipment revenues back close to 2015 level in 2018
• Revenue growth c.30-35% per year beyond 2018
• Internal revenues average between 12% - 17% of total revenues
255

2016
Contractual Data Acquisition
28
Marine
2017 boosted by Pemex and Kosmos surveys
Price and volume could recover from 2018, depending on the supply side (some vessels could return)
Land & Multi-Physics
Land projects expected in Africa and emerging markets
Multi-Physics benefiting from mining market rebound
Global Seismic Shipping AS
A new asset company owned 50/50 by CGG and Eidesvik with 7 vessels, 5 being chartered by CGG
Allow improved competitiveness by reducing charter rate and achieve material liquidity improvement
Contractual Data Acquisition Revenue (In million $)
• Contractual Data Acquisition revenues representing 15% - 20% of Group revenues
• Marine Contribution representing “only” 10% - 13% of Group revenues
232

Characteristics of the targeted Financial Restructuring

CGG’s Priorities
30
Protect the corporate interest of the Company and the full value of its businesses
Timetable to deliver the targeted Financial Restructuring is of the essence in the present market environment
Preserve the Group’s integrity
Highly interlinked technologies, Production Units and Geographies
Provide a framework for long-term sustainability for the Company’s businesses, employees and customers
CGG is a Services Company which value is mostly made by Clients and People
Put the Company in a safe harbor from a Liquidity viewpoint to face any possible delay in the Geoscience Market recovery
Find a solution respecting at best the existing interest of each stakeholder and their ability to take part in the Company’s recovery
The rights and weights of the stakeholders are heterogeneous, depending notably of their subordination rank, and will have to be eventually balanced and fulfilled under the authority of French and US Court
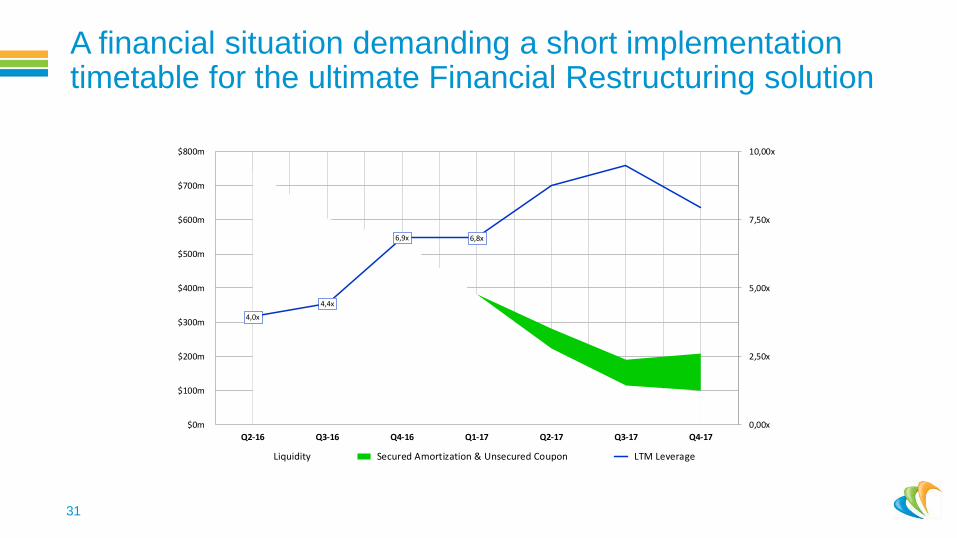
A financial situation demanding a short implementation timetable for the ultimate Financial Restructuring solution
31
4,0x
4,4x
6,9x 6,8x
0,00x
2,50x
5,00x
7,50x
10,00x
$0m
$100m
$200m
$300m
$400m
$500m
$600m
$700m
$800m
Q2-16 Q3-16 Q4-16 Q1-17 Q2-17 Q3-17 Q4-17
Liquidity Secured Amortization & Unsecured Coupon LTM Leverage

Overview of the Financial Restructuring Objectives
32
Fully address legacy Maritime Liabilities and the Nordic Debt restructuring (achieved in Q1)
Substantial Group deleveraging through a full equitization of the unsecured debt
c.$2.0bn (principal and due coupons) to be converted into equity
Extension of the maturity of the secured debt to 2022 (5 year from Restructuring Closing Date)
Significantly improve liquidity position both to protect the Company in the event of operational sensitivities and to be able to finance growth at recovery time
33
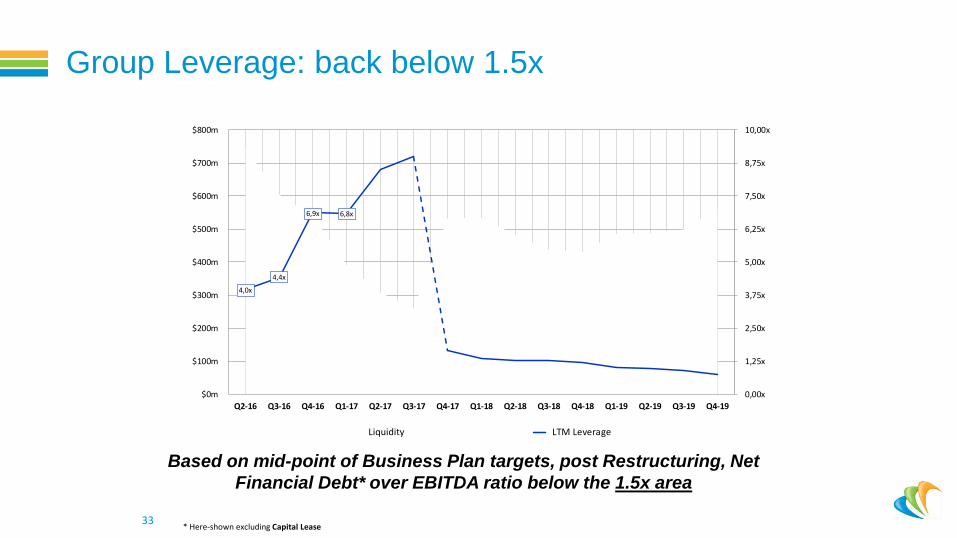
4,0x
4,4x
6,9x 6,8x
0,00x
1,25x
2,50x
3,75x
5,00x
6,25x
7,50x
8,75x
10,00x
$0m
$100m
$200m
$300m
$400m
$500m
$600m
$700m
$800m
Q2-16 Q3-16 Q4-16 Q1-17 Q2-17 Q3-17 Q4-17 Q1-18 Q2-18 Q3-18 Q4-18 Q1-19 Q2-19 Q3-19 Q4-19
Liquidity LTM Leverage
Based on mid-point of Business Plan targets, post Restructuring, Net Financial Debt* over EBITDA ratio below the 1.5x area
* Here-shown excluding Capital Lease
Group Leverage: back below 1.5x
34
$(250)m
$(150)m
$(50)m
$50m
$150m
$250m
$350m
$450m
$550m
$650m
$750m
$(250)m
$(150)m
$(50)m
$50m
$150m
$250m
$350m
$450m
$550m
$650m
$750m
Q2-16 Q3-16 Q4-16 Q1-17 Q2-17 Q3-17 Q4-17 Q1-18 Q2-18 Q3-18 Q4-18 Q1-19 Q2-19 Q3-19 Q4-19
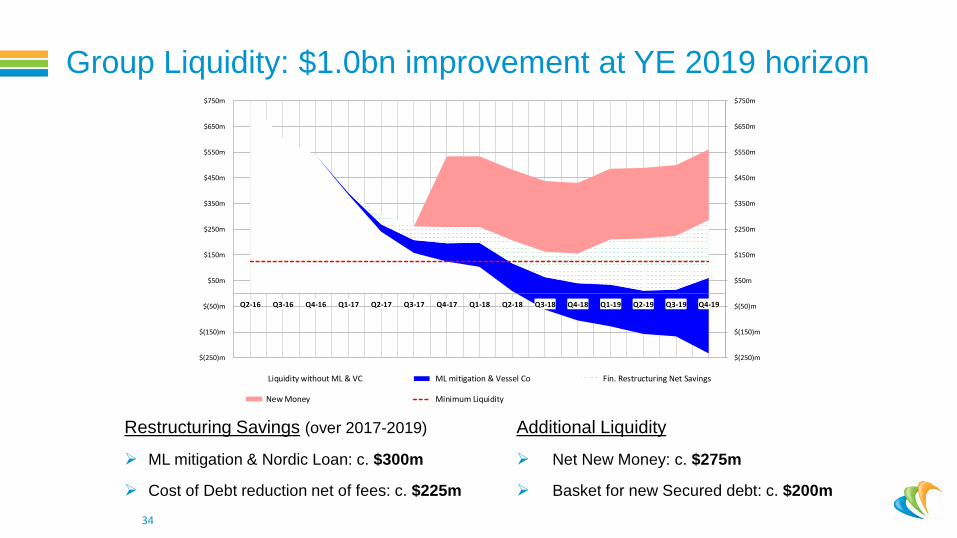
Liquidity without ML & VC ML mitigation & Vessel Co Fin. Restructuring Net Savings
New Money Minimum Liquidity
Restructuring Savings (over 2017-2019)
ML mitigation & Nordic Loan: c. $300m
Cost of Debt reduction net of fees: c. $225m
Additional Liquidity
Net New Money: c. $275m
Basket for new Secured debt: c. $200m
Group Liquidity: $1.0bn improvement at YE 2019 horizon
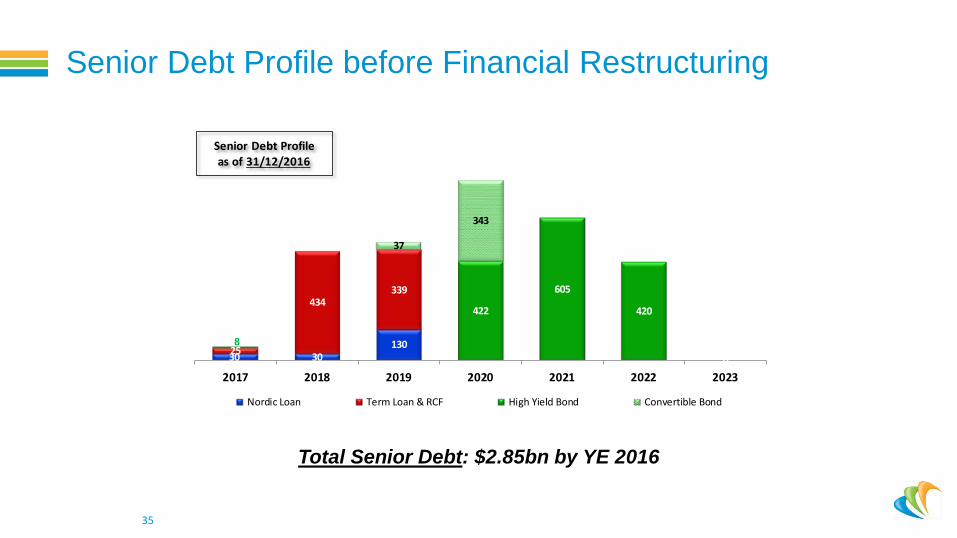
35
Total Senior Debt: $2.85bn by YE 2016
30 3013025
434339
8
422
605
420
0
37
343
2017 2018 2019 2020 2021 2022 2023
Nordic Loan Term Loan & RCF High Yield Bond Convertible Bond
Senior Debt Profileas of 31/12/2016
Senior Debt Profile before Financial Restructuring

36
Total Senior Debt: $2.75bn by end of Q1 2017
25
434339
428
676
420
0
37
348
2017 2018 2019 2020 2021 2022 2023
Term Loan & RCF High Yield Bond Convertible Bond
Senior Debt Profileas of 31/03/2017
Debt Profile post Maritime Liabilities & Nordic Restructuring

37
Total Senior Debt: $1.05bn post Restructuring Average Cost of Debt: 7.0% Cash (= $80m FY18) + 4.5% PIK
715
350
2017 2018 2019 2020 2021 2022 2023
High Yield Bond Secured High Yield Bond 2nd Lien
Senior Debt Profilepost Restructuring
Senior Debt Profile post targeted Financial Restructuring
Main Economic Terms of the Company’s Proposal dated May 11th

Company Proposal: Equitization of the Unsecured Debt
39
SUMMARY OF MAIN ECONOMIC TERMS
Reserved Capital Increase to HY Bondholders
$1,601m to be converted into Equity (except for the portion potentially used in the backstop of the rights Issue)
Exchange at Par for Shares at $4
Reserved Capital Increase to Convertible
Bondholders
$383m to be converted into Equity
Exchange at Par for Shares at $15
Issue of Warrants in favor of Original
Shareholders
Warrants 1 at $4 / 5 year maturity
1.2 Warrant for 1 Share (= 4.15% capital on a fully diluted basis)

Company Proposal: New Money
40
SUMMARY OF MAIN ECONOMIC TERMS
$75m Rights Issue with Warrants (ABSA) limited
to Existing Shareholders
Issuing New Shares at $2 coupled with Warrants 2 at $5 / 5 year maturity 1 Warrant for 1 New Share (= 5.85% capital) Open to all existing shareholders (before equitization of the HY Bonds and the Convertible
Bonds) 10% Backstop fee payable in cash to those parties who provide the backstop in cash Backstop: the possibility of backstopping the Rights Issue is available to the existing
shareholders for a specified period, failing which the Rights Issue will be backstopped by all the HY Bondholders by way of set off of their claims under the HY Bonds
$350m New HYB provided by the
Unsecured Lenders
Issuing new high yield bonds at par coupled with 15.5% Penny Warrants (fully diluted basis before other Warrants)
Including a $25m tranche offered to Convertible Bondholders Libor + 4% cash + 8.5% PIK 6-years maturity post Closing Date 10% Backstop Fee payable in cash to those parties providing the backstop Backstop:
$325m initially backstopped by HYB ad hoc Committee with participation offered to all HY Bondholders within a specified period of time
$25m backstopped by Convertible Bondholders
Use of net Proceeds: c. $100m to repay the Secured Loan / c. $275m Group Liquidity

Reinstatement of the outstanding c. $800m US and French Revolving Credit Facility + Term Loan B
o Up to $100m prepaid at Closing
o Secured Bond format
o 5 year maturity
o Libor (floored 1%) + 6.5% cash / 2.5% PIK
o No maintenance covenant except $185m minimum liquidity
o Basket for up to $200m additional pari passu secured debt under a 2.5x leverage cap
41
Company’s Proposal: Reinstated Secured Debt
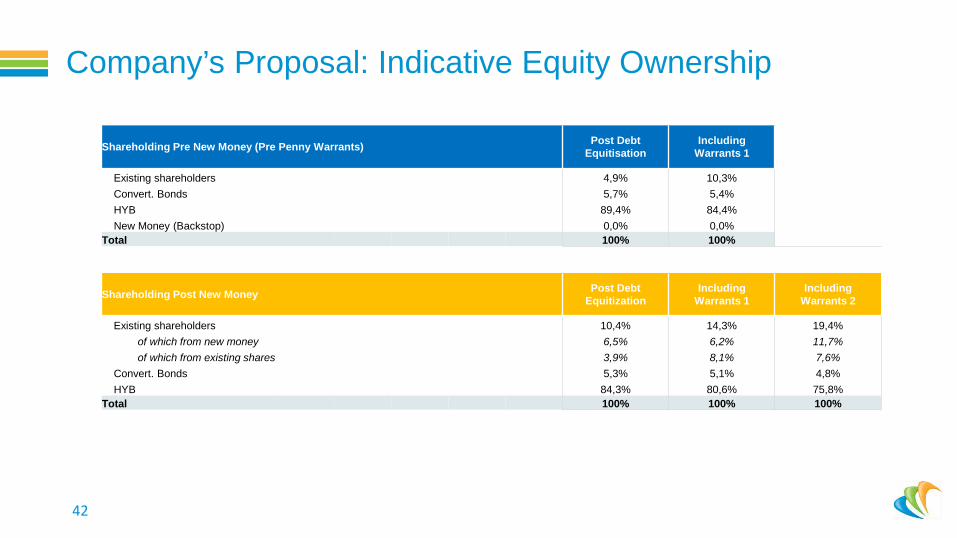
42
Shareholding Pre New Money (Pre Penny Warrants) Post Debt Equitisation
Including Warrants 1
Existing shareholders 4,9% 10,3% Convert. Bonds 5,7% 5,4% HYB 89,4% 84,4% New Money (Backstop) 0,0% 0,0%
Total 100% 100%
Shareholding Post New Money Post Debt Equitization
Including Warrants 1
Including Warrants 2
Existing shareholders 10,4% 14,3% 19,4% of which from new money 6,5% 6,2% 11,7% of which from existing shares 3,9% 8,1% 7,6%
Convert. Bonds 5,3% 5,1% 4,8% HYB 84,3% 80,6% 75,8%
Total 100% 100% 100%
Company’s Proposal: Indicative Equity Ownership

Conclusion

Differences from Company’s Proposal
44
Key differences between the main economic terms of the Company’s Proposal and the proposals or positions of certain other Stakeholders:
Exercise price and duration of the warrant package
Conversion price of the Convertible Bonds
Provision of free shares to existing shareholders
Structure upon which New Money is provided
Terms of the backstop and lockup agreement
Details of the main economic terms of the Company’s Proposal and the other Proposals in the ‘Overview of the Business Plan & Financial Restructuring Proposal’ presentation included in May 12, 2017 press release

Next Steps
45
Company’s Proposal: Pursue discussions related to economic terms and final legal documentation including lockup
agreements
Seek to broaden support from Stakeholders
Interest on the 5.875% Senior Notes due on May 15th 2017 Put on hold during the 30-day grace period
Preparation for voluntary Court proceedings in multiple jurisdictions to fully implement the financial restructuring
In parallel with our financial restructuring process, we remain focused on our high level of services to our customers and quality of our integrated product offerings

Thank you