overseas workers, remittances, and household welfare in ... · jessaine sugui soraya 6th pep...
TRANSCRIPT

For more information about the 6th PEP Research Network General Meeting, Please visit: www.pep-net.org
Overseas Workers, Remittances, and Household Welfare in the Philippines
Jessaine Sugui Soraya
6th PEP Research Network General MeetingSheraton Lima Hotel, Paseo de la Republica 170
Lima, Peru June 14-16, 2007

Overseas Workers, Remittances, and Household Welfare in the Philippines
Jessaine Soraya C. Sugui Southeast Asian Regional Center for Graduate Study
and Research in Agriculture (SEARCA) [email protected] [email protected]
Michael M. Alba, Ph.D. Economics Department
De La Salle University Manila [email protected]
Arnelyn May Abdon Institute for Development and Econometric Analysis (IDEA), Inc.
Maricar Paz M. Garde [email protected]
March 7, 2007
Abstract The implications of migration and remittances to households’ welfare and income distribution are increasingly becoming important issues. This is especially true for developing economies, which account for the bulk of the migrants and receive most of the remittances. The Philippines is one of the largest labor-exporting countries in the world, and remittance receipts account for at least ten percent of the GDP. This study examines the implications of remittances to Filipino households. Specifically, it aims to: 1) describe the characteristics of Filipino migrants, 2) examine how these characteristics affect the incidence and amounts of remittances at the margin, 3) evaluate how remittances affect household consumption patterns, and 4) compare welfares of remittance-receiving and non-receiving households. The study is expected to provide a sound and complete analysis of the issue and serve as a resource to scholars and policymakers.

1. Rationale Large-scale international migration has occurred in the recent years, prompting both policymaker and scholars to assess its impacts on welfare and growth. The data is still far from comprehensive, but World Bank (2006) estimates that 200 million people live outside of their country of birth. The stock of migrants worldwide, as Table 1.1 shows, went up to 4.4 percent from 1982 to 1990. On the other hand, the stock of migrants in developed countries grew by three percent from 1990 to 2000. Driven by the divergence of incomes and living standard, developing-country citizens have gone overseas in droves to work, in the hopes of improving their lives. An important by-product of migration is remittances, or the money overseas workers send to their families back home. In 2004, total remittances reached US$ 216 billion, with about US$ 152 billion received by less developed countries. Ratha (2003) states that remittances to developing economies, valued at US$ 72.3 billion, exceeded total official flows and private non-FDI flows in 2001. The magnitude of remittance flows has significant impacts to the receiving economies, especially since most of these monies flow to cash-strapped developing countries. On the positive side, the increased currency inflows have possibly raised the welfare of recipient households directly (through higher incomes or expenditures, lower income risks or smoother time profiles of consumption expenditures, longer leisure times, or longer search durations as a consequence of higher reservation wages) and the rest of the economy indirectly (through the multiplier effects of higher incomes and consumption expenditures and by affording more latitude for fiscal and monetary management). Moreover, to the extent that remittance receipts are used to make human and physical capital investments or to finance new ventures and entrepreneurial activities and to the degree that overseas workers are socialized into more efficient working environments and acculturated in societies with more responsive and accountable governance systems, the monetary investments and changed expectations additionally enhance the economy’s potential for long-term growth. On the negative side, to the extent that the more skilled and employable workers are the ones who migrate, the economy’s growth is restricted by the lower capabilities of the workers left behind. Moreover, the income distribution can worsen between remittance-receiving and other families, which can increase social tensions. In addition, social problems can arise from the long periods of separation between migrant workers and their families, such as those associated with poor rearing of children who grow up with relatives as well as with couples who grow apart. While important and interesting, these issues and particularly their quantitative impact on the economy have remained relatively unexplored in the past. This is beginning to change though as multilaterals such as the World Bank has taken great interest in international migration and its implications. In fact, the 2006 Global Economic Prospects was devoted to these issues. This study focuses on the Philippines, which is one of the largest labor-exporting countries in the world. The exodus of contract workers abroad has resulted in strong remittance flows. From 2001 to 2006, as Table 2 illustrates, remittances more than doubled from USD6 to USD12.7 billion. Remittances posted a record 25 percent annual growth in 2005, and accounted for 14 percent of Gross Domestics Product (GDP) during the same year. Needless to say, this phenomenon has a huge impact on the country’s economy. World Bank (2006a) credits the strong performance of remittances and exports for insulating the current account from high oil prices in 2006. Furthermore, remittance receipts are perceived

to have reduced consumption volatility and served as a safety net of the country (World Bank, 2006a). Given these observations, remittances exhibit a good potential to positively contribute to the economy. The Philippines is one of the laggard economies in East Asia with 30.4 percent of the population living below the poverty line in 2003. Given the continuous trend in deploying overseas workers and the potential gains from remittances, it is important to analyze the impact of remittance receipts on Filipino households. The main purpose of this study is to examine in depth the implications of remittances on the consumption patterns and well being of Filipino households. More specifically, it aims to: 1) describe the characteristics of Filipino migrants, 2) examine how these characteristics affect the incidence and amounts of remittances at the margin, 3) evaluate how remittances affect household consumption patterns, and 4) compare welfares of remittance-receiving and non-receiving households. The study intends to answer the following research questions:
(1) What are the socioeconomic characteristics of Overseas Filipino Workers (OFWs)?
(2) How do these socioeconomic characteristics relate to remittances? (3) How do remittances affect household consumption patterns? (4) How do remittances influence welfare outcomes of receiving and non-receiving
households?
At the end of the research project, we should be able to provide a solid analysis on the impacts of remittances on Filipino households’ welfare and provide some policy insights. 2. Scientific Contribution of the Research and Knowledge Gaps Labor migration and remittances have recently started attracting the interest of researchers. The literature has looked at the effect of these phenomena at the micro and macro levels. Studies have examined their impact on poverty, inequality, labor supply, and household consumption and asset accumulation. Motivations for Remittance flows There are a number of studies that explored the factors that determine remittance flows to migrant’s home country. Motivations such as altruism, loan repayment to family’s investment, risk diversification, and self-interests have been cited to affect the migrant’s decision to remit. Demographic attributes of the migrant and the origin family also influence remittance decisions. Home location’s development is another consideration for migrants to remit money. Altruism. Osili (2006) finds that migrant’s transfers to the origin family are motivated by altruistic considerations, as Nigerian origin families with fewer asset holdings receive larger transfers. However, remittances for financial investments are higher for origin families that have higher household resources. For the Philippines, income from abroad takes a larger share in the portfolio of higher income deciles (Burgess and Haksar, 2005). This suggests that the upper income Filipino households derive a larger share of capital income from abroad. The altruistic motive is also reflected by the countercyclical impact of remittances on receiving households as remittances rise during periods of adverse economic shocks

(Burgess and Haksar, 2005). Yang (2005) examines the Filipino households’ responses to overseas members’ economic shocks, specifically exchange rate shocks. His study used data from 1997-1998 when most overseas workers’ currencies appreciated against the Philippine peso due to the Asian crisis. As a result, household remittances received from abroad increased. Yang and Choi (2005), on the other hand, show that remittances serve as insurance to households during rainfall shocks. When aggregate shocks cause local-level risk-coping mechanisms to fail, transfers from family members abroad may be used more heavily for consumption smoothing. Lucas and Stark (1985; 1988) posits an alternative theory to pure altruism, in which, remittances are part of a family’s cooperative contractual agreement. Net gains of the migrant and the family members at different points in time, other than altruism, ensure the contract’s enforceability. Mutually beneficial arrangements such as investment in migrant’s education and coinsurance promote remittance flows. Loan Repayment. Remittance may also represent the migrant’s repayment for the initial investment undertaken by the family to support migration (Poirine 1997). Parents invest in the education of their children and support migration costs in return for a share of the migrant’s income. Evidence from Botswana shows that receipts increase with the education of the migrant worker with whom investments were made (Lucas and Stark, 1985). A related result illustrate that migrants who were educated by the family earn higher wages but are expected to compensate the family (Stark and Lucas 1988). Risk Diversification. Lucas and Stark (1985) argue that migration serves as a coinsurance strategy to spread the risks faced by households. Hoddinott (1994) shows that having a migrant means that the household has a form of insurance against agricultural shock, while the migrant has the assurance of being supported by a household while establishing himself in the urban area or when he becomes temporarily unemployed. On the other hand, the Botswanian experience (Lucas and Stark, 1985; 1988) demonstrates that remittances are higher during droughts. More importantly, migrants remit in times of adversity in order to protect productive assets that are at risk such as cattle and land. Remittances allow the family to participate in more risky agricultural activities having the assurance that the migrant will support them during bad times. Self-interest. Self-interest motives to remit include the desire to inherit and the need for a careful maintenance of investment in assets in home area (Conway and Cohen, 1998; Lucas and Stark, 1985). If a migrant’s motive for supporting his family, particularly parents, is to maintain favor in the line of inheritance then one would expect a larger remittance the larger the potential inheritance. Since sons are likely to inherit in Botswana, evidence demonstrates that sons provide higher remittances to families with larger inheritable wealth (i.e. cattle). However, since sons commonly own cattle, it could also be that their remittance is for the maintenance and expansion of their herd. Similarly, Hoddinott (1994) posits that remittances are determined by, among others, the ability of the parents to bequeath lands to their sons. The case of western Kenya supports the author’s hypothesis. One of the findings shows that sons’ remittances are partly determined by parent’s bequests of lands. Osili (2006) using a two-period model postulates that migrants send remittances in the first period as a precautionary savings to smooth consumption in the second period in the event of return migration.

Demographic attributes. Attributes of the migrant such as skill, education, income, duration of absence, and age may affect the pattern and amount of remittances. Remittance rise with skill, education, and current income of the migrant (Lucas and Stark, 1985; Osili, 2006; Rodriquez, 1996). Older migrants are more likely to send remittances (Rodriguez 1996). Remittance falls with the duration of absence since ties at home weaken (Lucas and Stark, 1985; Rodriguez, 1996). Household heads frequently remit money and at higher amounts than other migrant members of the family (Lucas and Stark, 1985; Rodriguez, 1996). Characteristics of recipient households also influence the decision of migrant’s to remit. Household size and remittances are positively related (Osili, 2006). Increases in family resources or income tend to encourage remittances (Lucas and Stark, 1985; Osili, 2006). Remittance tend to flow in rural areas reflecting the lower investment costs incurred in such areas (Osili, 2006) but this contrasts with the Philippine case where urban households receive larger remittances (Rodriguez, 1996). Utilization of Remittances The life-cycle/permanent income hypothesis has stirred research and discussion on how consumption and savings behaviors of household are affected by remittance income. It has been used as a framework to understand remittance behavior. Romer, (.---) illustrates that an individual’s consumption in a given period is determined by income over his or her entire lifetime. Current consumption is determined by permanent income and the difference between consumption and permanent income is the transitory income. This implies that while transitory income such as windfall gain raises current income, its impact on current consumption is rather small, as this gain will still have to be allocated over the individual’s entire lifetime. Thus, when income is relatively high reflecting high transitory income, it follows that savings of individual is high as well. Alternatively, savings is negative when current income is less than permanent income. The model therefore suggests that if remittance is treated as a positive shock to transitory income, then remittance-receiving households should have high savings rate or have spent remittance incomes into productive assets to be used for future consumption. Savings are utilized to smooth consumption over time. The division of income into consumption and savings depends on the whether the individual prefer present vis-à-vis future consumption. There are evidence showing that remittance incomes are expended largely on the purchase of household’s basic necessities and consumer goods (Lipton, 1980; Reichart, 1981, 1982; Rubenstein 1983, 1992; Weist, 1984). Recent research, on the other hand, shows that remittance incomes are treated as a transitory income that prompts receiving households to invest such incomes to productive activities. Conway and Cohen (1998) have distinguished expenditures into consumptive and productive expenses. Consumptive expenses include family maintenance of food, clothing, and medicines, fixed capital stock like building homes, and property improvement, and pre-cautionary savings to avert effects of shocks. Fixed capital expenditure reinforces the return commitment of migrants. Productive investments include flexible human capital stock such as education and health, business enterprises, and savings for future and interest accumulation. Adams (1998) have analyzed the effect of remittances on rural asset accumulation in Pakistan. The author argued that with transitory income streams like remittances, the

marginal propensity to invest of remittance-receiving households increase. The model, using a five-year longitudinal data from rural Pakistan, indicates that external remittances have a stronger statistical effect on asset accumulation than total labor income. This is because households tend to treat external remittances as transitory income. The paper also finds that external remittances have a positive and significant effect on accumulation of rain fed and irrigated land, while domestic remittances do not have significant impact on the accumulation of any rural asset. In rural Egypt, migrant households have higher propensity to spend on housing, considered as a durable goods and most of the migrant investment goes to the purchase of land. Land is regarded as an investment since its value is not eroded by inflation and valuable investment for peasant migrants (Adams, 1991). Guatemala experience demonstrates that migrant households spend less on consumption expenditure than non migrant households. Again, households view remittances as a temporary stream of income and are spent more on children’s secondary schooling. A higher spending on household by the Guatemalans is also observed (Adams, 2005). Taylor and Mora (2006) supports the findings of Adams that remittance incomes are not disproportionately used up on consumption goods. The rural Mexican experience reveals that as total expenditure in households with migrants increase, the share of income used for investments also increase, while the share spent on consumption falls. Research also found that remittances have become a reliable source of capital. Recipients invested their remittances in land purchase and/or development of small-scale enterprises or farming operations (Conway and Cohen, 1998). Cox Edwards and Ureta (2003) show that remittances lessen school dropout rates in El Salvador. The study by De and Ratha (2005) finds that remittance flows improves the weight of Sri Lankan children below five belonging to female-headed household. Yang (2005) found that positive migrant shocks in the Philippines result in greater child education, a reduction in the incidence of child labor, higher educational expenditures in the migrant’s household, and increased participation in entrepreneurial activities. Consequences of Remittances The importance of remittance flows in the economies of developing countries has lead to the argument that remittance incomes have significantly promoted poverty and welfare outcomes. There is also doubt in the longer-term economic effects of such flows as it can also discourage the labor supply decisions of the working-age members of the migrant households. Concerns on brain-drain effects of overseas work may also dampen the positive impact of remittances in the long-run. Adams (2003) have constructed a new data set of 24 large labor-exporting countries to assess the pervasiveness of brain drain in the origin countries. His findings show that with respect to documented migration, most of the migrants to the United States and OECD countries have secondary and tertiary educations. Furthermore, international migration does cause brain drain in a handful of Latin American countries, but in 22 out of the 33 countries with educational attainment data, less than 10 percent of the population with tertiary education have migrated. Adams and Page (2003) studies the impact of international migration on poverty in developing economies. Their results indicate the following: 1) international migration has a strong effect on decreasing poverty, 2) distance plays a major role in migration with developing countries nearest to the USA or OECD countries having the highest rates of migration, 3) developing countries with middle income per capita yield the most number of migrants, and 4) remittances have a strong influence on poverty reduction.

Chalamwong (2004) looks, among others, the brain drain effect of migration in East Asia. His findings illustrate how the migration of Filipino nurses has exacerbated the poor situation in the health care sector. Some 12,300 Filipino nurses migrated between 1988 and 2000. The United States accounts for 83 percent of the total number of Filipino nurses overseas, followed by Australia and Canada. In the end, the author put forward a number of suggestions, including a return option program in East Asian countries to mitigate the brain drain. Rodriguez (1998) has assessed the impacts of international migration on household income and its distribution in the Philippines. Using 1991 data, he explored the topic using counterfactuals (migration and no migration regimes) and decomposition analysis. Both methods show that emigration raises household per capita income, although the magnitude is larger in the first approach. However, the results also indicate that remittances worsen inequality. Amuedo-Dorantes and Pozo (2005) looks at the effects of international remittances on labor supply and work allocations of Mexican households. The authors used an instrumental variable-Tobit model to assess the labor supply decisions of male and female recipients in urban and rural areas. Their paper reveals that an increase in remittances received by 100 Mexican pesos reduces men’s working hours in the formal sector, but increases these in the non-formal sector. The same is true for women workers. However, in the case of women workers in rural areas, a rise in remittances lead to greater time spent on non-paid work. Men who experience stable inflows spend more time on self-employment, while those that experience variability in receipts tend to work more in the informal sector. Rodriguez and Tiongson (2001) have assessed the effects of temporary international migration on the labor supply of urban households using 1991 data from the Philippines. The paper illustrates that households with migrant workers tend to have lower labor participation and work hours. This is because migrant relatives substitute income for more leisure. Male labor participation goes down when the overseas worker is part of the nuclear family. The same is true for women, except that female labor participation goes up when the migrant is educated. Furthermore, the authors find that an increase in remittances lead both genders to decrease their working hours, although the effect is stronger in the case of males. Cabegin (2006) has analyzed the impact of migration on the non-migrant’s spouse. The findings suggest, among other things, that women in migrant households with school age children are 28 percent less likely to hold a full-time job and 26 percent more likely to non-employed than women with school age children in non-migrant households. On the other hand, higher remittance income of a migrant wife decreases the husband’s labor participation in full-time employment These efforts have definitely helped bring migration and remittances to the fore of academic discussion. The literature is far from exhaustive however. For instance, the economic papers that focus on remittances in the Philippines are few and far in between. The studies of Rodriguez (1996, 1998) and Rodriguez and Tiongson (2001) all utilized data from 1991, and obviously, there is a need to look at the issue using more recent information. In addition, to our knowledge, no recently published study has made an in-depth analysis on the effect of international remittances on Filipino households. One aspect that has to be studied is how receiving households treat these monies: whether they are treated as transitory or permanent
income. Another noteworthy area to examine is how remittances are used in good and bad years. Existing studies on the Philippines have not commented on these issues. Lastly, the literature is silent on the link between the migrant’s characteristics, remittance flows, and how these funds are used. This paper aims to comment on these issues that are important, but for one reason or another, have not been thoroughly examined in the literature. 3. Methodology Theoretical Model
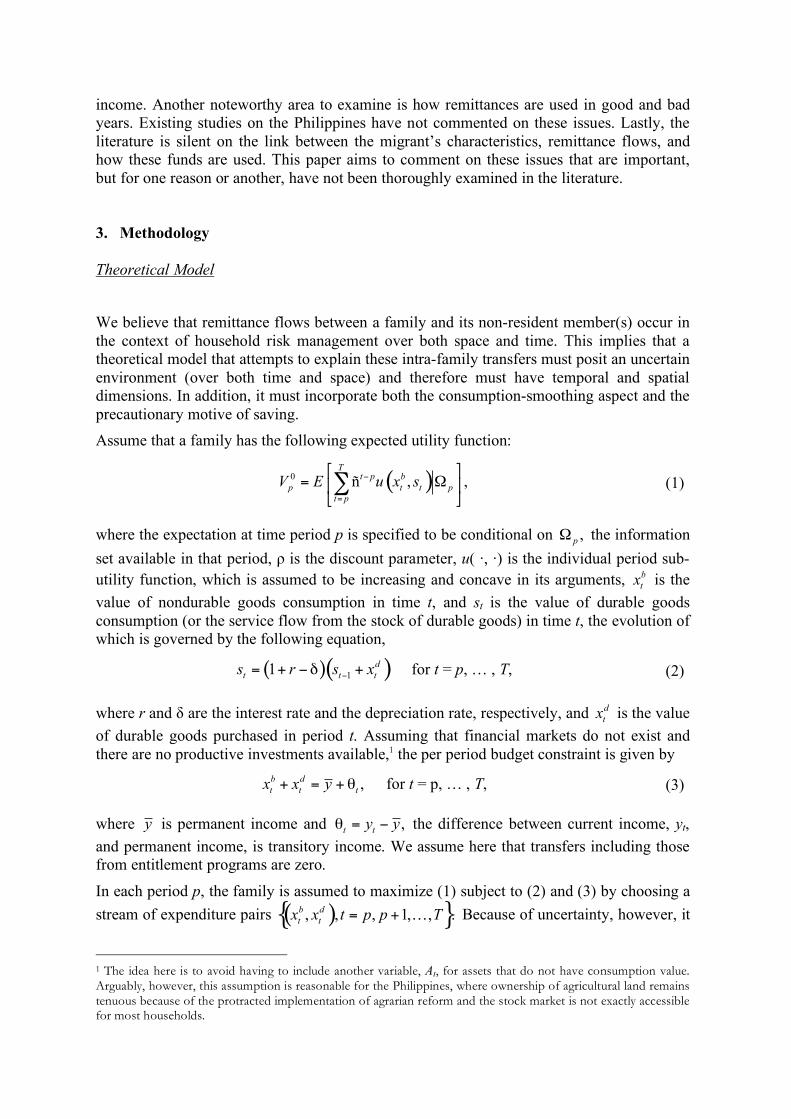
We believe that remittance flows between a family and its non-resident member(s) occur in the context of household risk management over both space and time. This implies that a theoretical model that attempts to explain these intra-family transfers must posit an uncertain environment (over both time and space) and therefore must have temporal and spatial dimensions. In addition, it must incorporate both the consumption-smoothing aspect and the precautionary motive of saving. Assume that a family has the following expected utility function:
( )0ñ , ,
Tt p b
p t t p
t p
V E u x s!
=
" #= $% &
' () (1)
where the expectation at time period p is specified to be conditional on ,p
! the information set available in that period, ρ is the discount parameter, u( ·, ·) is the individual period sub-utility function, which is assumed to be increasing and concave in its arguments, b
tx is the
value of nondurable goods consumption in time t, and st is the value of durable goods consumption (or the service flow from the stock of durable goods) in time t, the evolution of which is governed by the following equation,
( )( )11
d
t t ts r s x
!= + !" + for t = p, … , T, (2)
where r and δ are the interest rate and the depreciation rate, respectively, and d
tx is the value
of durable goods purchased in period t. Assuming that financial markets do not exist and there are no productive investments available,1 the per period budget constraint is given by
,b d
t t tx x y+ = + ! for t = p, … , T, (3)
where y is permanent income and ,t ty y! = " the difference between current income, yt,
and permanent income, is transitory income. We assume here that transfers including those from entitlement programs are zero.
In each period p, the family is assumed to maximize (1) subject to (2) and (3) by choosing a stream of expenditure pairs ( ){ }, , , 1, , .
b d
t tx x t p p T= + K Because of uncertainty, however, it
1 The idea here is to avoid having to include another variable, At, for assets that do not have consumption value. Arguably, however, this assumption is reasonable for the Philippines, where ownership of agricultural land remains tenuous because of the protracted implementation of agrarian reform and the stock market is not exactly accessible for most households.

will only make final choices for the current period, postponing those for future periods until they arrive, given that the information set can change.
Now suppose that in period 1 the family considers sending its jth member(s)2 to another location. Let its expected utility function now be given by
( ) ( )1 1 1
1 1 1
1 1
ñ , , ñ , ,T T
t b t b
j jt jt j jt jt
t t
V V E u x s E u x s! !! ! !
= =
" #$ % $ %= & &' () * ) *
+ , + ,- ./ / (4)
where V{ · , · } provides a weighting scheme for valuing the expected utility of the family
members who stay at home, ( )1
1
1
ñ , ,T
t b
j jt jt
t
E u x s!! ! !
=
" #$% &
' () and the expected utility of the
migrant member(s), ( )1
1
1
ñ , .T
t b
j jt jt
t
E u x s!
=
" #$% &
' () The household will now maximize (4) subject
to location-specific constraints
( )( )11 ,
d
t t ts r s x
!= + !" +
l l l for t = 1, 2, … , T and ℓ = j, –j, (5)
and
0
b d
jt jt j jt jt jtx x y R C! ! ! ! ! !+ = + " + !
0 ,b d
jt jt j jt jt jtx x y R C+ = + ! + +
for t = 1, 2, … , T, (6a)
(6b)
where 0jtC!
= 0jtC are the one-time migration and settling costs incurred by the family to set
up its jth member(s) in the new location in period t = 1 = t0 and Rjt = –R–jt are net remittances that must sum up to zero in each period.
Assume that the household can undertake the mental exercise of solving the maximization problem involved in each possible configuration of placements of family members (either some family members in one other location or spreading them out in different locations). In period 1, we can think of the family as choosing the placement configuration, consumption patterns, remittance flows, and any set up costs such that
{ }*0 *1 *
1 1 1 1max , ,..., ,
LW V V V= (7)
where *
1
gV is the first-period maximized value of the expected utility function for placement
configuration g subject to the constraints (2) and (3) in the case of *0
1V and constraints (5)
and (6) in the case of the other configurations, and L is the maximum number of possible placement configurations that the household considers. Then in the next and subsequent periods, the family can undertake similar calculations and choose the configuration such that
{ }**0 *1 * *
1max , ,..., , ,
L
t t t t tW V V V V
!= for t = 2, … , T, (8)
2 A more precise description is that j is a subset of family members.

where *
1tV
! = Wt–1 is the configuration chosen in the previous period (that is, the choice of
staying put and not making any locational changes) and **0
tV is the choice of collecting all
family members back together again.3
We assume that this sequential maximization process stays in place for as long as the participation constraints of both migrants and those left behind are satisfied. Suppose in period p Wp is obtained under configuration g. Let the maximized expected utilities of each party be given by
( )1max ñ ,
Tg t b
p j jt jt p
t p
V E u x s!! ! !
=
" #= $% &
' () s.t. (5) and (6a) (9a)
in the case of the family members left behind and
( )1max ñ ,
Tgj t b
p j jt jt p
t p
V E u x s!
=
" #= $% &
' () s.t. (5) and (6b) (9b)
in the case of the family members who migrate. Let the default maximized expected utilities in period p be given by
( )1max ñ ,
Td t b
p j jt jt p
t p
V E u x s!! ! !
=
" #= $% &
' () s.t. (2) and (3) (10a)
in the case of the family members left behind and
( )1max ñ ,
Tj t b
p j jt jt p
t p
V E u x s!
=
" #= $% &
' () s.t. (2) and (3) (10b)
in the case of the family members who migrate. Then both parties will remain connected for as long as g d
p pV V! and .gj j
p pV V! If either constraint is violated, the parties go their separate
ways and no transfers (both ways) transpire henceforth.
To summarize, our model posits that a family maximizing its overall well-being over time diversifies risk by locating one or more of its members in different geographic areas, the income shocks of which are either statistically independent or negatively correlated. Since migration itself is risky, however, the migrant requires set-up costs in the initial period. Consequently, the initial stream of remittances may be viewed as ex post payments of insurance premiums for setting up the migrant and as ex ante payments of insurance premiums for future income shocks to the migrant (which would depend on the job security and opportunities of the migrant, given his or her human capital stock, in the place of destination). Some issues have to be clarified, however. First, what determines remittances in the context of the model? We argue that the stream of remittances is an arrangement between the family and the migrant. Both will continue to participate in the arrangement as long as the net expected benefits are greater than non-participation (i.e., each party going on its own way). 3 **0
tV would be the maximized value of objective function (1) subject to constraints (2) and (3), except that it
would add one time resettling costs to the budget constraint (3) due to the reverse migration.

Factors that enter into consideration are (a) the safety net or insurance that either party provides in case the other falls into hard times, given the uncertain environment of the model (migration being a diversification of spatial risk), (b) expectations of bequests when the family is resource rich, (c) expectations to be taken in and cared for by the family in the migrant’s old age or in case he/she gets sick. Thus, remittances are explained by the characteristics and conditions of the migrant worker and his or her calculations of the expected future benefits. When a migrant is able to settle (in terms of legal status) and integrate well in his/her new destination (in terms of job tenure and social networks), and when he/she is able to form her a new nuclear family unit, when she has access to safety nets and insurance mechanisms, the less likely is he/she going to honor the arrangements. If he/she is more alienated, if his/her job has a specified duration, if his/her legal status is questionable, if he/she has no social networks, if he/she does not intend to settle in the new place, he/she is unlikely to break her bonds with her family back home. These are indicated by the migrant’s civil status, occupation, length of stay abroad, type of contract (permanent or temporary), which are contained in the Survey on Overseas Filipinos (SOF). To illustrate, Table 7 contains information on total and average remittances sent by migrants classified by occupation in 2004. Altruism may also play a role in the flow of remittances. This is indicated, for example, by the number of dependents in the migrant’s household (i.e., children and elderly) which can be obtained from the Family Income and Expenditures Survey (FIES).
Second, how will remittances be spent? This depends on both the family and the migrant, and how they treat the funds. If remittances are treated as transitory income, it is likely that flows will be used for housing, housing repairs, or accumulating durables. If these monies are treated as permanent income, they will be mainly be used for basic consumption (e.g., food expenditure). The treatment of remittances, it turn, might depend on the migrant’s characteristics. For instance, Villamil (1998) finds that, in the Philippines, female migrants are more likely to send remittances over the long term. Male migrants, once married and constituted with their own households, stop remitting. Thus, remittances from female migrants might be used for basic consumption, while income streams from male migrants might be used to finance durable goods accumulation or housing. Utilization also depends on economic conditions. In a bad year, remittances might be used to shore up basic consumption, while in a good year, they might be used for durable goods accumulation. In a nutshell, remittances affect consumption patterns in two ways: by augmenting basic consumption like food expenditures (if the amount received is considered part of permanent income, which must be allocated over the rest of the lifecycle of the household) or by financing the purchase of durable goods and housing (if amount received is considered transitory). In the latter case, remittances received are likely to be used for durable goods consumption in part as a store of value to provide the household with a mechanism to cope ex post with a negative income shock. Empirical Model From the theoretical model, we obtain in each period t the (optimal) location of each family member and, for the subset of members living together in a particular area, the demand functions for basic and durable goods and a net remittance function. Focusing only on the subset of members left behind in the place of origin (in anticipation of the fact that the data source does not have information on migrants, except possibly for their characteristics) and assuming that information on prices are not available, we can specify Engel equations for basic, durable, and other goods conditional on whether or not remittances are positive. In

other words, for a sample of households we may specify the following empirical model: Let net remittances be explained by
* ( , , ) ,i i i i iR g u= +m h z (1)
where mi is a vector of characteristics of the migrant member of the ith family in the sample, hi is a vector of household characteristics, zi is a set of other variables (e.g., the economic conditions in the migrant’s location), and ui is a random disturbance term. *
,iR however, is a
latent variable; in lieu of *,iR what is observed is
* if ( , , ) >0
0 otherwise.
i i i i i
i
R g uR
! += "#
m h z (2)
Moreover, if Ri > 0, the following equations are observed as well:
1 1 1
( , )
( , )
( , )
( , )
( , , ) .
b b b
i i i i i
d d d
i i i i i
i i i i i
I I I
i i i i i
i i i i i
x x X
x x X
x x X
x x X
R g u
= + !
= + !
= + !
= + !
= +
h
h
h
h
m h z
M (3)
But if Ri = 0, we observe
0 0
0 0
1 1 1
0 0
0 0
( , )
( , )
( , )
( , ) ,
b b b
i i i i i
d d d
i i i i i
i i i i i
I I I
i i i i i
x x X
x x X
x x X
x x X
= + !
= + !
= + !
= + !
h
h
h
h
M
(4)
where Xi is total expenditures and hi is a set of household characteristics. In principle, estimation of these two sets of equation systems can be done using the method of maximum likelihood.
Following Deaton and Case (1987) and Alba (1998/99), we can use the Working-Leser specification of the Engel equations and impose cross-equation restrictions on the parameters to ensure that the estimated values conform with consumer theory. The parameter estimates will allow us to calculate expenditure elasticities and to determine which expenditure categories are necessities (which are likely to be supported by remittances during downturns). In particular, we can verify whether xb is indeed a necessity and which categories are luxuries. To determine how consumption patterns change between good and bad years, we will estimate the system of Engel equations using 2000 and 2003 FIES data.4 By comparing the estimated results for remittance-receiving and non-receiving households in both years, we 4 We consider 2000 to be a bad year, with the economy still reeling from the real sector effects of the 1997 Asian financial crisis and the El Nino drought episodes, and 2003 to be a relatively normal year.

should be able to explore how the incidence of receiving remittances as well as the amount received affect expenditure elasticities during an economic downturn. (Our hypothesis is that, for remittance-receiving households, the elasticity of food consumption will not be statistically different in both years.) In addition, we should be able to determine whether remittance-receiving households are more likely to accumulate durable goods during normal times, either because they act as stores of value that insulates the household from economic shocks or because they are nest eggs that the migrant worker can draw on when he/she retires.
In each year, we may also classify remittance-receiving and non-receiving households by poverty status and compare the Engel curves for the four types of households. Undertaking conterfactual simulations, we should be able make welfare comparisons of these household types using different measures of welfare (e.g., xb, xd, or X).
4. Data Requirements and Sources This study made use of several household survey data sets to fulfill its objectives. These include the Family Income and Expenditure Survey (FIES), and the Survey of Overseas Filipinos (SOF). The National Statistics Office (NSO) of the Philippines conducts all three surveys. Our model requires information from the merged file of these data sets. FIES is a nationwide survey undertaken every three years as a rider to the LFS. It gathers information on family income and living expenditures. Data collected in the FIES include sources of income (including assistance received abroad) in cash and in kind and the level of consumption by item of expenditure. Information such as family size, number of family members employed for pay or profit (wage/salary or own-account worker), employment status, occupation, age and educational attainment of household head, and housing characteristics are also part of the survey. It provides estimates on income distribution, levels of living and spending patterns, degree of inequality among families, and poverty threshold and incidence for the country. Households in the sample undergo two rounds of interview: one in January and another one in July. The reference period for income is the six months preceding the interview, while for food items the reference period is the average weekly consumption. On the other hand, the reference period for expenditures on fuel, light, and water, transportation, and communication, and household operations and personal care and effects is the past month (in some cases average for the month). The SOF is a rider survey to the October round of the Labor Force Survey conducted annually. It is a rich source of information on overseas workers such as data on the socio-economic characteristics of overseas workers. SOF obtains their overseas locations, their length of stay overseas, and provides estimates on the amount of cash and in kind transfers received by the families and the mode of remittance from a probability sample of about 41, 000 households. The survey covers information on OFWs who left the country during the period of April 1 to September 30. At the same time, data on remittances are culled only for the past six months. The merged file of the two surveys yields information on household income and expenditure, employment, hours worked, wages, migrant family members (if one or some of the household members are migrant workers), and remittances. However, there are some issues arising from merging the data sets. The first is the difference in reference periods. Income in the FIES is collected from January to June and July to December, but remittance

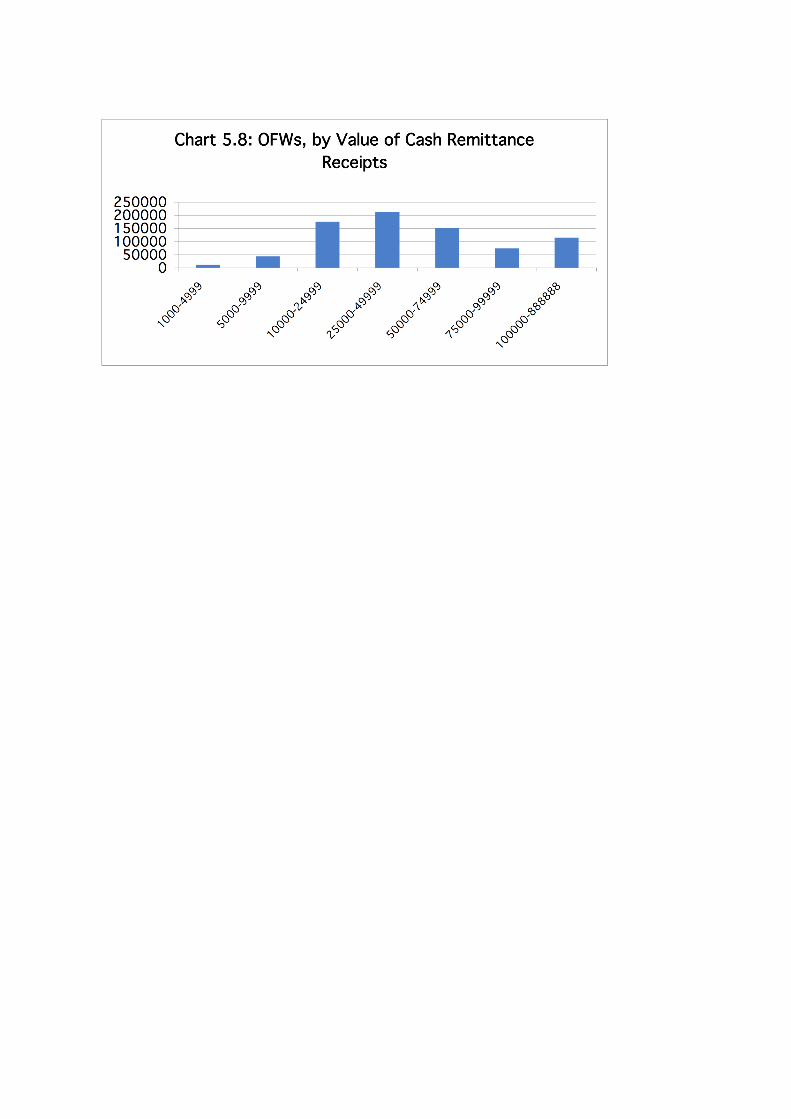
data from the SOF if for the period of April to September. Also, the sample size of households with migrant workers and remittances maybe small because the SOF is a rider survey of the LFS, and the latter is not primarily designed to collect information on migrants and their families. Hence, it is not expected that all 41,000 sample-households have a migrant worker and receive remittance income. 5. Results In 2003, as Table 5.1 illustrates, more than 1.1 million Filipinos were working abroad. Most of these workers were from the National Capital Region (NCR) and the surrounding provinces of Calabarzon—these two regions accounted for 36.2 percent of total OFWs during the said year. Central Luzon and Western Visayas come next in the list contributing 12.1 and 10.2 percent each to the total. Average income in these regions except in Western Visayas was higher than the national average in 2003. For instance, average income in NCR was 239,763 pesos, while national average was only 130,594 pesos. Traditionally poor regions contributed a small number of overseas workers such as Eastern Visayas (1.9 percent) and the Autonomous Region of Mindanao (1.4 percent). Household heads made up 10 percent of the OFWs as indicated in Table 5.2. Meanwhile, wives or spouses composed 34 percent of those working abroad. Sons or daughters accounted for 38 percent of OFWs, the most numerous in the category. Women overseas workers narrowly outnumber men as shown in Table 5.3. Women workers abroad narrowly outnumber males as Chart 5.1 shows. In the NCR and Calabarzon, most OFWs are male, while those workers who hail from CAR, Ilocos, Cagayan Valley, and most of Mindanao are mostly women. As Chart 5.2 indicate, majority of OFWs belong to the age brackets 25-29 and 30-34. Individuals age 35 to 44 years old account for 27.7 percent of the OFWs. This is as may be expected. Young people who have completed their schooling decisions are more likely to work overseas possibly due to several reasons: First, they have a long working life ahead of them, which means that they have a long period to recover the costs of migration. Second, the costs of migration may be lower for them (to the extent that they have not accumulated illiquid assets, pensions, specific job skills or experiences that may not be useful abroad). Overseas workers are preponderantly well educated. Most are college graduates as shown in Chart 5.3. About 35 percent have college degrees, while another 24 percent have at least some college education. ). The occupational category with the highest number of overseas workers is "special occupations," which include the armed forces, nongainful occupations, and occupations n.e.c. As Chart 5.4 shows, most of the OFWs are employed in special occupations. This type of worker account for about 40 percent of those employed abroad. This may indicate that these workers do not have usual occupations in the country because they look at overseas jobs and do not participate in the domestic labor force. Unskilled workers are the next most numerous among the categories. Filipino workers are found in almost all regions in the world as Chart 5.5 illustrates. They tend to be deployed in upper middle-income Middle East countries, high-income non-OECD East Asia and the Pacific. Individuals working in the Middle East account for about 25

percent of the OFWs. Many also work in high-income OECD East Asia and the Pacific as well as high-income OECD Europe, and high-income non-OECD Middle East and high-income non-OECD America. As may be expected many of those who went abroad intended to work as Chart 5.6 shows. Most workers, as indicated by Chart 5.7, have been working for 25 to 60 months (2 to 5 years). Some 786 thousand families received remittances while about 313 thousand families did not receive any remittance from family members abroad. Most workers sent 25,000 to 49,000 pesos as Chart 5.8 illustrates. Most OFWs sent remittances through banks as Table 5.5 shows. Door-to-door service is the next most popular mode of remitting cash. A small percentage of workers abroad sent money through their agency or local office or through friends and co-workers. Households which receive remittances from abroad spent about PhP73,450.24 on food consumption in 2003 as Table 5.6 reflects. This is higher than what households with no remittances and those which received domestic remittances spent during the same year. In this category, those households with domestic remittances had the smallest food consumption at PhP45,477.88. The trend is the same for non-food consumption, shown in Table 5.7, with households receiving international remittances posting the highest expenditure. International remittance-receiving households spent the most across all categories for non-food consumption except for medical care. Notably, households that benefit from international remittances had the highest expenditure for education and recreation. Households that receive remittances from overseas had the highest wages and salary as Table 5.8 indicates. However, these households posted the lowest wages and salary from agriculture activities. 6. Policy Relevance/implication Given the importance of international migration and the remittances that ensue for the domestic economy, the Philippine government constantly faces pressures to formulate and implement policies that affect OFWs and their families. Thus, while Section 2 of Republic Act 8042, otherwise known as the Migrant Workers and Overseas Filipinos Act, stipulates that: “the State does not promote overseas employment as a means to sustain economic growth and achieve national development,” the overall tone of the government toward migration or overseas employment is one of implicit approbation, if not outright encouragement. In fact, President Gloria Macapagal Arroyo announced in a press release in Singapore in 2001 that the Philippine economy would be heavily dependent on overseas workers’ remittances in the foreseeable future. The initial results show which household members are absent, and in the case of the Philippines, these are mostly sons and daughters, followed by spouses. It tells us what social and economic roles are missed if not filled in by other household members One policy implication is that advocates of overseas workers, both in government and civil society, could develop programs to facilitate household coping mechanisms for the social and economic roles left unfulfilled by household members who undertake overseas work. Since the topic is relatively unexplored, the marginal contribution of the findings to the literature and to policy discussion will be potentially large. The lack of information on

migrants and remittances serves as a hindrance to sound policymaking. This paper has the potential to fill that gap. 7. Bibliography
Adams, Richard H. Jr. 2003. “International Migrations, Remittances, and the Brain Drain: A Study of 24 Labor-Exporting Countries.” Policy Research Working Paper, No.3069. World Bank, Washington, DC.
Adams, Richard H. Jr. and John Page. 2003. “International Migration, Remittances, and
Poverty in Developing Countries.” Policy Research Working Paper, No.3179. World Bank, Washington, DC.
Adams, Richard H. Jr. 2005. “Remittances, Household Expenditure, and Investment in
Guatemala.” Policy Research Working Paper, No.3532 World Bank, Washington, DC.
__________________. 1998. “Remittances, Investment, and Rural Asset Accumulation in Pakistan.” Economic Development and Cultural Change ,47(1): 155-173.
__________________. 1991. “The Economic Uses and Impacts of International
Remittances in Rural Egypt.” Economic Development and Cultural Change, 39(4): 695-722.
Amuedo-Dorantes, Catalina and Susan Pozo. 2005. International Remittances and Their
Employment Implications in Receiving Areas. Preliminary Draft (Unpublished). Burgess, Robert and Vikram Haksar. 2005. “Migration and Foreign Remittances in the
Philippines.” IMF Working Paper 05/11. International Monetary Fund. Cabegin, Emily. 2006. “The Effect of Overseas Migration on the Non-Migrant Spouse’s
Market Participation and Labor Supply Behavior.” Prepared for the World Bank/IZA Conference on Employment and Development. May 25, 2006, Berlin, Germany.
Chalamwong, Yongyuth. 2004. “The Migration of Highly Skilled Asian Workers in OECD
Member Countries and Its Effect on Economic Development in East Asia.” Joint MOF-PRI-OECD Project: The Impact and Coherence of OECD Country Policies on Asian Developing Economies. Paper prepared for the Expert’s Seminar, 10-11 June 2004 at OECD Headquarters.
Chami, Ralph, Connel Fullenkamp and Samir Jahjah. 2005. “Are Immigrant Remittance
Flows a Source of Capital for Development?” IMF Working Paper 03/189. International Monetary Fund, Washington, DC.
Conway, Dennis and Jeffrey Cohen. 1998. “Consequences of Migration and Remittances for
Mexican Transnational Communities.” Economic Geopgraphy, 71(1): 26-44. Cox Edwards, Alejandro and M. Ureta. 2003. “International Migration, Remittances and Schooling: Evidence from El Salvador.” Journal of Development Economics, 72(2): 429-61.

De, P. and Ratha D. 2005. “Remittance Income and Household Welfare: Evidence from Sri
Lanka Integrated Household Survey.” Development Research Group, World Bank, Washington, D.C.
Hoddinott, John. 1994. “A Model of Migration and Remittances Applied to Western
Kenya.” Oxford Economic Papers, New Series, 46(3): 459-476. Family Income and Expenditures Survey. Technical Notes. National Statistics Office.
Government of the Philippines. Available on line: www.census.gov.ph. Funkhouser, Edward. 1995. “Remittances form international Migration: A Comparison of El
Salvador and Nicaragua.” The Review of Economics and Statistics, 77(1): 137-146. Labor Force Survey. Technical Notes. National Statistics Office. Government of the
Philippines. Available on line: www.census.gov.ph. Lipton, M. 1980. “Migration from Rural Areas of Poor Countries: The Impact on Rural
Productivity and Income Distribution.” World Development. 8:12. Lucas and Stark. 1985. “Motivations to Remit: Evidence from Botswana.” The Journal of
Political Economy, 93(5): 901-918. Osili, Una Okonkwo. 2006. “Remittances and savings from international migration: Theory
and evidence using a matched sample.” Journal of Development Economics, 2(33): 1-20.
Poirine, B. 1997. “A Theory of Remittances as an Implicit Family Loan Arrangement.” Reichart, J.S. 1981. “The Migrant Syndrome: Seasonal U.S. Wage Labor and Rural
Development in Central Mexico.” Human Organization, 40(1):56-66. Rodriguez, Edgar R. 1996. “International migrants’ remittances in the Philippines.” The
Canadian Journal of Economics, 29: S427-S432. Rodriguez, Edgar R. 1998. “International Migration and Income Distribution in the
Philippines. “ Economic Development and Cultural Change, 46(2):329-350. Rodriguez, Edgar R. and Erwin Tiongson. 2001. “Temporary Migration Overseas and
Household Labor Supply: Evidence from Urban Philippines.” The International Migration Review, 35(3):709-725.
Rubenstein, H. 1983. “Remittances and Rural Development in the English Speaking
Carribean.” Human Organization, 42:295-306. Stark, Oded and Lucas, Robert. 1988. “Migration, Remittances, and the Family.” Economic
Development and Cultural Change, 36(3): 465-481. Survey on Overseas Filipinos. Technical Notes. National Statistics Office. Government of
the Philippines. Available on line: www.census.gov.ph

Taylor, J. Edward and Jorge Mora. 2006. “Does Migration Reshape Expenditures in Rural Households: Evidence from Mexico.” Policy Research Working Paper, No.3842. World Bank, Washington, DC.
Weist, R.E. 1984. “External Dependency and the Perpetuation of Temporary Migration to
the United States.” In Patterns of Undocumented Migration: Mexico and the United States, ed. R.C. Jones, 110-35. Totowa, N.J.: Rowman and Allenhan.
Yang, Dean. 2005. International Migration, Human Capital, and Entrepreneurship: Evidence
from the Philippine Migrant’s Exchange Rate Shocks.” Policy Research Working Paper, No.3578. World Bank, Washington, DC.
Yang, Dean and HwaJung Choi. 2005. “Are Remittances Insurance? Evidence form Rainfall
Shocks in the Philippines.” Ford School of Public Policy Working Paper Series, No.05-004.
Yang, Dean and Claudia A. Martinez. 2005. “Remittances and Poverty in Migrants’ Home
Areas: Evidence from the Philippines.” In International Migration, Remittances and the Brain Drain, ed. Caglar Ozden and Maurice Schiff. World Bank, Washington DC.
8. Tables
Table 1.1 International Migration Growth, by destination Percent change in migrant stock per year
1970-1980 1982-1990 1990-2000 World 2.0 4.4 1.3 High-income countries 2.4 2.9 3.1 Source: United Nations in Global Economic Prospects, 2006.
Table 1.2 International Remittances In Thousand USD Total Growth Rate
2001 6,031,271 0.17 2002 6,886,156 14.20 2003 7,578,458 10.10 2004 8,550,371 12.80 2005 10,689,005 25.00 2006 12,761,308 19.40
Source: Bangko Sentral ng Pilipinas

Region Number Std. Error Deff % Share
National Capital Region 206615 10169.350 1.552 18.16
Ilocos Region 102037 7226.049 ** 1.426 8.97
Cagayan Valley 68164 4663.102 ** 0.861 5.99
Central Luzon 137353 7520.013 ** 1.188 12.07
CALABARZON 206147 11358.730 1.939 18.12
MIMAROPA 13941 1471.112 ** 0.399 1.23
Bicol Region 36271 2694.735 ** 0.525 3.19
Western Visayas 115971 7584.931 ** 1.401 10.19
Central Visayas 60311 4436.407 ** 0.874 5.30
Eastern Visayas 21500 2331.955 ** 0.654 1.89
Western Mindanao 21588 1428.506 ** 0.244 1.90
Northern Mindanao 31439 2638.838 ** 0.578 2.76
Southern Mindanao 30872 2304.173 ** 0.448 2.71
Central Mindanao 34438 3259.895 ** 0.807 3.03
Cordillera Administrative Region 24247 1992.579 ** 0.424 2.13
Autonomous Region of Muslim Mindanao 15890 1277.466 ** 0.264 1.40
Caraga 11194 1570.353 ** 0.564 0.98
Philippines 1,137,977.91 22091.460
* -- significantly different from NCR at level of significance 0.05.
** -- significantly different from NCR at level of significance 0.01.
The null hypothesis that all regions have the same number of overseas workers
is rejected at 0.01 level of significance.
Table 5.1 Overseas Workers, by Region of Origin

Household Designation Number Std. Err Deff % Share
Household Head 118,341 7550.414 1.364 10.40
Spouse 388,853 12028.660 ** 1.434 34.17
Son/Daughter 439,211 14258.430 ** 1.912 38.60
Son-in-law/Daughter-in-law 82,284 6306.279 ** 1.322 7.23
Grandchild 12,409 2879.175 ** 1.713 1.09
Other Relative 94,378 7943.961 * 1.850 8.29
Non-Relative 2,501 1044.380 ** 1.109 0.22
Philippines 1,137,978 22091.460
* -- significantly different from Household head at level of significance 0.05.
** -- significantly different from Houseold head at level of significance 0.01.
Table 5.2 Overseas Workers, by Household Designation

Table 5.3 Relative Distribution of Overseas Workers, by Region and Gender
Population Male Female H0: M = F
Philippines 1137978 0.498941 0.501059
22091.46 0.00948 0.00948
. 1.037879 1.037879
National Capital Region 206615 0.602656 0.397344
10169.35 0.023336 ** 0.023336 ** ‡
1.551503 1.192057 1.192057
Cordillera Administrative Region 24247.44 0.360052 0.639948
1992.579 0.040187 ** 0.040187 ** ‡
0.4244552 0.43116 0.43116
Ilocos 102036.5 0.40171 0.59829
7226.049 0.026863 ** 0.026863 ** ‡
1.426125 0.777205 0.777205
Cagayan Valley 68164.3 0.20467 0.79533
4663.102 0.031622 ** 0.031622 ** ‡
0.860858 1.062293 1.062293
Central Luzon 137352.7 0.522153 0.477847
7520.013 0.027647 0.027647
1.187888 1.067463 1.067463
CALABARZON 206146.9 0.601157 0.398844
11358.73 0.02396 ** 0.02396 ** ‡
1.939064 1.252205 1.252205
MIMAROPA 13941.33 0.41184 0.58816
1471.112 0.062105 0.062105
0.3987068 0.563171 0.563171
Bicol 36271.04 0.562751 0.437249
2694.735 0.045742 0.045742
0.5246299 0.782465 0.782465
Western Visayas 115970.8 0.484257 0.515743
7584.931 0.032243 0.032243
1.401353 1.224652 1.224652
Central Visayas 60311.24 0.579894 0.420106
4436.407 0.043415 0.043415
0.8742322 1.183796 1.183796
Eastern Visayas 21499.65 0.589823 0.410177
2331.955 0.063335 0.063335
0.6540418 0.904366 0.904366
Western Mindanao 21587.78 0.344976 0.655024
1428.506 0.053206 0.053206
0.2444483 0.686109 0.686109
Northern Mindanao 31438.65 0.552304 0.447696
2638.838 0.047679 0.047679
0.5778853 0.73329 0.73329
Southern Mindanao 30872.09 0.286141 0.713859
2304.173 0.041815 ** 0.041815 ** ‡
0.4484581 0.670427 0.670427
Central Mindanao 34437.97 0.296287 0.703713
3259.895 0.070504 ** 0.070504 ** ‡
0.8072878 2.082875 2.082875
Autonomous Region of Muslim Mindanao 15890.42 0.271899 0.728101
1277.466 0.049849 ** 0.049849 ** ‡
0.2642307 0.506008 0.506008
Caraga 11194.1 0.519251 0.480749
1570.353 0.074593 0.074593
0.564432 0.632995 0.632995

Type of FamilyNumber Std. Err Deff
Family receive remittance786,575 17613.380 ** 3.240
Family did not receive remittance313,351 13382.660 2.001
Philippines 1,099,926
* -- significantly different from Families that did not receive remittance at level of significance 0.05.
** -- significantly different from Families that did not receive remittance at level of significance 0.01.
Table 5.4: Families Receiving Remittance
Mode of sending Number Std. Err Deff % Share
Bank 568,003 14322.790 3.290 72.21
Agency/Local Office17,999 2855.994 ** 1.174 2.29
Friends/Co-Workers13,783 2413.606 ** 1.089 1.75
Door-to-Door 182,255 9088.686 ** 1.493 23.17
Others 4,536 1330.746 ** 0.994 0.58
Philippines 786,575
* -- significantly different from Bank at level of significance 0.05.
** -- significantly different from Bank at level of significance 0.01.
Table 5.5 Overseas Workers, by Mode of sending

Table 5.6: Mean food consumption expenditures by type of household, 2003
Estimate Std. Err. Deff
Food
HH with no remittances 50808.81 396.75 50030.55 51587.07 2.53
HH with remittances from domestic sources 45447.81 386.77 44689.13 46206.49 2.84
HH with remittances from abroad 73450.24 747.61 71983.75 74916.74 1.75
HH with remittances from domestic sources and abroad 66080.22 871.28 64371.13 67789.31 2.14
Food consumed at home
HH with no remittances 44507.10 319.26 43880.84 45133.36 2.65
HH with remittances from domestic sources 40233.90 297.98 39649.39 40818.41 2.76
HH with remittances from abroad 63164.58 622.05 61944.37 64384.79 1.85
HH with remittances from domestic sources and abroad 57069.63 682.64 55730.57 58408.69 2.07
Cereal and cereal preparation
HH with no remittances 13749.86 71.18 13610.23 13889.49 2.31
HH with remittances from domestic sources 12830.13 66.26 12700.15 12960.12 1.79
HH with remittances from abroad 15363.08 117.65 15132.29 15593.86 1.54
HH with remittances from domestic sources and abroad 14414.89 128.77 14162.30 14667.49 1.59
Roots and tubers
HH with no remittances 707.27 10.90 685.89 728.64 3.00
HH with remittances from domestic sources 600.91 9.86 581.56 620.26 2.70
HH with remittances from abroad 860.53 17.99 825.24 895.82 2.02
HH with remittances from domestic sources and abroad 773.59 19.95 734.45 812.72 2.34
Fruits and vegetables
HH with no remittances 5027.72 51.23 4927.22 5128.21 3.00
HH with remittances from domestic sources 4480.36 50.04 4382.20 4578.52 3.55
HH with remittances from abroad 7476.52 98.48 7283.35 7669.70 1.88
HH with remittances from domestic sources and abroad 6558.21 107.27 6347.78 6768.63 2.26
Meat and meat preparations
HH with no remittances 7521.10 94.72 7335.30 7706.89 2.47
HH with remittances from domestic sources 6380.70 92.53 6199.20 6562.20 2.83
HH with remittances from abroad 13798.63 200.04 13406.24 14191.02 1.85
HH with remittances from domestic sources and abroad 11755.37 210.86 11341.75 12169.00 2.01
Dairy products and eggs
HH with no remittances 3485.76 44.50 3398.47 3573.04 1.74
HH with remittances from domestic sources 3227.06 50.89 3127.24 3326.88 2.31
HH with remittances from abroad 6270.67 114.50 6046.07 6495.27 1.56
HH with remittances from domestic sources and abroad 5910.87 135.96 5644.17 6177.56 1.53
Fish and marine products
HH with no remittances 6679.68 59.46 6563.05 6796.31 3.08
HH with remittances from domestic sources 6023.01 52.22 5920.57 6125.45 2.64
HH with remittances from abroad 8575.42 106.52 8366.47 8784.37 1.83
HH with remittances from domestic sources and abroad 7831.75 115.08 7606.01 8057.49 2.13
Coffee, cocoa and tea
HH with no remittances 1218.98 10.81 1197.78 1240.18 2.26
HH with remittances from domestic sources 1112.79 9.98 1093.20 1132.37 2.25
HH with remittances from abroad 1608.00 19.71 1569.34 1646.67 1.56
HH with remittances from domestic sources and abroad 1511.13 21.94 1468.09 1554.17 1.66
Non-alcoholic beverages
HH with no remittances 1647.36 25.49 1597.35 1697.36 2.76
HH with remittances from domestic sources 1335.53 23.23 1289.97 1381.09 2.86
HH with remittances from abroad 3030.57 64.30 2904.45 3156.70 2.42
HH with remittances from domestic sources and abroad 2533.37 57.51 2420.56 2646.17 2.02
Food not elsewhere classified
HH with no remittances 4469.39 57.93 4355.77 4583.02 2.58
HH with remittances from domestic sources 4243.41 48.40 4148.48 4338.34 2.33
HH with remittances from abroad 6181.16 103.32 5978.49 6383.82 1.79
HH with remittances from domestic sources and abroad 5780.46 96.26 5591.64 5969.29 1.79
Food consumed outside home
HH with no remittances 6301.71 129.08 6048.52 6554.91 2.13
HH with remittances from domestic sources 5213.92 127.45 4963.91 5463.92 2.56
HH with remittances from abroad 10285.66 252.70 9789.97 10781.36 1.86
HH with remittances from domestic sources and abroad 9010.59 286.01 8449.56 9571.61 2.09
95% Conf. Interval
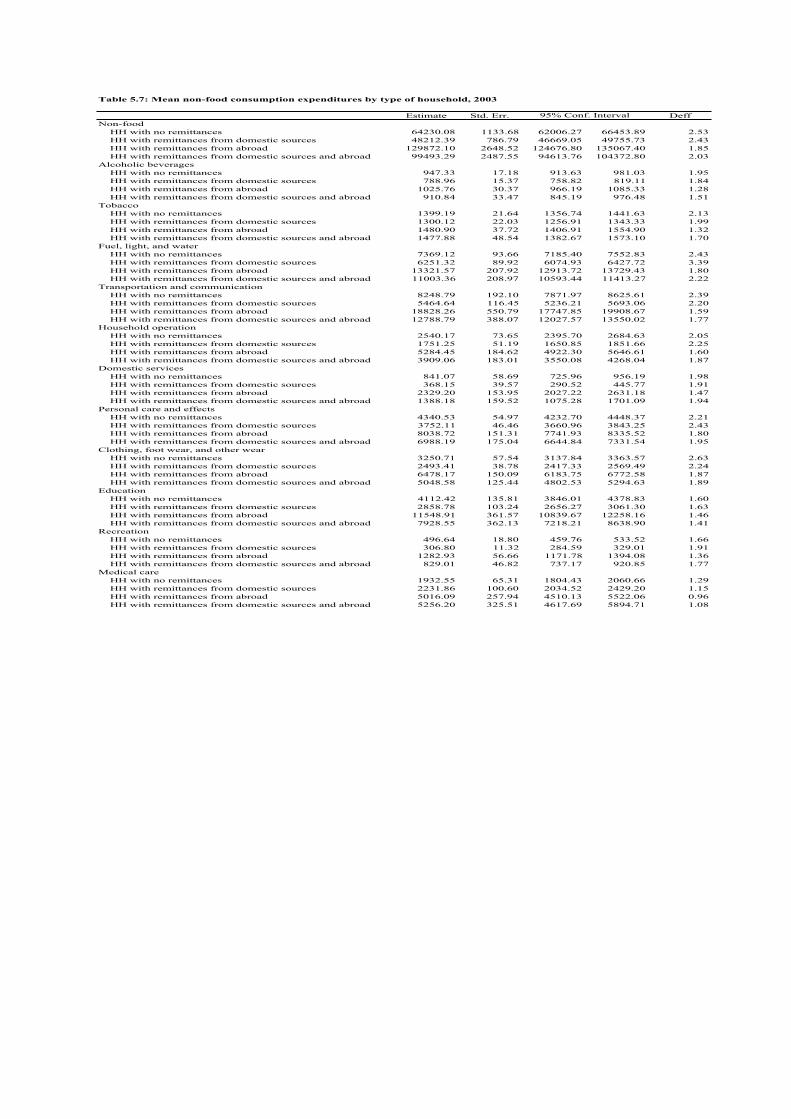
Table 5.7: Mean non-food consumption expenditures by type of household, 2003
Estimate Std. Err. Deff
Non-food
HH with no remittances 64230.08 1133.68 62006.27 66453.89 2.53
HH with remittances from domestic sources 48212.39 786.79 46669.05 49755.73 2.43
HH with remittances from abroad 129872.10 2648.52 124676.80 135067.40 1.85
HH with remittances from domestic sources and abroad 99493.29 2487.55 94613.76 104372.80 2.03
Alcoholic beverages
HH with no remittances 947.33 17.18 913.63 981.03 1.95
HH with remittances from domestic sources 788.96 15.37 758.82 819.11 1.84
HH with remittances from abroad 1025.76 30.37 966.19 1085.33 1.28
HH with remittances from domestic sources and abroad 910.84 33.47 845.19 976.48 1.51
Tobacco
HH with no remittances 1399.19 21.64 1356.74 1441.63 2.13
HH with remittances from domestic sources 1300.12 22.03 1256.91 1343.33 1.99
HH with remittances from abroad 1480.90 37.72 1406.91 1554.90 1.32
HH with remittances from domestic sources and abroad 1477.88 48.54 1382.67 1573.10 1.70
Fuel, light, and water
HH with no remittances 7369.12 93.66 7185.40 7552.83 2.43
HH with remittances from domestic sources 6251.32 89.92 6074.93 6427.72 3.39
HH with remittances from abroad 13321.57 207.92 12913.72 13729.43 1.80
HH with remittances from domestic sources and abroad 11003.36 208.97 10593.44 11413.27 2.22
Transportation and communication
HH with no remittances 8248.79 192.10 7871.97 8625.61 2.39
HH with remittances from domestic sources 5464.64 116.45 5236.21 5693.06 2.20
HH with remittances from abroad 18828.26 550.79 17747.85 19908.67 1.59
HH with remittances from domestic sources and abroad 12788.79 388.07 12027.57 13550.02 1.77
Household operation
HH with no remittances 2540.17 73.65 2395.70 2684.63 2.05
HH with remittances from domestic sources 1751.25 51.19 1650.85 1851.66 2.25
HH with remittances from abroad 5284.45 184.62 4922.30 5646.61 1.60
HH with remittances from domestic sources and abroad 3909.06 183.01 3550.08 4268.04 1.87
Domestic services
HH with no remittances 841.07 58.69 725.96 956.19 1.98
HH with remittances from domestic sources 368.15 39.57 290.52 445.77 1.91
HH with remittances from abroad 2329.20 153.95 2027.22 2631.18 1.47
HH with remittances from domestic sources and abroad 1388.18 159.52 1075.28 1701.09 1.94
Personal care and effects
HH with no remittances 4340.53 54.97 4232.70 4448.37 2.21
HH with remittances from domestic sources 3752.11 46.46 3660.96 3843.25 2.43
HH with remittances from abroad 8038.72 151.31 7741.93 8335.52 1.80
HH with remittances from domestic sources and abroad 6988.19 175.04 6644.84 7331.54 1.95
Clothing, foot wear, and other wear
HH with no remittances 3250.71 57.54 3137.84 3363.57 2.63
HH with remittances from domestic sources 2493.41 38.78 2417.33 2569.49 2.24
HH with remittances from abroad 6478.17 150.09 6183.75 6772.58 1.87
HH with remittances from domestic sources and abroad 5048.58 125.44 4802.53 5294.63 1.89
Education
HH with no remittances 4112.42 135.81 3846.01 4378.83 1.60
HH with remittances from domestic sources 2858.78 103.24 2656.27 3061.30 1.63
HH with remittances from abroad 11548.91 361.57 10839.67 12258.16 1.46
HH with remittances from domestic sources and abroad 7928.55 362.13 7218.21 8638.90 1.41
Recreation
HH with no remittances 496.64 18.80 459.76 533.52 1.66
HH with remittances from domestic sources 306.80 11.32 284.59 329.01 1.91
HH with remittances from abroad 1282.93 56.66 1171.78 1394.08 1.36
HH with remittances from domestic sources and abroad 829.01 46.82 737.17 920.85 1.77
Medical care
HH with no remittances 1932.55 65.31 1804.43 2060.66 1.29
HH with remittances from domestic sources 2231.86 100.60 2034.52 2429.20 1.15
HH with remittances from abroad 5016.09 257.94 4510.13 5522.06 0.96
HH with remittances from domestic sources and abroad 5256.20 325.51 4617.69 5894.71 1.08
95% Conf. Interval

9. Charts
Table 5.8: Mean wages and salaries by type of household, 2003
Estimate Std. Err. Deff
Wages and salaries
HH with no remittances 76688.10 1332.19 74074.89 79301.30 2.16
HH with remittances from domestic sources 48615.98 842.06 46964.20 50267.75 2.23
HH with remittances from abroad 80991.01 1981.58 77103.98 84878.05 1.40
HH with remittances from domestic sources and abroad 62468.92 1813.33 58911.92 66025.93 1.59
Wages and salaries from agricultural activities
HH with no remittances 5575.18 258.10 5068.89 6081.48 4.47
HH with remittances from domestic sources 4982.05 156.44 4675.18 5288.93 2.23
HH with remittances from abroad 2109.61 191.94 1733.11 2486.10 1.44
HH with remittances from domestic sources and abroad 2145.33 202.40 1748.32 2542.35 1.43
Wages and salaries from non-agricultural activities
HH with no remittances 71112.91 1352.30 68460.26 73765.57 2.18
HH with remittances from domestic sources 43633.92 869.75 41927.83 45340.02 2.30
HH with remittances from abroad 78881.40 1994.63 74968.78 82794.03 1.41
HH with remittances from domestic sources and abroad 60323.59 1824.93 56743.85 63903.33 1.60
95% Conf. Interval